
Detection and Monitoring of Pitting Progression on Gear Tooth Flank Using Deep Learning

 , ,
, ,
Abstract
:1. Introduction
1.1. Gear Failure
1.2. Contributions
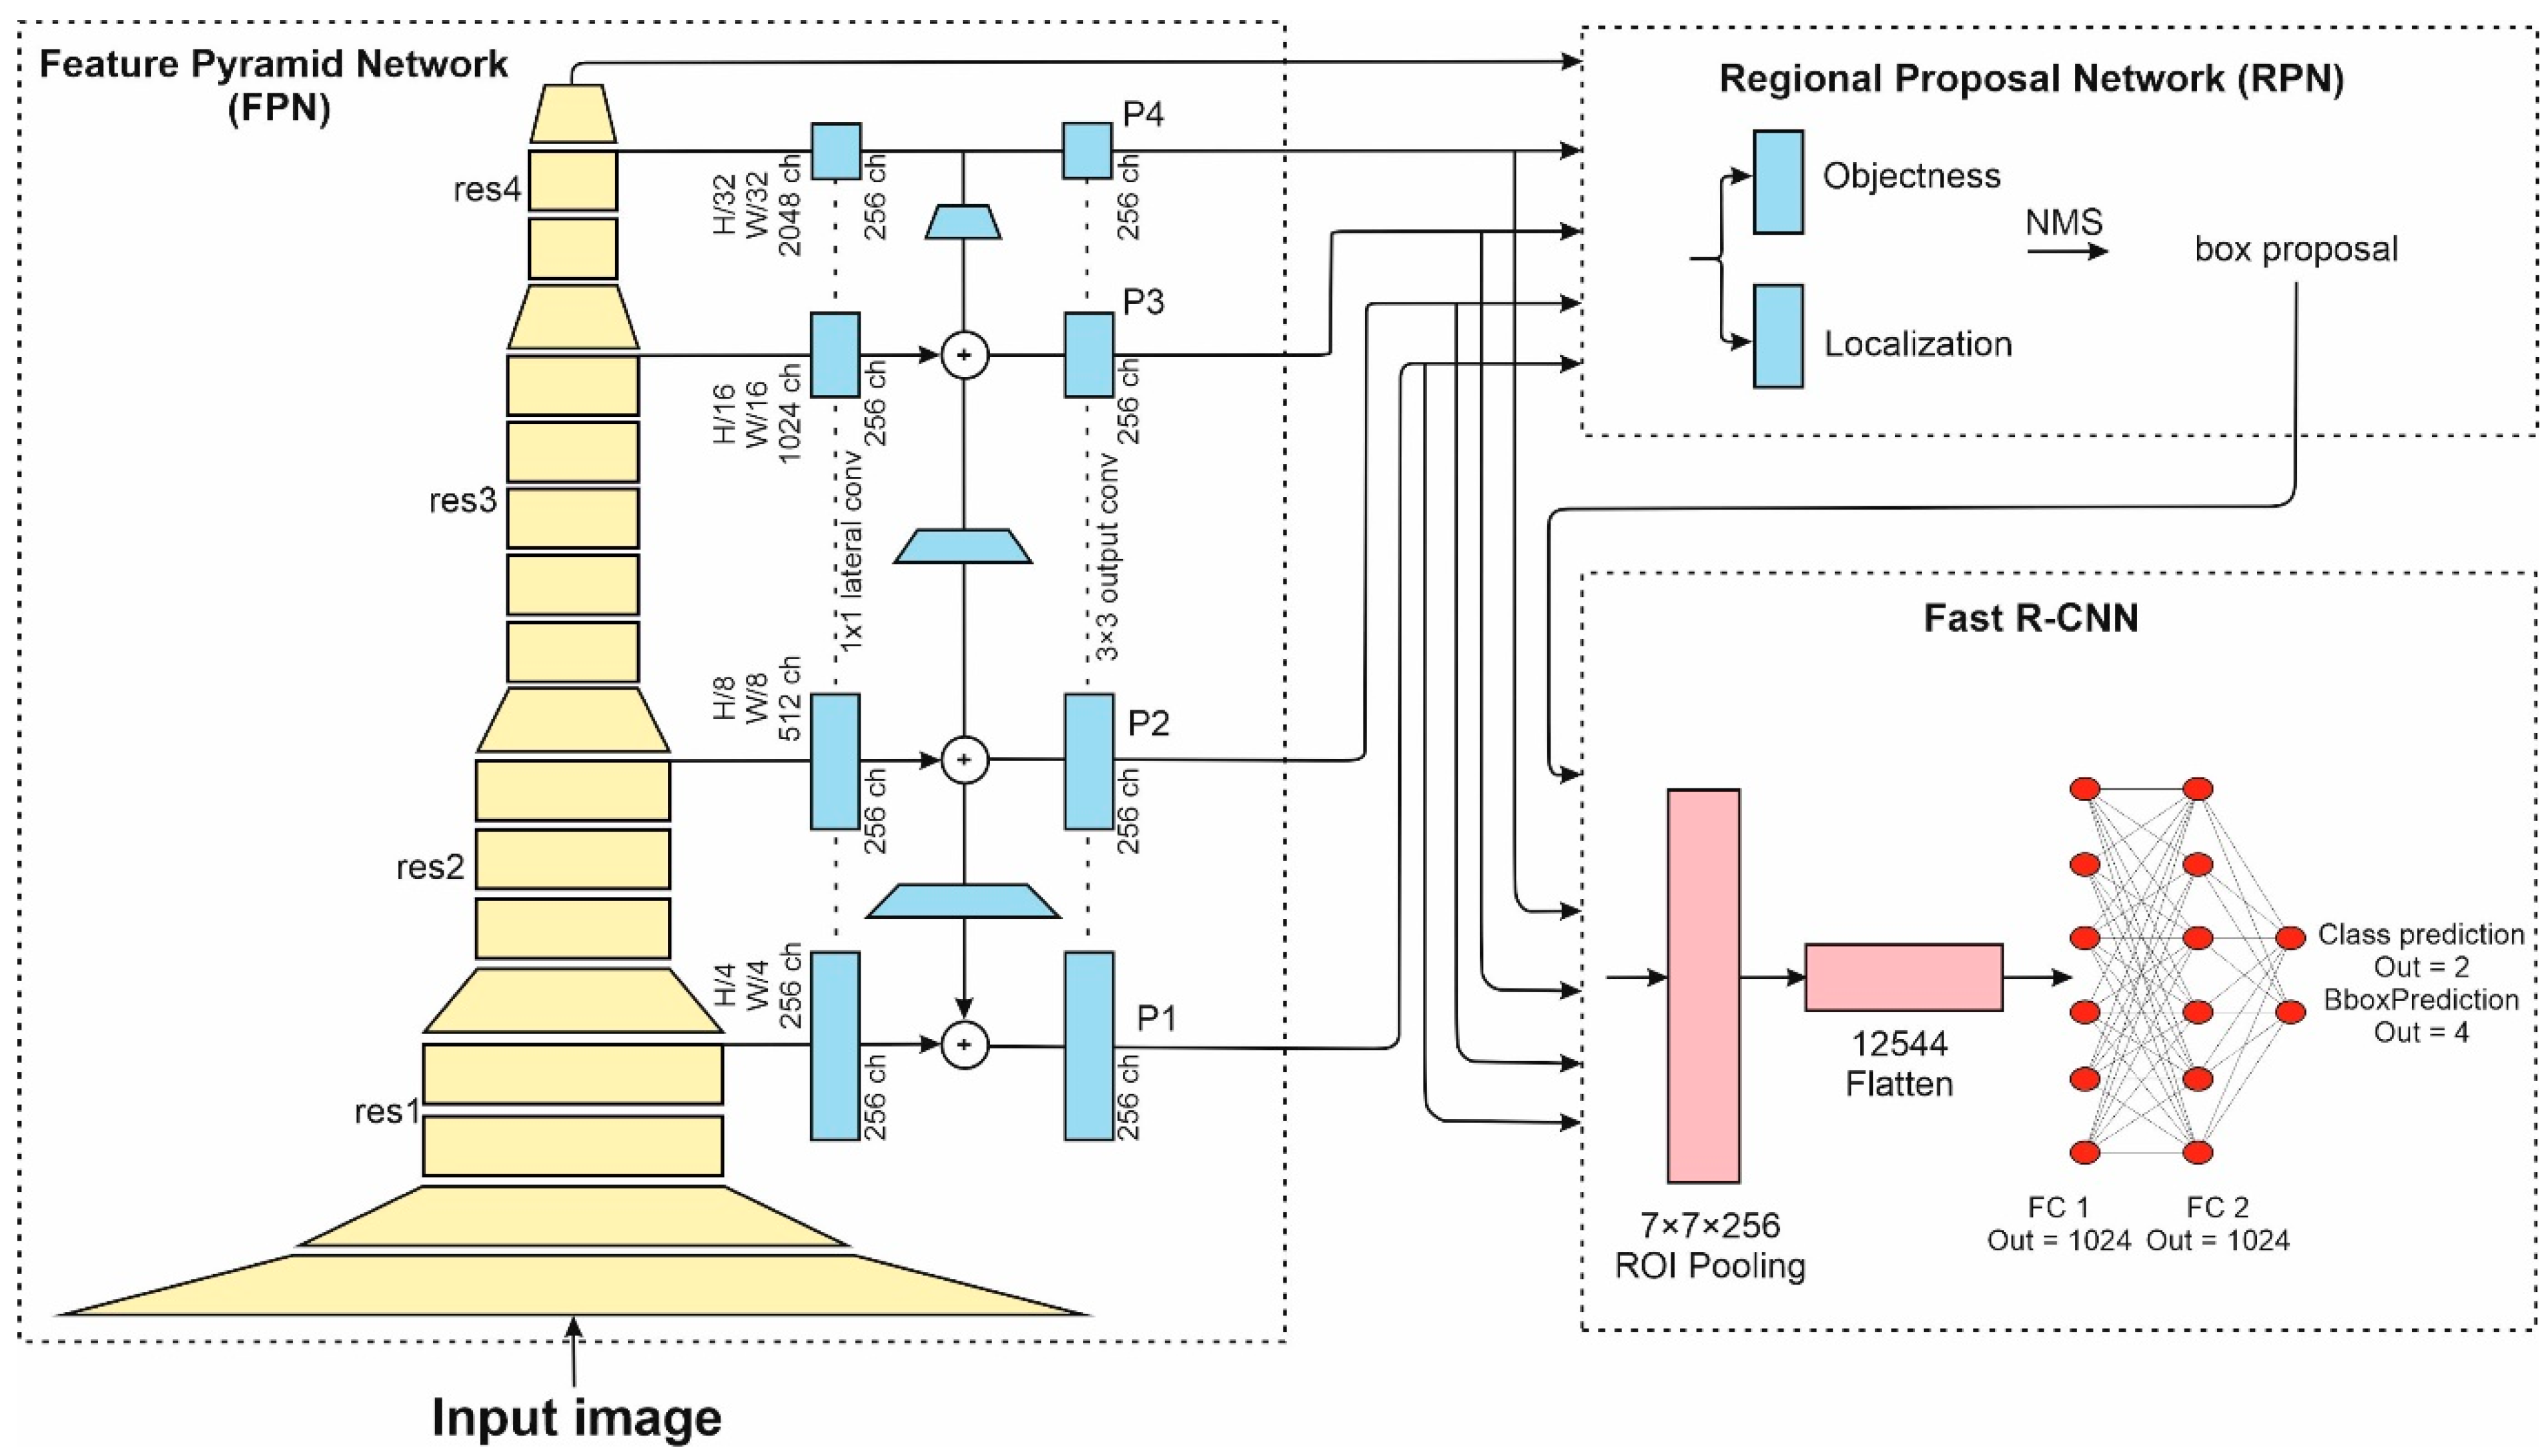
2. Method Description
3. Data Collection
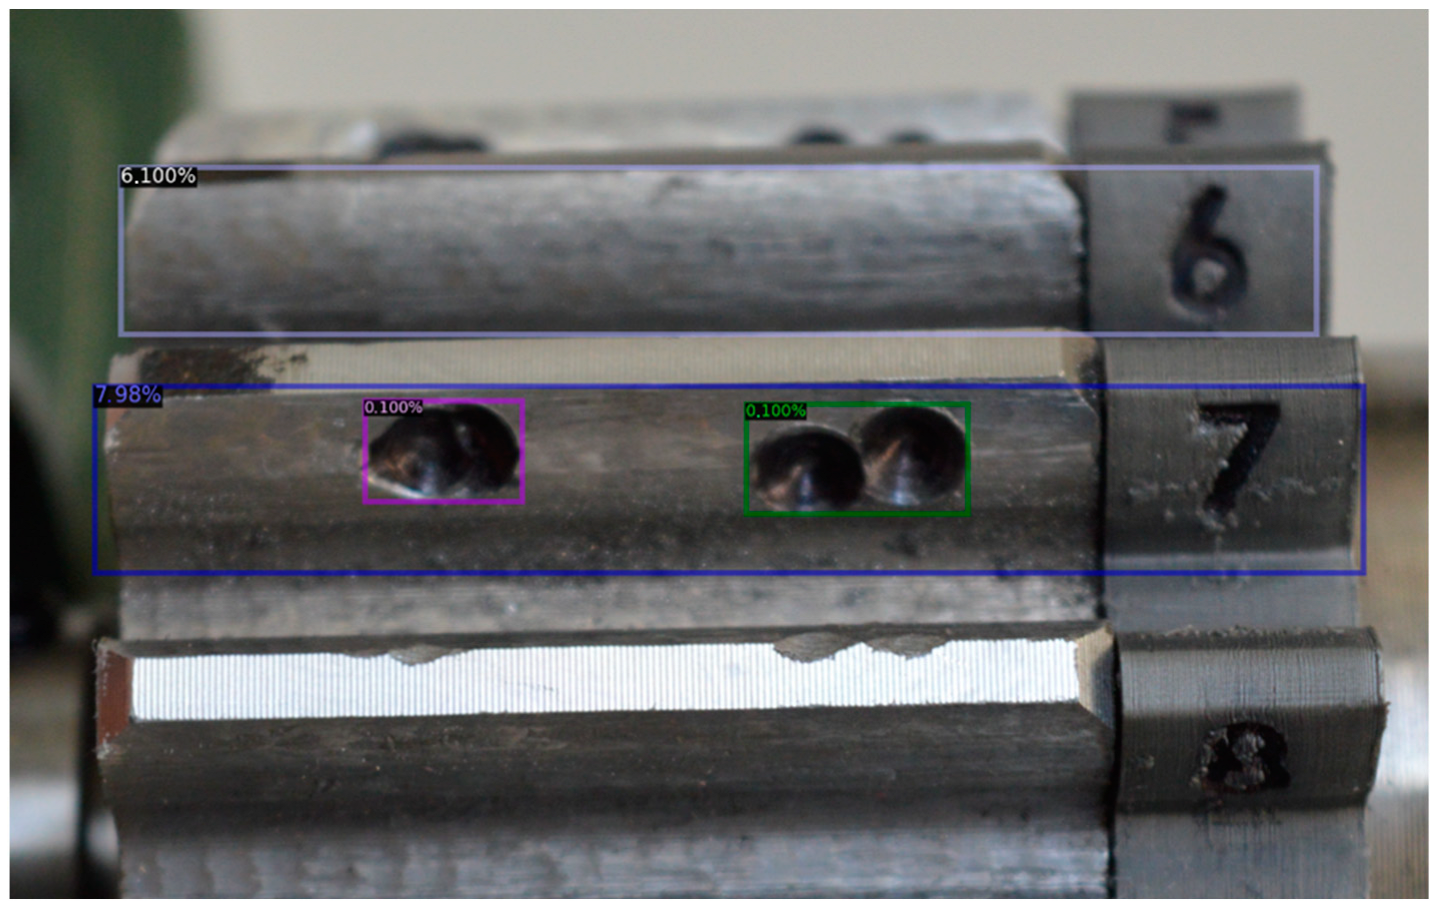
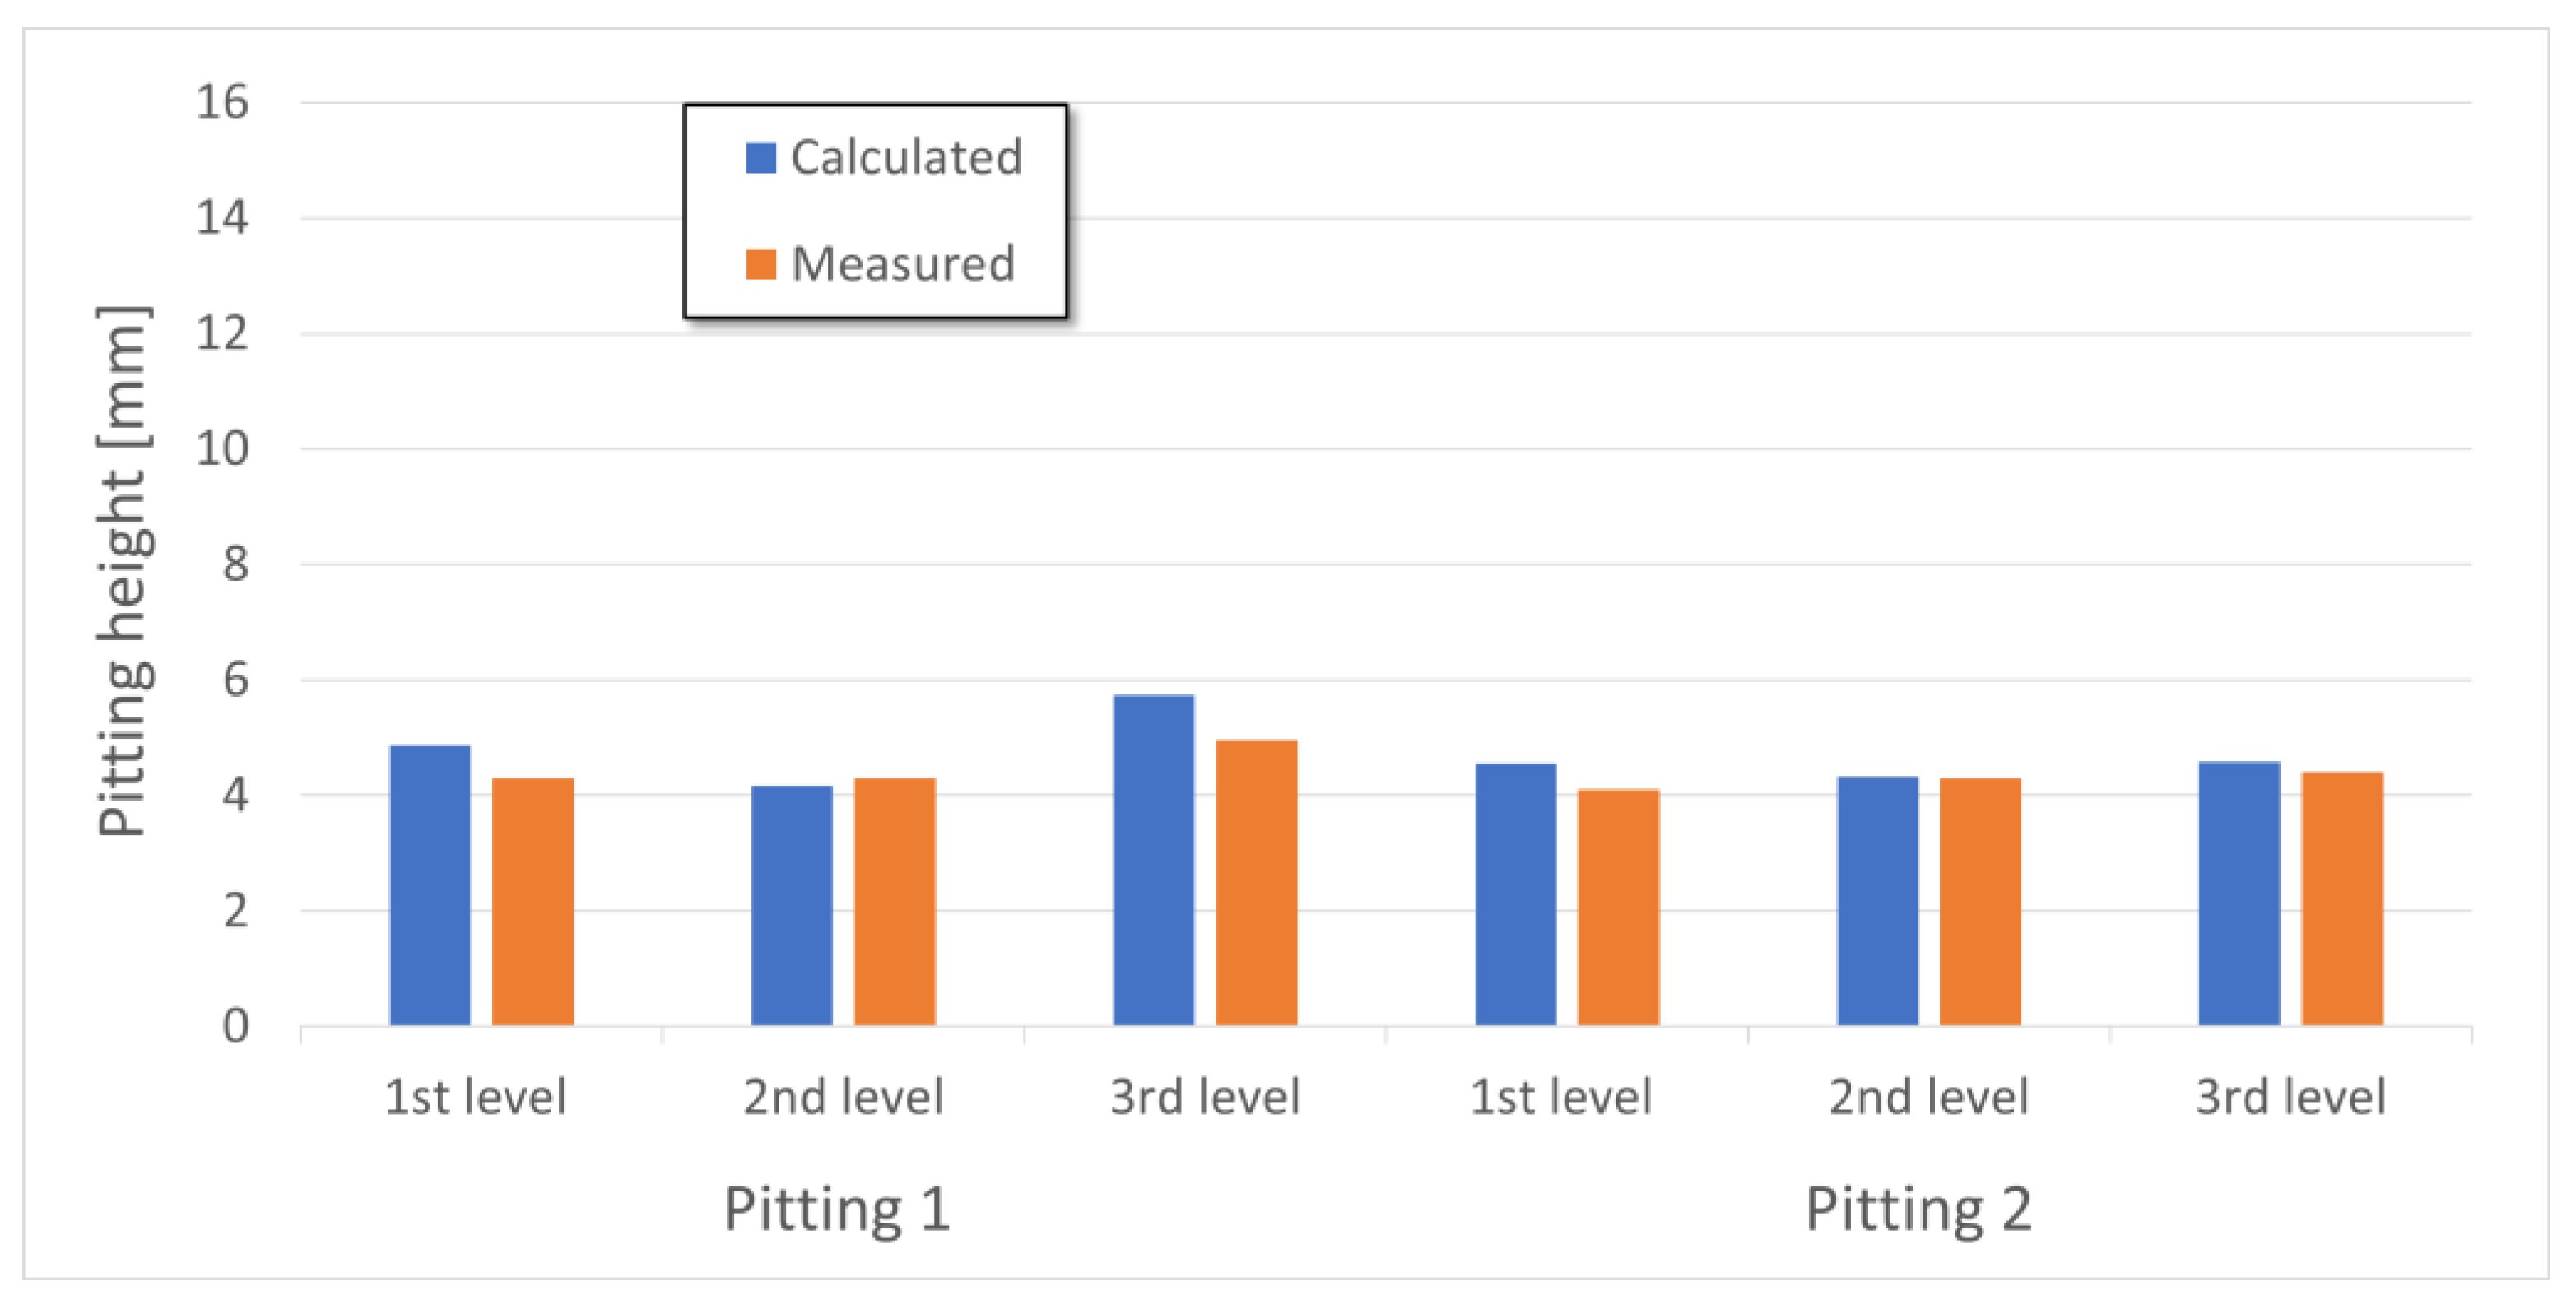
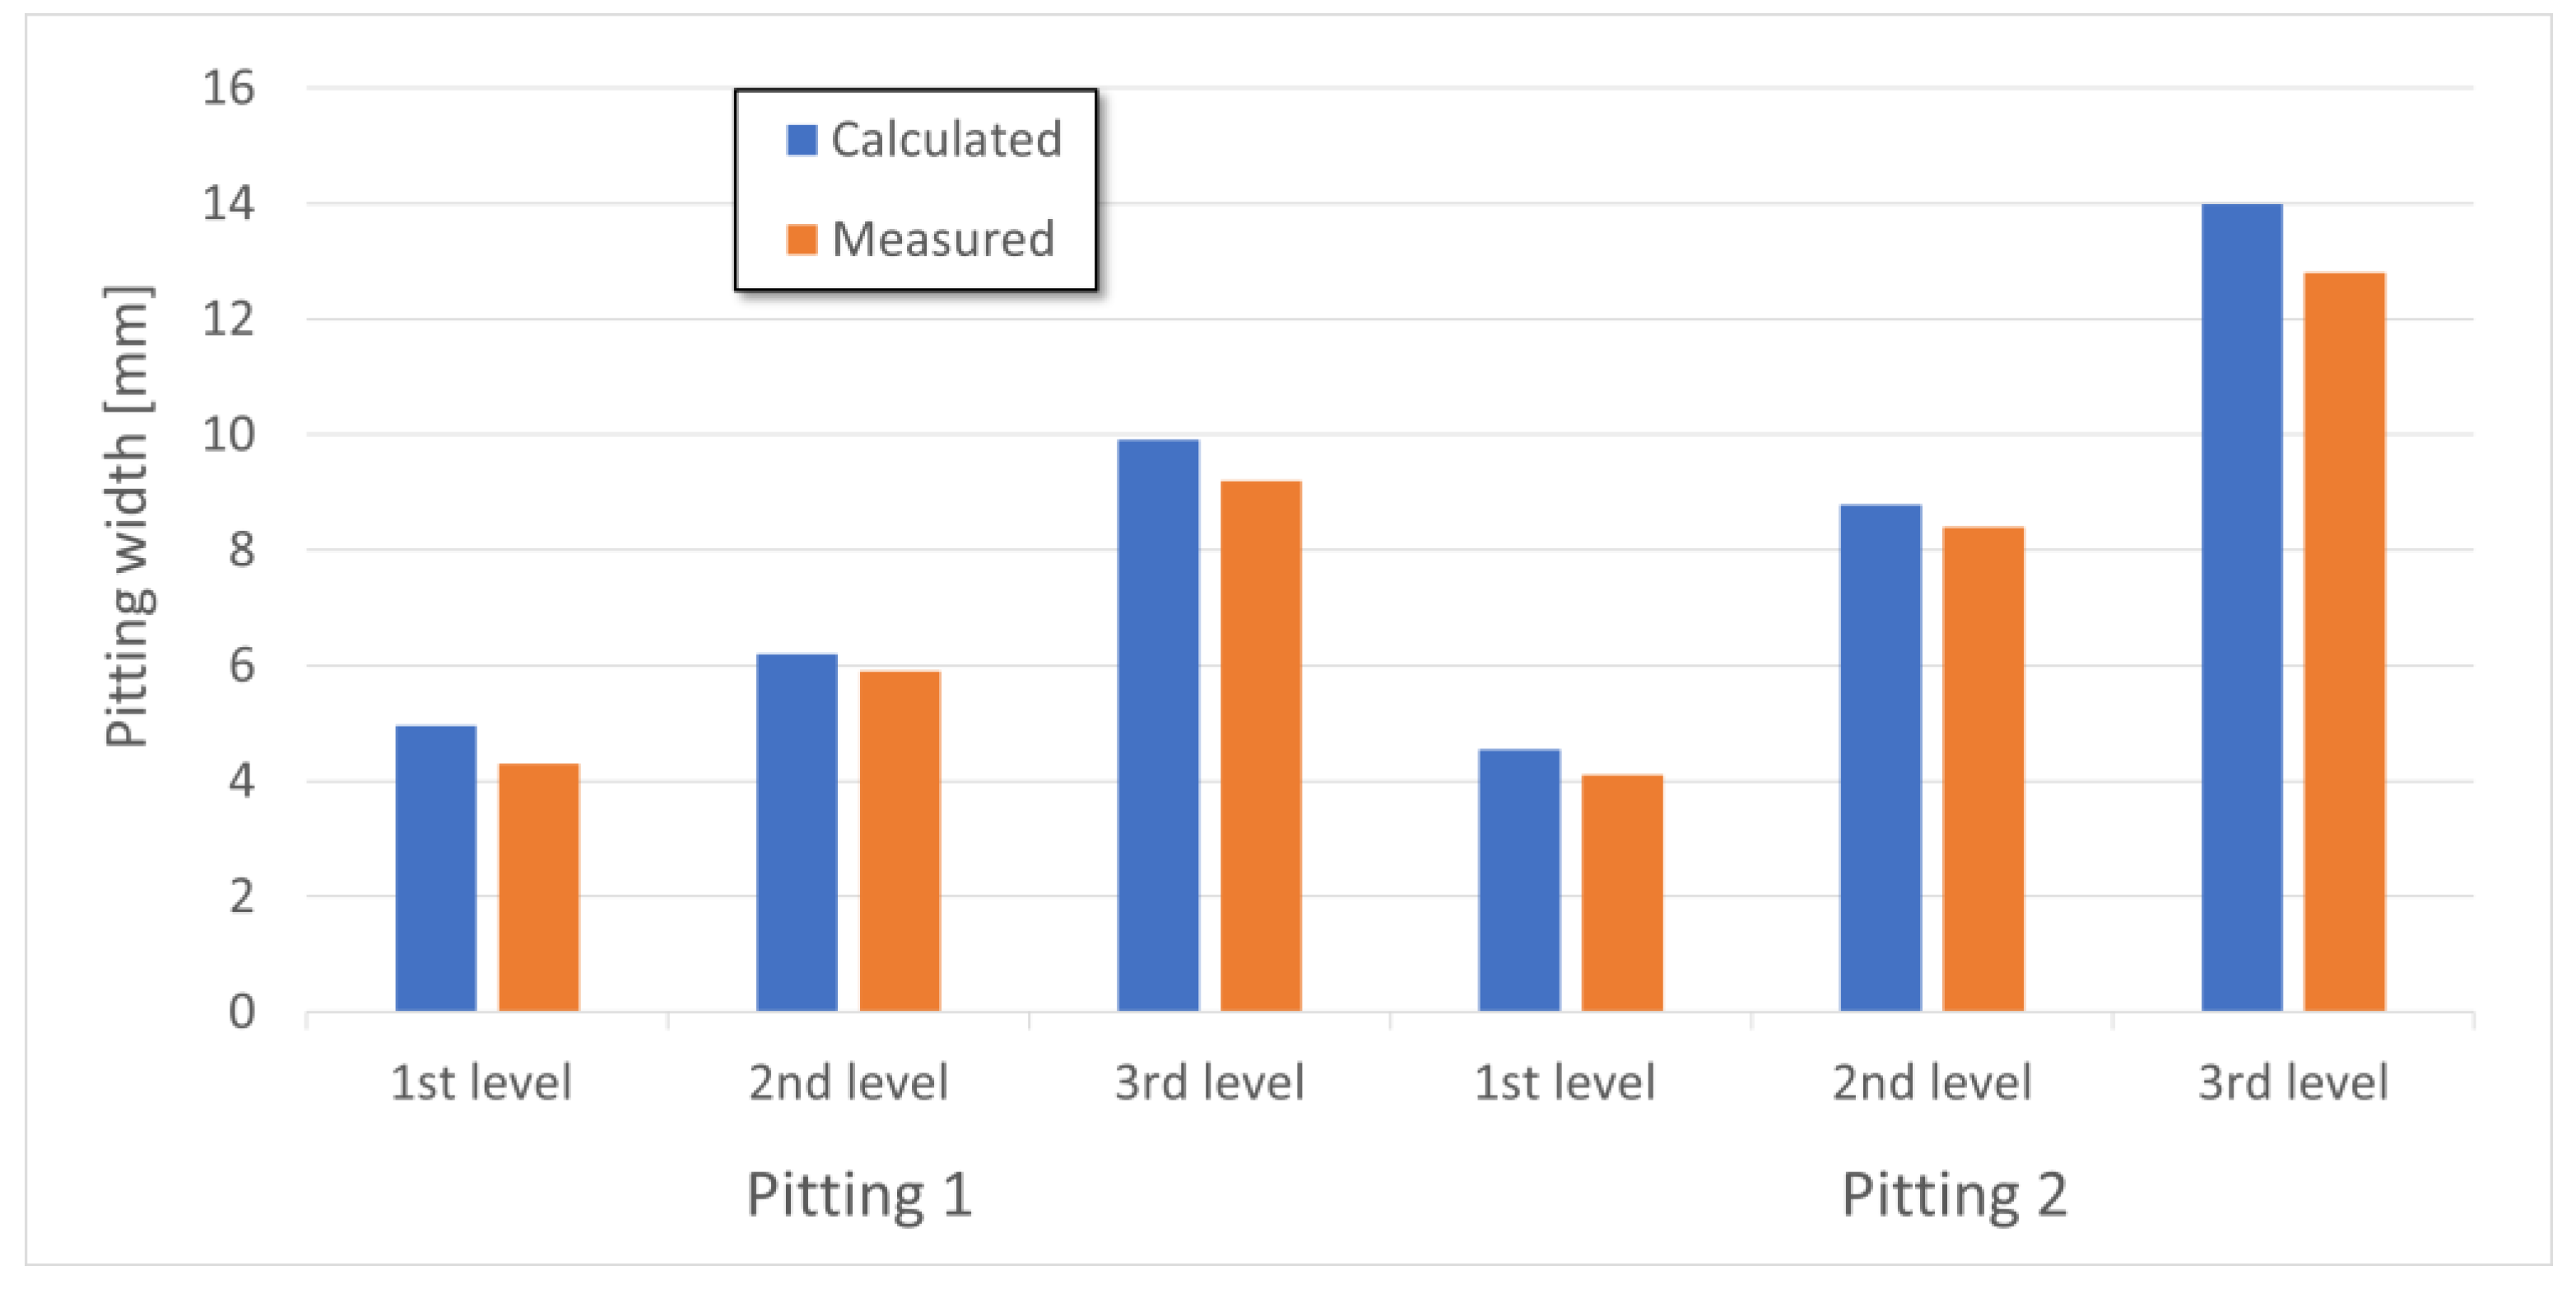
4. Validation
5. Conclusions
Author Contributions
Funding
Institutional Review Board Statement
Informed Consent Statement
Data Availability Statement
Conflicts of Interest
References
- Moru, D.K.; Borro, D. A machine vision algorithm for quality control inspection of gears. Int. J. Adv. Manuf. Technol. 2020, 106, 105–123. [Google Scholar] [CrossRef]
- Pavlovic, A.; Fragassa, C. Geometry optimization by FEM simulation of the automatic changing gear. Rep. Mech. Eng. 2020, 1, 199–205. [Google Scholar] [CrossRef]
- Troha, S.; Vrcan, Ž.; Karaivanov, D.; Isametova, M. The Selection of Optimal Reversible Two-Speed Planetary Gear Trains for Machine Tool Gearboxes. Facta Univ. Ser. Mech. Eng. 2020, 18, 121–134. [Google Scholar] [CrossRef]
- Stefanović-Marinović, J.; Vrcan, Ž.; Troha, S.; Milovančević, M. Optimization of two-speed planetary gearbox with brakes on single shafts. Rep. Mech. Eng. 2022, 3, 94–107. [Google Scholar] [CrossRef]
- Liu, H.; Liu, H.; Zhu, C.; Zhou, Y. A Review on Micropitting Studies of Steel Gears. Coatings 2019, 9, 42. [Google Scholar] [CrossRef] [Green Version]
- Miltenović, A.; Banić, M.; Tanasković, J.; Stefanović-Marinović, J.; Rangelov, D.; Perić, M. Wear load capacity of crossed helical gears. Facta Univ. Ser. Mech. Eng. 2022. online first. [Google Scholar] [CrossRef]
- Trobentar, B.; Kulovec, S.; Hlebanja, G.; Glodež, S. Experimental failure analysis of S-polymer gears. Eng. Fail. Anal. 2020, 111, 104496. [Google Scholar] [CrossRef]
- Miltenović, A.; Tica, M.; Banić, M.; Miltenović, Đ. Prediction of Temperature Distribution in the Worm Gear Meshing. Facta Univ. Ser. Mech. Eng. 2020, 18, 329–339. [Google Scholar] [CrossRef]
- Elasha, F.; Ruiz-Cárcel, C.; Mba, D.; Kiat, G.; Nze, I.; Yebra, G. Pitting detection in worm gearboxes with vibration analysis. Eng. Fail. Anal. 2014, 42, 366–376. [Google Scholar] [CrossRef]
- Sarvestani, E.S.; Rezaeizadeh, M.; Jomehzadeh, E.; Bigani, A. Early Detection of Industrial-Scale Gear Tooth Surface Pitting Using Vibration Analysis. J. Fail. Anal. Preven. 2020, 20, 768–788. [Google Scholar] [CrossRef]
- Boyu, Y.; Zhenhui, L.; Shen, T.; Liang, L.; Chao, W. In Situ Monitoring of Pitting Corrosion on Stainless Steel with Digital Holographic Surface Imaging. J. Electrochem. Soc. 2019, 166, C3039–C3047. [Google Scholar]
- Li, J.; Li, X.; He, D.; Qu, Y. A Novel Method for Early Gear Pitting Fault Diagnosis Using Stacked SAE and GBRBM. Sensors 2019, 19, 758. [Google Scholar] [CrossRef] [PubMed] [Green Version]
- Li, X.; Li, J.; Qu, Y.; He, D. Gear Pitting Fault Diagnosis Using Integrated CNN and GRU Network with Both Vibration and Acoustic Emission Signals. Appl. Sci. 2019, 9, 768. [Google Scholar] [CrossRef] [Green Version]
- Qu, Y.; Zhang, Y.; He, M.; He, D.; Jiao, C.; Zhou, Z. Gear pitting fault diagnosis using disentangled features from unsupervised deep learning. Proc. Inst. Mech. Eng. Part O J. Risk Reliab. 2019, 233, 719–730. [Google Scholar] [CrossRef]
- Liang, X.H.; Liu, Z.L.; Pan, J.; Zuo, M.J. Spur Gear Tooth Pitting Propagation Assessment Using Model-based Analysis. Chin. J. Mech. Eng. 2017, 30, 1369–1382. [Google Scholar] [CrossRef] [Green Version]
- Grzeszkowski, M.; Nowoisky, S.; Scholzen, P.; Kappmeyer, G.; Gühmann, C.; Brimmers, J.; Brecher, C. Classification of gear pitting damage using vibration measurements. Tm Tech. Messen. 2021, 88, 282–293. [Google Scholar] [CrossRef]
- Grzeszkowski, M.; Gühmann, C.; Scholzen, P.; Brimmers, J.; Nowoisky, S.; Kappmeyer, G. Experimental Study on the Pitting Detection Capabilities for Spur Gears Using Acoustic Emission and Vibration Analysis Methods. Gear Technol. 2021, 88, 282–293. [Google Scholar] [CrossRef]
- Kopiláková, B.; Bošanský, M.; Zápotočný, J. The Suggestion of the Macrophoto Method for the Evaluation of the Gear Damages by Pitting. Sci. Proc. Fac. Mech. Eng. STU Bratisl. 2012, 20, 93–99. [Google Scholar] [CrossRef] [Green Version]
- Allam, A.; Moussa, M.; Tarry, C.; Veres, M. Detecting Teeth Defects on Automotive Gears Using Deep Learning. Sensors 2021, 21, 8480. [Google Scholar] [CrossRef]
- Wang, Z.; Qin, Y.; Chen, W. Vision measurement of gear pitting based on DCGAN and U-Net. J. Mech. Sci. Technol. 2021, 35, 2771–2779. [Google Scholar] [CrossRef]
- Li, H.; Zeng, C.; Zhao, P.; Qin, Z.; Yang, Y. Real-time detection method of gear contact fatigue pitting based on machine vision. Appl. Opt. 2022, 61, 3609–3618. [Google Scholar] [CrossRef]
- Xi, D.; Qin, Y.; Luo, J.; Pu, H.; Wang, Z. Multipath Fusion Mask R-CNN with Double Attention and Its Application into Gear Pitting Detection. IEEE Trans. Instrum. Meas. 2021, 70, 1–11. [Google Scholar] [CrossRef]
- Xi, D.; Qin, Y.; Wang, Y. Vision Measurement of Gear Pitting Under Different Scenes by Deep Mask R-CNN. Sensors 2020, 20, 4298. [Google Scholar] [CrossRef] [PubMed]
- Xi, D.; Qin, Y.; Wang, S. YDRSNet: An integrated Yolov5-Deeplabv3 + real-time segmentation network for gear pitting measurement. J. Intell. Manuf. 2021, 1–15. [Google Scholar] [CrossRef]
- Vullo, V. Gears—Volume 2: Analysis of Load Carrying Capacity and Strength Design; Springer Nature Switzerland AG: Cham, Switzerland, 2020. [Google Scholar]
- Wu, Y.; Kirillov, A.; Massa, F.; Lo, W.Y.; Girshick, R. Detectron 2. Available online: https://github.com/facebookresearch/detectron2 (accessed on 25 February 2022).
- Ren, S.; He, K.; Girshick, R.; Sun, J. Faster R-CNN: Towards Real-Time Object Detection with Region Proposal Networks. arXiv 2016, arXiv:1506.01497. [Google Scholar] [CrossRef] [Green Version]
- Hasty. Available online: https://hasty.ai (accessed on 15 March 2022).
- Rehman, S.U.; Tu, S.; Rehman, O.U.; Huang, Y.; Magurawalage, C.M.S.; Chang, C.-C. Optimization of CNN through Novel Training Strategy for Visual Classification Problems. Entropy 2018, 20, 290. [Google Scholar] [CrossRef] [Green Version]
- Nguyen, H.N.; Lee, C. Effects of Hyper-parameters and Dataset on CNN Training. J. IKEEE 2018, 22, 14–20. [Google Scholar]
- Hsia, C.-H.; Chang, T.-H.W.; Chiang, C.-Y.; Chan, H.-T. Mask R-CNN with New Data Augmentation Features for Smart Detection of Retail Products. Appl. Sci. 2022, 12, 2902. [Google Scholar] [CrossRef]
- Thilagavathy, A.; Rishikesh, S.; Yuva Prasad, C.; Pradeep Kimar, S. Object Detection classifier using Faster R-CNN Algorithm. Eur. J. Mol. Clin. Med. 2020, 7, 2087–2096. [Google Scholar]
- Chen, P.; Elangovan, V. Object sorting using faster r-cnn. arXiv 2020, arXiv:2012.14840. [Google Scholar] [CrossRef]
- Mahdi, F.P.; Motoki, K.; Kobashi, S. Optimization technique combined with deep learning method for teeth recognition in dental panoramic radiographs. Sci. Rep. 2020, 10, 19261. [Google Scholar] [CrossRef] [PubMed]
- Alganci, U.; Soydas, M.; Sertel, E. Comparative Research on Deep Learning Approaches for Airplane Detection from Very High-Resolution Satellite Images. Remote Sens. 2020, 12, 458. [Google Scholar] [CrossRef] [Green Version]


| Coordinates of Boxes (Start) (Pixel) | Coordinates of Boxes (End) (Pixel) | Prediction Confidence (%) | ||
|---|---|---|---|---|
| Pitting 1 | 1st level | 3637.1069; 1157.3285 | 3948.2188; 1461.5745 | 99.86 |
| 2nd level | 2357.3508; 1171.1965 | 2741.0522; 1418.6853 | 99.94 | |
| 3rd level | 2561.0249; 959.416 | 3165.9492; 1308.5024 | 99.91 | |
| Pitting 2 | 1st level | 2555.4255; 1114.2948 | 2839.6267; 1399.51 | 99.8 |
| 2nd level | 3289.771; 1180.4796 | 3832.9392; 1448,9137 | 99.91 | |
| 3rd level | 3396.7253; 1029.2837 | 4248.0825; 1308.5024 | 99.91 | |
| Tooth 7 | 1st level | 1803.7611; 1096.854 | 4927.0244; 1528.479 | 97.5 |
| 2nd level | 1698.1724; 1136.9203 | 4797.167; 1581.1718 | 97.78 | |
| 3rd level | 2155.6003; 978.2216 | 5201.3003; 1474.3358 | 98.47 | |
| Physically Measured [mm] | Calculated [mm] | Difference [%] | ||
|---|---|---|---|---|
| Pitting 1 x direction | 1st level | 4.3 | 4.905 | 11.7 |
| 2nd level | 4.3 | 4.054 | −3.37 | |
| 3rd level | 4.95 | 5.586 | 13.61 | |
| Pitting 2 x direction | 1st level | 4.1 | 4.599 | 10.09 |
| 2nd level | 4.3 | 4.399 | 0.46 | |
| 3rd level | 4.4 | 4.465 | 3.93 | |
| Pitting 1 y direction | 1st level | 4.3 | 4.977 | 13.31 |
| 2nd level | 5.9 | 6.195 | 4.84 | |
| 3rd level | 9.2 | 9.914 | 7.16 | |
| Pitting 2 y direction | 1st level | 4.1 | 4.545 | 9.89 |
| 2nd level | 8.4 | 8.777 | 4.33 | |
| 3rd level | 12.8 | 13.985 | 8.51 | |
Publisher’s Note: MDPI stays neutral with regard to jurisdictional claims in published maps and institutional affiliations. |
© 2022 by the authors. Licensee MDPI, Basel, Switzerland. This article is an open access article distributed under the terms and conditions of the Creative Commons Attribution (CC BY) license (https://creativecommons.org/licenses/by/4.0/).
Share and Cite
Miltenović, A.; Rakonjac, I.; Oarcea, A.; Perić, M.; Rangelov, D. Detection and Monitoring of Pitting Progression on Gear Tooth Flank Using Deep Learning. Appl. Sci. 2022, 12, 5327. https://0-doi-org.brum.beds.ac.uk/10.3390/app12115327
Miltenović A, Rakonjac I, Oarcea A, Perić M, Rangelov D. Detection and Monitoring of Pitting Progression on Gear Tooth Flank Using Deep Learning. Applied Sciences. 2022; 12(11):5327. https://0-doi-org.brum.beds.ac.uk/10.3390/app12115327
Chicago/Turabian StyleMiltenović, Aleksandar, Ivan Rakonjac, Alexandru Oarcea, Marko Perić, and Damjan Rangelov. 2022. "Detection and Monitoring of Pitting Progression on Gear Tooth Flank Using Deep Learning" Applied Sciences 12, no. 11: 5327. https://0-doi-org.brum.beds.ac.uk/10.3390/app12115327