4.2. Excitation/Fluorescence Spectrum Matrix
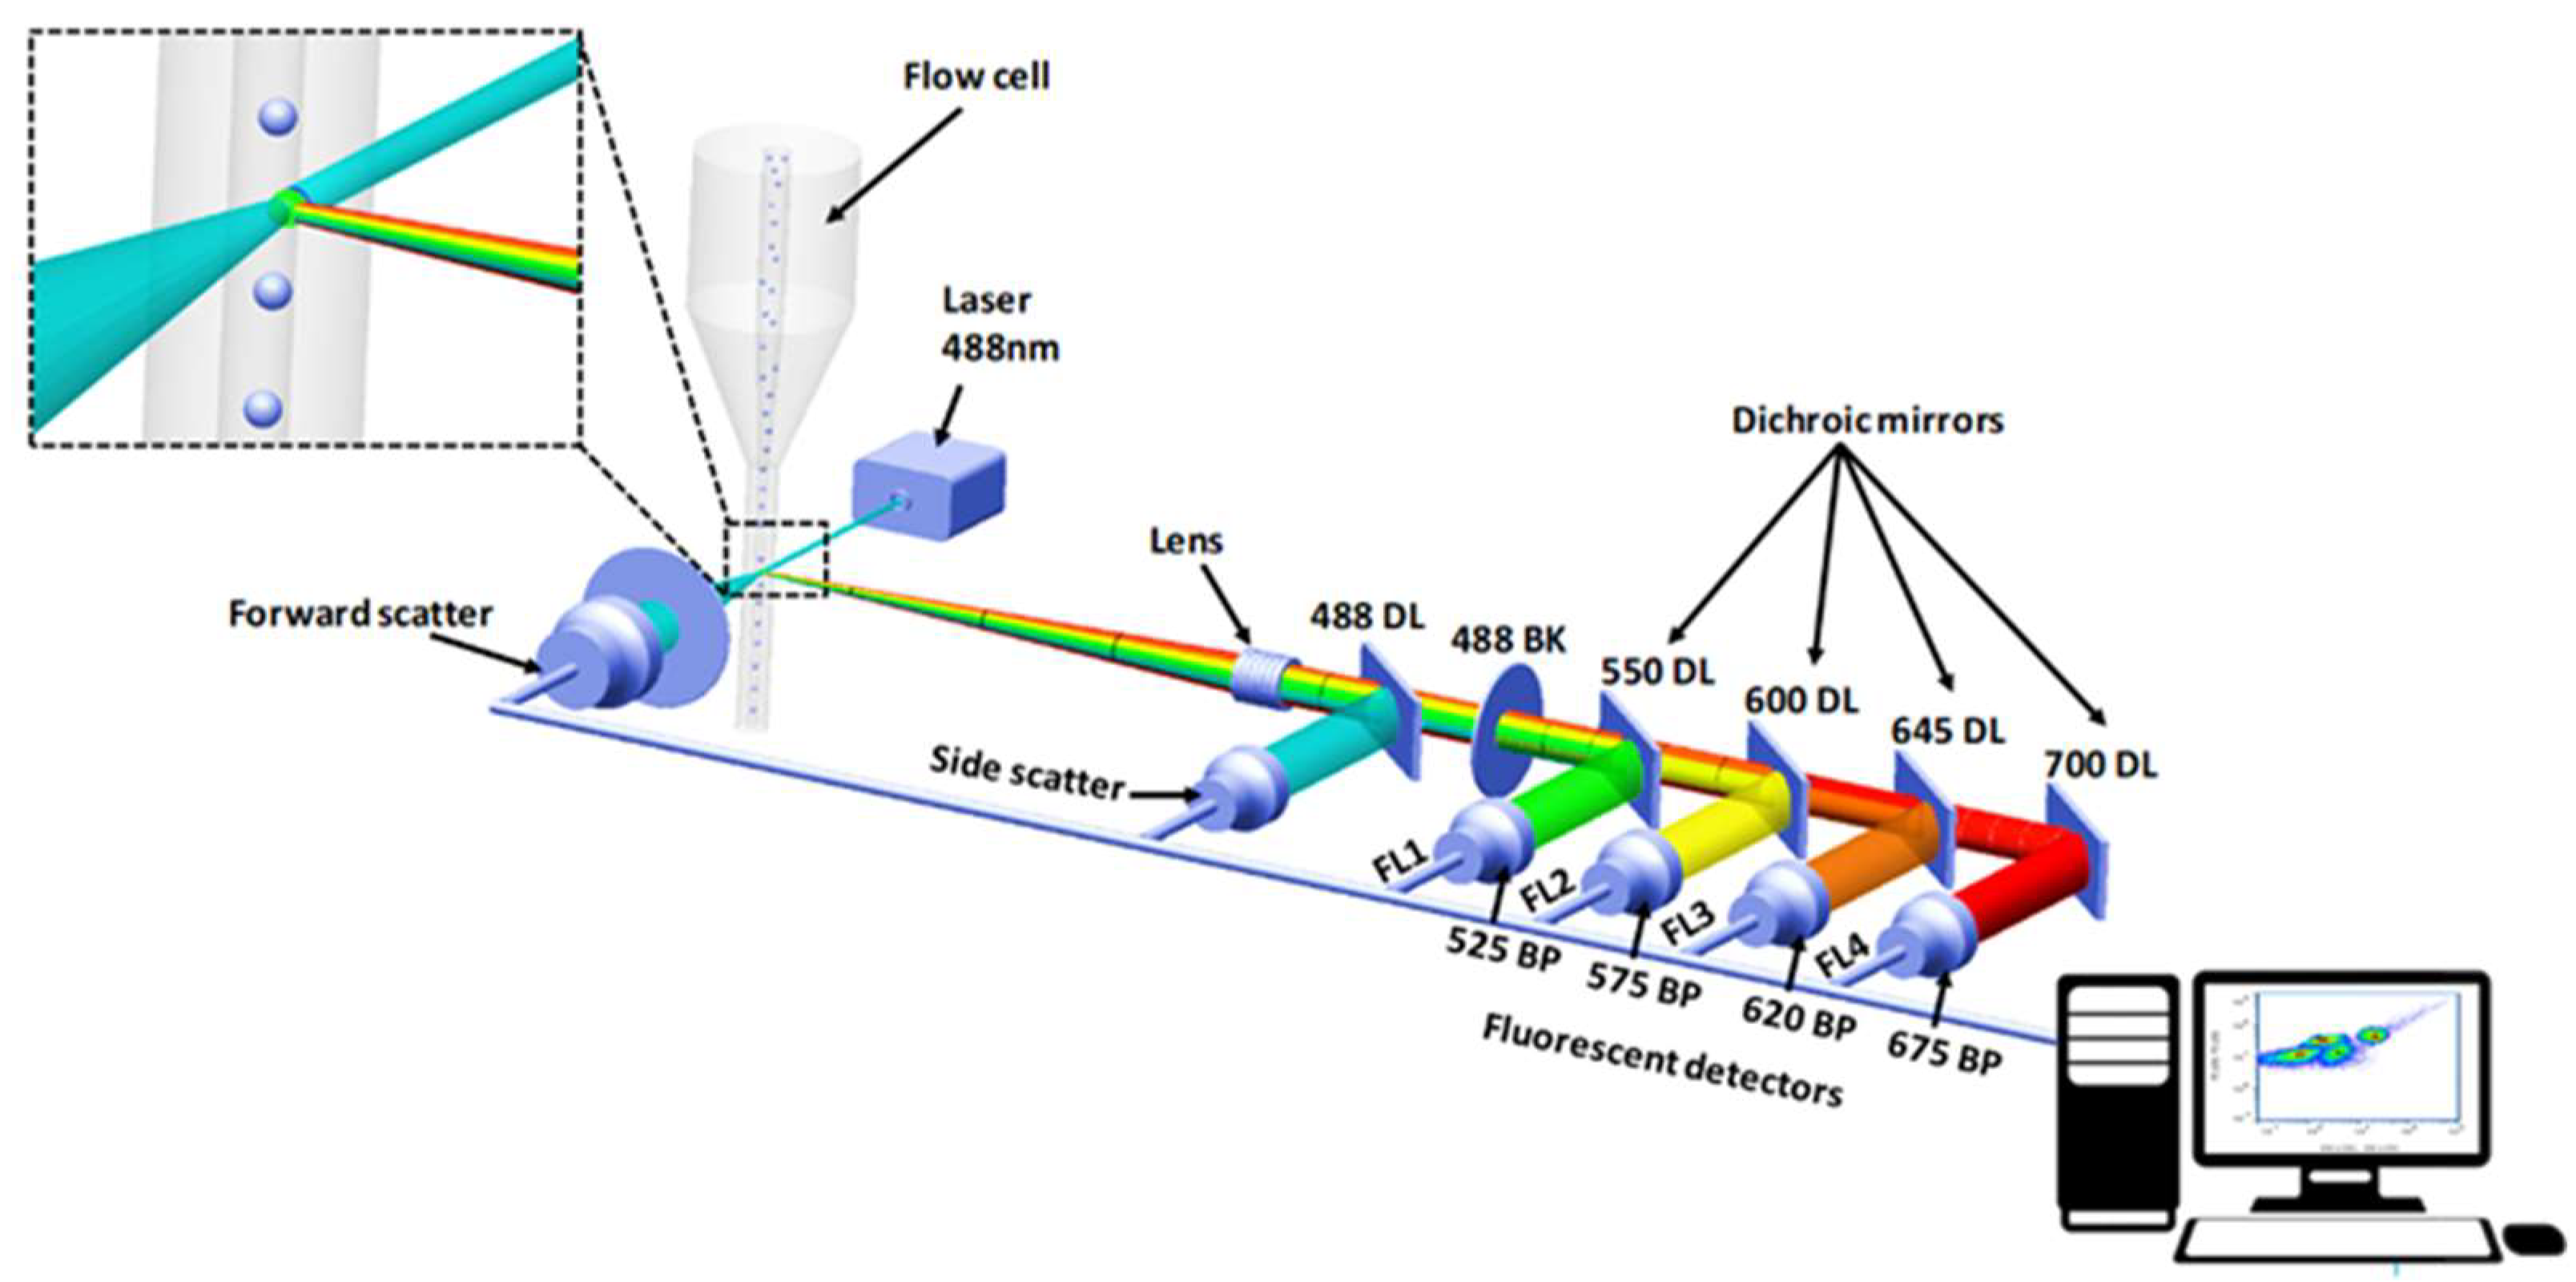
Fluorometric measurements, using the commercial fluorimeter described in
Section 2.2, were performed for each species. Excitation was scanned from 400 nm to 650 nm (steps of 20 nm) and emission scanned from 400 nm to 850 nm (steps of 1 nm) for each excitation wavelength. Fluorescence at the same wavelength of the excitation was removed, since it results mainly from dispersion. Here, 2–3 mL of monocultures was analysed.
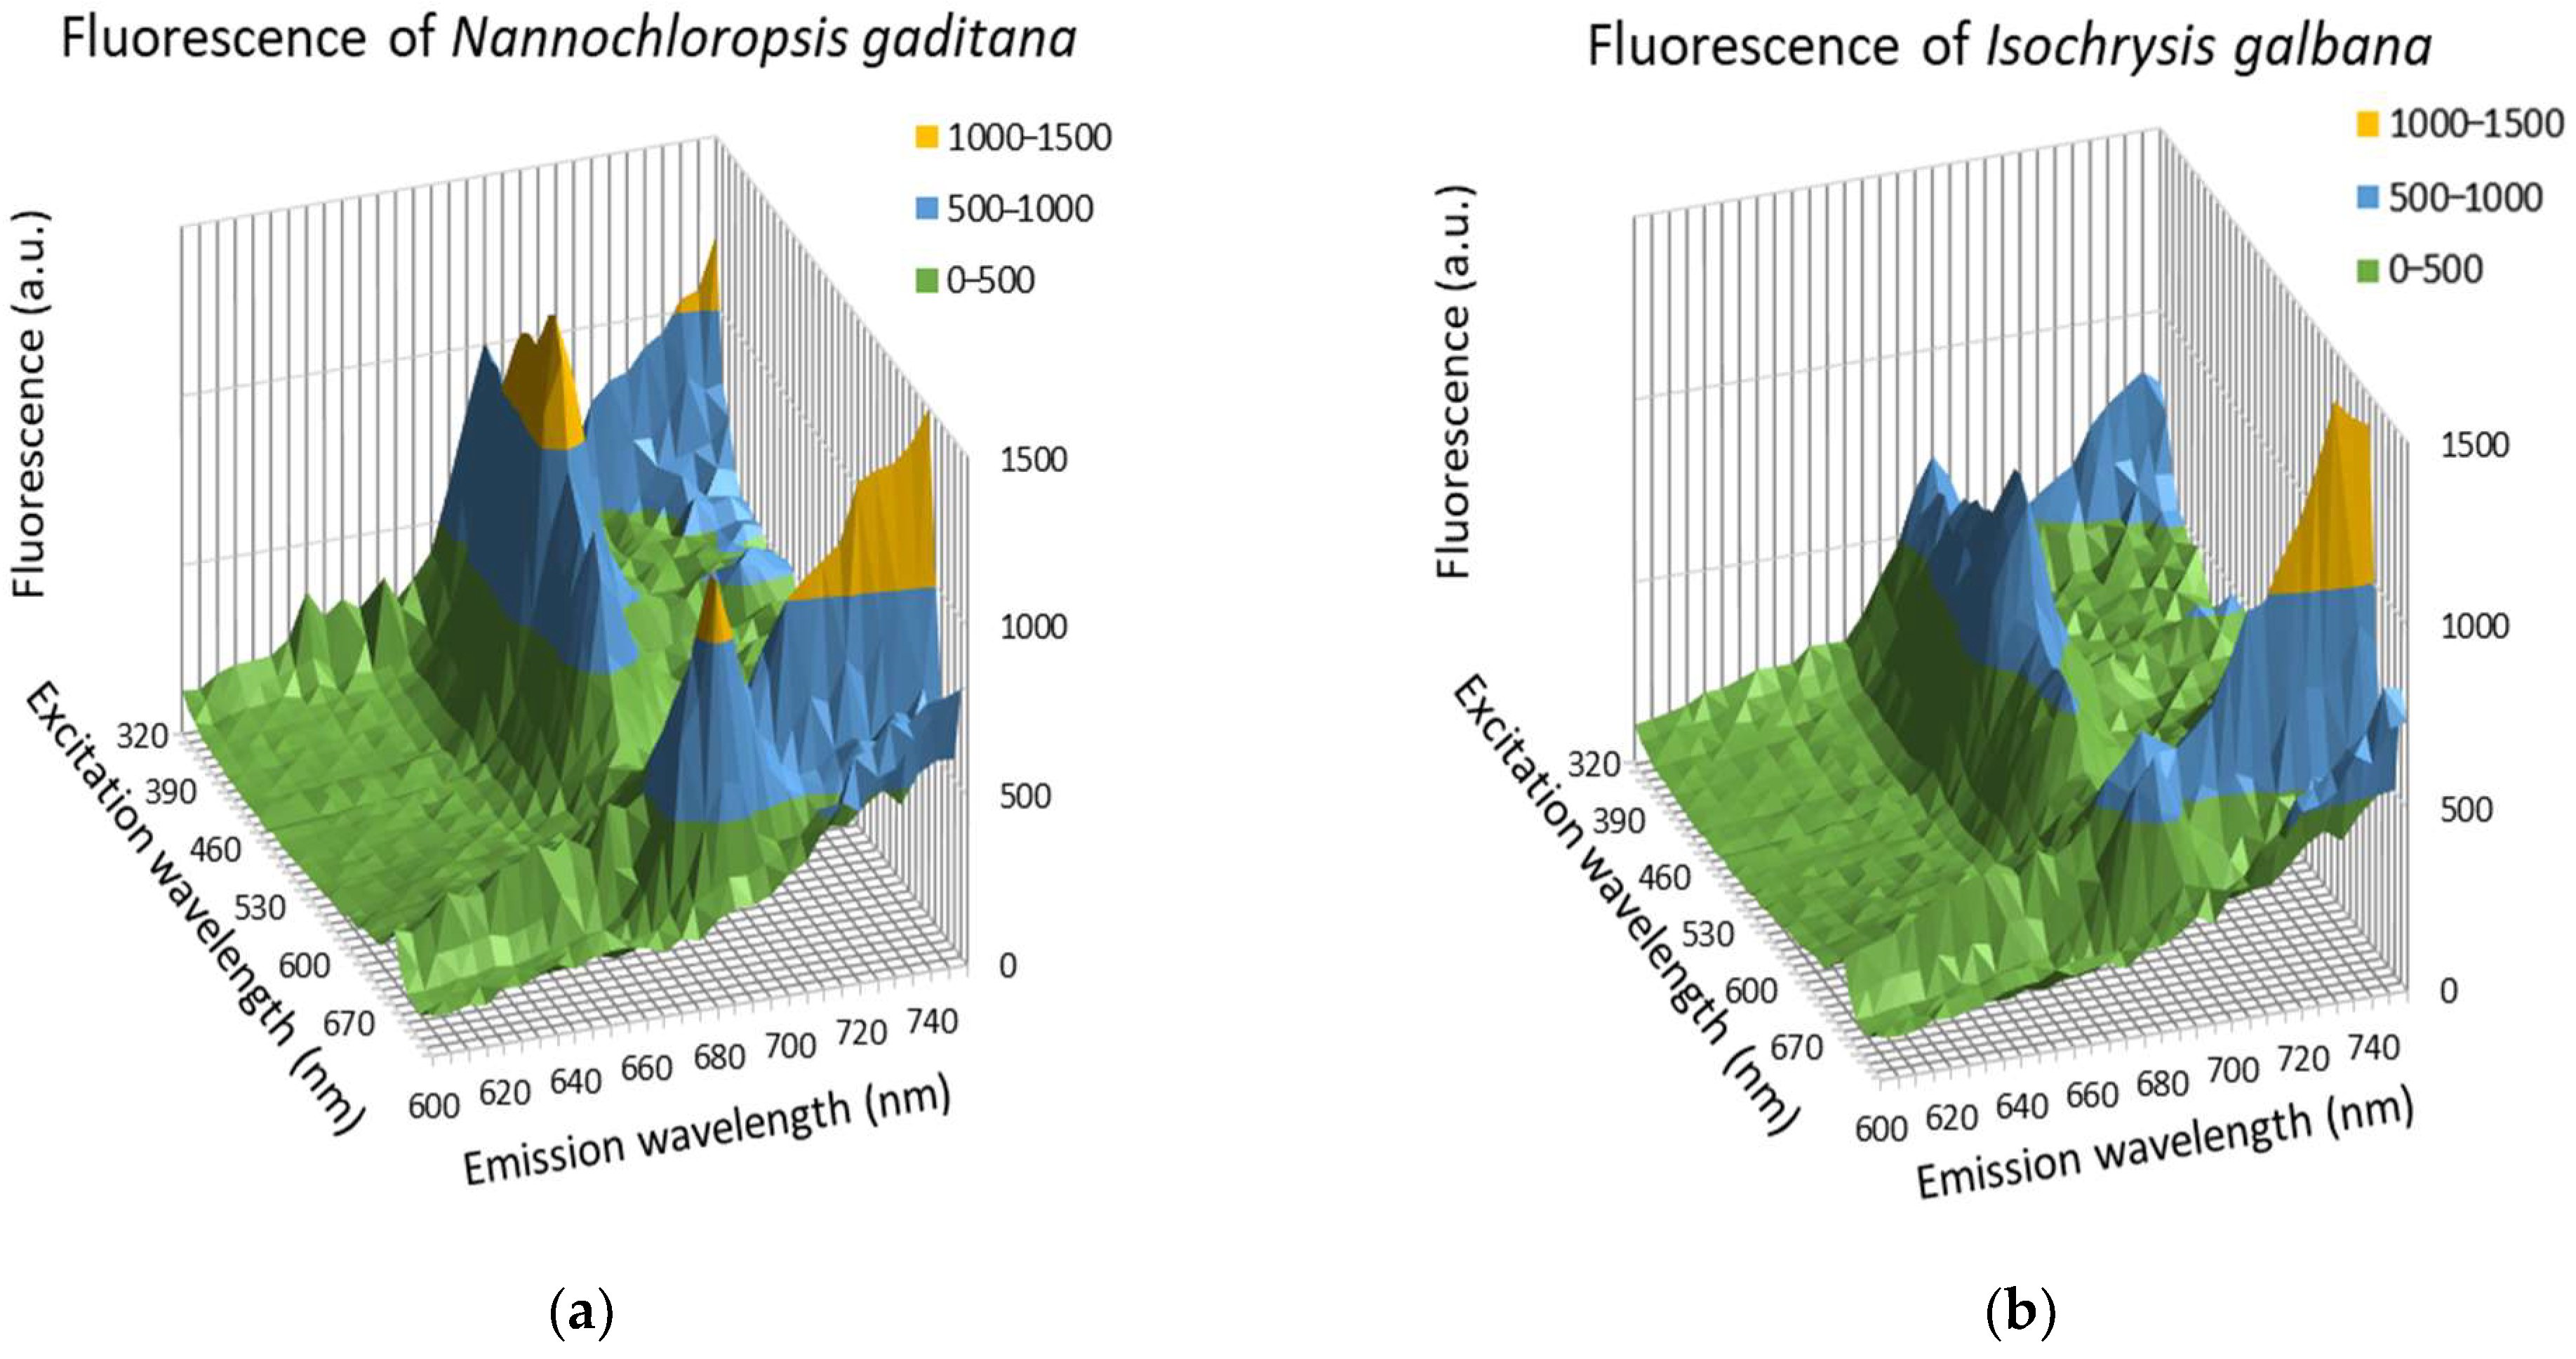
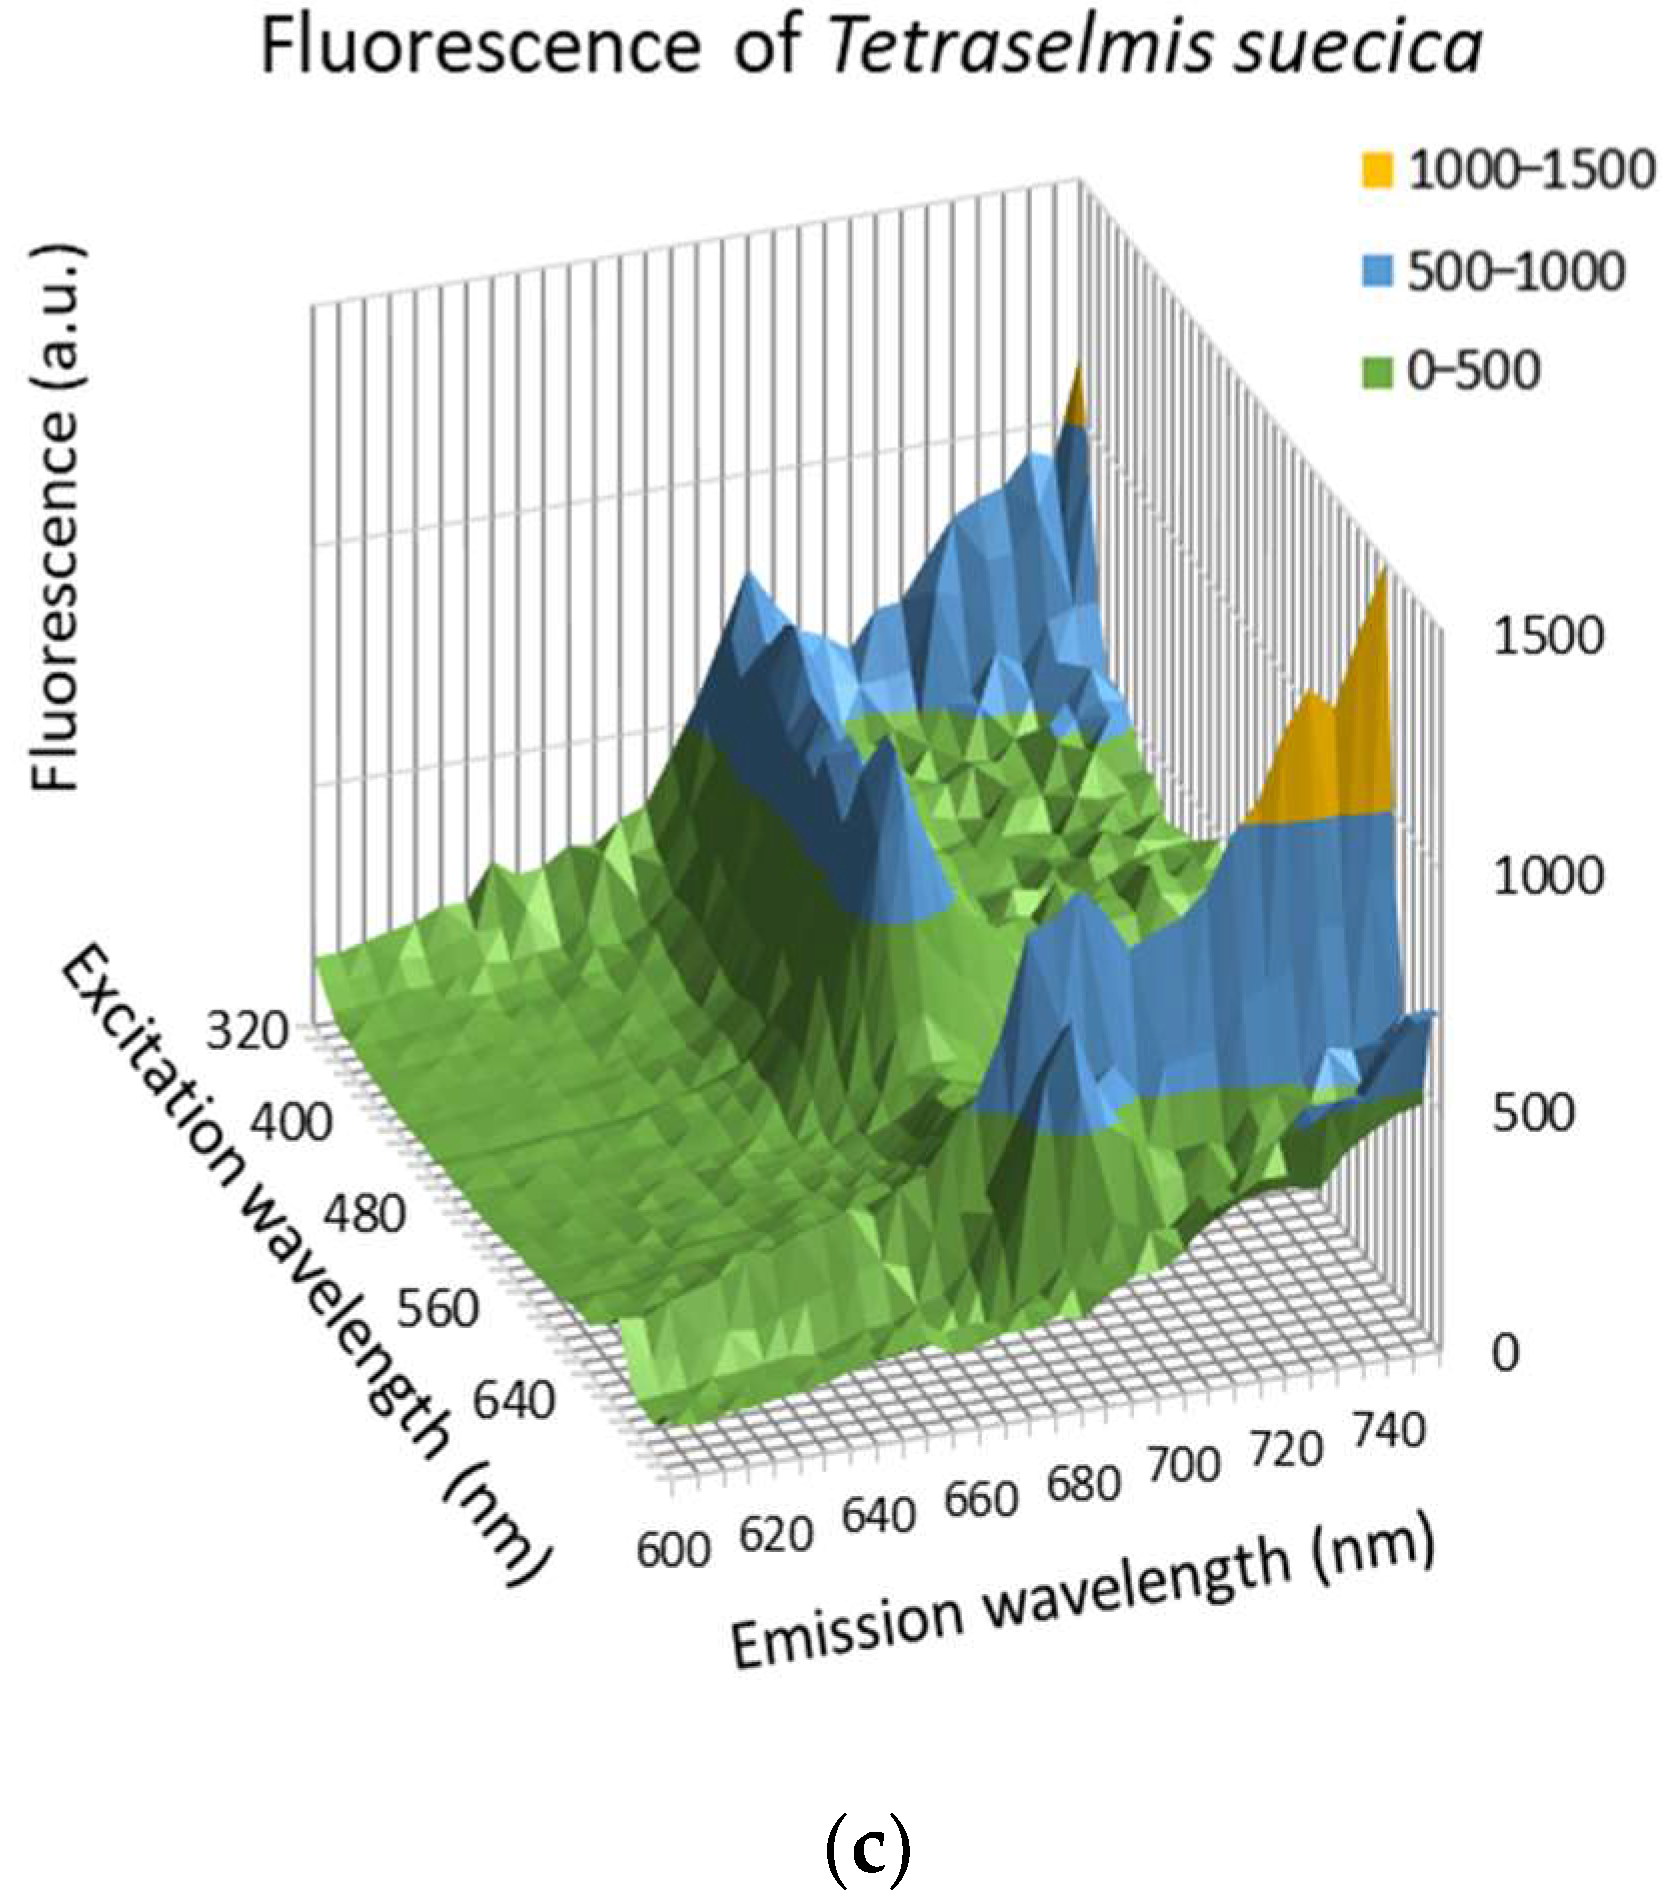
Figure 3 presents the fluorescence spectra (emission) of three of the presented phytoplankton species (
Nannochloropsis gaditana (A),
Isochrysis galbana (B) and
Tetraselmis suecica (C)) for each excitation wavelength. Fluorescence values were normalized to the maximum value measured in the spectrum of each studied species.
The three species show a fluorescence peak at 685 nm, for several excitation wavelengths. This peak corresponds to the fluorescence emission of chlorophyll a.
We then tried to find patterns in
Figure 3 that are unique for each species. To this aim, we calculated the mean and standard deviation (
σ), corresponding to the excitation/emission values for the three species using Equation (1), where
is the fluorescence at each pair of excitation (
x) and fluorescence (
y) wavelengths, and
is the mean value from the three species.
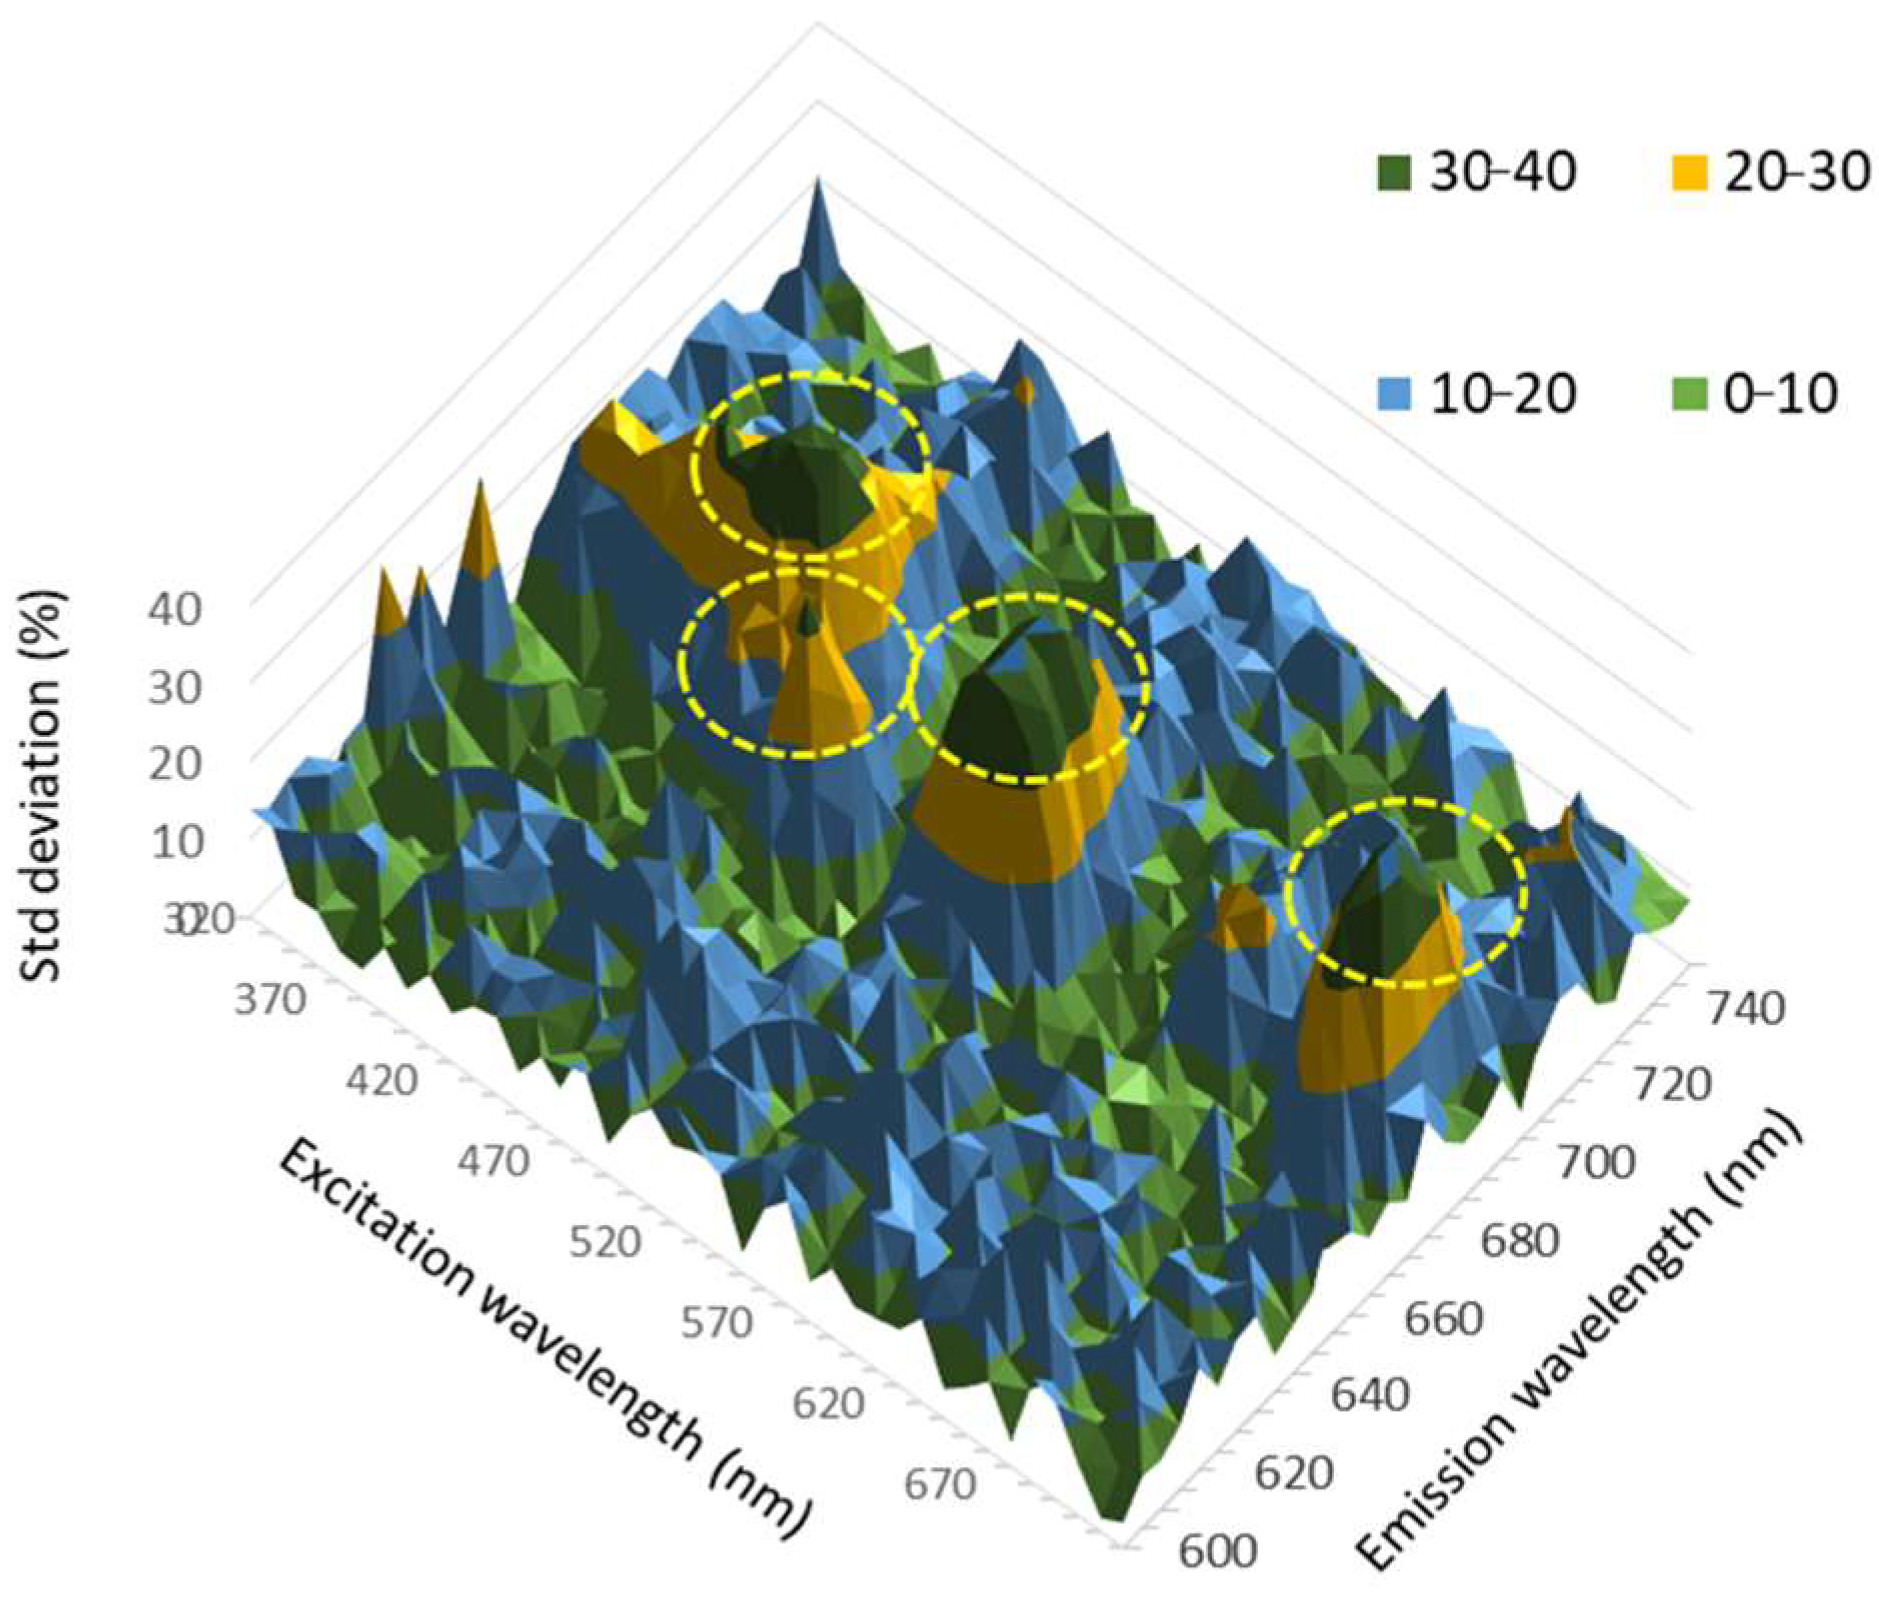
Standard deviation between fluorescence in each excitation/emission wavelength from the three species is plotted in
Figure 4. As depicted by Equation (1) of the standard deviation (
σxy), a higher standard deviation means that the three species have different values of fluorescence (measured at wavelength represented in index
y and when excited at wavelength represented by index
x). When the standard deviation has a value near zero, it means that all three species have equivalent fluorescence at that wavelength. The standard deviation is therefore used to understand which wavelengths can be used to better distinguish between species. The standard deviation of fluorescence for each pair of excitation/emission is higher when differences are found between the three species. Four main regions were found where standard deviation showed high (>30%) values (
Figure 4). The respective excitation and emission wavelengths are presented in
Table 4.
The last region (excitation and emission at 680 nm) results from dispersion, since the same wavelength is used for excitation and emission and will not be considered for species differentiation. Emission in the 640 nm regions is almost equal in all species, at all excitation wavelengths (
Figure 4).
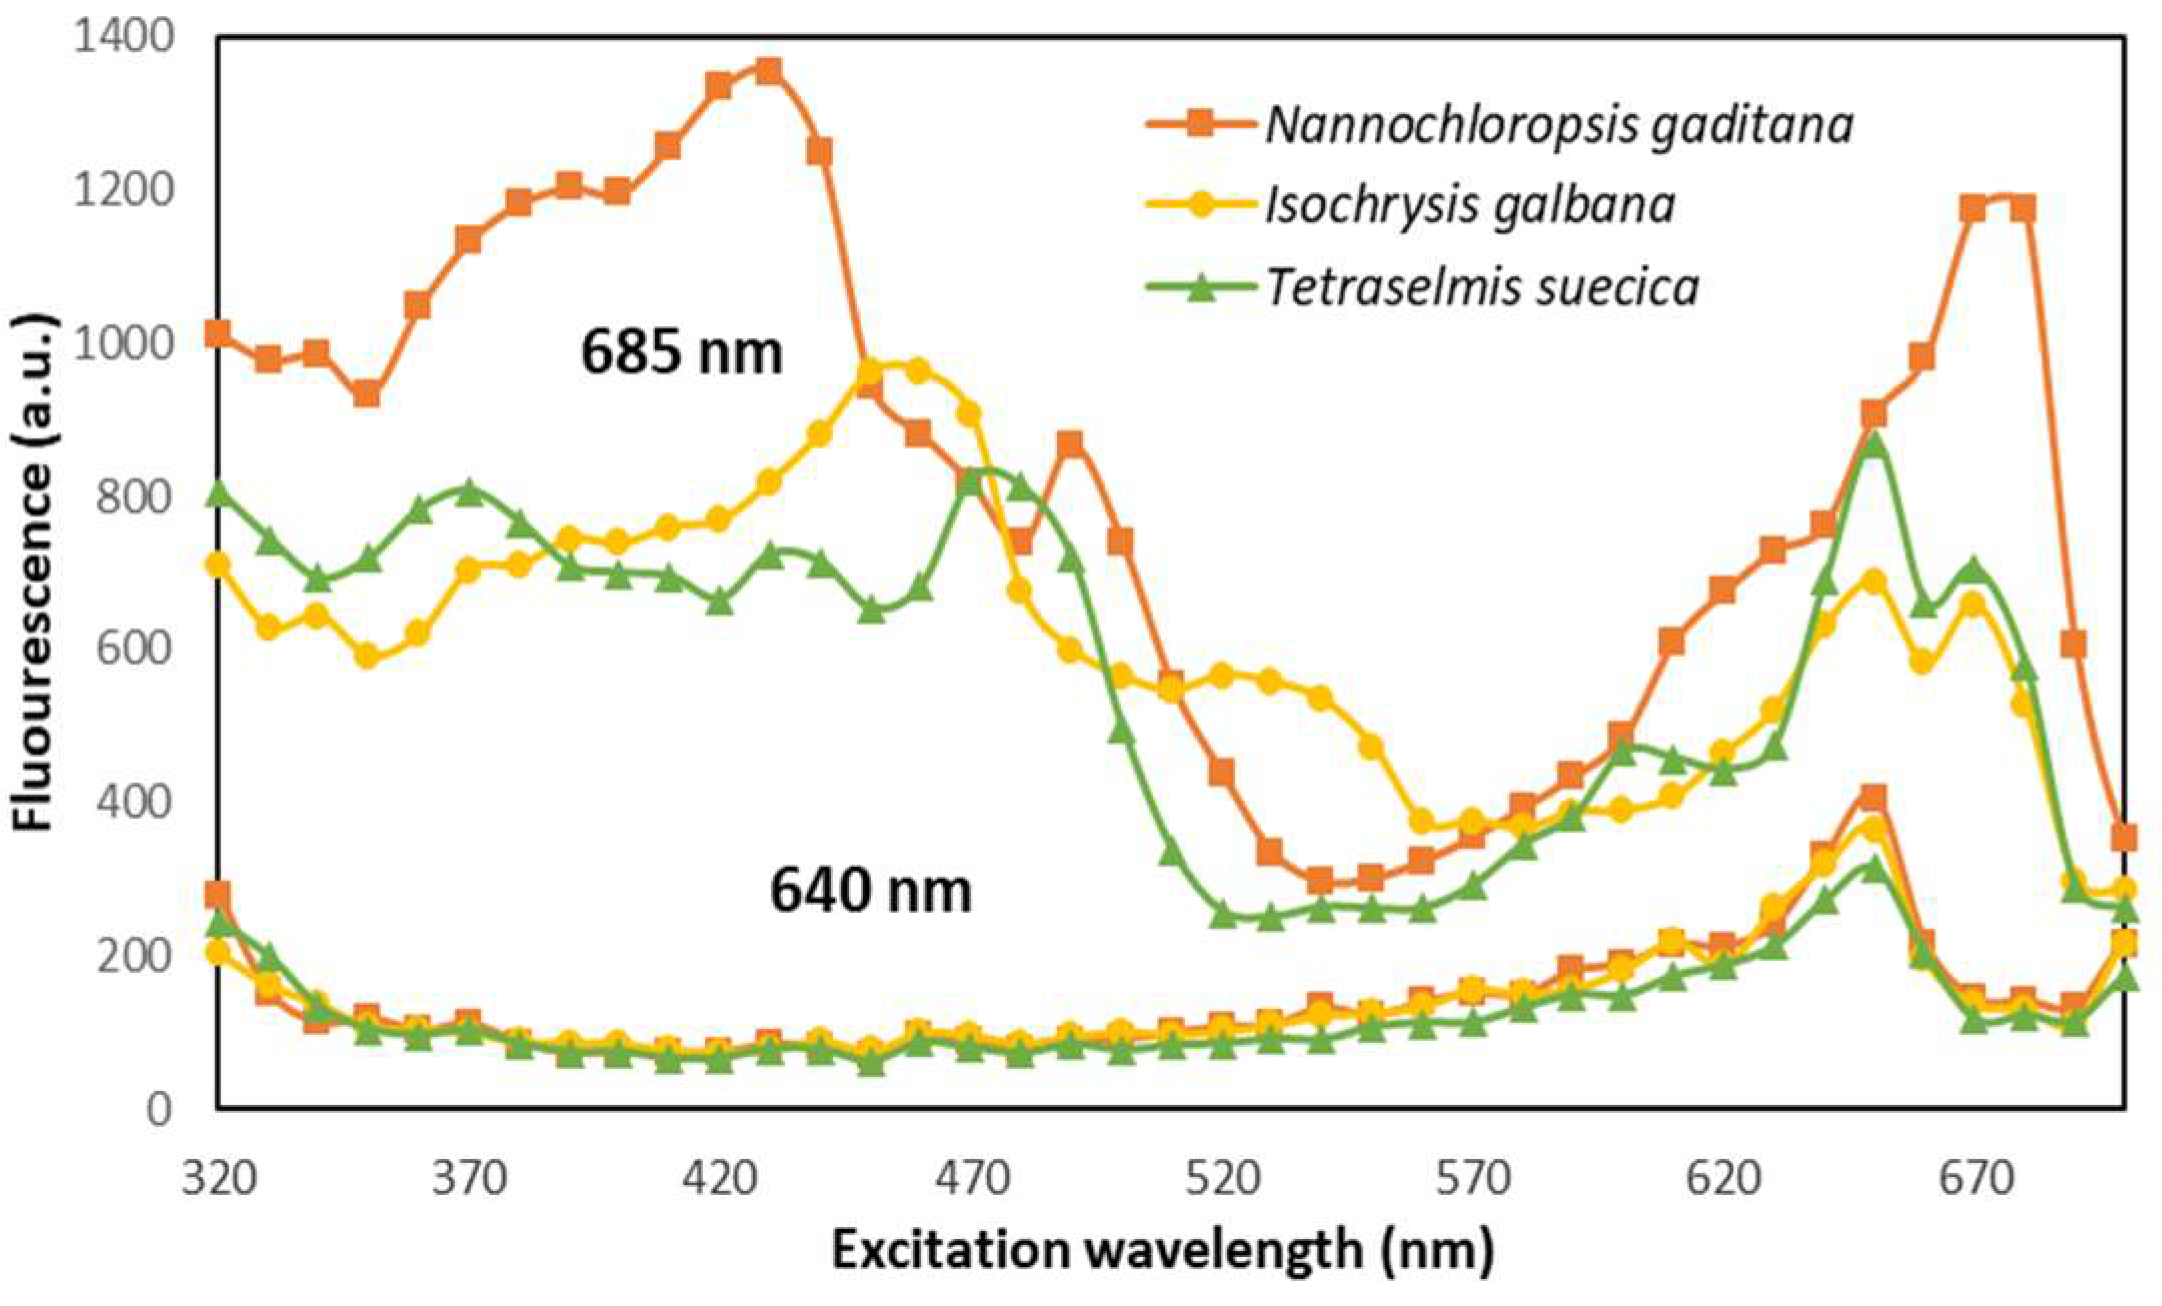
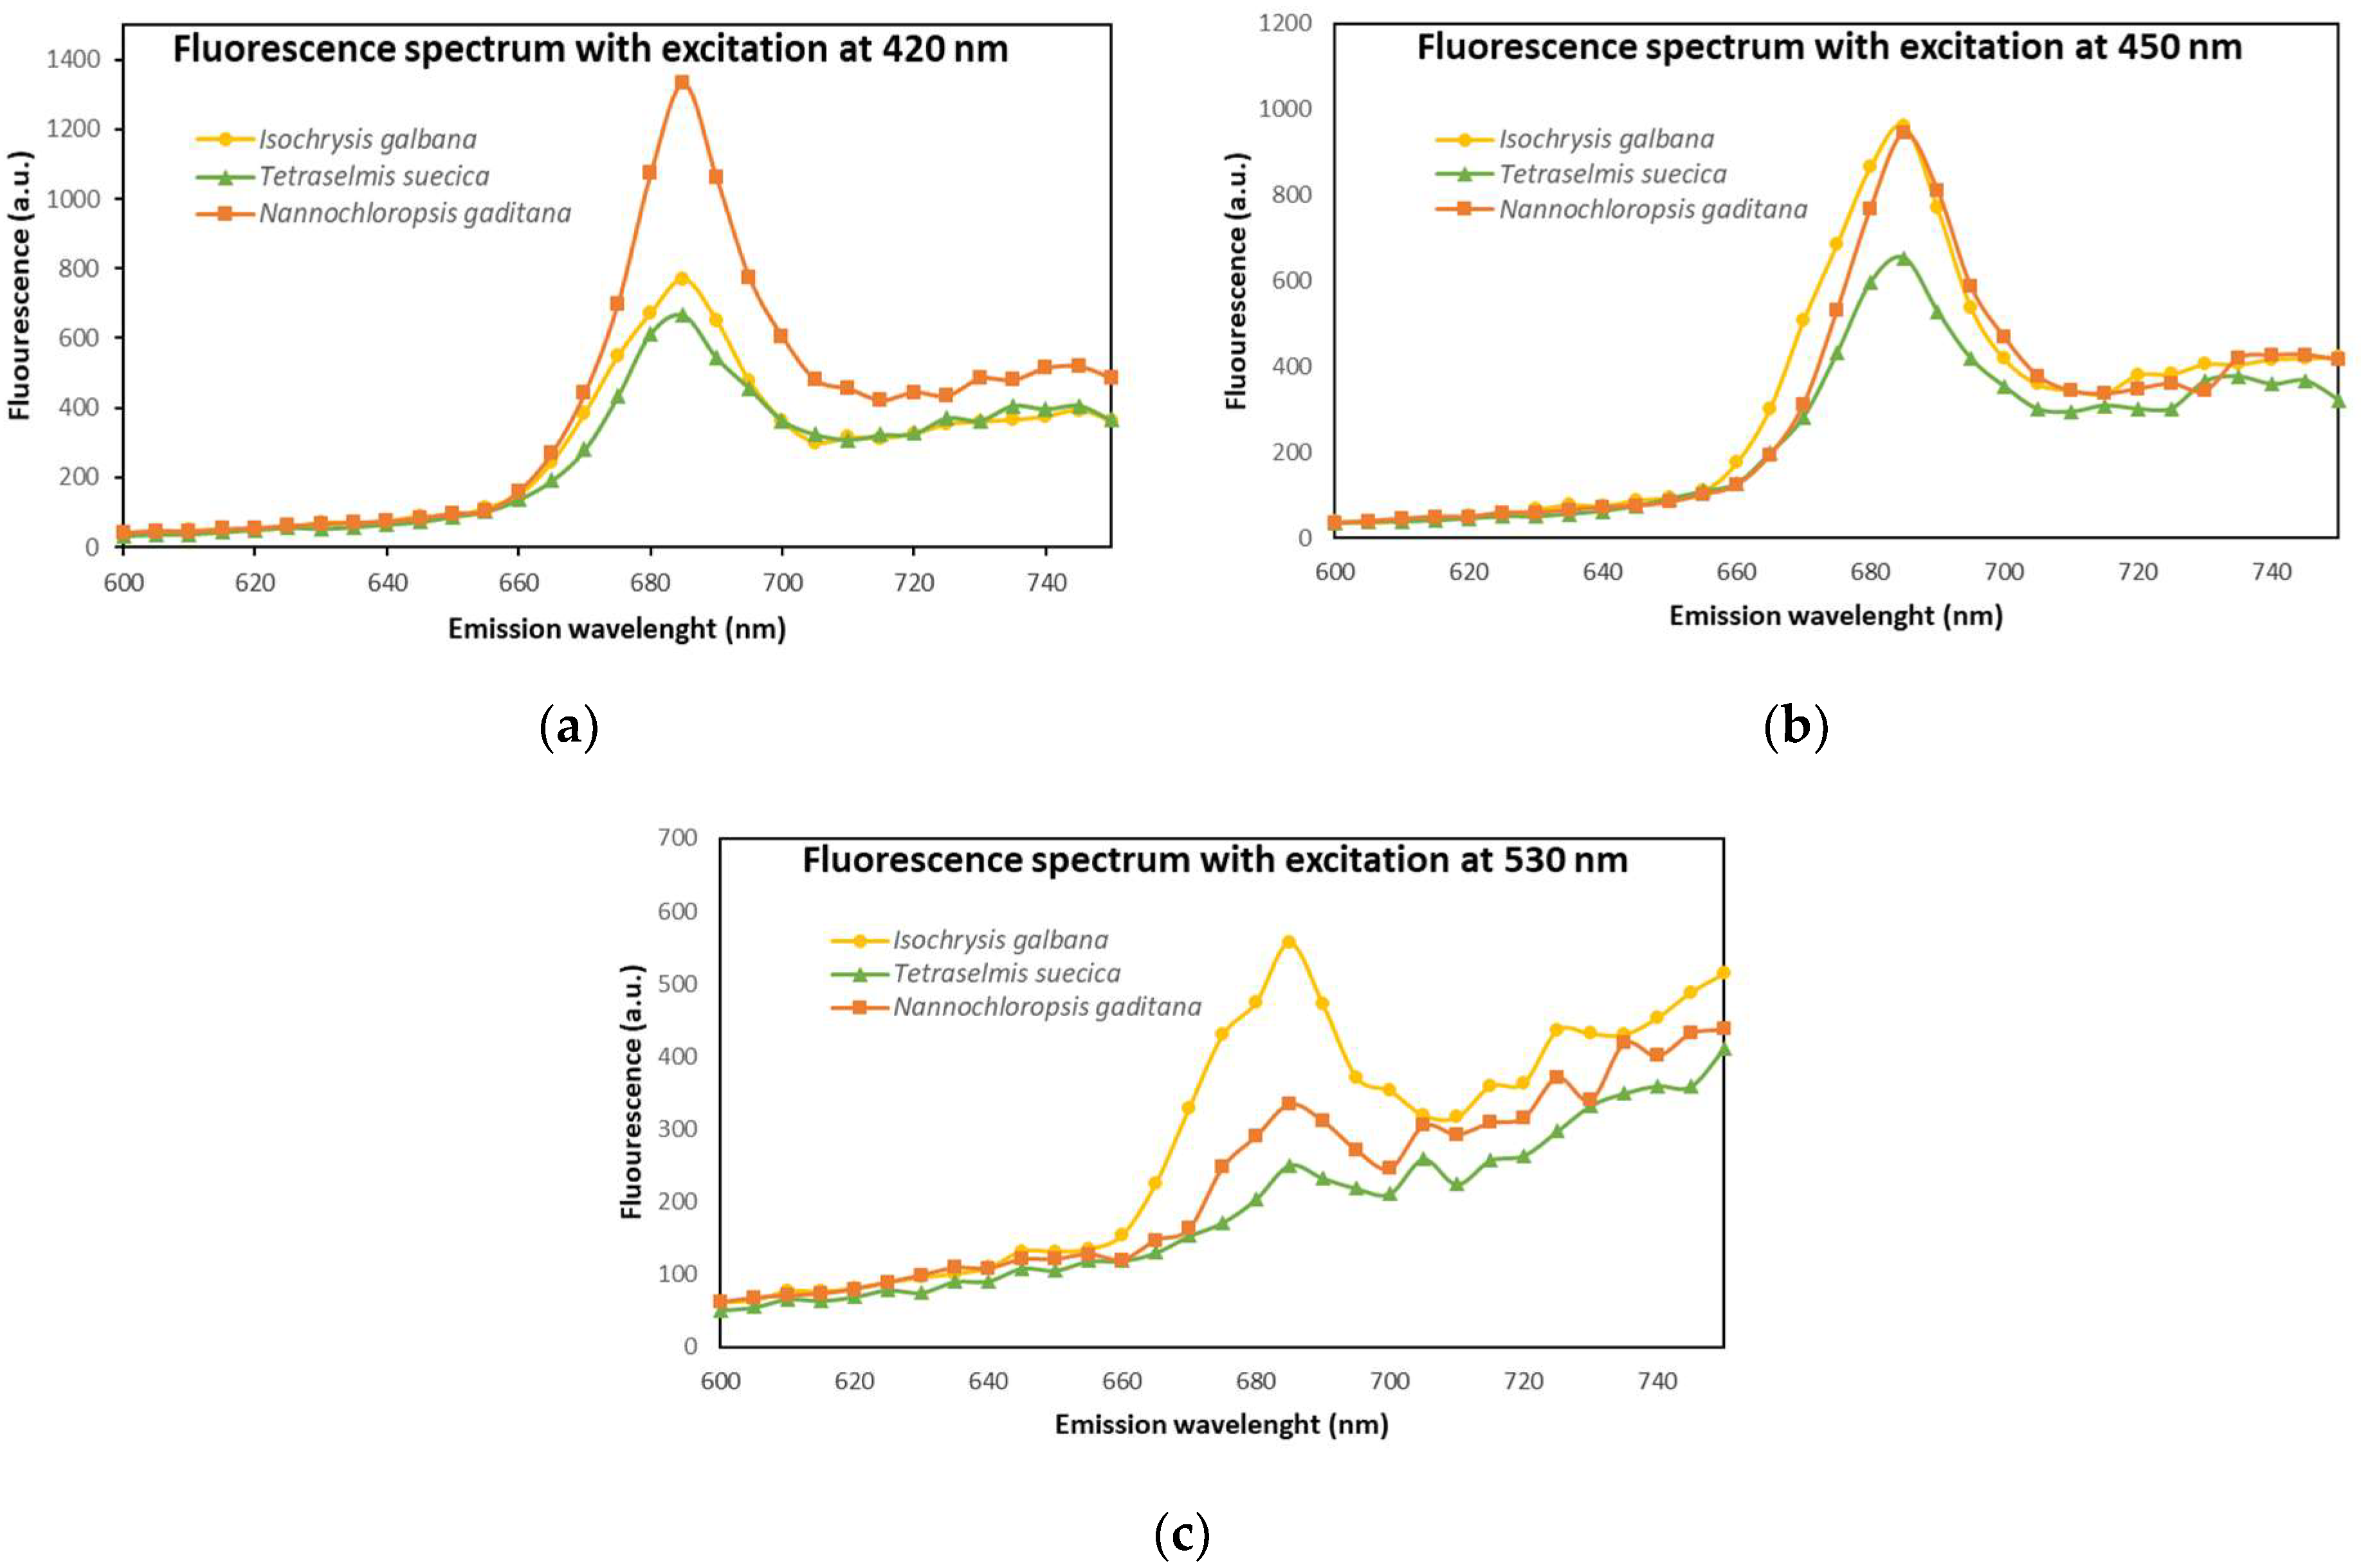
Figure 5 and
Figure 6 plot only these selected wavelengths, for the three species.
Figure 5 represents fluorescence at 640 nm and 685 nm, when excitation is scanned from 320 nm to 700 nm, and
Figure 6 shows the fluorescence emission spectrum, for excitation at 420 nm, 450 nm and 530 nm.
Differences between the species could be detected from
Figure 5 and
Figure 6. As expected, the higher standard deviations from
Table 4 are confirmed in the observed differences of the fluorescence spectra in
Figure 5 and
Figure 6. We also identified the emission wavelengths where fluorescence is very similar for the studied species, which resulted to be emission wavelengths bellow 660 nm and emission wavelengths above 710 nm. These emission wavelengths can be used as reference.
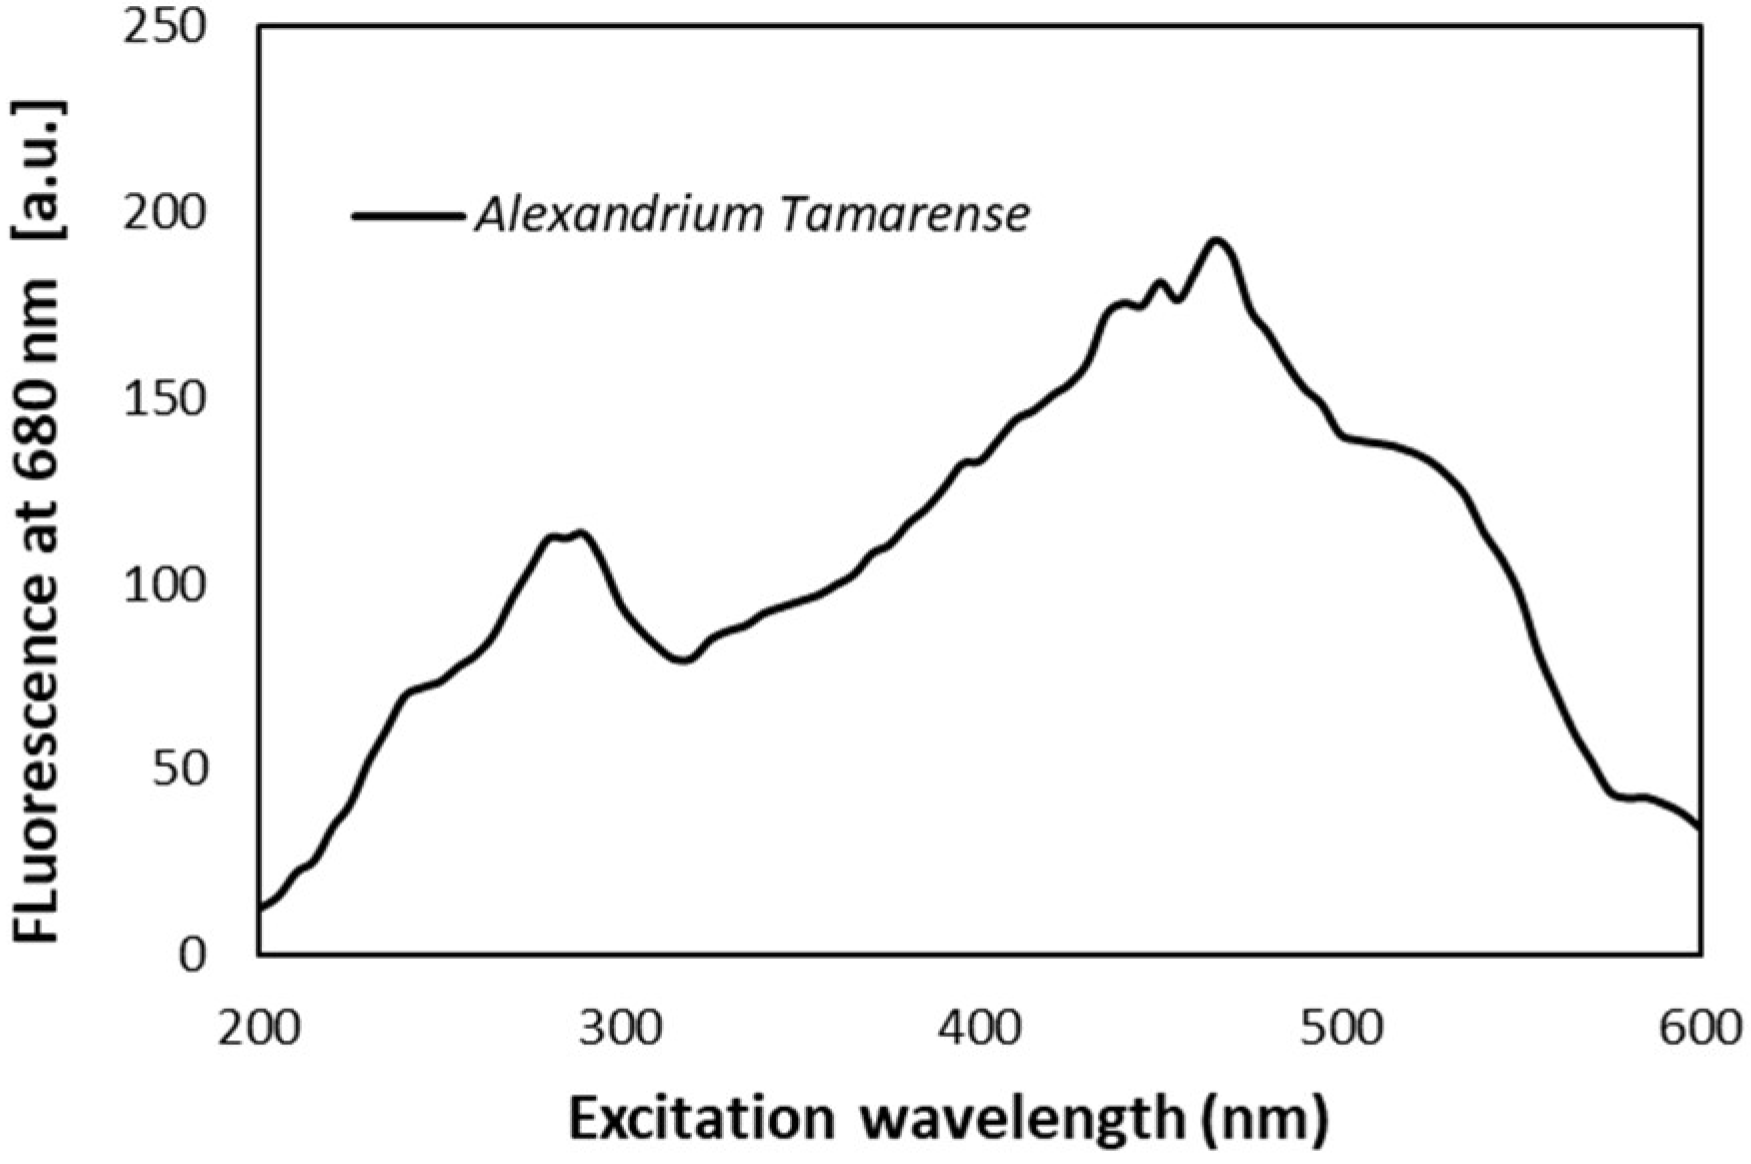
Based on this study, excitation wavelengths of 420 nm, 450 nm and 530 nm and emission wavelengths of 640 nm and 685 nm were chosen as the most suitable to distinguish between these species. In order to confirm if the classification method could be used to discriminate potentially toxic species, the fluorescence spectrum of
Alexandrium tamarense reported in [
23,
24] was used.
Figure 7 shows the
Alexandrium tamarense fluorescence spectrum at 685 nm, when excitation light is scanned from 200 nm to 600 nm. The pairs of excitation/emission are presented in
Table 5.
For each species, nine ratios were derived from the fluorescence values shown in
Table 5: six ratios resulting from the four fluorescence values obtained at 685 nm, with the four different excitation wavelengths (320 nm, 420 nm, 450 nm and 530 nm), named FBX/CX, FBX/DX FBX/AX, FCX/DX, FCX/AX and FDX/AX; and three ratios between the emission obtained at 685 nm and 640 nm, for each excitation wavelengths (320 nm, 420 nm, 450 nm and 530 nm), named FBX/BY, FCX/CY and FDX/DY. These ratios are presented in
Table 6 for each species.
For each ratio, the maximum (M) and minimum (m) values (maximum and minimum at each row) were selected. These maximum and minimum values of the fluorescence ratios were then used as identifying characteristics of each species. For each species, an identifier was calculated (GAD, GAL, SUE and TAM on Equation (2)). Maximum ratios from
Table 6 are in the numerator and minimum ratios in the denominator of equations to calculate GAD, GAL, SUE and TAM (Equation (2)), but other ratios were also added to improve selectivity. A coefficient was also used to normalize all identifiers to a maximum value of 1 (1/284.6, 1/0.24, 61.8 and 1/20,423 respectively).
Validation of the equations was made by calculating the four identifiers (Equation (2)) with the fluorescence values of the four species (
Table 6), resulting in the values in
Table 7.
The species Nannochloropsis gaditana and Isochrysis galbana are clearly identified from the calculated identifier GAD and GAL, respectively. The identifier GAD showed the highest value (1.00) when Nannochloropsis gaditana is present, whereas this identifier has low values (0.24, 0.21 and 0.00) when calculated with the fluorescence measurements of the three other species.
The identifier GAL has the highest value (1.00) with the fluorescence of Isochrysis Galbana, but very small values (0.08, 0.09 and 0.01) when calculated from the fluorescence measurements corresponding to the three other species.
In addition, the species Tetraselmis suecica can be identified, but with less confidence than the previous species. The identifier SUE has the value 1.00 when calculated with the fluorescence of species Tetraselmis suecica, and values bellow 0.48 when calculated with the fluorescence measurements from the other species.
The toxic species (Alexandrium Tamarense) can be clearly identified from Nannochloropsis gaditana and Tetraselmis suecica. However, TAM showed a value of 0.54 in the presence of Isochrysis galbana, a value that still allows its identification, but with less confidence.
An identifying algorithm should calculate the value of the four identifiers (GAL, GAD, SUE and TAM), and the higher value obtained in these four identifiers reveals the presented species.
If more different species are presented for identification, the same methodology can be used. However, more emission ratios (than the ones presented in
Table 6) should be used in order to improve selectivity of the identification process.
We were, therefore, able to identify phytoplankton taxonomic groups using a commercial fluorimeter, thus allowing to fulfil the objective of this work: to develop a lab-on-a-chip sensor capable of distinguishing toxic and non-toxic phytoplankton species through the analysis of fluorescence spectrum and intensity at several excitation wavelengths.


 ,
, 


