
An Easy Technique for Focus Characterization and Optimization of XUV and Soft X-ray Pulses


1
Department of Physics, Umeå University, SE-90187 Umeå, Sweden
2
Ultrafast Optics Group, School of Pure and Applied Physics, Mahatma Gandhi University, Kottayam 686560, Kerala, India
*
Author to whom correspondence should be addressed.
Appl. Sci. 2022, 12(11), 5652; https://0-doi-org.brum.beds.ac.uk/10.3390/app12115652
Submission received: 2 May 2022
/
Revised: 23 May 2022
/
Accepted: 26 May 2022
/
Published: 2 June 2022
(This article belongs to the Section Optics and Lasers)
Abstract
:Featured Application
The presented technique is a simple and powerful tool to measure foci of XUV and X-ray beams in all types of sources, including high-harmonics, synchrotrons, and free-electron lasers.
Abstract
For many applications of extreme ultraviolet (XUV) and X-ray pulses, a small focus size is crucial to reach the required intensity or spatial resolution. In this article, we present a simple way to characterize an XUV focus with a resolution of 1.85 µm. Furthermore, this technique was applied for the measurement and optimization of the focus of an ellipsoidal mirror for photon energies ranging from 18 to 150 eV generated by high-order harmonics. We envisage a broad range of applications of this approach with sub-micrometer resolution from high-harmonic sources via synchrotrons to free-electron lasers.
1. Introduction
For a high spatial resolution on the micrometer scale [1,2], as well as nonlinear interactions between XUV/soft-X-ray pulses and matter [3], which are a necessary prerequisite for, e.g., XUV pump–XUV probe experiments, a small and well characterized focus is of crucial importance [4]. Furthermore, a high-energy throughput of the focusing system is essential in order to transfer the energy of the XUV source onto the experimental target. For a bandwidth of a few electron volts, a small focus can be achieved via the use of multilayer-coated spherical mirrors in normal incidence geometry. However, for a broad bandwidth, those multilayer mirrors have low overall reflectivity [5,6,7]. Therefore, a high energy throughput is typically achieved via the use of grazing incidence focusing optics [8,9]. The ideal mirror shape to image a source onto a focus spot is given by an ellipsoidal mirror, but those mirrors are very difficult to produce with high surface quality [10,11]. Therefore, combinations of multiple mirrors that are easier to produce, such as toroidal mirrors, are often used in a geometry that reduces the aberrations [4,9,12]. Grazing incidence optics are very difficult to align, due to their high asymmetry and the fact that small misalignments cause large aberrations [13]. However, if aligned well, those mirrors can deliver focus sizes on the single micrometer scale with a high-energy throughput throughout the entire XUV and deep into the soft-X-ray spectral region.
To enable an efficient optimization of the mirror alignment, a fast and well-resolved measurement of the XUV/soft X-ray focus is crucial. Therefore, many different methods are nowadays used to accomplish this goal.
One way to characterize an XUV/soft X-ray focus is sending it into a gas medium and measuring the distribution of the generated ions. Ion-based characterization methods provide a very high resolution down below 1 µm [14]. However, they typically measure the projection of the XUV focus along a direction normal to the propagation direction [15,16]. Due to the fact that aberrations of XUV beams often do not fulfill circular symmetry, the information that is lost due to the projection makes the optimization of the focus difficult. Aberrations within the projection direction cannot be seen, which can easily lead to a false characterization and optimization of the focus. Furthermore, typical ion detectors need high or ultrahigh vacuum as well as high voltages, which make them expensive and cumbersome to use. In addition, the number of ions that are generated per laser pulse is limited by space charge effects. This means that the ion signal has to be averaged over many XUV pulses to achieve a good signal-to-noise ratio. This fundamentally hampers single-shot focus measurements.
Another common technique for the measurement of the size of a focus is the knife-edge technique. Here, the energy after the focus is determined, while a well-defined straight beam block (referred to as knife-edge) is moved through the focus with very high precision. This method provides very high resolution, well below the micrometer scale [17,18], and it only needs a precise linear stage and an XUV detector, e.g., an XUV photodiode or an XUV charge-coupled device (CCD) camera. However, a measurement with the knife-edge technique only provides information about the projection of the focus. Furthermore, a scan of the position of the knife-edge is needed to obtain these data, and therefore, single-shot measurements are not possible. It cannot be used to measure the shot-to-shot fluctuations of the focus, and a large pointing fluctuation falsifies the spot size measurement.
The measurement of the focus of an XUV/X-ray beam can also be realized with the use of a scintillator [19,20,21,22]. This scintillator generates florescence wherever it is hit by the XUV photons. The photon energy of this fluorescence is typically in the visible spectral region and therefore can be imaged with a microscope objective onto a common CCD or complementary-metal-oxide semiconductor (CMOS) camera. Typically, a resolution on the sub-10 µm scale is achieved, a single-shot operation with a reduced signal-to-noise ratio is possible, and the fluorescence materials are rather thin (100 µm to few millimeters). Furthermore, a high conversion efficiency and efficient collection of the secondary photons is needed in order to enable a good signal-to-noise ratio.
Wavefront sensing is another common option for the characterization and optimization of XUV and X-ray foci [12]. For this technique, the profile and wavefront of the XUV beam is measured with a 2D pinhole array and a CCD outside of the focal plane, and the focus is reconstructed via back-propagating algorithms. This method enables single-shot measurements, which is important for the focus optimization and the determination of the shot-to-shot stability. Furthermore, it is possible to characterize very small foci because the measurement is performed outside of the focus, where the beam diameter is large [23]. The necessary hardware for the measurement of the XUV wavefront is commercially available, but this technique requires a very sensitive XUV camera, which is typically expensive. The reason for this is the large beam diameter at the camera position, which leads to a low fluence. Furthermore, these kinds of sensors are very sensitive to internal alignment errors and often have to be calibrated via the use of a pinhole as spatial filter that blocks most of the XUV signal [23]. Moreover, this method provides an indirect characterization of the focus and, hence, is very sensitive to measurement errors. If, for example, the wavefront is not measured with high enough resolution or accuracy, this will lead to a false and typically smaller measured focus size.
Placing a sensitive XUV or X-ray CCD camera in the focus of the XUV beam would allow for a direct characterization of the XUV focus, but this is typically not a viable option, because these cameras are mounted on a vacuum flange and cannot be placed easily into the focal plane. Furthermore, their pixel size is too large (e.g., 13.5 µm or 26 µm for Andor, iKon, and Newton) to enable high enough spatial resolution to characterize XUV foci on the few micrometer scale directly.
In this article, we describe the measurement and optimization of the XUV focus of an ellipsoidal mirror by the use of a slightly modified low-budget CMOS camera, which is commonly used for near infrared or visible light measurements. We discuss the resolution, acquisition speed, and signal-to-background capabilities at different wavelength regions from 18–150 eV, as well as the challenges that have to be overcome to apply this technique. With this method, the 2D fluence distribution of an XUV and soft X-ray focus is acquired within a single light pulse of the source. Hence, the characterization of an XUV and soft X-ray focus becomes almost as simple as for common laser beams and much easier than the traditional methods.
2. Experimental Implementation
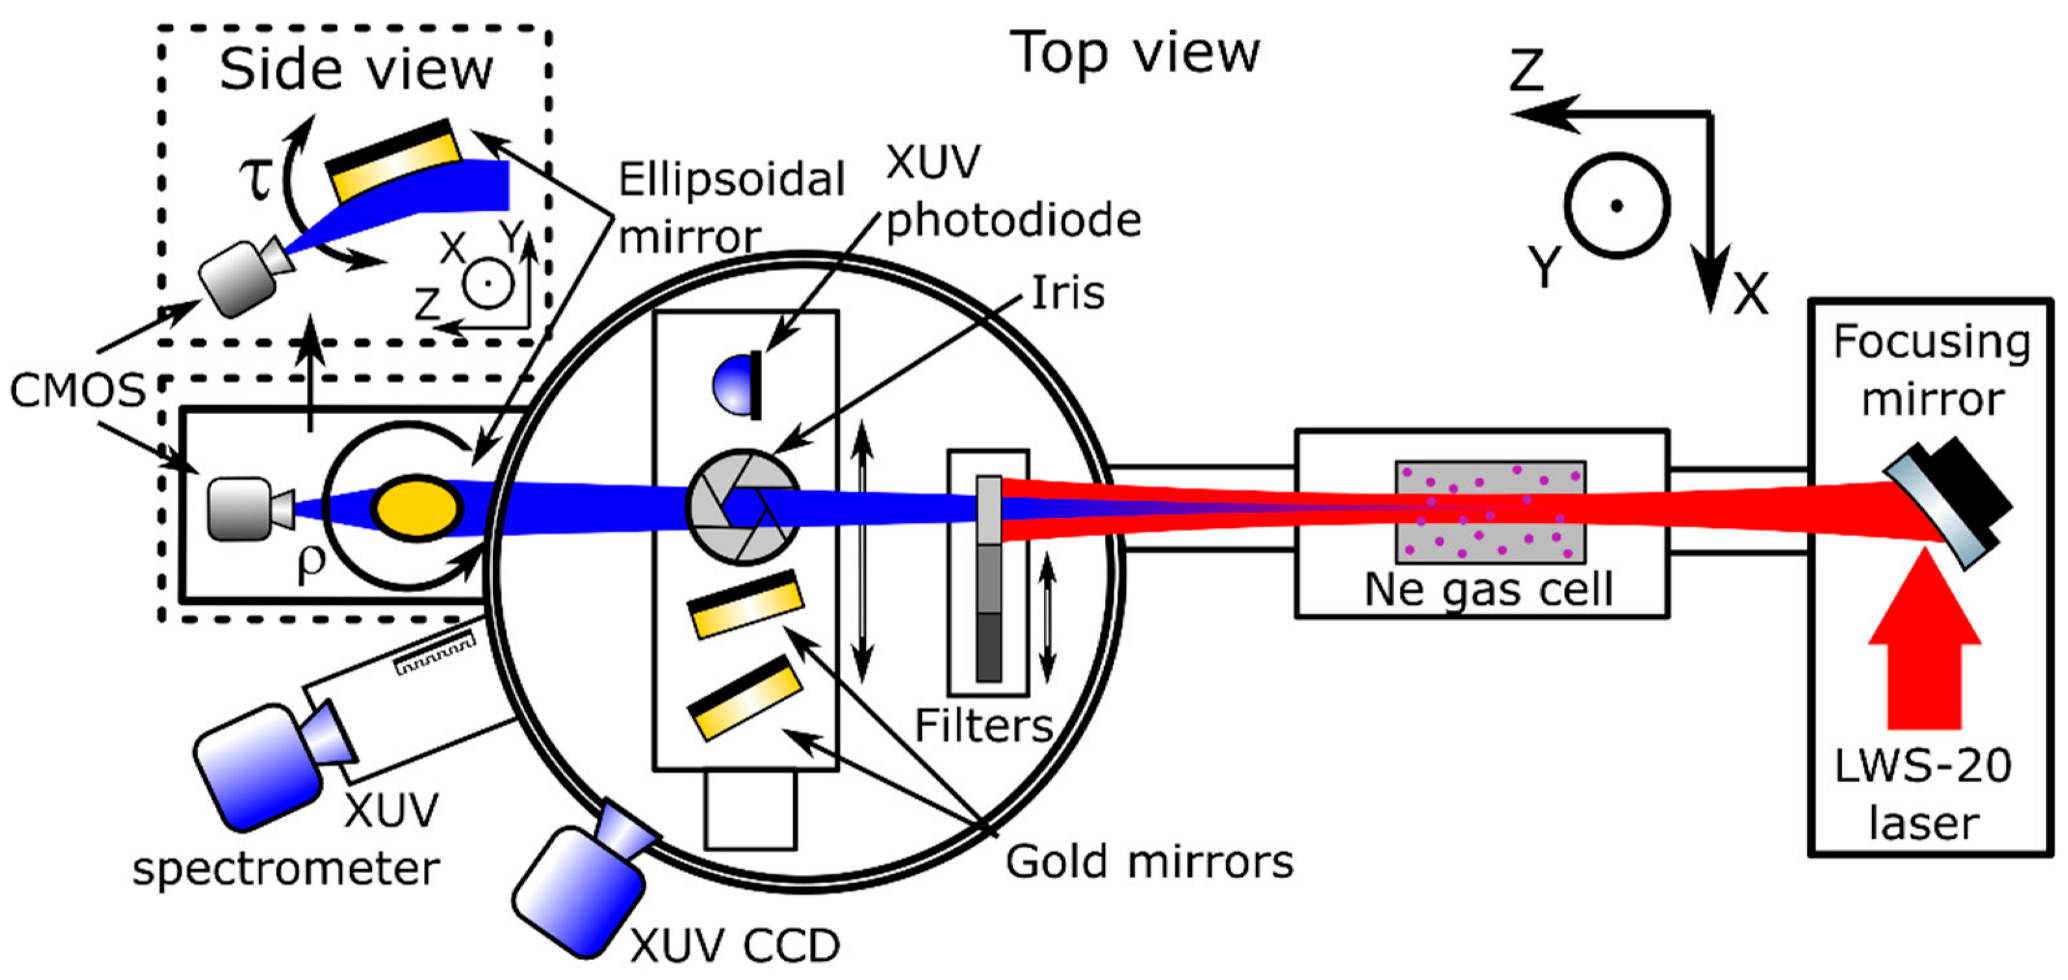
For these high-harmonic generation (HHG), characterization, and focus optimization experiments the attosecond beamline of the Relativistic Attosecond Physics Laboratory at Umeå University was used (see Figure 1). This beamline applies an energy upscaling approach for HHG in gas medium [24,25]. With this approach, the sub-5-fs > 10 TW pulses of the laser, the Light Wave Synthesizer 20 (LWS-20), are utilized to generate intense isolated attosecond pulses with a spectrum up to 150 eV [26].
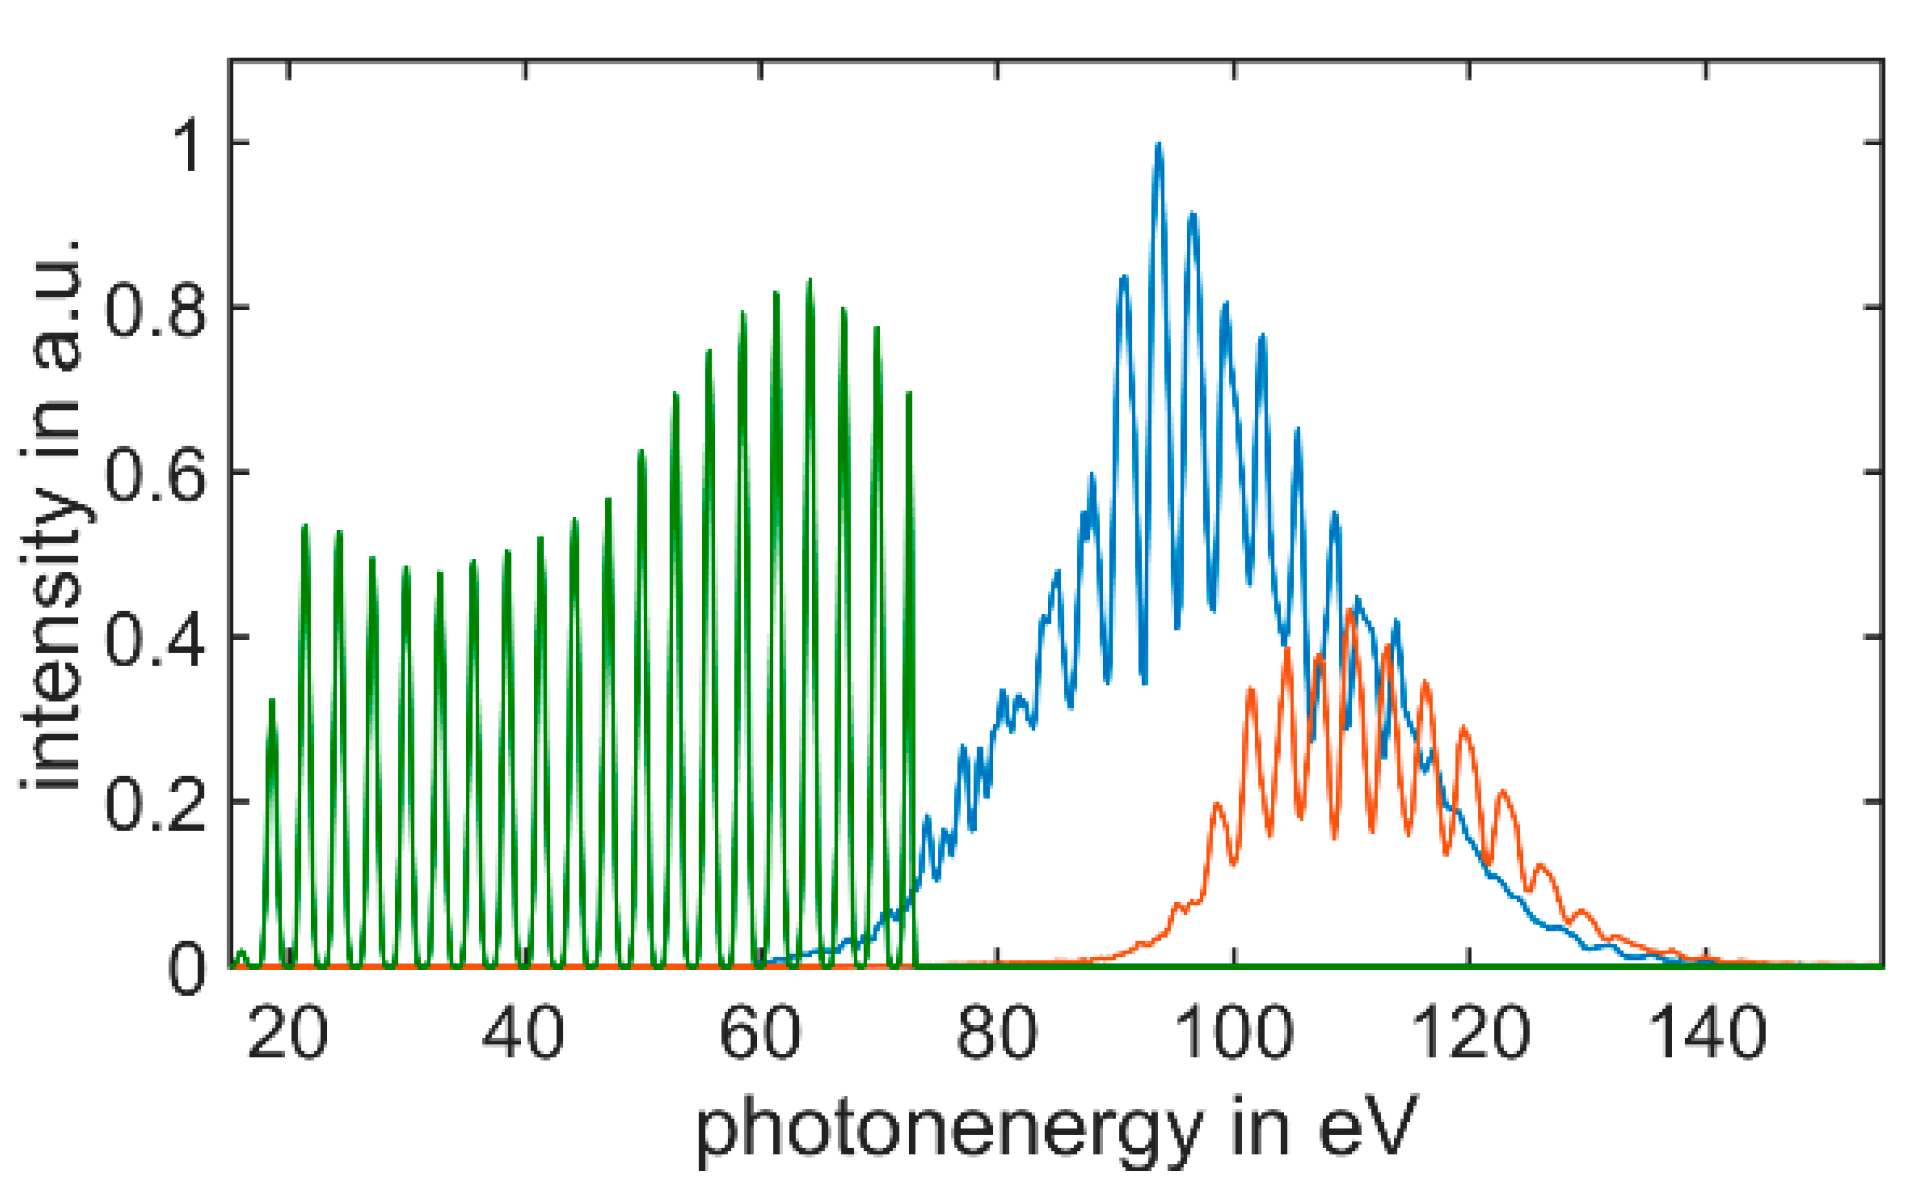
After generation, the fundamental of the laser was suppressed with thin metal foils. These metal foils act also as filters in order to investigate the behavior of the focus as well as the behavior of the detection method at three different photon energy ranges. The following filter combinations were used: 3× 150 nm Zr: ≈65–150 eV; 2× 150 nm Zr + 1× 100 nm Pd: ≈95–150 eV; 2 × 500 nm Al: ≈18–73 eV [27]. These energy ranges will further be referred to as Zr window, Pd window, and Al window, respectively. The XUV source provides attosecond pulse energies directly at the source of 40 nJ in the Zr window, 20 nJ in the Pd window, and 30 nJ in the Al window, which was determined with an XUV photodiode [15,28]. The spectrum of the XUV source for the Zr window and the Pd window is shown in Figure 2. In addition to the spectrum and the pulse energy, the profile of the XUV pulses was measured with an XUV CCD camera (Andor, iKon), giving a full width at half maximum (FWHM) beam diameter of ≈1.5 mm for all three cases.
After spectral filtering, the XUV pulses were focused with a gold-coated ellipsoidal mirror (Standa) in grazing incidence geometry. The focal lengths of this mirror were 14,500 mm on the incidence side and 125 mm on the exit side, and the grazing incidence angle was 8°.
Considering the transmission of the filter combinations (Zr: 8%, Pd: 3%, Al: 4%) and the reflectivity of all mirrors in the XUV beamline (there were two more grazing incidence mirrors in front of the metallic filters, which are not show in Figure 1), the energies on target were 2 nJ, 1 nJ, and 1 nJ for the Zr, Pd, and Al windows, respectively. The main cause of this low transmission was the metal filters, which have reduced transmission due to a thin oxide layer on their surfaces. The transmission of the filters was experimentally determined. New filters would increase the focused energy [27]. In experiments where high intensity is needed, e.g., ionization studies with the attosecond beamline, the use of only one metal filter is enough, which boosts the transmission by almost a factor of 10. However, for the characterization of the XUV focus, which is described in this article, the suppression of the fundamental laser radiation has to be high, and therefore, the filter combinations according to the Zr window, the Pd window, and the Al window are necessary.
For the detection and optimization of the XUV focus, a low-budget CMOS camera with a pixel size of 1.85 µm was used (Flir, BFS-U3-120S4M-CS Blackfly S USB3, Mono). The ion microscope that is used in the focus for linear and nonlinear ionization measurements can be shifted out without breaking the vacuum to make space for the CMOS camera. There are two windows in front of the CMOS chip to protect this type of camera from dust. For the application in the XUV spectral region, those windows have to be carefully removed in order to enable the XUV photons to directly hit the surface of the sensor.
Furthermore, common CCD or CMOS cameras are not designed for the use in a vacuum environment. This can presumably negatively impact the performance of the camera and increase the backing pressure inside the vacuum chamber. However, after months of operation, the only negative impact of the vacuum environment on the camera that we have found is overheating. If the pressure in the vacuum chamber is <1 mbar, the cooling of the camera is not sufficient anymore and it slowly heats up. However, an increase in the noise level due to the higher temperature was not detected. After ≈30 min of continuous operation, the camera shuts down due to the temperature being too high. However, when unplugged, the camera cools down within <5 min and is useable again afterwards. No negative long-term effect for the camera has been observed from this operation. Minimal additional cooling, such as heat loss due to ≈1 mbar of gas or an extra small Peltier cooling, is already enough to prevent overheating completely. As in many other XUV experiments, the focal point of our XUV beam is located in an area, where it can interact with a localized gas source. Hence, the vacuum in this part is only on the order of 10−5 mbar. At this vacuum level, the backing pressure is not negatively influenced by the implementation of the camera. For an ultrahigh vacuum environment, this could be different; however, the focused XUV beam at the camera is extremely small, which provides an ideal opportunity for differential pumping, reducing the impact of the camera onto the vacuum even further.
3. Results and Discussion
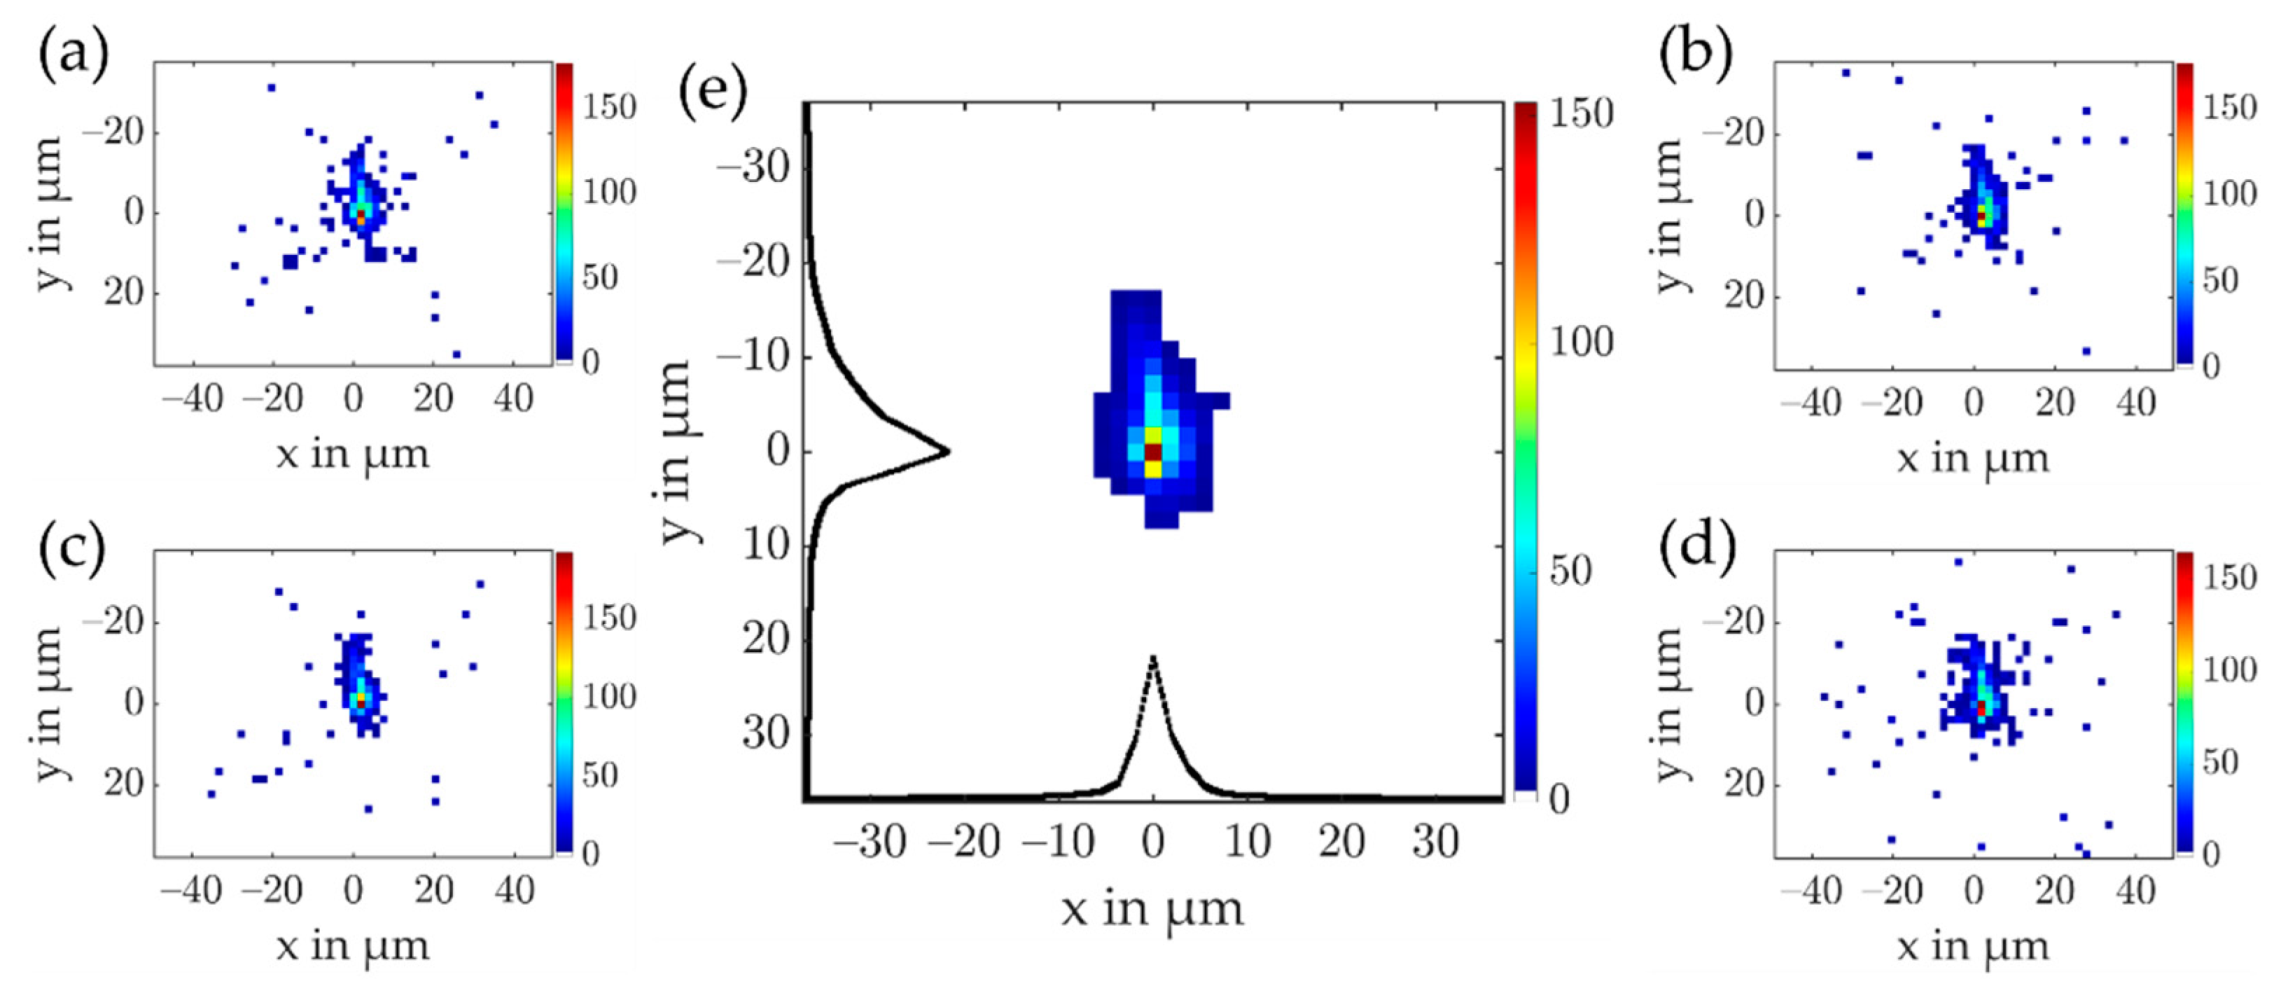
To minimize the effect of aberrations from the focusing mirror and achieve a small well-defined focus in the Zr window, the XUV beam diameter was reduced to ≈0.8 mm in the first test. The measured focus of this beam is shown in Figure 3. This illustrates that the CMOS camera is capable of measuring signals with ≈1 pixel in size and it does not show any unwanted effects such as blooming under these conditions. Although the iris clipped a significant part of the XUV beam, the signal-to-background ratio (ratio of maximum of signal to average of background) of a single-shot image was still 100, as is shown in Figure 3a–d. In this article, we used the signal-to-background ratio instead of the signal-to-noise ratio because the root mean square (RMS) noise was well below one count. The gain of the camera was set to 1.5× amplification—full amplification scale of the CMOS camera: 1×–16×. We estimated that 44 electrons give one count at an amplification of 1×, and one photon with the central energy in the Zr window (100 eV) makes 27 electrons. The FWHM beam sizes of the x and y projections were 1.9 × 5.6 µm, while the equivalent circle FWHM diameter was 3.6 µm, which are resolution limited. We thereby defined the equivalent circle diameter as the diameter of a circle with the same area as the sum of the area of all pixels with more or equal 50% of the maximal intensity. Furthermore, we defined the energy content above half maximum as the energy in this region divided by the total energy. The energy content above the half maximum with closed iris was 25%.
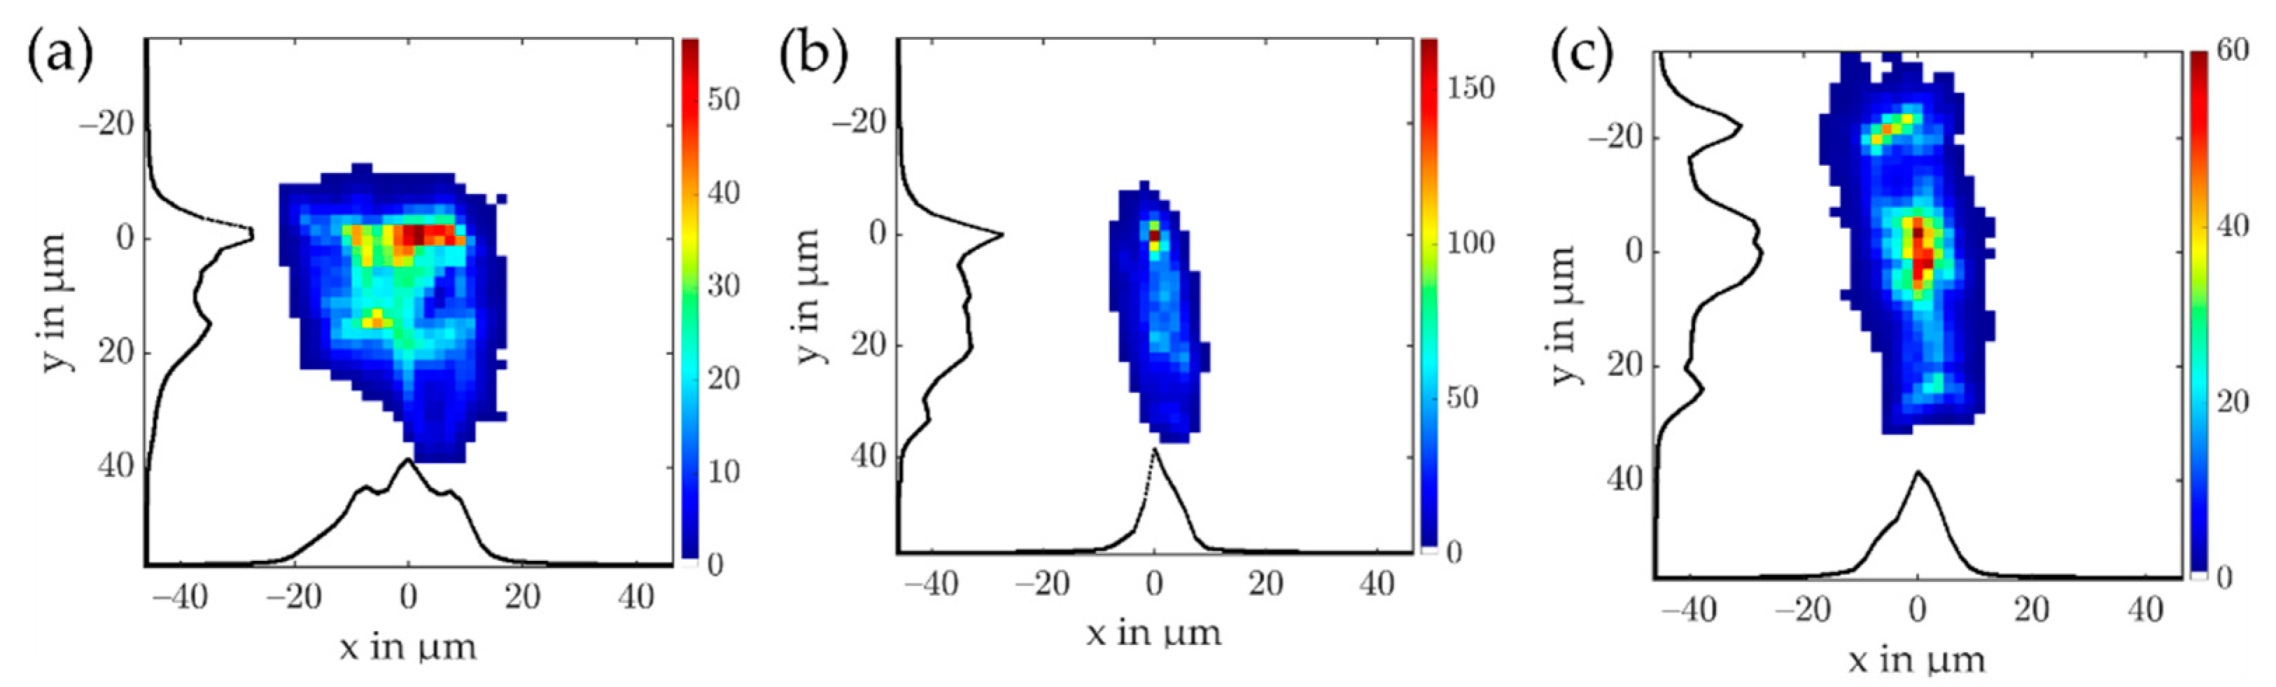
With a fully open iris and the full energy of the Zr window, the gain of the CMOS camera had to be reduced to 1.1× amplification to avoid saturation with the XUV signal from a single laser pulse. Furthermore, the signal-to-background ratio increased to 150. Figure 4b shows the measured image of this XUV focus. The focus was slightly elongated in the downwards direction. We infer that this was caused by imperfections of the ellipsoidal focusing mirror, which produce aberrations in the XUV beam. Although the intensity of the signal from these aberrations was on average 10 times weaker than the main signal, it was still easily detectable. The FWHM beam sizes of the x and y projections were 7 × 26 µm, while the equivalent circle FWHM diameter was 3.6 µm. This result also shows that the measurement of the projections is sometimes misleading, even if both projections are observed. The energy content above the half maximum was 11%.
The high sensitivity of the CMOS camera allowed for the measurement of the XUV beam profile outside of the focus. Figure 4a,c shows two such beam profiles measured 1 mm in front of and 1 mm behind the focus. Due to the high signal-to-background ratio and the resolution of 1.85 µm, very fine and weak structures can be identified in those images. The aberrations introduced by the ellipsoidal mirror generated up to two side peaks in the profiles close to the focus, which were relevant to the open iris. It should be mentioned that typical XUV sources based on HHG have ≈100 times less pulse energy than the attosecond beamline we were using for this experiment. This decreases the signal-to-background ratio for a single-shot acquisition, especially for measurements outside of the focal plane. However, the repetition rate of those sources is typically at least 100 times higher. Hence, an image with a good signal-to-background ratio can still be acquired within less than a second.
Due to this short acquisition time, the images from the CMOS camera are ideal as feedback for the alignment of the ellipsoidal mirror. Furthermore, the camera detects the 2D image of the focus without any projection. Hence, cylindrical symmetry does not need to be assumed, and the errors that are caused by this assumption are fully avoided. For example, for the focus image of Figure 4b, the projection along the y-axis hid the elongation of the focus in the downwards direction, whereas the projection along the x direction indicated a significantly larger focus than it actually was. All following measurements were made with a fully open iris.
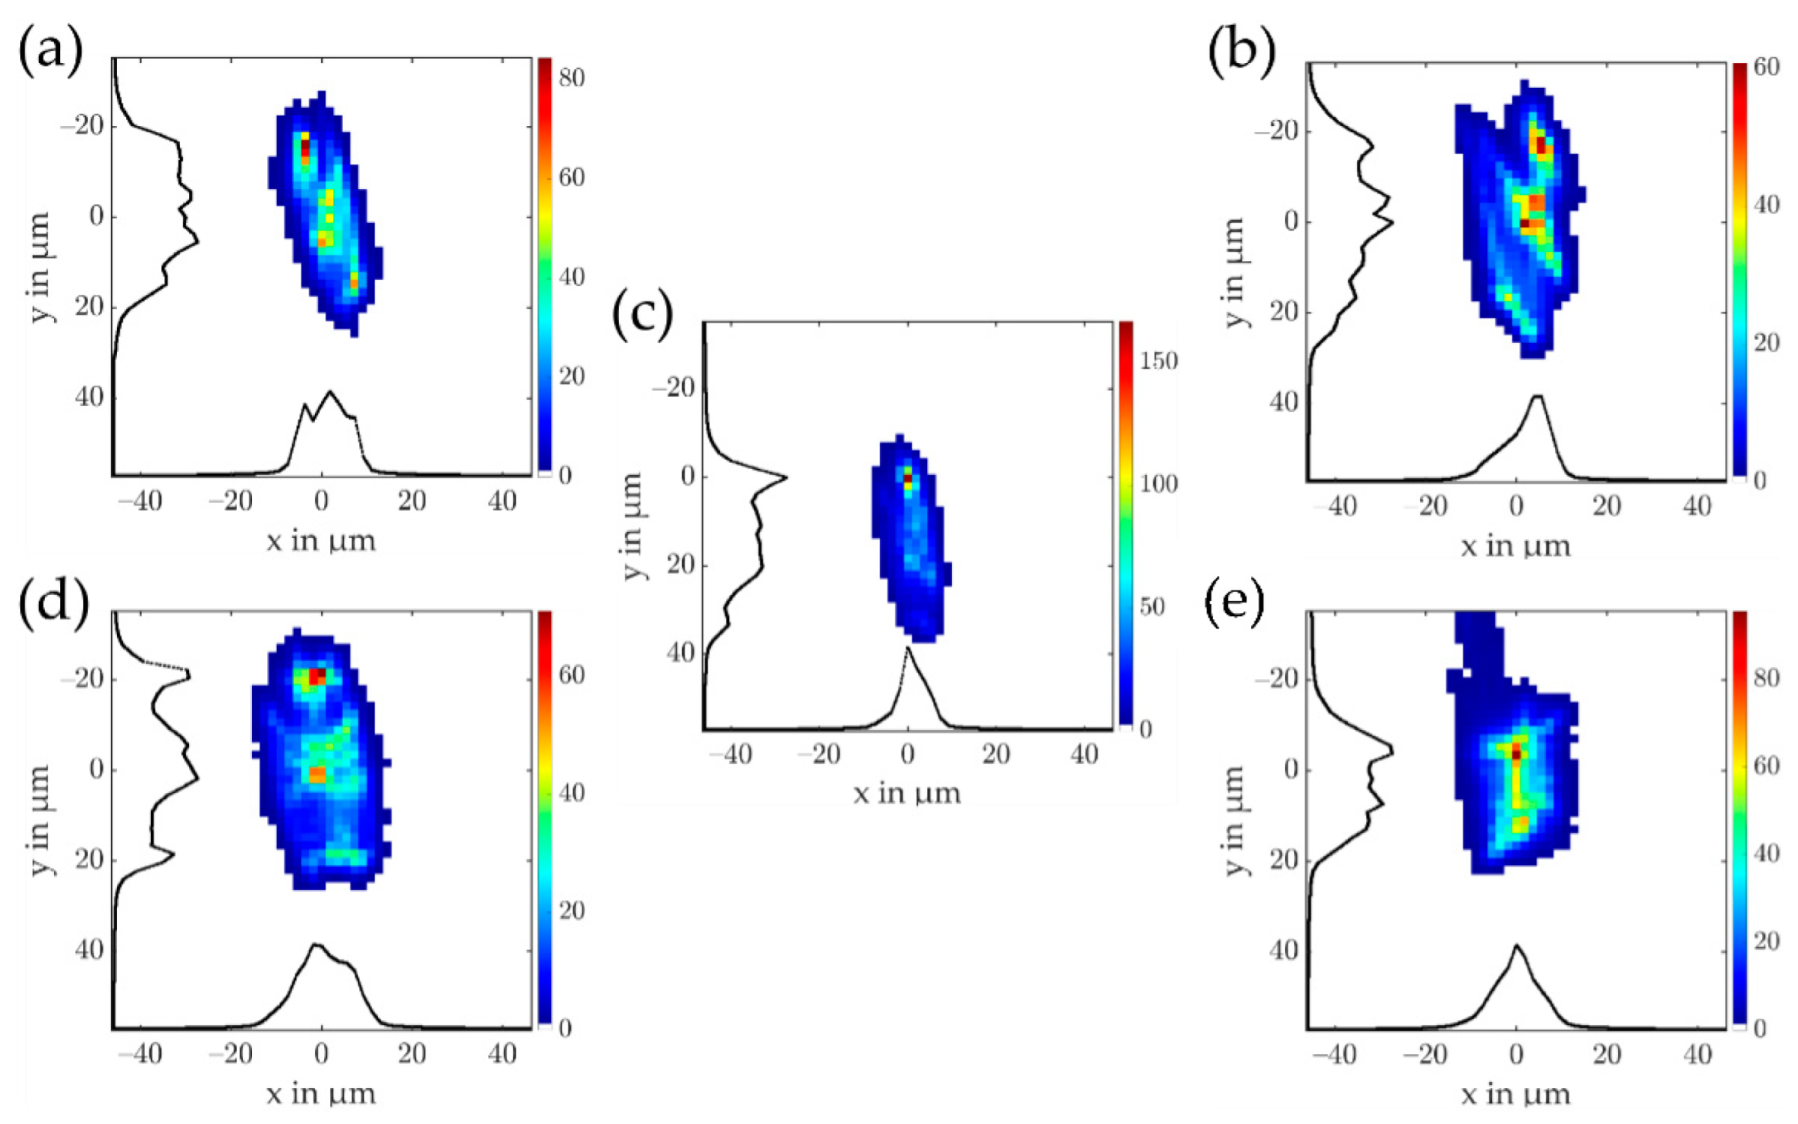
For the focal measurements presented in this article, the ellipsoidal mirror was aligned in a way that the peak intensity in the images was maximized for the focal plane. The short wavelength and the short focal length made the alignment of the ellipsoidal mirror very sensitive. This is illustrated in Figure 5. Figure 5a,b shows the XUV beam profile at the focal plane with a misalignment of ±0.04° of the azimuth angle around the vertical axis (see Figure 2). As illustrated, this small misalignment led to approximately a factor of 2 reduction in peak intensity. The alignment of the grazing incidence angle was even more sensitive. A misalignment of ±0.015° led to a decrease of more than a factor of 2 in peak intensity at the focal plane. However, it has to be mentioned that the plane with the highest intensity changed for different alignments of the ellipsoidal mirror. This is especially valid for the grazing incidence angle. This entanglement of various alignment parameters means that multiple dimensions have to be scanned repeatedly during the optimization procedure [13]. Therefore, the fast characterization of the XUV focus with the CMOS camera is essential for the alignment.
To evaluate the performance of the CMOS camera for different spectral regions within the XUV and soft X-ray, the focus of the ellipsoidal mirror was also observed and optimized for the Pd window and the Al window. It is known that the wavefront of high harmonics can slightly change between the harmonic orders [23]. This was also observed in this experiment, as the optimal alignment of the ellipsoidal mirror was slightly different for Zr and Al windows.
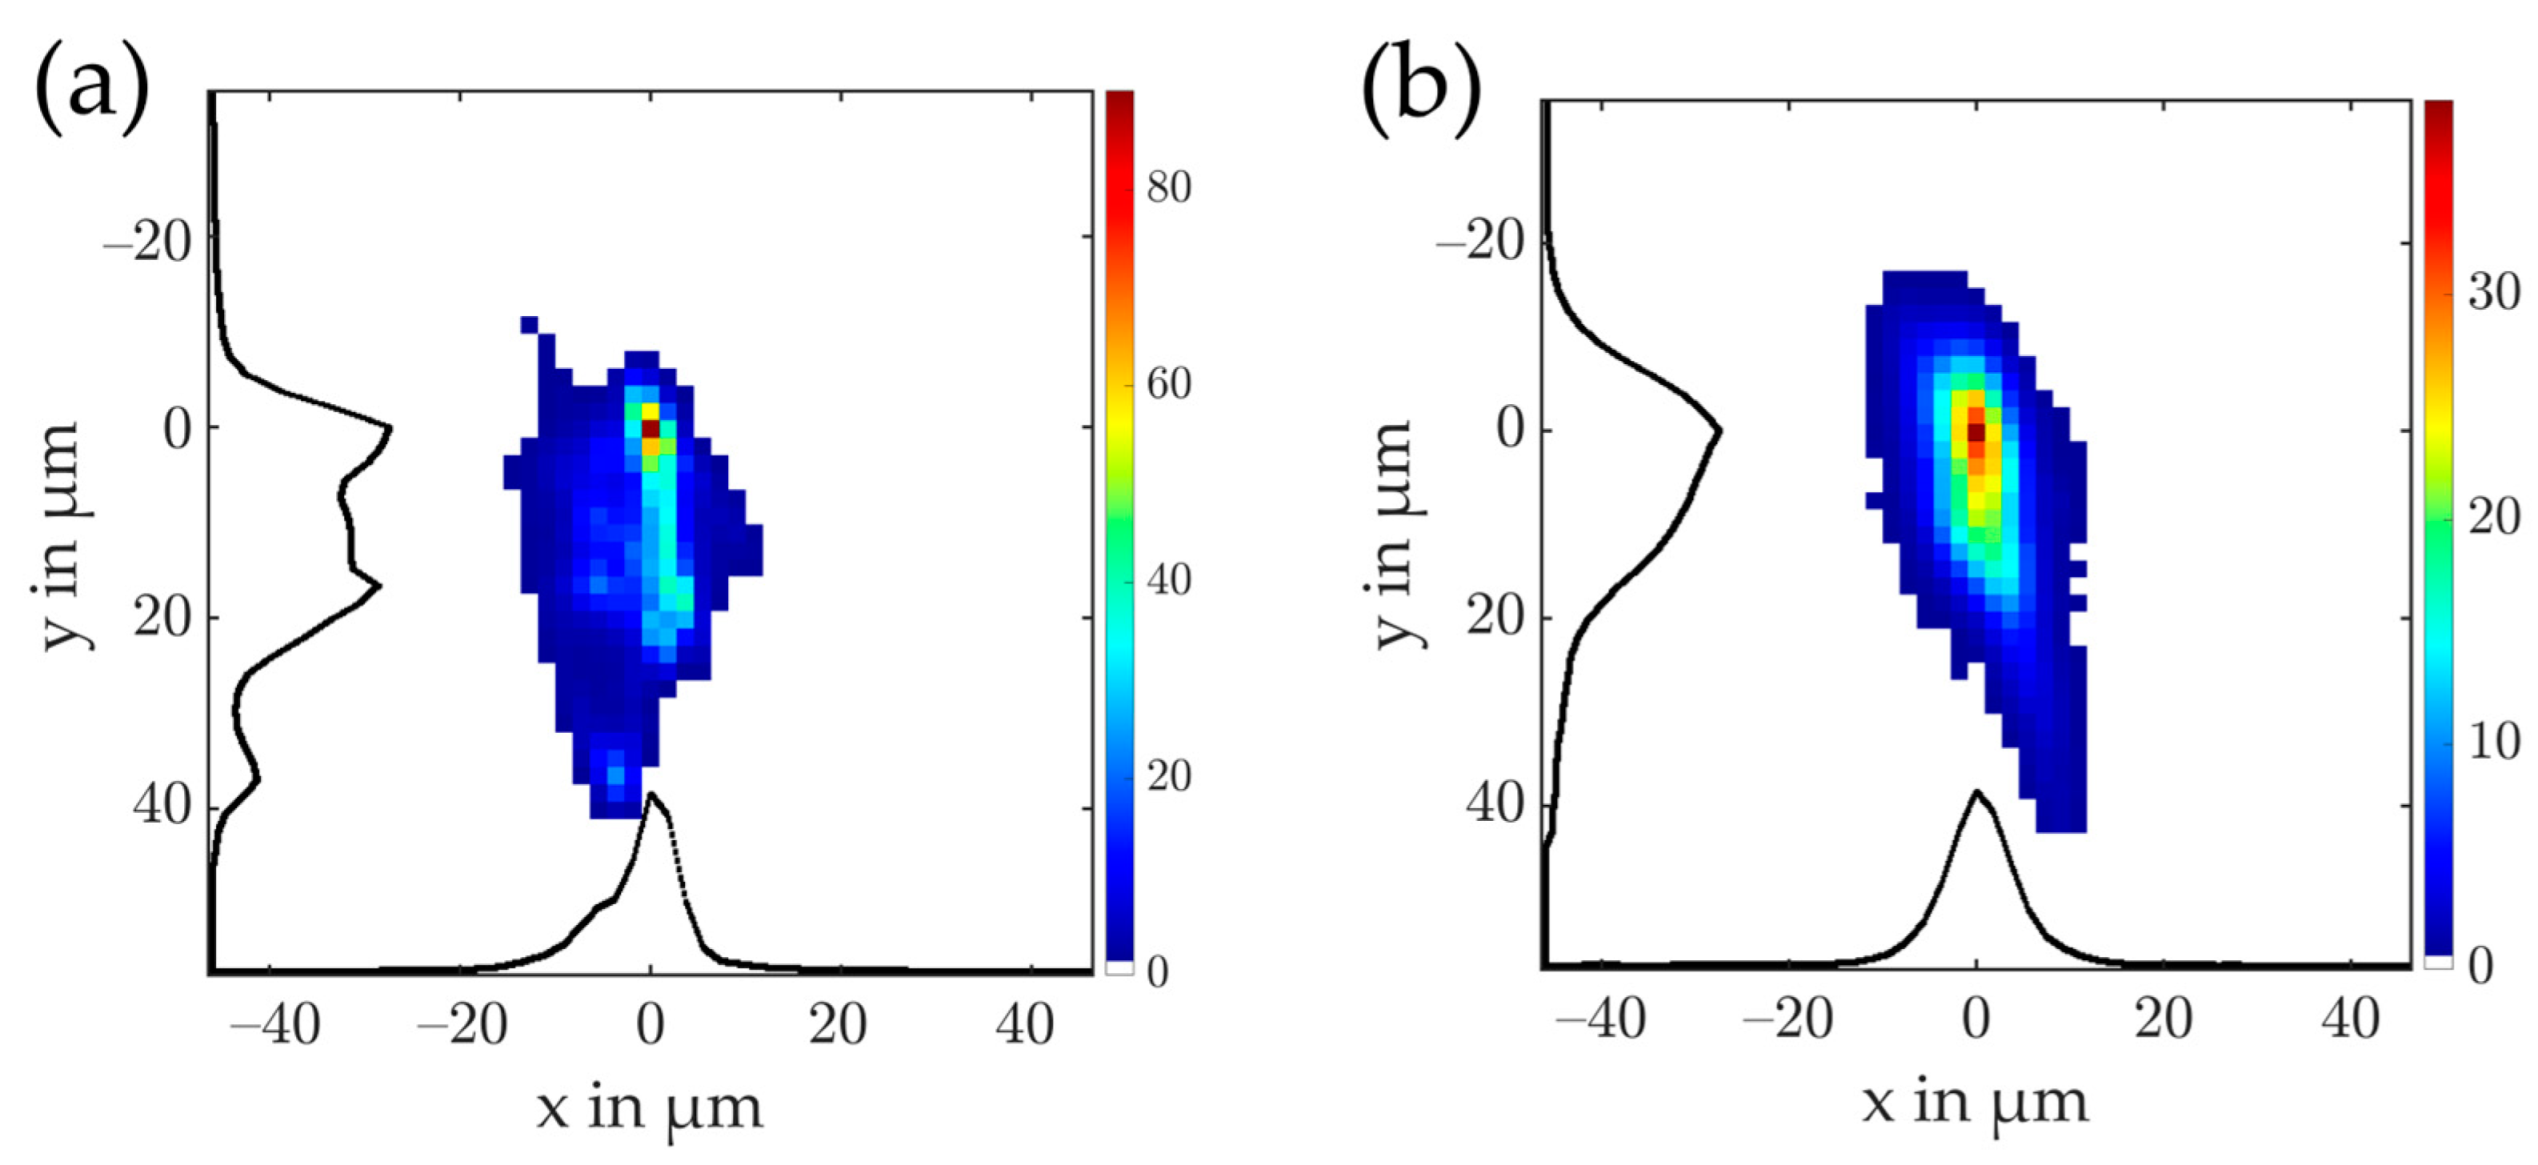
The optimized focus for the Pd window is shown in Figure 6a. The shape of this focus was very similar to the one of the Zr window. Furthermore, its peak intensity as well as its integrated signal was approximately a factor of 2 lower. This fits well with the energy measurements that were carried out with the XUV photodiode for the spectral region of the Pd window. This suggests that the spectral sensitivity of the camera did not change significantly between the spectral regions of the Zr window and the Pd window.
Figure 6b shows the optimized focus for the Al window. This focus was with an equivalent circle diameter of 10.3 µm significantly bigger than the focus of the Zr and Pd window and did not show up as sharp features. This can be explained by the higher diffraction limit of the (×3) lower central photon energy that is transmitted through the Al filters. The enlargement of the focus also increased the energy content above the half maximum to 25%. Furthermore, the intensity of the camera signal was much lower, and therefore, the images for the focus of the Al window had to be taken with the maximum gain of the camera (16× amplification of the signal). The signal-to-background ratio under these conditions for a single shot was 20.
To characterize the sensitivity of the CMOS camera in the Al window with respect to the Pd and Zr windows, the XUV energy on the camera with three Zr filters was compared to the XUV energy with two Al filters. The energy with the Al filters was thereby found to be 50 ± 10% of the one with the Zr filters. After correction for the different amplification and energy, it can be concluded that the sensitivity of the CMOS camera was approximately 10 times worse for the Al window than for the Zr and Pd windows. This was probably due to the structure of the CMOS camera chip.
4. Conclusions
We describe how a common CMOS camera can be easily modified to observe XUV and soft X-ray beams. It was demonstrated that the sensitivity of this camera was high enough to acquire single-shot images of an XUV focus. This is essential for the alignment of high-energy throughput grazing incidence focusing optics, which are used in synchrotrons; free electron lasers; and high-harmonic generation beamlines. Furthermore, the sensitivity of the camera was determined for three different spectral regions. Thereby, the sensitivity of the CMOS camera in the spectral region ranged from 95 to 150 eV, and 65–150 eV was similar, whereas the sensitivity for the spectral range from 18 to 73 eV was approximately 10 times reduced. Further improvement in spatial resolution is expected when utilizing the next-generation cameras with sub-micrometer pixel size [29].
Author Contributions
Conceptualization, A.A.M., A.D.A., and L.V.; methodology, A.A.M., and N.S.; formal analysis, A.A.M.; investigation, A.A.M., A.D.A., and N.S.; resources, L.V.; data curation, A.A.M.; writing—original draft preparation, A.A.M.; writing—review and editing, A.A.M., A.D.A., N.S., and L.V.; visualization, A.D.A.; supervision, L.V.; project administration, L.V.; funding acquisition, L.V. All authors have read and agreed to the published version of the manuscript.
Funding
L.V. acknowledges the support of the Swedish Research Council, Vetenskapsrådet (2019-02376, 2020-05111), Knut och Alice Wallenberg Stiftelse (2019.0140), and Kempestiftelserna (SMK21-0017).
Institutional Review Board Statement
Not applicable.
Data Availability Statement
Data available from the authors on request.
Acknowledgments
We thank Roushdey Salh for the technical support.
Conflicts of Interest
The authors declare no conflict of interest.
References
- Holt, M.; Harder, R.; Winarski, R.; Rose, V. Nanoscale Hard X-Ray Microscopy Methods for Materials Studies. Annu. Rev. Mater. Res. 2013, 43, 183–211. [Google Scholar] [CrossRef]
- Yamauchi, K.; Mimura, H.; Kimura, T.; Yumoto, H.; Handa, S.; Matsuyama, S.; Arima, K.; Sano, Y.; Yamamura, K.; Inagaki, K.; et al. Single-nanometer focusing of hard x-rays by Kirkpatrick–Baez mirrors. J. Phys. Condens. Matter 2011, 23, 394206. [Google Scholar] [CrossRef] [PubMed]
- Rudek, B.; Son, S.-K.; Foucar, L.; Epp, S.W.; Erk, B.; Hartmann, R.; Adolph, M.; Andritschke, R.; Aquila, A.; Berrah, N.; et al. Ultra-efficient ionization of heavy atoms by intense X-ray free-electron laser pulses. Nat. Photonics 2012, 6, 858–865. [Google Scholar] [CrossRef]
- Tiedtke, K.; Azima, A.; von Bargen, N.; Bittner, L.; Bonfigt, S.; Düsterer, S.; Faatz, B.; Frühling, U.; Gensch, M.; Gerth, C.; et al. The soft x-ray free-electron laser FLASH at DESY: Beamlines, diagnostics and end-stations. New J. Phys. 2009, 11, 23029. [Google Scholar] [CrossRef]
- Haelbich, R.-P.; Kunz, C. Multilayer interference mirrors for the XUV range around 100 eV photon energy. Opt. Commun. 1976, 17, 287–292. [Google Scholar] [CrossRef]
- Hofstetter, M.; Schultze, M.; Fieß, M.; Dennhardt, B.; Guggenmos, A.; Gagnon, J.; Yakovlev, V.S.; Goulielmakis, E.; Kienberger, R.; Gullikson, E.M.; et al. Attosecond dispersion control by extreme ultraviolet multilayer mirrors. Opt. Express 2011, 19, 1767–1776. [Google Scholar] [CrossRef] [PubMed]
- Hofstetter, M.; Aquila, A.; Schultze, M.; Guggenmos, A.; Yang, S.; Gullikson, E.; Huth, M.; Nickel, B.; Gagnon, J.; Yakovlev, V.S.; et al. Lanthanum–molybdenum multilayer mirrors for attosecond pulses between 80 and 130 eV. New J. Phys. 2011, 13, 063038. [Google Scholar] [CrossRef]
- Mairesse, Y.; de Bohan, A.; Frasinski, L.J.; Merdji, H.; Dinu, L.C.; Monchicourt, P.; Breger, P.; Kovačev, M.; Taïeb, R.; Carré, B.; et al. Attosecond Synchronization of High-Harmonic Soft X-rays. Science 2003, 302, 1540–1543. [Google Scholar] [CrossRef]
- Poletto, L.; Frassetto, F.; Calegari, F.; Anumula, S.; Trabattoni, A.; Nisoli, M. Micro-focusing of attosecond pulses by grazing-incidence toroidal mirrors. Opt. Express 2013, 21, 13040–13051. [Google Scholar] [CrossRef]
- Mashiko, H.; Suda, A.; Midorikawa, K. Focusing multiple high-order harmonics in the extreme-ultraviolet and soft-x-ray regions by a platinum-coated ellipsoidal mirror. Appl. Opt. 2006, 45, 573–577. [Google Scholar] [CrossRef]
- Motoyama, H.; Iwasaki, A.; Takei, Y.; Kume, T.; Egawa, S.; Sato, T.; Yamanouchi, K.; Mimura, H. Broadband nano-focusing of high-order harmonics in soft X-ray region with ellipsoidal mirror. Appl. Phys. Lett. 2019, 114, 241102. [Google Scholar] [CrossRef]
- Coudert-Alteirac, H.; Dacasa, H.; Campi, F.; Kueny, E.; Farkas, B.; Brunner, F.; Maclot, S.; Manschwetus, B.; Wikmark, H.; Lahl, J.; et al. Micro-Focusing of Broadband High-Order Harmonic Radiation by a Double Toroidal Mirror. Appl. Sci. 2017, 7, 1159. [Google Scholar] [CrossRef] [Green Version]
- Bourassin-Bouchet, C.; Mang, M.M.; Delmotte, F.; Chavel, P.; de Rossi, S. How to focus an attosecond pulse. Opt. Express 2013, 21, 2506–2520. [Google Scholar] [CrossRef] [Green Version]
- Tzallas, P.; Bergues, B.; Rompotis, D.; Tsatrafyllis, N.; Chatziathanassiou, S.; Muschet, A.; Veisz, L.; Schröder, H.; Charalambidis, D. Time gated ion microscopy of light-atom interactions. J. Opt. 2018, 20, 024018. [Google Scholar] [CrossRef] [Green Version]
- Bergues, B.; Rivas, D.E.; Weidman, M.; Muschet, A.A.; Helml, W.; Guggenmos, A.; Pervak, V.; Kleineberg, U.; Marcus, G.; Kienberger, R.; et al. Tabletop nonlinear optics in the 100-eV spectral region. Optica 2018, 5, 237–242. [Google Scholar] [CrossRef] [Green Version]
- Senfftleben, B.; Kretschmar, M.; Hoffmann, A.; Sauppe, M.; Tümmler, J.; Will, I.; Nagy, T.; Vrakking, M.J.J.; Rupp, D.; Schütte, B. Highly non-linear ionization of atoms induced by intense high-harmonic pulses. J. Phys. Photonics 2020, 2, 034001. [Google Scholar] [CrossRef]
- Reese, M.; Schäfer, B.; Großmann, P.; Bayer, A.; Mann, K.; Liese, T.; Krebs, H.U. Submicron focusing of XUV radiation from a laser plasma source using a multilayer Laue lens. Appl. Phys. A 2011, 102, 85–90. [Google Scholar] [CrossRef] [Green Version]
- Hoflund, M.; Peschel, J.; Plach, M.; Dacasa, H.; Veyrinas, K.; Constant, E.; Smorenburg, P.; Wikmark, H.; Maclot, S.; Guo, C.; et al. Focusing Properties of High-Order Harmonics. Ultrafast Sci. 2021, 2021, 9797453. [Google Scholar] [CrossRef]
- Frassetto, F.; Trabattoni, A.; Anumula, S.; Sansone, G.; Calegari, F.; Nisoli, M.; Poletto, L. High-throughput beamline for attosecond pulses based on toroidal mirrors with microfocusing capabilities. Rev. Sci. Instrum. 2014, 85, 103115. [Google Scholar] [CrossRef] [Green Version]
- Benk, M.; Bergmann, K. Adaptive spatially resolving detector for the extreme ultraviolet with absolute measuring capability. Rev. Sci. Instrum. 2009, 80, 33113. [Google Scholar] [CrossRef]
- Waldecker, L.; Heissler, P.; Hörlein, R.; Allinger, K.; Heigoldt, M.; Khrennikov, K.; Wenz, J.; Karsch, S.; Krausz, F.; Tsakiris, G.D. Focusing of high order harmonics from solid density plasmas. Plasma Phys. Control. Fusion 2011, 53, 124021. [Google Scholar] [CrossRef]
- Valentin, C.; Douillet, D.; Kazamias, S.; Lefrou, T.; Grillon, G.; Augé, F.; Mullot, G.; Balcou, P.; Mercère, P.; Zeitoun, P. Imaging and quality assessment of high-harmonic focal spots. Opt. Lett. 2003, 28, 1049–1051. [Google Scholar] [CrossRef] [PubMed]
- Dacasa, H.; Coudert-Alteirac, H.; Guo, C.; Kueny, E.; Campi, F.; Lahl, J.; Peschel, J.; Wikmark, H.; Major, B.; Malm, E.; et al. Single-shot extreme-ultraviolet wavefront measurements of high-order harmonics. Opt. Express 2019, 27, 2656–2670. [Google Scholar] [CrossRef] [PubMed]
- Rivas, D.E.; Major, B.; Weidman, M.; Helml, W.; Marcus, G.; Kienberger, R.; Charalambidis, D.; Tzallas, P.; Balogh, E.; Kovács, K.; et al. Propagation-enhanced generation of intense high-harmonic continua in the 100-eV spectral region. Optica 2018, 5, 1283–1289. [Google Scholar] [CrossRef] [Green Version]
- Heyl, C.M.; Coudert-Alteirac, H.; Miranda, M.; Louisy, M.; Kovacs, K.; Tosa, V.; Balogh, E.; Varjú, K.; L’Huillier, A.; Couairon, A.; et al. Scale-invariant nonlinear optics in gases. Optica 2016, 3, 75–81. [Google Scholar] [CrossRef] [Green Version]
- Rivas, D.E.; Borot, A.; Cardenas, D.E.; Marcus, G.; Gu, X.; Herrmann, D.; Xu, J.; Tan, J.; Kormin, D.; Ma, G.; et al. Next Generation Driver for Attosecond and Laser-plasma Physics. Sci. Rep. 2017, 7, 5224. [Google Scholar] [CrossRef] [Green Version]
- Henke, B.L.; Gullikson, E.M.; Davis, J.C. X-ray interactions: Photoabsorption, scattering, transmission, and reflection at E = 50–30,000 eV, Z = 1–92. Atomic. Data Nucl. Data Tables 1993, 54, 181–342. [Google Scholar] [CrossRef] [Green Version]
- Muschet, A.A. Non-Linear Attosecond Physics at 100 eV. Ph.D. Thesis, Umeå University, Umeå, Sweden, 2021. [Google Scholar]
- Park, S.; Lee, C.; Park, S.; Park, H.; Lee, T.; Park, D.; Heo, M.; Park, I.; Yeo, H.; Lee, Y.; et al. A 64Mpixel CMOS Image Sensor with 0.50 μm Unit Pixels Separated by Front Deep-Trench Isolation. In Proceedings of the 2022 IEEE International Solid-State Circuits Conference (ISSCC), San Francisco, CA, USA, 20–24 February 2022; Volume 65, pp. 1–3. [Google Scholar]
Figure 1.
Experimental setup. The pulses from the LWS-20 laser system are focused with an f = 22 m mirror into a neon gas cell to generate high-order harmonics. Different XUV and soft-X-ray spectral regions are selected by thin metallic filters on a filter wheel. An XUV photodiode measures the XUV pulse energy, and a motorized iris sets the beam diameter. Gold mirrors can send the beam to an XUV CCD camera to determine the beam profile and to an XUV spectrometer. The ellipsoidal mirror focuses the XUV beam, and the focus is observed with a CMOS camera. X, Y, Z: define the coordinate system as it is used in the article; τ: grazing incidence angle of the ellipsoidal mirror; ρ: azimuth rotation angle of the ellipsoidal mirror. There are two additional flat grazing incidence mirrors in front of the filter wheel that are not included in this illustration.

Figure 2.
XUV spectrum of the attosecond beamline of the Relativistic Attosecond Physics Laboratory at Umeå University with 3× 150 nm Zr filters (blue), 2× 150 nm Zr + 1× 100 nm Pd filters (red), and 2× 500 nm Al filters (green). The spectrum with the Al filters was simulated using the transmission of the Al filters, and a plateau odd harmonic spectrum as the spectrometer was operating in a shorter wavelength range. The area below the Al spectrum was scaled to be 38% of the area below the Zr spectrum, corresponding to the energy in this region.

Figure 3.
Focus of the XUV beam in the Zr window with closed iris (≈0.8 mm). The resolution of the camera is only limited by its pixel size. (a–d) Four single-shot images. (e) Average of 300 single-shot images. The black lines indicate the horizontal and vertical projections of the 2D focal image with FWHM spot sizes of 1.9 × 5.6 µm. The equivalent circle FWHM diameter is 3.6 µm.

Figure 4.
Profiles of the XUV beam in Zr window in and around the focus position with fully open iris. (a) XUV beam profile 1 mm in front of the focus. (b) XUV beam profile at the focal plane. (c) XUV beam profile 1 mm behind the focus. A total of 300 single-shot images were averaged for each figure. The alignment of the ellipsoidal mirror was performed in a way that the peak intensity at the focal plane was maximized. The black lines indicate the horizontal and vertical projections of the corresponding 2D image. The x and y FWHM spot sizes of the projections in the focus were 7 × 26 µm.

Figure 5.
Profiles of the XUV beam at the focus position with different alignment of the ellipsoidal mirror. The rotation of the azimuth angle around the vertical axis was misaligned by (a) 0.04° and (b) −0.04°. (c) The ellipsoidal mirror was aligned to achieve maximum peak intensity. The grazing incidence angle was misaligned by (d) 0.015° and (e) −0.015° with respect to the optimum. A total of 300 single-shot images were averaged for each figure.

Figure 6.
Measurement of the XUV focus at different photon energy ranges. (a) Pd window (≈95–150 eV); (b) Al window (≈18–73 eV). The x and y FWHM spot sizes of the projections in the focus for the Pd window were 6 × 26 µm, and the equivalent circle diameter was 4.7 µm. For the Al window, the x and y FWHM spot sizes of the projections in the focus were 7 × 22 µm, and the equivalent circle diameter was 10.0 µm. A total of 600 single-shot images were averaged for each figure.

Publisher’s Note: MDPI stays neutral with regard to jurisdictional claims in published maps and institutional affiliations. |
© 2022 by the authors. Licensee MDPI, Basel, Switzerland. This article is an open access article distributed under the terms and conditions of the Creative Commons Attribution (CC BY) license (https://creativecommons.org/licenses/by/4.0/).
Share and Cite
MDPI and ACS Style
Muschet, A.A.; De Andres, A.; Smijesh, N.; Veisz, L. An Easy Technique for Focus Characterization and Optimization of XUV and Soft X-ray Pulses. Appl. Sci. 2022, 12, 5652. https://0-doi-org.brum.beds.ac.uk/10.3390/app12115652
AMA Style
Muschet AA, De Andres A, Smijesh N, Veisz L. An Easy Technique for Focus Characterization and Optimization of XUV and Soft X-ray Pulses. Applied Sciences. 2022; 12(11):5652. https://0-doi-org.brum.beds.ac.uk/10.3390/app12115652
Chicago/Turabian StyleMuschet, Alexander A., Aitor De Andres, N. Smijesh, and Laszlo Veisz. 2022. "An Easy Technique for Focus Characterization and Optimization of XUV and Soft X-ray Pulses" Applied Sciences 12, no. 11: 5652. https://0-doi-org.brum.beds.ac.uk/10.3390/app12115652
Note that from the first issue of 2016, this journal uses article numbers instead of page numbers. See further details here.