Article

Smart Phone-Based Motion Capture and Analysis: Importance of Operating Envelope Definition and Application to Clinical Use

1
Department of Medicine, Sarver Heart Center University of Arizona, Tucson, AZ 85724, USA
2
Department of Biomedical Engineering, College of Engineering, University of Arizona, Tucson, AZ 85724, USA
3
Arizona Center for Accelerated Biomedical Innovation, University of Arizona, Tucson, AZ 85724, USA
4
Department of Health & Rehabilitation Sciences, University of Nebraska Medical Center, Omaha, NE 68198, USA
5
Sarver Heart Center, Departments of Medicine and Biomedical Engineering, 1501 North Campbell Avenue, Bldg. 201E, Rm 5146, Tucson, AZ 85724, USA
*
Author to whom correspondence should be addressed.
Submission received: 16 September 2021 / Revised: 27 May 2022 / Accepted: 6 June 2022 / Published: 17 June 2022
(This article belongs to the Special Issue Biomechanics and Human Motion Analysis)

Abstract

:
Human movement is vital for life, with active engagement affording function, limiting disease, and improving quality; with loss resulting in disability; and the treatment and training leading to restoration and enhancement. To foster these endeavors a need exists for a simple and reliable method for the quantitation of movement, favorable for widespread user availability. We developed a Mobile Motion Capture system (MO2CA) employing a smart-phone and colored markers (2, 5, 10 mm) and here define its operating envelope in terms of: (1) the functional distance of marker detection (range), (2) the inter-target resolution and discrimination, (3) the mobile target detection, and (4) the impact of ambient illumination intensity. MO2CA was able to detect and discriminate: (1) single targets over a range of 1 to 18 ft, (2) multiple targets from 1 ft to 11 ft, with inter-target discrimination improving with an increasing target size, (3) moving targets, with minimal errors from 2 ft to 8 ft, and (4) targets within 1 to 18 ft, with an illumination of 100–300 lux. We then evaluated the utility of motion capture in quantitating regional-finger abduction/adduction and whole body–lateral flex motion, demonstrating a quantitative discrimination between normal and abnormal motion. Overall, our results demonstrate that MO2CA has a wide operating envelope with utility for the detection of human movements large and small, encompassing the whole body, body region, and extremity and digit movements. The definition of the effective operating envelope and utility of smart phone-based motion capture as described herein will afford accuracy and appropriate use for future application studies and serve as a general approach for defining the operational bounds of future video capture technologies that arise for potential clinical use.

1. Introduction

Motion is vital for human activities, contributing to the overall quality of life [1,2,3,4,5]. The ability to engage in physical activity is essential for good health and longevity, reducing the onset of a wide range of diseases including cardiovascular disease, hypertension, diabetes, and obesity, while enhancing overall resilience [1,6,7,8,9,10]. Motion and mobility, however, are often altered with increasing age, injury, and disease, contributing to morbidity and mortality. In older adults the ability to move functionally, e.g., completing activities of daily living, is a vital means of preventing decline, disability, and mortality, while preserving independence [1,2,11,12]. To foster personal, rehabilitative, and therapeutic engagement in motion activities, systems, and methods readily accessible to quantitate human motion will further enhance this goal. These tools will provide descriptors and metrics of motion, affording a means for evaluation and serial comparison, and personalization of training and therapeutic regimes [13,14,15,16].
A range of approaches presently exists for assessing and quantitating human motion. These may be broadly categorized as “around body” or “on body” systems. Around body systems include three-dimensional motion lab configurations utilizing wall mounted or similarly affixed cameras, with markers placed on the subject [15,16,17,18,19]. These systems track the subject and calculate motion and motion components via video image capture, digitization, and signal analysis [13,20]. 3-D motion capture technology has proven to be highly accurate in assessing biomechanical parameters of motion useful in the diagnosis of a variety of musculoskeletal and neurological conditions [15,16,19,21]. To further simplify this approach, advances have been made through the development of 2-D systems less reliant on complex fixed hardware [18,19,21,22,23]. Previous studies using 2-D images have developed 3-D skeleton models and renderings revealing body motion information, e.g., during walking employing a single KinectTM camera or while performing simple body poses using a single depth camera [24,25]. While real-time 3-D skeleton estimation from 2-D images is robust, additional validation and definition of their utility limits is needed before they can gain greater clinical acceptance [26]. Overall, while simpler to use, 2-D systems may have increased error and decreased accuracy under certain use conditions, making them less reliable for implementation in the healthcare setting [13,20,23]. Although there have been advances in computer technology related to improving the accuracy of 2-D systems in both marker-based and marker-less systems, 3-D marker-based systems are still considered the gold standard for the measurement of human biomechanical movement [27,28,29,30].
On body systems, in contrast, include a range of devices that are placed directly on the individual, i.e., on the torso, limb, or digit, with contained sensors. These include skin pendants, bracelets, and skin patch systems typically with contained accelerometers, gyroscopes, and related sensors [15,16,31,32,33,34,35]. These systems, while highly accurate, have the limitation of often requiring multiple sensors to be placed on a given body part to be measured, and require multiple devices to construct an overall motion description. Inertial measurement units (M/IMU) are another form of on-body systems that are being advanced that use a combination of accelerometers, gyroscopes, and/or magnetometers to obtain and quantify kinematic data [36,37]. However, while valid devices, more research is needed to advance the accuracy and utility of these systems for human kinematic assessment [36,37]. As such, a need exists for a simple system of motion capture and quantitation free from constraints of being formally fixed in place or needing multiple on-body devices that is readily accessible, with minimal hardware dependence, yet with great accuracy.
Recently, our team developed a smart phone-based motion capture system, termed Mobile Motion Capture (MO2CA), with an accuracy comparable to current fixed, lab-based motion capture systems [16]. MO2CA offers the advantage of simplicity, in that it utilizes a single smart phone-based camera combined with simple markers, functioning as a system for motion data capture, rather than a complex system with multiple cameras and trained personnel [16]. MO2CA also offers the advantage of ready access, in that smart phones are increasingly common affording access to a wide user and patient population, as well as readily integrating with telemedicine. In a recent study, we demonstrated the efficacy of the MO2CA system as to its ability to accurately capture variables of gait (stride length, stride time, stride length variability, and stride time variability) from twenty subjects over a range of speeds [16]. Yet, while this approach has been shown to be operative for tracking an individual walking on a treadmill at a short distance from the smart phone, the full distance range of efficacy and related parameters of use remain undefined. Further, as smart phone technology will continue to evolve, it is important to establish a simple means for assessment of smart phone-based motion capture that may be employed with future generation devices.
In this study, we extend our work and define and delineate the “operating envelope” of the MO2CA system as to the distance limit of target identification, resolution, and point-to-point discrimination under a range of conditions. We hypothesized that the MO2CA system will have a defined operative boundary and function with efficacy and accuracy over: (1) a defined range of distances, (2) a defined inter-target separation, (3) a defined motion speed, (4) and a range of illumination intensities, with an effective resolution to determine its practical utility. As a first step we defined the distance limit of the MO2CA system using small targets of varying sizes. We then increased the target number to a target pair to test the distance limit of point-to-point discrimination of the MO2CA system with a variety of target sizes and inter-target distances. Next, we determined the distance limit of the MO2CA system capturing an object in motion. We then defined the resolution of the MO2CA system to capture targets of differing colors under a range of illumination intensities. The definition of these specifications, operating range, and constraints further defines the boundaries of translational utility of this approach for future use in the clinic and the field, and outline a generalized strategy for validation of future motion capture technology for similar use. As a step towards the clinic, two protocols were also conducted to evaluate the efficacy of smart phone-based motion capture, utilizing recognized clinical diagnostic tests and maneuvers to demonstrate the translational applicability and utility of this approach for clinical medicine.

2. Materials and Methods

2.1. Materials

In conducting this study, we intentionally utilized readily available materials. These included: neon pink or neon green self-adhesive labels (“Up & Up” neon labels 1 × 2.75-inch, Target Corp., Minneapolis, MN, USA), flat wood stick (ruler, paint stick), ruler or tape measure, metronome, Apple iPhone 8, XR, or newer models, and the Lux Light Meter Pro Application for iPhone (Marina Polyanskaya, Moscow, Russia).

2.2. Video Capture

Video images for Protocols 1–5 were performed with the iPhone 8 or newer version. To assess the overall operating envelope of the MO2CA system four protocols were performed as outlined in the flowchart of Figure 1. Additionally, Protocol 5 was performed to examine the applicability of smart phone-based motion capture for use with clinical diagnostic testing maneuvers.

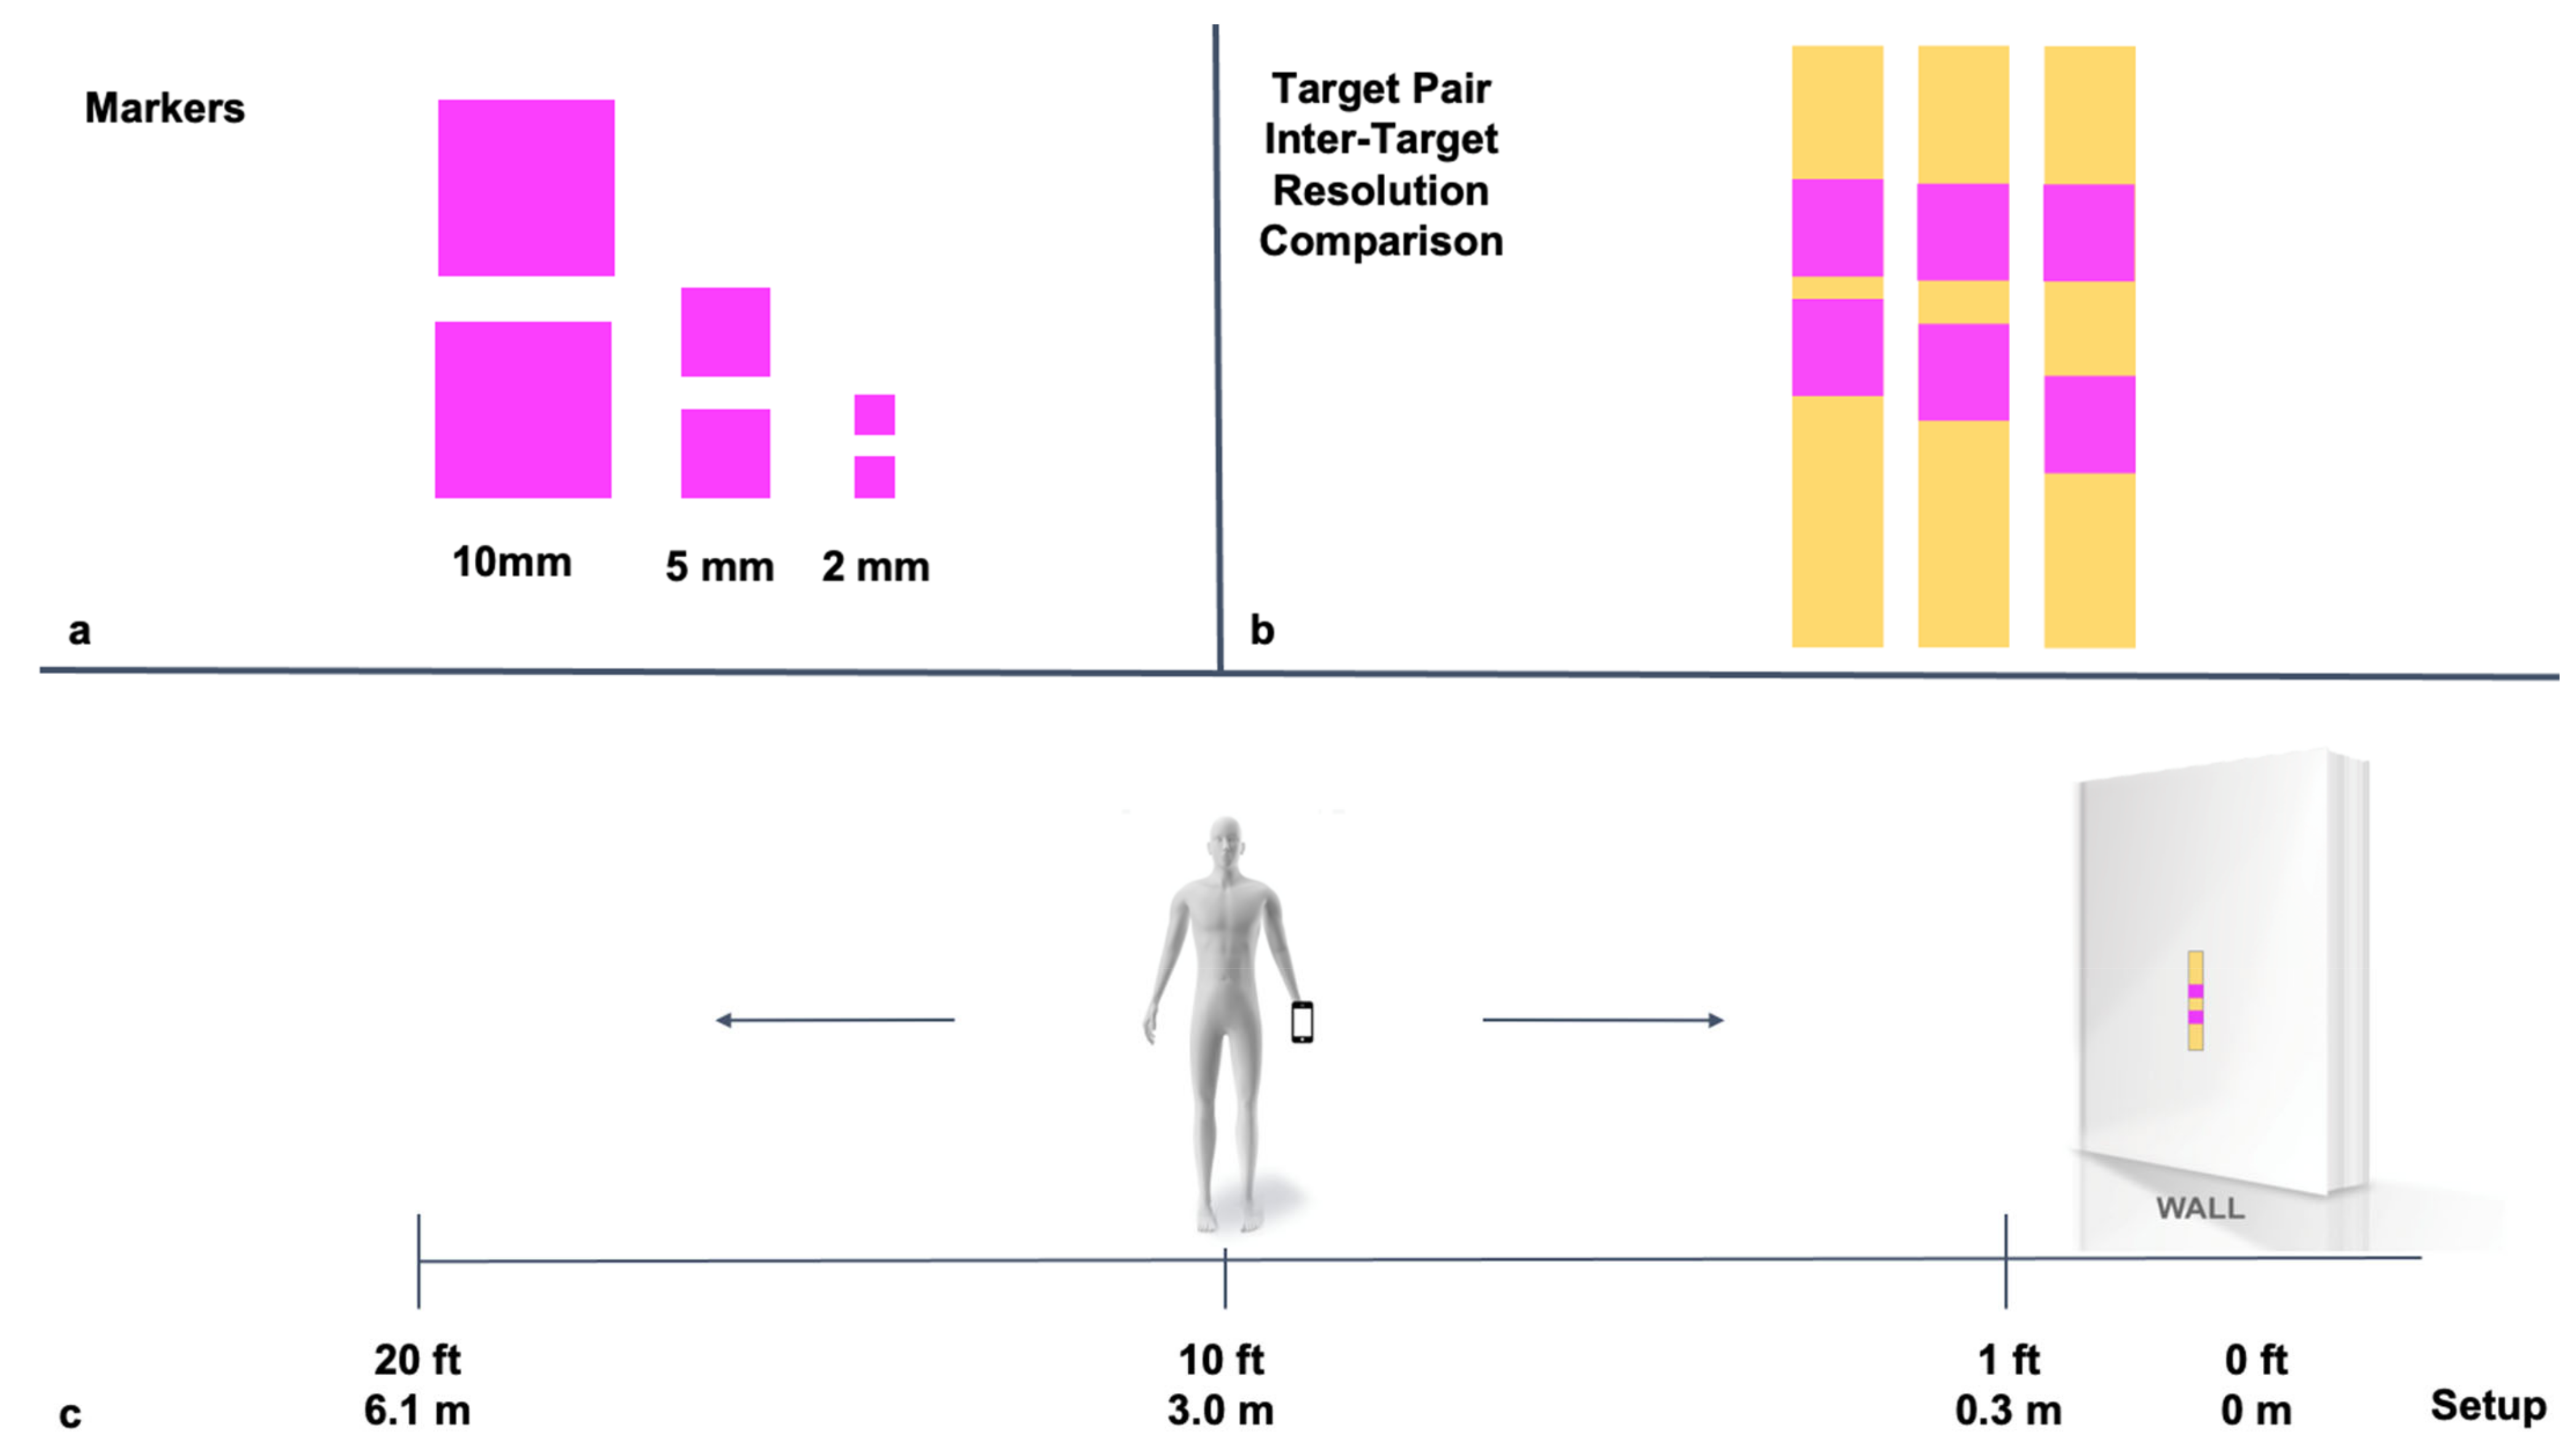
2.3. Protocol 1: Determination of Distance Limit of Target Detection

“Markers” were fabricated from colored self-adhesive labels. Neon green or neon pink squares of three differing sizes (2 × 2 mm; 5 × 5 mm; and 10 × 10 mm) were cut from self-adhesive label stock (Figure 2a). A single marker square was affixed to a flat wood stick as a single target (Figure 2b). A distance of 1 ft was then measured from the target and marked on the ground. The ground was marked at 1 ft intervals up to 20 ft away from the target. An Apple iPhone 8 (or newer version) was placed parallel to the target (handheld)-beginning 1 ft from the target and moved back progressively in increments of 1 ft up to 20 ft (Figure 2c). Photographs of an actual experimental setup and the accompanying raw data images are shown in Figure 3. At each distance a short video (5–10 s) was recorded of the image at 60 frames per second (fps) and in resolution of 1080p. At all times, care was taken to keep the phone parallel with the target and free of movement or vibration. The above sequence was performed for targets of each size (2 × 2 mm; 5 × 5 mm; and 10 × 10 mm). All procedures for each target size were performed in triplicate. Video images captured at each distance increment were processed and results plotted. The end point “distance limit of target detection” was defined as the distance at which the MO2CA system could not detect or identify the target reproducibly, i.e., a cut off distance, after image processing “Resolution” was defined as the minimal size of a target at a given distance from the camera that could be detected by the MO2CA system.

2.4. Protocol 2: Determination of Distance Limit of Target Pair Detection and Inter-Target Discrimination

Markers were fabricated as in Protocol 1 (Figure 4a). Two marker squares of the equal size, i.e., a “target pair,” were affixed to a flat wood stick as a “binary target” at a defined inter-marker spacing of 2 mm (Figure 4b). Sequential video clips were captured at 1 ft intervals, as the smart phone was progressively moved back in increments of 1 ft to 20 ft (Figure 4c) as in Protocol 1. The above sequence was performed for each size marker target (2 × 2 mm, 5 × 5 mm, and 10 × 10 mm). Note for the 2 mm marker the test range began at 0.5 ft extending to 20 ft, based on preliminary results indicating the utility of being closer to the camera. This process was repeated for each size marker target at inter-marker spacings of 5 mm and 10 mm as well. All procedures were performed in triplicate. Video images captured at each distance increment were processed and results plotted. The end point of “distance limit of paired target detection” was defined as the distance at which the MO2CA system could not detect or identify the target reproducibly after image processing. “Inter-target discrimination” was defined as the minimal inter-target spacing at a given distance from the camera that could be detected.

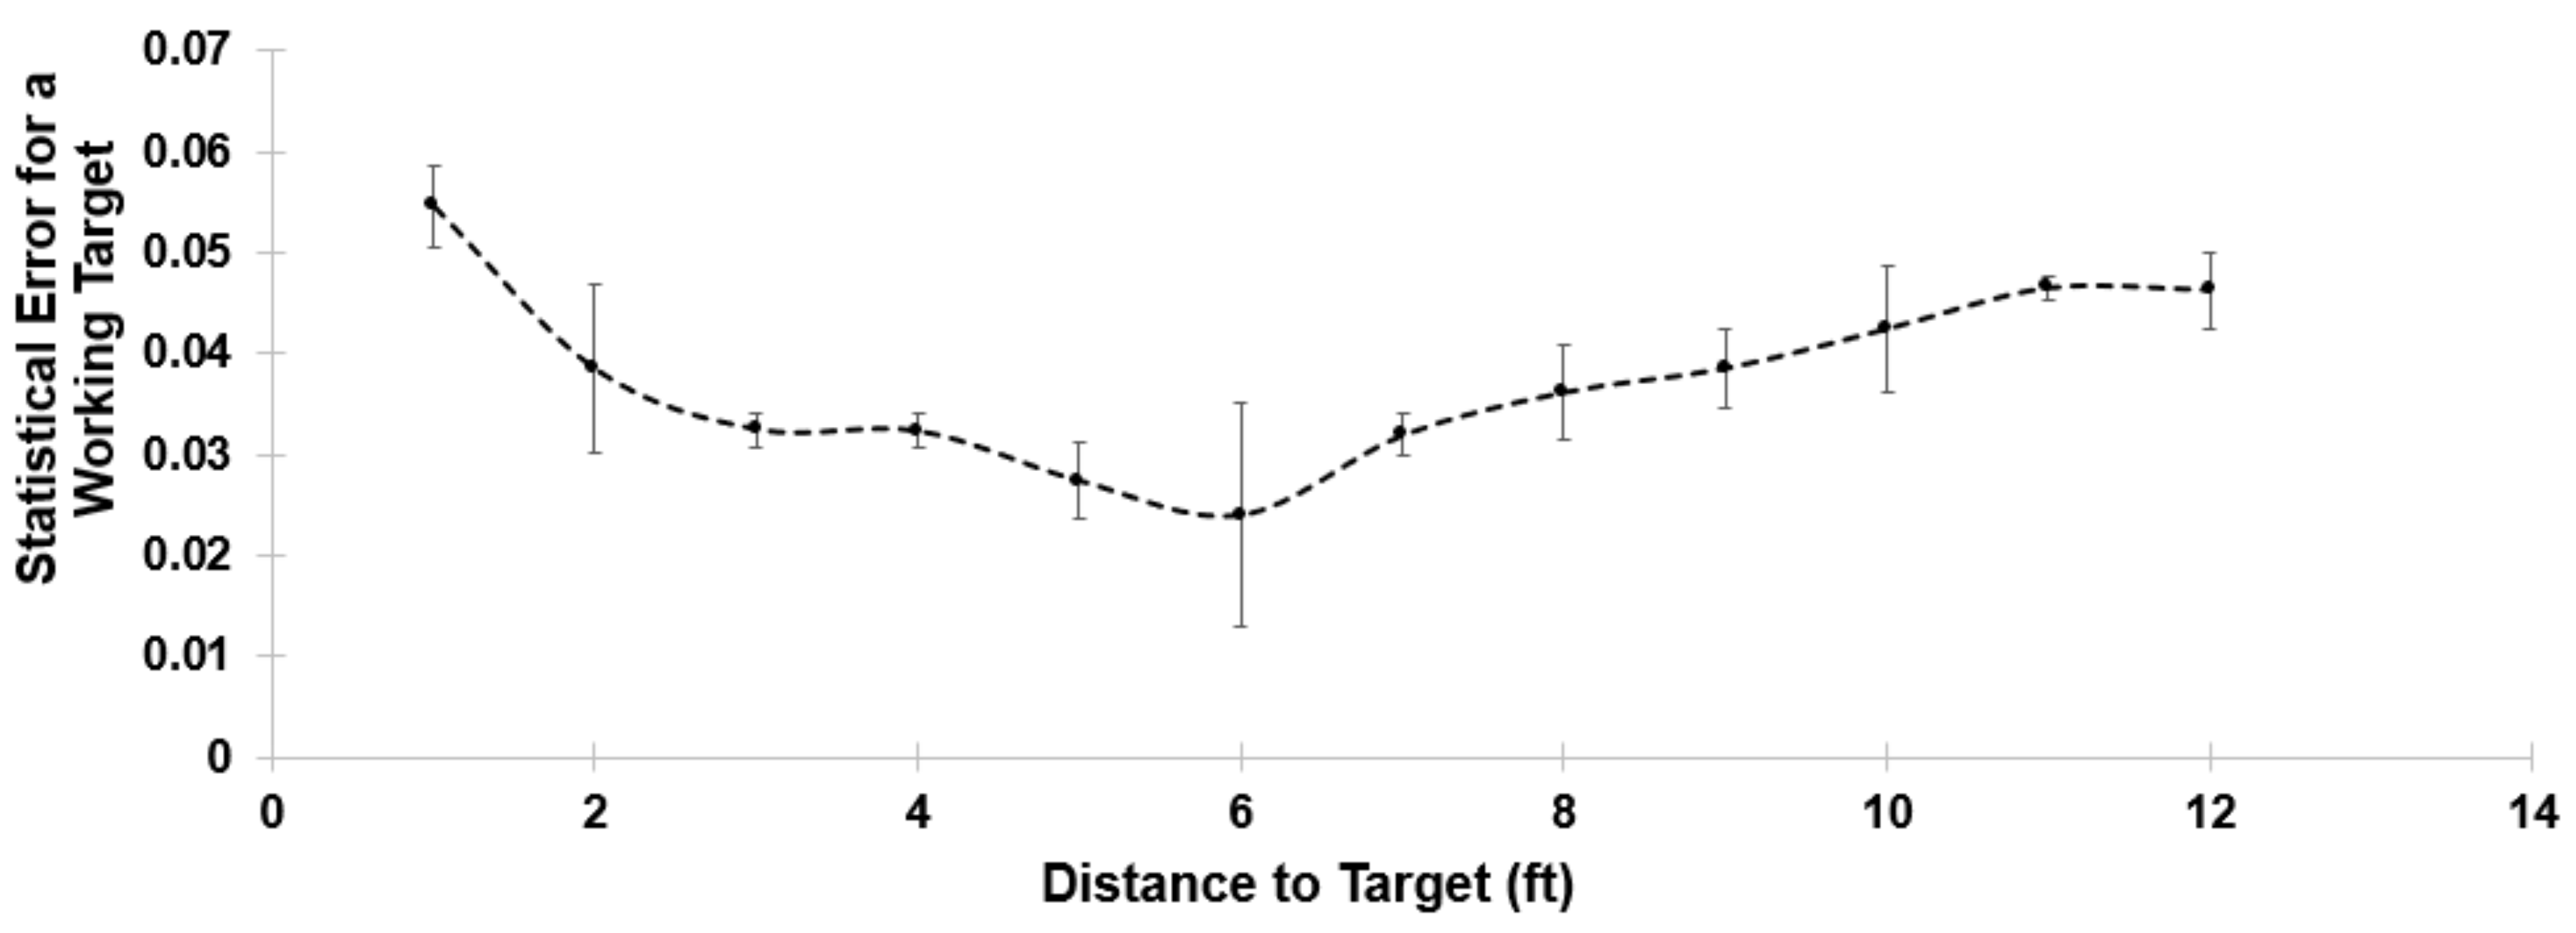
2.5. Protocol 3: Determination of Distance Limit of Moving Target Detection and Resolution (Working Distance)

For motion studies 10 × 10 mm neon pink and neon green squares markers, fabricated as above, were used (Figure 5a). A neon pink marker was affixed to the free tip of the swing arm of a metronome. A neon green marker was affixed to the non-moving base of the metronome just under the swing arm, to indicate the origin of the swing and determine the radius (Figure 5b). The metronome was set at 96 beats per minute (bpm). Sequential video clips were captured of the metronome with affixed markers, with the arm actively swinging at foot intervals as the smart phone was progressively moved back from the metronome in increments of 1 ft to 20 ft (Figure 5c) as in Protocol 1. The Apple iPhone 8 or newer version video capture rate utilized was 60 fps.
A full unidirectional pendulum swing from one endpoint to another endpoint, i.e., left to right, was termed one lap. A total of 10 laps were used to assess mobile target resolution. The swing angle of a lap was measured along with the radius (the difference from one endpoint to another endpoint in a horizontal direction) and both measurements were used to determine the physical circumference of the pendulum as per Formula (1)
Physical   circumference = ( 2 π r 90 360 )
Tracking circumference (the sum of displacements between each tracking point) was then calculated. Physical circumference and tracking circumference were used to calculate statistical error using Formula (2) as a measure of accuracy as follows:
Accuracy = | t r a c k i n g   c i r c u m f e r e n c e p h y s i c a l   c i r c u m f e r e n c e t r a c k i n g   c i r c u m f e r e n c e + p h y s i c a l   c i r c u m f e r e n c e |
The lower the error reported, the higher the accuracy of the MO2CA system at that distance.

2.6. Protocol 4: Determination of Effect of Illumination Intensity on Distance Limit of Target Detection and Resolution

To determine the effect of illumination intensity on marker detection and resolution, Protocol 1 was conducted exactly as detailed above, though under defined ambient light intensities in a home. Light intensity of the testing room was varied by opening/closing window blinds and turning on/off the halogen lights available in the room and measuring the average luminosity of the room using the Lux Light Meter Pro App (Figure 6a). These steps were completed to create a “bright room”, all lights on and blinds open, i.e., ~300 lux; a “natural light room”, only blinds open, i.e., ~200 lux; and a “dark room”, lights off and blinds closed, i.e., ~100 lux (Figure 6b). All experiments were performed in triplicate. Video images captured at each distance increment were processed and the results plotted (Figure 6c). The end points “distance limit of target detection” and “resolution” were defined as in Protocol 1.

2.7. Protocol 5: Application of Smart Phone-Based Motion Detection to Clinical Diagnostic Testing Maneuvers

To determine the applicability of smart phone-based motion detection in clinical assessment, two clinical maneuvers were evaluated, one for localized, regional body element motion, fingers/digits, and one for whole body motion, and whole-body bend/flexibility. For all motion maneuvers subjects specifically performed a maximum motion, i.e., maximum excursion, maneuver, defined as “normal.” Subjects also performed the identical maneuver, though with limited excursion, defined as “abnormal,” as a disease facsimile mimic. For regional element motion of the fingers, three 2 mm markers were placed on the subject, one marker on the distal interphalangeal joint of the second and third digits, and one in between the metacarpal phalangeal joints of the second and third digits. A video of finger adduction/abduction was recorded of the movement at 6 ft. Maximum measure of displacement and maximum angle of displacement were determined. For the whole-body element motion lateral bend flexure was assessed. Three 10 mm markets were placed on the subject, one marker at the inferior cervical spine, one marker at the inferior thoracic/superior lumbar spine, and one marker at the posterior tip of the acromion. A video of lateral bend was recorded of the movement at 5 ft. Maximum measure of displacement and maximum angle of displacement were determined. Two subjects were used for each movement.

2.8. Data Processing and Analysis

For all protocols, performed data processing and analysis via the MO2CA system was employed as previously reported [16]. In brief, in this approach, video images of markers, or subject with affixed markers, were captured via cell phone and captured images processed via MATLAB 2016b (MathWorks, Natick, MA, USA) and interfacing analytics routines. Captured videos were imported into MATLAB using “vision.VideoFileReader” and “vision.VideoPlayer” functions (MathWorks, Natick, MA, USA). Captured videos were converted into single frame images using a step function. The trajectories of virtual targets (neon green or neon pink) for each image frame were then tracked, based upon discrimination of color contrast. Specifically, depending on color (neon green or neon pink), the “imsubtract” function in MATLAB was utilized to extract out the target color. Additionally, the “im2bw” function was employed to adjust colors to grey scale. The target color was then clearly revealed by setting the target threshold. As a next step, a virtual coordinate was assigned to the virtual marker by using the centroid function. This virtual coordinate is defined as (0,0) at the most left-up corner of each picture. After that, each coordinate of the virtual target was written into an array that may be exported for further analysis in EXCEL format. The threshold identified targets and their relative location were then populated in Excel for further analysis. This method is integral in the MO2CA system to capture meaningful body motion of a subject remotely using smart phones and video-based data.

2.9. Statistical Analysis

All statistical analyses were processed via MATLAB 2016b (MathWorks, Natick, MA, USA). The following approaches were utilized for data analysis for each protocol.

2.10. Distance Limit of Target Detection and Target Resolution

A one-way repeated ANOVA measure and Pearson Correlations were used to understand the effect of target size on single target detection. Post-hoc testing via the Bonferroni method was used to identify significant differences between each group. The significant level was set at 0.05. The R-value was used to understand the relationship between target size and distance between target and smartphone.

2.11. Inter-Target Resolution

For inter-target distances of 2, 5, and 10 mm and different target sizes, three separate one-way repeated ANOVA measures and linear regressions were used to understand the effect of inter-target distance on inter-target identification in target sizes of 2 × 2, 5 × 5, 10 × 10 mm, respectively. Post-hoc testing via the Bonferroni method was used to identify significant differences between each group. The significant level was set to 0.05. The R-value was used to understand the relationship between the inter-target separation and target resolution.

2.12. Motion

Error was calculated as defined in the formula in methods above.

2.13. Illumination

For the two-color targets (neon green and pink), two separate one-way repeated ANOVA measures were used to determine the effect of illumination (100, 200, and 300 lumens, respectively) and linear regression was used to understand the effect of illumination on target identification. Post-hoc testing via the Bonferroni method was used to identify significant differences between each group. The significant level was set to 0.05. The R-value was used to understand the relationship between the effect of illuminations and the target resolution.

2.14. Clinical Utility Assessment

For finger separation/regional body, as well as for lateral bend/whole body motion protocols, obtained angles measured for repeat experiments were averaged and plotted.

3. Results

3.1. Target Resolution

Target size directly impacted the ability to resolve a target over the range of distances tested. In all cases, the MO2CA system was able to identify targets of each size (2, 5, and 10 mm), though with smaller targets having a shorter working distance range of detection. Specifically, the following working ranges of resolution were found: 2 mm = range of 1–6 ft, 5 mm = range of 1–13 ft, and 10 mm = range of 1–18 ft (Figure 7a; Supplementary Figure S1). In comparing functional distances between target sizes, a 5 × 5 mm target afforded a 50% greater working distance of resolution versus the 2 mm target, with a maximum distance of identification and a resolution of 12 ft (Figure 7a,b). Further, the 10 × 10 mm target demonstrated a 33% increase in operative distance over the 5 × 5 mm target, with the maximum distance of identification of up to 18 ft (Figure 7b; Supplementary Figure S1). A single-factor ANOVA indicated significant differences between the three groups (F (2,6) = 1027, p < 0.001), with a linear trend between the size of the target and the distance of identification (r2 = 0.99, p = 0.1). Post-hoc testing via the Bonferroni method indicated a significant difference in resolution between each group.

3.2. Inter-Target Discrimination and Resolution

For all target pairs tested, the MO2CA system was able to identify and discriminate between targets. Target pair discrimination was affected by both the size of the targets and the distance separating the two targets. Specifically, for all conditions tested, inter-target discrimination was best for larger targets, and under conditions of greater individual target separation within a target pair. Inter-target discrimination for each target size and each-inter target distance tested are described here, detailed in Table 1, and presented in Figure 8.
For 2 mm target pairs: inter-target resolution increased from 2.5 ft when placed 2 mm apart, to 4.7 ft for 5 mm apart, and to 5.2 ft for a placement of 10 mm apart (Figure 8a; Supplementary Figure S2). Analysis by single factor ANOVA indicated that there was a significant increase in the ability of the MO2CA to identify the 2 mm target pair as they were placed further apart (F (2,6) = 27.13, p = 0.001). Post-hoc testing via Bonferroni indicated significant differences between the 2 mm separation to both the 5 mm and 10 mm separation. However, no significant difference was observed between the 5 mm and 10 mm separation.
For 5 mm target pairs: inter-target resolution increased significantly (F (2,6) = 56.33, p < 0.001) from 2.7 ft when placed 2 mm apart, to 5.3 ft for 5 mm apart, to 7.7 ft for placement 10 mm apart (Figure 8b; Supplementary Figure S2). Post-hoc testing via the Bonferroni method indicated a significant difference in resolution between each group.
For 10 mm target pairs: inter-target resolution increased significantly (F (2,6) = 325, p < 0.001) from 4 ft when placed 2 mm apart, to 9 ft for 5 mm apart, to 10.7 ft for placement 10 mm apart (Figure 8c; Supplementary Figure S2). Post-hoc testing via the Bonferroni method indicated a significant difference in resolution between each group.
Each target size had a linear correlation as the distance of separation increased (2 mm target: r2 = 0.86, p = 0.34, 5 mm target: r2 = 0.98, p = 0.16, 10 mm target: r2 = 0.91, p = 0.27). Furthermore, statistical analysis by single factor ANOVA indicated a significant difference between groups when the different target sizes were compared to each other with the same distance of separation: 2 mm of separation (F (2,6) = 18.25, p = 0.0028), 5 mm of separation (F (2,6) = 73.5, p < 0.001), and 10 mm of separation (F (2,6) = 68.25, p < 0.001). Post-hoc testing via the Bonferroni method indicated that the 10 mm target was significantly different from both the 5 mm and 2 mm targets at all distances of separation, while the 2 mm targets and 5 mm targets were only significantly different from each other at 10 mm of separation.

3.3. Distance Limit of Moving Target Detection and Resolution (Working Distance)

The motion capture technology demonstrated the ability to track movement of a mobile target cyclically moving back and forth at 96 bpm. MO2CA successfully identified each individual revolution, out of a total of 10 revolutions per test of the moving target, over the range of 1 to 12 ft. Beyond 12 ft, MO2CA was unable to track each individual movement of the mobile target, with less than 10 revolutions being identified. The moving target had the greatest resolution, i.e., the lowest error rate, at 6 ft. The error was the highest at the extremes of distances studied, i.e., at 1 ft, and at 12 ft (Figure 9).

3.4. Illumination Intensity on Distance Limit of Target Detection and Resolution

MO2CA could identify pink and green targets over the range of lighting conditions tested. However, differences in the efficacy of the MO2CA to identify targets were significant based on the color of the target (pink vs. green) and the light intensity (100 vs. 200 vs. 300 lumens). The target resolution improved significantly for both the green (F (2,6) = 16.8, p = 0.0035) and pink (F (2,6) = 34.11, p < 0.001) targets as the light intensity increased (Figure 10; Supplementary Figure S3). The target resolution for a green target increased from an average of 9.3 ft (~100 lumens) to 12 ft (~200 lumens) to 12.7 ft (~300 lumens) as light intensity increased (Figure 10a, b). The target resolution for a pink target increased from 11.7 ft (~100 lumens) to 17.3 ft (~200 lumens) to 17.7 ft (~300 lumens) as the light intensity increased for the pink target (Figure 10c,d). For both the pink and green targets there were significant differences between 100 lux and 200 lux, as well as between 100 lux and 300 lux as indicated by post-hoc Bonferroni analysis. However, a significant difference did not exist between 200 lux and 300 lux (Figure 10b,d). While the pink target was able to be identified from a farther distance at all light intensities, the resolution of both pink and green targets trended linearly with light intensity (Pink: r2 = 0.89, p = 0.30, Green: r2 = 0.94, p = 0.21).

3.5. Application of Smart Phone-Based Motion Detection to Clinical Diagnostic Testing Maneuvers

To examine the utility of smart phone-based motion detection in clinical use, analysis was performed of two differing clinical maneuvers: finger abduction/adduction, determining distal hand, digit flexibility, and muscle function; as well as lateral flex, useful for assessment of axial and core flexibility, stability, and strength.

3.5.1. Finger Abduction/Adduction

For regional body motion and finger abduction, there was a clear difference in normal and abnormal maximum angle displacement (Max angle). For normal participants 22° (Figure 11a).

3.5.2. Lateral Bend

For whole body motion, a clear difference between the normal and abnormal groups was similarly detected using the approach described. In performing and evaluating lateral bend there was a clear difference between the normal max bend angle, and the abnormal bend max angle measured. The max angle averaged 33° for normal participants, whereas abnormal participants’ max angles averaged 18° (Figure 11b).

4. Discussion

The quantitation of human motion is a valuable tool for assessing an individual’s mobility status, and for guiding a movement training program to maintain, enhance, or restore function. The MO2CA system has been previously demonstrated to be effective at capturing and quantifying motion using a smart phone and small patch-like colored markers [16]. What has remained unknown to date has been the operating range and functional limits of this system. In the present study we herein defined these operating boundaries. We demonstrated that over a reasonable and practical range of working distances and lighting conditions this system was able to identify markers useful for the determination of the “range of motion” of an individual. Further, this system can also discriminate between marker pairs useful for defining motion differences between adjacent or near-body elements, e.g., adjacent fingers, over a useful operating distance range. We also determined that the system is effective in resolving and discriminating markers both at rest and during motion as well. Finally, we demonstrated the translational utility of motion capture for measuring regional and well as whole body motion associated with clinically useful diagnostic testing maneuvers.

4.1. Importance of Defining an Operating Range

Our overall and long-range goal in developing a smart phone-based motion capture and analysis system is to create a means that is accurate, effective over a wide distance range, mobile (not affixed to physical structures), readily deployable in a wide range of settings (e.g., home office, clinic, and field), made of readily available components keeping cost down, as well as user-friendly for both professional and patient. Further, in use, it should be adaptable to a spectrum of movement assessments for a range of applications. As such, as a first step we defined the operating limits of this system examining marker capture, identification, and discrimination over a range of working distances. Our study revealed that the MO2CA system can accurately detect and resolve markers over considerable distances, ranging from 0.5 ft to 18.5 ft. This overall operating range of >18 ft will allow the detection of markers when affixed to an individual that is useful for measuring the extent or range of motion associated with a wide range of activities and maneuvers.
A useful way to consider motion quantitation in the context of activities relates to the specific body or body movement and elements that are being measured. For our purpose we have divided these into three groups: 1. whole body movement, 2. large region or component movement, upper or lower extremity, and head, and 3. localized movement, e.g., digits and regions of the face. This categorization affords utility for a wide variety of applications. In the present study we first measured markers while static, i.e., serially, at defined positions in an experimental movement protocol. These were utilized here as facsimiles for positions associated with the extent of motion that may be encountered in real-world use scenarios of human movement. The extent of distances tested and verified to be effective will allow the use for determination of the range of motion associated with generalized health and wellness training and flexibility determination, as well as for specific diagnostic maneuvers utilized in medical practice. A table of representative uses is included herein (Table 2).
Following our static studies, we then extended our approach to specifically examine the utility of motion capture for clinically useful maneuvers as outlined in Table 2. In studying regional motion–finger abduction/adduction, and whole-body motion–lateral bend, we demonstrated clear discrimination afforded by this approach to detect and quantitate motion differences between normal and abnormal conditions.

4.2. Markers and Marker Size

In this study we chose to use specific markers with a defined shape rather than a marker-less strategy using body edges for position determination. While there have been advances in marker-less motion capture technology, with evidence of viability for use in human movement biomechanics, marker-based motion capture has long been considered the gold standard for tracking human movement [28,29]. The logic here was that markers allow for uniform, reproducible target identification, as opposed to great variability that may be encountered with body contours and edges. This also simplified the computational algorithms needed for detection, with uniform marker-accurate identification being less complex and more reliable than body and body component detection. For example, as limits and complicates facial recognition software and marker-less software [27,38]. In addition, a limitation of marker-based motion capture is generally cost, which we have been able to mitigate with the use of home products for marker construction and personal cell phones [28,29].
Our choice of marker shape related to the ease of detection of edges, with simple shapes being more readily and accurately identifiable versus complex shapes [39,40,41]. Marker size was also selected based on camera resolution relative to the distance from the camera, as well as for inter-marker discrimination. We observed a clear relationship between the marker size and the effective system operating range, with a 10 mm marker affording a 300% increase in the operating distance of target to camera, compared to a 2 mm marker. A practical consideration of marker size relates to the simplicity of affixing a marker to a given body location as well as to the discrimination between markers. Our choice of 2 mm to 10 mm was arrived at by balancing accuracy, operating range, and practicality.
To address the resolution and discrimination between markers we conducted the marker pair study, aimed at examining the translational utility of identifying differences in the extent of motion for closely situated digits, extremities, or body structures. As such, we tested a range of separation of 2 to 10 mm based on the anticipated use. For example, in the evaluation of range of motion of adjacent finger digits, smaller 2 mm markers are adequate without the marker obscuring movement or creating artifacts for visual detection. The finding that 2 mm marker pairs separated from 2 to 10 mm is accurately detected and discriminated, effectively up to 7.7 ft, reveals great opportunity for using this system in assessing finger and hand motion. For assessing mouth and jaw movements, where a greater distance from the camera to the subject is anticipated, 5 mm markers are proportionally sized to be useful. Relatedly, in assessing leg and ankle movement or head movement, with a camera necessarily farther from the subject, 10 mm provides an effective size with an adequate working distance to visualize the desired body parts in the full viewing frame of the camera without cutoff of the image.

4.3. Synergies of Camera, Marker Color, and Lighting

The resolution of an optical system relates to the interplay of multiple elements; in this case, camera resolution, sensor sensitivity to given colors, and the impact of lighting on detection.
The Apple iPhone 8 camera used in these studies was 8 megapixels with 1.5 m pixels with a 1334 × 750-pixel resolution, i.e., 326 pixels/inch, which is more than adequate to effectively resolve a 2 mm object over the distance ranges tested [42]. The color sensitivity of the camera sensor ranges from 380 nm to 660 nm, with an f/2.2 aperture providing good low-light detection, with 1080p HD video recording up to 60 fps. As such, these specifications provide a more than adequate sensitivity over a range of operating conditions, marker color choice, and lighting conditions to afford system flexibility [43,44]. The camera also offers significant depth of field allowing for in-focus resolution of the markers over the range tested, as we observed [45]. In utilizing the bright neon colors pink and green, these afford adequate contrast to typical flesh tones or clothing pastel colors, enhancing accuracy of detection. Our finding of a greater sensitivity to pink versus green, affording a greater working length with this color, relates to the sensor detection of the iPhone CMOS chip, though other factors may be operative as well. Nevertheless, this determination is useful in color choice for future patient studies. We also tested lighting intensity over a practical use range that individuals will encounter at home or in the clinic. We found as anticipated that the sensitivity of detection was enhanced with increased illumination, a characteristic of current digital camera CMOS sensor technology [46].

4.4. Frequency and Rate of Movement and Capture

We studied marker movement at a fixed frequency of 96 bpm. Our study demonstrated the clear ability to detect and resolve markers during movement at that rate. We chose this rate as it encompasses and exceeds the rate of typical human intentional movements that may be encountered in flexibility and diagnostic assessment. Over the operating range of 1–12 ft tested, an optimal range for reduced error was noted within, between 2 ft and 10 ft. These findings are consistent with observations of others indicating the importance of considering not only the image capture rate as it relates to movement frequency or speed, but also the operating distance for the markers being measured [47]. Future studies will aim at determining the accuracy of the system over a range of motion rates exceeding the rate studied herein. Demonstrating the efficacy of the system at even faster rates will expand the potential utility of this method for use in comparative assessment of muscle function and fatigue rates.

4.5. Limitations

General limitations of this study relate to assessment of operating efficacy under highly controlled conditions. In anticipated real-world use, environment and collective operating conditions may vary greatly, i.e., from home to home and hospital to hospital. Specific limitations identified in this study include a defined distance range for accurate motion capture, the inability to detect in a 3-D versus 2-D plane, the need for use of specific color markers, i.e., neon pink or green, and discrimination dependence based on ambient illumination intensity and camera frame capture rate. Hardware limitations relate to certain iPhone or smart phone requirements for an adequate pixel rate, capture rate, maximum aperture, depth of field capture, and frame capture rate. For home use patients may need to affix their phone to a stable support or tripod. Many of these limitations will be obviated with the rapid and continual evolution and advance of the smart phone technology.

4.6. Next Steps

On the technical side, studies examining the peak rate of motion that the system can accurately capture as well developing methods for 3-D marker analysis are being pursued. Next step studies specifically examining the translational utility of this approach are underway, examining efficacy in evaluating patients with rheumatologic and neurologic diseases. The range of motion for patients with a range of arthritides involving small joints and the axial spine are specifically being pursued to gain applied experience with this method based on a distance and depth of field ranges deemed effective by this study. Finally, simplifying the means of data analysis for the ease of use by patients and professionals are underway.

5. Conclusions

The MO2CA system is an effective and simple means for quantifying marker position and inter-marker distance, useful for characterizing the position and range of motion of the object or subject to which it is affixed. This mobile technology has a clear efficacy over a practical range of working distances, marker sizes, inter-marker separation distances, light intensities, and object speeds. The operating limits herein defined clearly demonstrate considerable operating space and latitude to allow for use in human motion analysis for near close camera use, as in finger and body region analysis, as well as for more distant uses for whole body motion assessment. The future use of the MO2CA system will be extended to diagnostic applications as well as simple means of directing and assessing training efficacy as well as to guide more advanced therapeutics. The further advance of this system offers the utility of a fixed motion analysis method in a personal, mobile, adaptable, and user-friendly format.

Supplementary Materials

The following supporting information can be downloaded at: https://0-www-mdpi-com.brum.beds.ac.uk/article/10.3390/app12126173/s1, Figure S1: Single target resolution in meters; Figure S2: Inter-target resolution in meters; Figure S3: Effect of luminosity on target detection resolution in meters.

Author Contributions

Conceptualization, M.J.S. and K.-C.S.; methodology, M.J.S. and K.-C.S.; software, J.H.C. and K.R.A.; investigation, A.C.V., H.F., R.C.S. and C.D.M.; formal analysis, A.C.V., H.F., R.C.S., J.H.C., K.R.A. and M.J.S.; resources, M.J.S. and K.-C.S.; writing—original draft preparation, A.C.V., H.F., R.C.S., K.-C.S. and M.J.S.; writing—review and editing, A.C.V., H.F., R.C.S., K.R.A., K.-C.S. and M.J.S.; visualization, A.C.V., H.F., R.C.S., K.R.A. and K.-C.S.; supervision, M.J.S. and K.-C.S.; project administration, M.J.S. and K.-C.S.; funding acquisition, M.J.S. and K.-C.S. All authors have read and agreed to the published version of the manuscript.

Funding

This work was supported by ACABI—the Arizona Center for Accelerated Biomedical Innovation of the University of Arizona. ACABI had no role in design of the study, nor in collection, analysis, and interpretation of data or writing of the manuscript. The development of the MO2CA system was supported by the NASA Nebraska Space Grant (NNX15AK50A) and the UNeTECH Fund of the University of Nebraska Medical Center.

Institutional Review Board Statement

The study was conducted according to the guidelines of the Declaration of Helsinki, and approved by the Institutional Review Board of The University of Arizona.-protocol code #1809925234 and date of approval. Written informed consent was obtained from all study participants utilizing an IRB approved consent form.

Informed Consent Statement

Informed consent was obtained from all subjects.

Conflicts of Interest

The authors declare no conflict of interest.

References

  1. Patel, K.V.; Coppin, A.K.; Manini, T.M.; Lauretani, F.; Bandinelli, S.; Ferrucci, L.; Guralnik, J.M. Midlife Physical Activity and Mobility in Older Age. The InCHIANTI Study. Am. J. Prev. Med. 2006, 31, 217–224. [Google Scholar] [CrossRef] [PubMed] [Green Version]
  2. Bherer, L.; Erickson, K.I.; Liu-Ambrose, T. A Review of the Effects of Physical Activity and Exercise on Cognitive and Brain Functions in Older Adults. J. Aging Res. 2013, 2013, 657508. [Google Scholar] [CrossRef] [PubMed] [Green Version]
  3. Gill, D.L.; Hammond, C.C.; Reifsteck, E.J.; Jehu, C.M.; Williams, R.A.; Adams, M.M.; Lange, E.H.; Becofsky, K.; Rodriguez, E.; Shang, Y.-T. Physical Activity and Quality of Life. J. Prev. Med. Public Health 2013, 46 (Suppl. S1), S28–S34. [Google Scholar] [CrossRef] [PubMed]
  4. Pillay, S. How Simply Moving Benefits Your Mental Health. Available online: https://www.health.harvard.edu/blog/how-simply-moving-benefits-your-mental-health-201603289350 (accessed on 5 August 2021).
  5. Esmail, A.; Vrinceanu, T.; Lussier, M.; Predovan, D.; Berryman, N.; Houle, J.; Karelis, A.; Grenier, S.; Minh Vu, T.T.; Villalpando, J.M.; et al. Effects of Dance/Movement Training vs. Aerobic Exercise Training on Cognition, Physical Fitness and Quality of Life in Older Adults: A Randomized Controlled Trial. J. Bodyw. Mov. Ther. 2020, 24, 212–220. [Google Scholar] [CrossRef]
  6. Bouchard, C.; Shephard, R.J. Physical Activity, Fitness, and Health: The Model and Key Concepts. In Physical Activity, Fitness, and Health: International Proceedings and Consensus Statement; Bouchard, C., Shephard, R.J., Stephens, T., Eds.; Human Kinetic Publishers: Champaign, IL, USA, 1994; pp. 77–88. [Google Scholar]
  7. Dubbert, P.M.; Stetson, B.A. Exercise and Physical Activity. In Handbook of Health and Rehabilitation Psychology; Goreczny, A.J., Ed.; Spinger: Boston, MA, USA, 1995. [Google Scholar] [CrossRef]
  8. Powell, K.E.; Paluch, A.E.; Blair, S.N. Physical Activity for Health: What Kind? How Much? How Intense? On Top of What? Annu. Rev. Public Health 2011, 32, 349–365. [Google Scholar] [CrossRef] [Green Version]
  9. Kelley, G.A.; Kelley, K.S. Meditative Movement Therapies and Health-Related Quality-of-Life in Adults: A Systematic Review of Meta-Analyses. PLoS ONE 2015, 10, e0129181. [Google Scholar] [CrossRef] [Green Version]
  10. Piercy, K.L.; Troiano, R.P. Physical Activity Guidelines for Americans From the US Department of Health and Human Services. Circ. Cardiovasc. Qual. Outcomes 2018, 11, e005263. [Google Scholar] [CrossRef]
  11. Guralnik, J.M.; Ferrucci, L.; Simonsick, E.M.; Salive, M.E.; Wallace, R.B. Lower-Extremity Function in Persons over the Age of 70 Years as a Predictor of Subsequent Disability. N. Engl. J. Med. 1995, 332, 556–562. [Google Scholar] [CrossRef] [Green Version]
  12. Guralnik, J.M.; Ferrucci, L.; Pieper, C.F.; Leveille, S.G.; Markides, K.S.; Ostir, G.V.; Studenski, S.; Berkman, L.F.; Wallace, R.B. Lower Extremity Function and Subsequent Disability: Consistency across Studies, Predictive Models, and Value of Gait Speed Alone Compared with the Short Physical Performance Battery. J. Gerontol. Ser. A Biol. Sci. Med. Sci. 2000, 55, M221–M231. [Google Scholar] [CrossRef] [Green Version]
  13. Pöhlmann, S.T.L.; Harkness, E.F.; Taylor, C.J.; Astley, S.M. Evaluation of Kinect 3D Sensor for Healthcare Imaging. J. Med. Biol. Eng. 2016, 36, 857–870. [Google Scholar] [CrossRef]
  14. Van der Kruk, E.; Reijne, M.M. Accuracy of Human Motion Capture Systems for Sport Applications; State-of-the-Art Review. Eur. J. Sport Sci. 2018, 18, 806–819. [Google Scholar] [CrossRef] [PubMed]
  15. Parks, M.T.; Want, Z.; Siu, K.-C. Current Low-Cost Video-Based Motion Analysis Options for Clinical Rehabilitation: A Systematic Review. Phys. Ther. 2019, 99, 1405–1425. [Google Scholar] [CrossRef] [PubMed]
  16. Parks, M.; Chien, J.H.; Siu, K.C. Development of a Mobile Motion Capture (MO 2 CA) System for Future Military Application. In Military Medicine; Oxford University Press: Oxford, UK, 2019; Volume 184, pp. 65–71. [Google Scholar] [CrossRef] [Green Version]
  17. Barris, S.; Button, C. A Review of Vision-Based Motion Analysis in Sport. Sports Med. 2008, 38, 1025–1043. [Google Scholar] [CrossRef] [PubMed]
  18. Colyer, S.L.; Evans, M.; Cosker, D.P.; Salo, A.I.T. A Review of the Evolution of Vision-Based Motion Analysis and the Integration of Advanced Computer Vision Methods Towards Developing a Markerless System. In Sports Medicine—Open; Springer: Cham, Switzerland, 2018. [Google Scholar] [CrossRef] [Green Version]
  19. Matthew, R.P.; Seko, S.; Bajcsy, R.; Lotz, J. Kinematic and Kinetic Validation of an Improved Depth Camera Motion Assessment System Using Rigid Bodies. IEEE J. Biomed. Health Inform. 2019, 23, 1784–1793. [Google Scholar] [CrossRef] [PubMed] [Green Version]
  20. Pfister, A.; West, A.M.; Bronner, S.; Noah, J.A. Comparative Abilities of Microsoft Kinect and Vicon 3D Motion Capture for Gait Analysis. J. Med. Eng. Technol. 2014, 38, 274–280. [Google Scholar] [CrossRef]
  21. Maykut, J.N.; Taylor-Haas, J.A.; Paterno, M.V.; DiCesare, C.A.; Ford, K.R. Concurrent Validity and Reliability of 2D Kinematic Analysis of Frontal Plane Motion During Running. Int. J. Sports Phys. Ther. 2015, 10, 136–146. [Google Scholar]
  22. Bell, K.; Onyeukwu, C.; McClincy, M.; Allen, M.; Bechard, L.; Mukherjee, A.; Hartman, R.; Smith, C.; Lynch, A.; Irrgang, J. Verification of a Portable Motion Tracking System for Remote Management of Physical Rehabilitation of the Knee. Sensors 2019, 19, 1021. [Google Scholar] [CrossRef] [Green Version]
  23. McLean, S.G.; Walker, K.; Ford, K.R.; Myer, G.D.; Hewett, T.E.; Van Den Bogert, A.J. Evaluation of a Two Dimensional Analysis Method as a Screening and Evaluation Tool for Anterior Cruciate Ligament Injury. Br. J. Sports Med. 2005, 39, 355–362. [Google Scholar] [CrossRef] [Green Version]
  24. Arai, K.; Asmara, R.A. 3D Skeleton Model Derived from Kinect Depth Sensor Camera and Its Application to Walking Style Quality Evaluations. Int. J. Adv. Res. Artif. Intell. 2013, 2, 24–28. [Google Scholar] [CrossRef] [Green Version]
  25. Wei, X.; Zhang, P.; Chait, J. Accurate Realtime Full-Body Motion Capture Using a Single Depth Camera. ACM Trans. Graph. 2012, 31, 1–12. [Google Scholar] [CrossRef] [Green Version]
  26. Clark, R.A.; Mentiplay, B.F.; Hough, E.; Pua, Y.H. Three-Dimensional Cameras and Skeleton Pose Tracking for Physcial Function Assessment: A Review of Uses, Validity, Current Developments and Kinect Alternatives. Gait Posture 2019, 68, 193–200. [Google Scholar] [CrossRef] [PubMed]
  27. Ceseracciu, E.; Sawacha, Z.; Cobelli, C. Comparison of Markerless and Marker-Based Motion Capture Technologies through Simultaneous Data Collection during Gait: Proof of Concept. PLoS ONE 2014, 9, e87640. [Google Scholar] [CrossRef] [PubMed]
  28. Drazan, J.F.; Phillips, W.T.; Seethapathi, N.; Hullfish, T.J.; Baxter, J.R. Moving Outside the Lab: Markerless Motion Capture Accurately Quantifies Sagittal Plane Kinematics during the Vertical Jump. J. Biomech. 2021, 125, 110547. [Google Scholar] [CrossRef] [PubMed]
  29. Kanko, R.M.; Laende, E.K.; Davis, E.M.; Selbie, W.S.; Deluzio, K.J. Concurrent Assessment of Gait Kinematics Using Marker-Based and Markerless Motion Capture. J. Biomech. 2021, 127, 110665. [Google Scholar] [CrossRef]
  30. Needham, R.; Stebbins, J.; Chockalingam, N. Three-Dimensional Kinematics of the Lumbar Spine during Gait Using Marker-Based Systems: A Systematic Review. J. Med. Eng. Technol. 2016, 40, 172–185. [Google Scholar] [CrossRef] [Green Version]
  31. Ammann, K.R.; Ahamed, T.; Sweedo, A.L.; Ghaffari, R.; Weiner, Y.E.; Slepian, R.C.; Jo, H.; Slepian, M.J. Human Motion Component and Envelope Characterization via Wireless Wearable Sensors. BMC Biomed. Eng. 2020, 2, 3. [Google Scholar] [CrossRef] [Green Version]
  32. Findlow, A.; Goulermas, J.Y.; Nester, C.; Howard, D.; Kenney, L.P.J. Predicting Lower Limb Joint Kinematics Using Wearable Motion Sensors. Gait Posture 2008, 28, 120–126. [Google Scholar] [CrossRef]
  33. Yang, C.-C.; Hsu, Y.-L. A Review of Accelerometry-Based Wearable Motion Detectors for Physical Activity Monitoring. Sensors 2010, 10, 7772–7788. [Google Scholar] [CrossRef]
  34. Lee, I.-M.; Shiroma, E.J. Using Accelerometers to Measure Physical Activity in Large-Scale Epidemiological Studies: Issues and Challenges. Br. J. Sports Med. 2014, 48, 197–201. [Google Scholar] [CrossRef] [Green Version]
  35. Zhong, R.; Rau, P.L.P.; Yan, X. Application of Smart Bracelet to Monitor Frailty-Related Gait Parameters of Older Chinese Adults: A Preliminary Study. Geriatr. Gerontol. Int. 2018, 18, 1366–1371. [Google Scholar] [CrossRef]
  36. Poitras, I.; Dupuis, F.; Bielmann, M.; Campeau-Lecours, A.; Mercier, C.; Bouyer, L.J.; Roy, J.S. Validity and Reliability of Wearable Sensors for Joint Angle Estimation: A Systematic Review. Sensors 2019, 19, 1555. [Google Scholar] [CrossRef] [PubMed] [Green Version]
  37. Glowinski, S.; Obst, M.; Majdanik, S.; Potocka-Banaś, B. Dynamic Model of a Humanoid Exoskeleton of a Lower Limb with Hydraulic Actuators. Sensors 2021, 21, 3432. [Google Scholar] [CrossRef] [PubMed]
  38. Glicksman, J.T.; Reger, C.; Parasher, A.K.; Kennedy, D.W. Accuracy of Computer-Assisted Navigation: Significant Augmentation by Facial Recognition Software. Int. Forum Allergy Rhinol. 2017, 7, 884–888. [Google Scholar] [CrossRef]
  39. Köhler, J.; Pagani, A.; Stricker, D. Detection and Identification Techniques for Markers Used in Computer Vision. In Open Access Series in Informatics; Dagstuhl Publishing: Saarbrucken, Germany, 2011; Volume 19, pp. 36–44. [Google Scholar] [CrossRef]
  40. Ojha, S.; Sakhare, S. Image Processing Techniques for Object Tracking in Video Surveillance—A Survey. In Proceedings of the 2015 International Conference on Pervasive Computing (ICPC), Pune, India, 8–10 January 2015; IEEE: Pune, India, 2015. [Google Scholar] [CrossRef]
  41. Zhang, X.; Fronz, S.; Navab, N. Visual Marker Detection and Decoding in AR Systems: A Comparative Study. In Proceedings of the International Symposium on Mixed and Augmented Reality, Darmstadt, Germany, 1 October 2002; IEEE: Darmstadt, Germany, 2002. [Google Scholar] [CrossRef]
  42. iOS Device Compatibility Reference. Available online: https://developer.apple.com/library/archive/documentation/DeviceInformation/Reference/iOSDeviceCompatibility/Cameras/Cameras.html (accessed on 20 March 2021).
  43. Mansurov, N. Camera Resolution Explained. Available online: https://photographylife.com/camera-resolution-explained (accessed on 20 March 2021).
  44. Tominaga, S.; Nishi, S.; Ohtera, R. Measurement and Estimation of Spectral Sensitivity Functions for Mobile Phone Cameras. Sensors 2021, 21, 4985. [Google Scholar] [CrossRef]
  45. Lubek, T. Video Depth of Field with iPhone: A Simple Beginners Guide. Available online: https://www.diyvideostudio.com/depth-of-field-with-iphone/ (accessed on 20 March 2021).
  46. How to Evaluate Camera Sensitivity. Available online: https://www.flir.com/discover/iis/machine-vision/how-to-evaluate-camera-sensitivity/ (accessed on 20 March 2021).
  47. Song, M.H.; Godøy, R.I. How Fast Is Your Body Motion? Determining a Sufficient Frame Rate for an Optical Motion Tracking System Using Passive Markers. PLoS ONE 2016, 11, e0150993. [Google Scholar] [CrossRef] [PubMed]
Figure 1. Flowchart depicting experimental protocols.
Applsci 12 06173 g001
Figure 2. Protocol 1: Configuration for single target resolution. Neon green or neon pink squares of three differing sizes (a). A single marker square was affixed to a flat wood stick as a single target (b). Measurements of 1 ft were marked from 1–20 ft, and videos were captured at each of the markers (c). (For representation purposes, the iPhone is shown in one hand, in the study two hands were used for stability).
Applsci 12 06173 g002
Figure 3. Actual images of experimental design set up of single target resolution.
Applsci 12 06173 g003
Figure 4. Protocol 2: Configuration for distance limit of target pair detection and inter-target discrimination. Neon pink or green markers were cut in either, 2 mm, 5 mm, or 10 mm sizes (a). Markers were affixed to flat wood stick in either 2 mm, 5 mm, or 10 mm distances apart (b). As in Protocol 1, videos were captured at 1 ft increments (c).
Applsci 12 06173 g004
Figure 5. Protocol 3: Configuration for working distance. Neon pink and green markers were cut in 10 × 10 mm size (a). Neon pink marker was affixed to metronome at distal end of metronome arm, and neon green marker was affixed to the base of the arm (b). Metronome was set at 96 bpm, and videos were captured at 1 ft increments up to 20 ft (c).
Applsci 12 06173 g005
Figure 6. Protocol 4: Configuration for testing luminosity. Neon markers were made as in Protocol 1, Lux Light Meter Pro application downloaded and set on an iPhone (a). Various luminosities were set by using the Lux Light Meter Pro to average the light in the room (b). Videos were captured at 1–20 ft increments with varying luminosities (c).
Applsci 12 06173 g006
Figure 7. (a) Comparison of target capture and target resolution based on size. (b) Bar graph depicting maximum distance for target identification based on size.
Applsci 12 06173 g007
Figure 8. (a) 2 × 2 mm inter-target discrimination resolution. (b) 5 × 5 mm inter-target discrimination resolution. (c) 10 × 10 mm inter-target discrimination resolution. (d) Maximum distance for target identification relative to target size. (e) Maximum distance for target identification relative to target separation distance.
Applsci 12 06173 g008
Figure 9. Statistical error at varying distances for a working target.
Applsci 12 06173 g009
Figure 10. (a) Target capture and resolution comparison with neon green target in various luminosities. (b) Effect of light intensity on maximum distance capture and resolution with a green target. Figure (c) Target capture and resolution comparison with neon pink target in various luminosities. Figure (d) Effect of light intensity on maximum distance capture and resolution with a pink target in various luminosities.
Applsci 12 06173 g010
Figure 11. (a) Max angle of finger abduction captured at 6 ft distance using 2 mm markers. (b) Max angle of lateral bend test captured at 5 ft distance using 10 mm markers.
Applsci 12 06173 g011
Table 1. Analysis of Inter-Target Resolution by ANOVA.
Distance of Separation (mm)2 mm Targets5 mm Targets10 mm Targetsp-Value
22.5 ft2.67 ft4 ft0.003
54.67 ft5.33 ft9 ft<0.001
105.17 ft7.67 ft11 ft<0.001
p-value0.001<0.001<0.001
Table 2. Representative Application of MO2CA Based on Body Elements Measured.
Body ElementFlexibilitySpecific Medical Use
Whole BodyToe Touch
Sit and Reach
Schober Test
Side Bending Test
Trunk Rotation Test
Adams Forward Bend Test (Scoliosis)
Lateral Bend Test
Large Body Region/LimbCervical Flexion/Extension
Shoulder-Neck Mobility
Back Scratch Test
Straight Leg Raise
Modified Thomas Test
Calf Muscle Flexibility Test
Hawkins-Kennedy Test (Shoulder)
Anterior Drawer Test (Knee-ACL)
Apley’s Test (Knee-Meniscus)
Lachman’s Test (Knee-ACL)
McMurray’s Test (Knee-Meniscus)
Craig’s Test (Hip)
Thomas Test (Hip Flexion)
Trendelenburg Test (Hip Abduction)
Ober’s Test (IT Band)
Regional Element/DigitsWrist Extension/Flexion
Ankle Extension/Flexion
Finger Extension/Flexion
Toe Extension/Flexion
Finger Abduction/Adduction
Temporomandibular Joint Movement
Metacarpophalangeal Joint Flexion/Extension
Interphalangeal Joint Flexion/Extension
Claw Test
Finger Lift
Thumb Movement
Publisher’s Note: MDPI stays neutral with regard to jurisdictional claims in published maps and institutional affiliations.

