
Survey of Machine Learning Techniques in the Analysis of EEG Signals for Parkinson’s Disease: A Systematic Review


Abstract
:1. Introduction
2. Methods
2.1. Search Strategy and PRISMA Methodology
2.2. Data Extraction and Analysis
3. Results
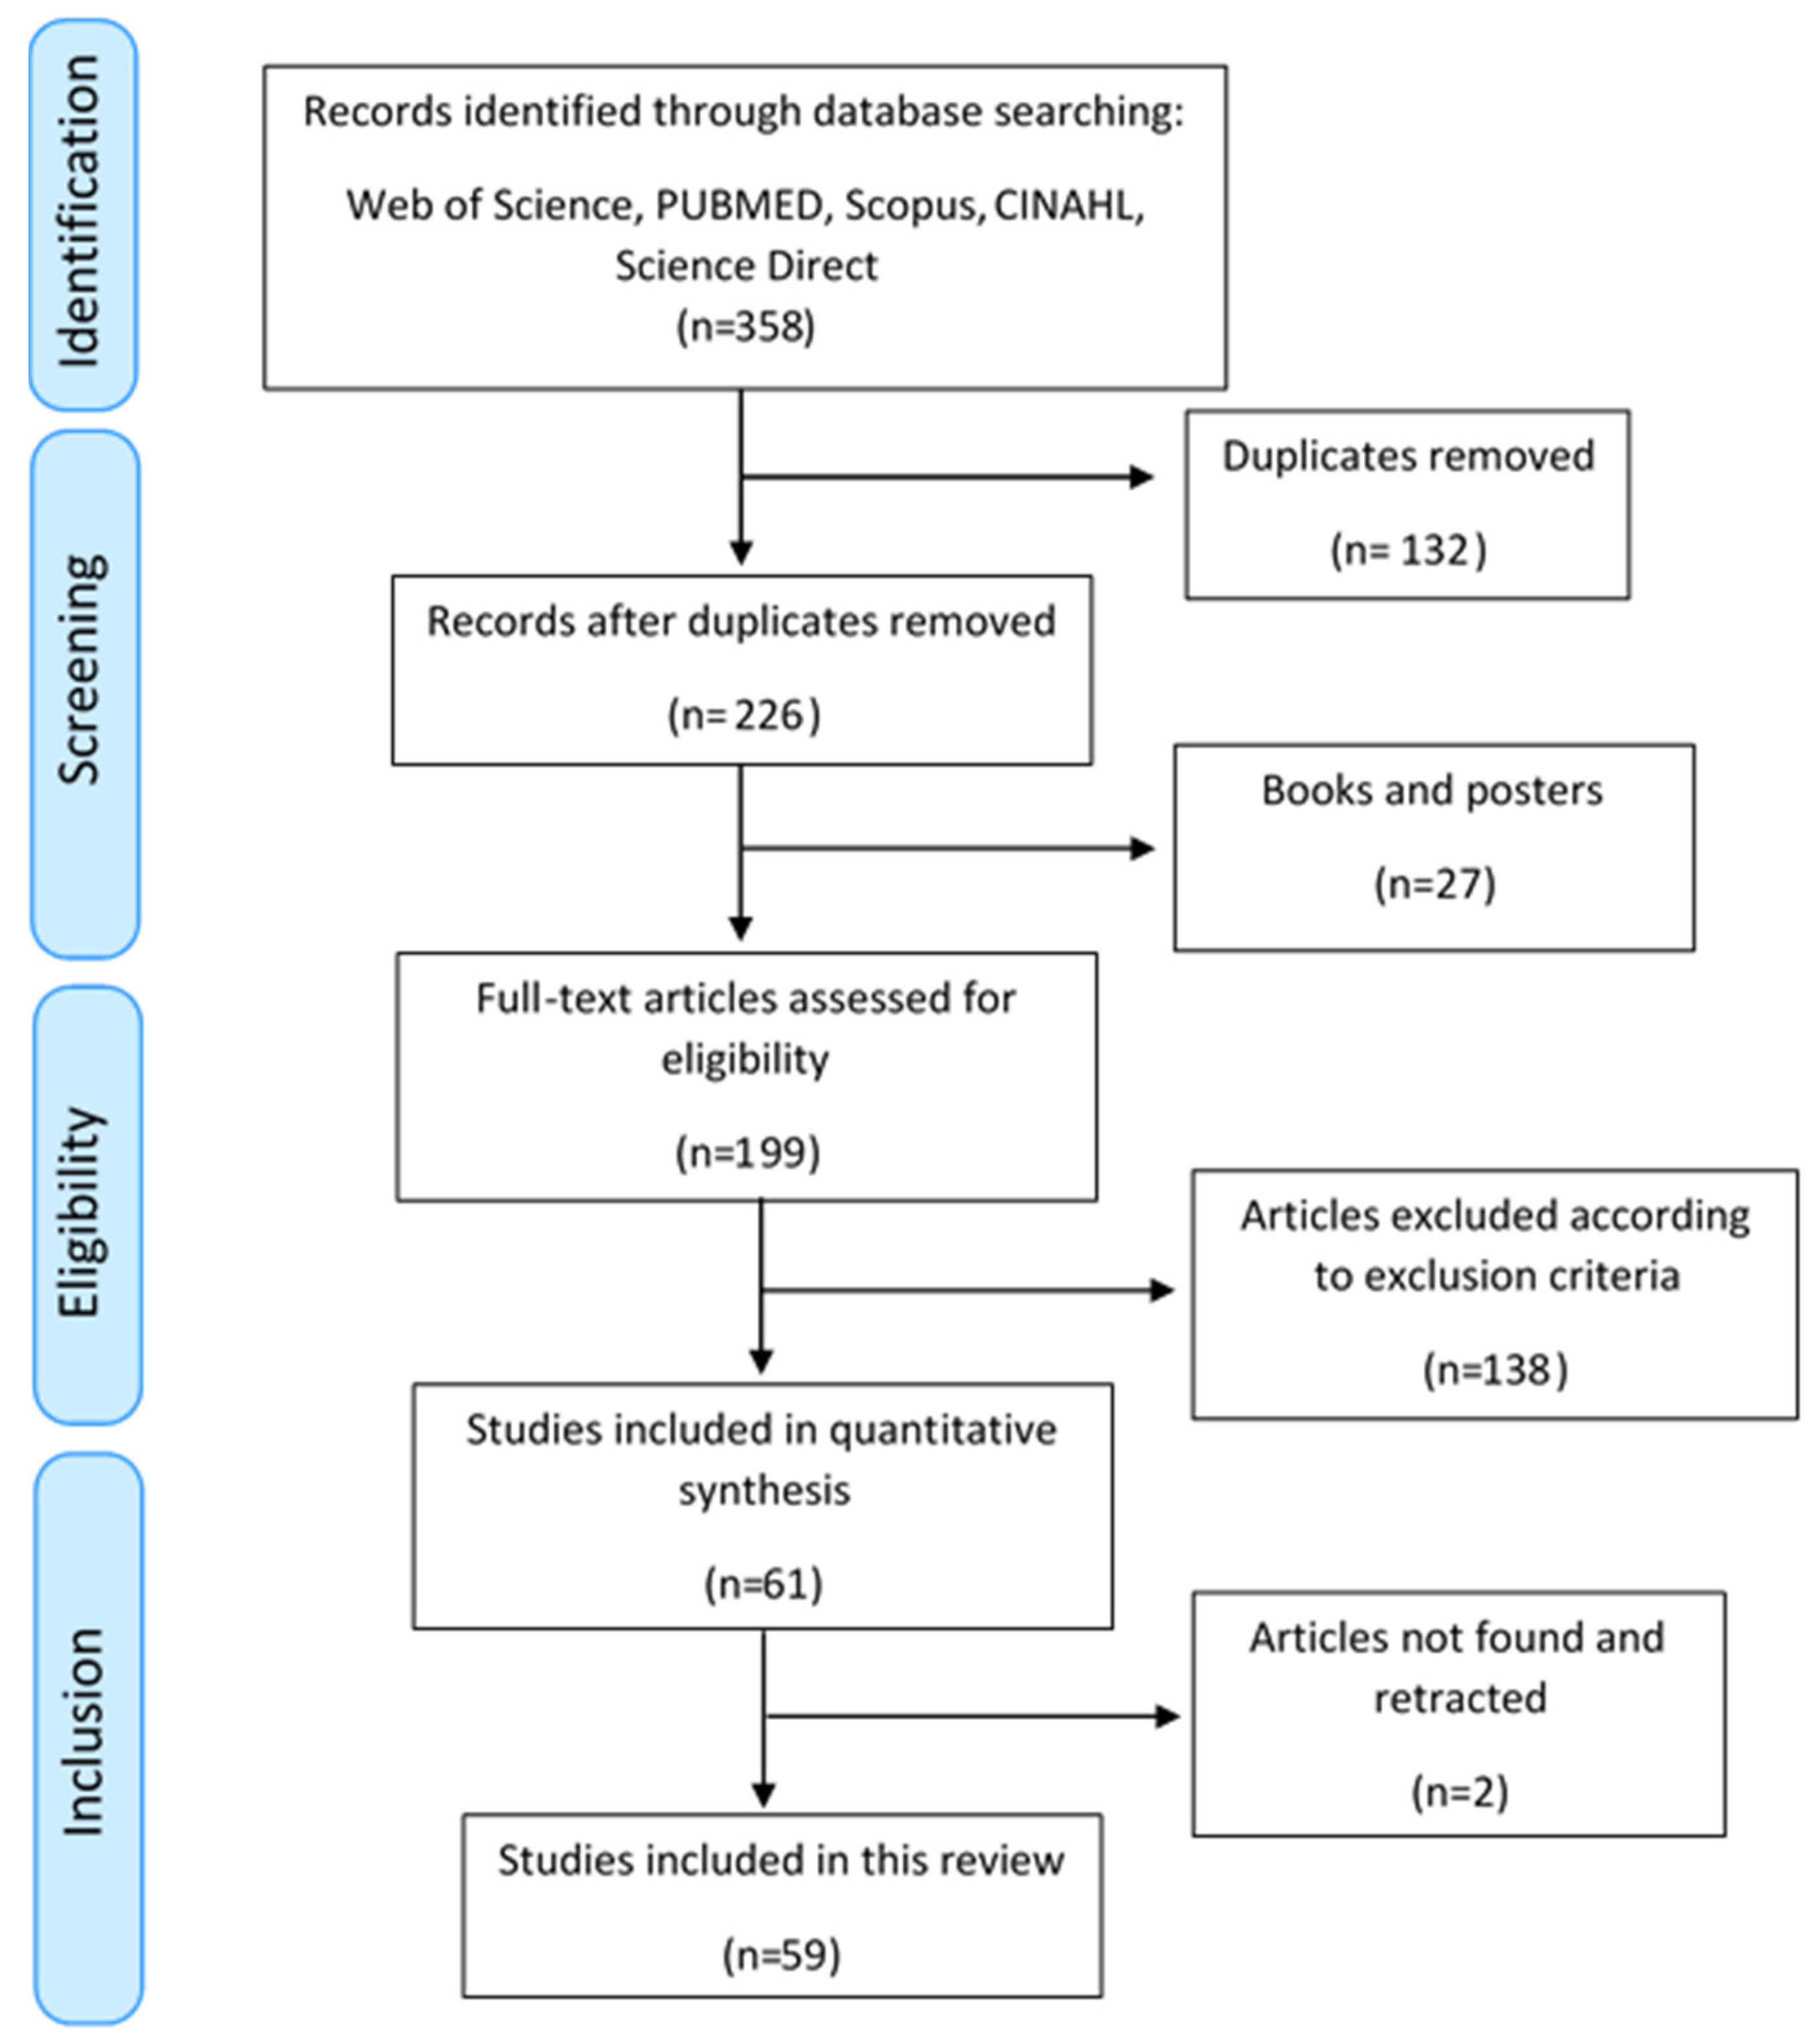
3.1. PRISMA Flow Diagram
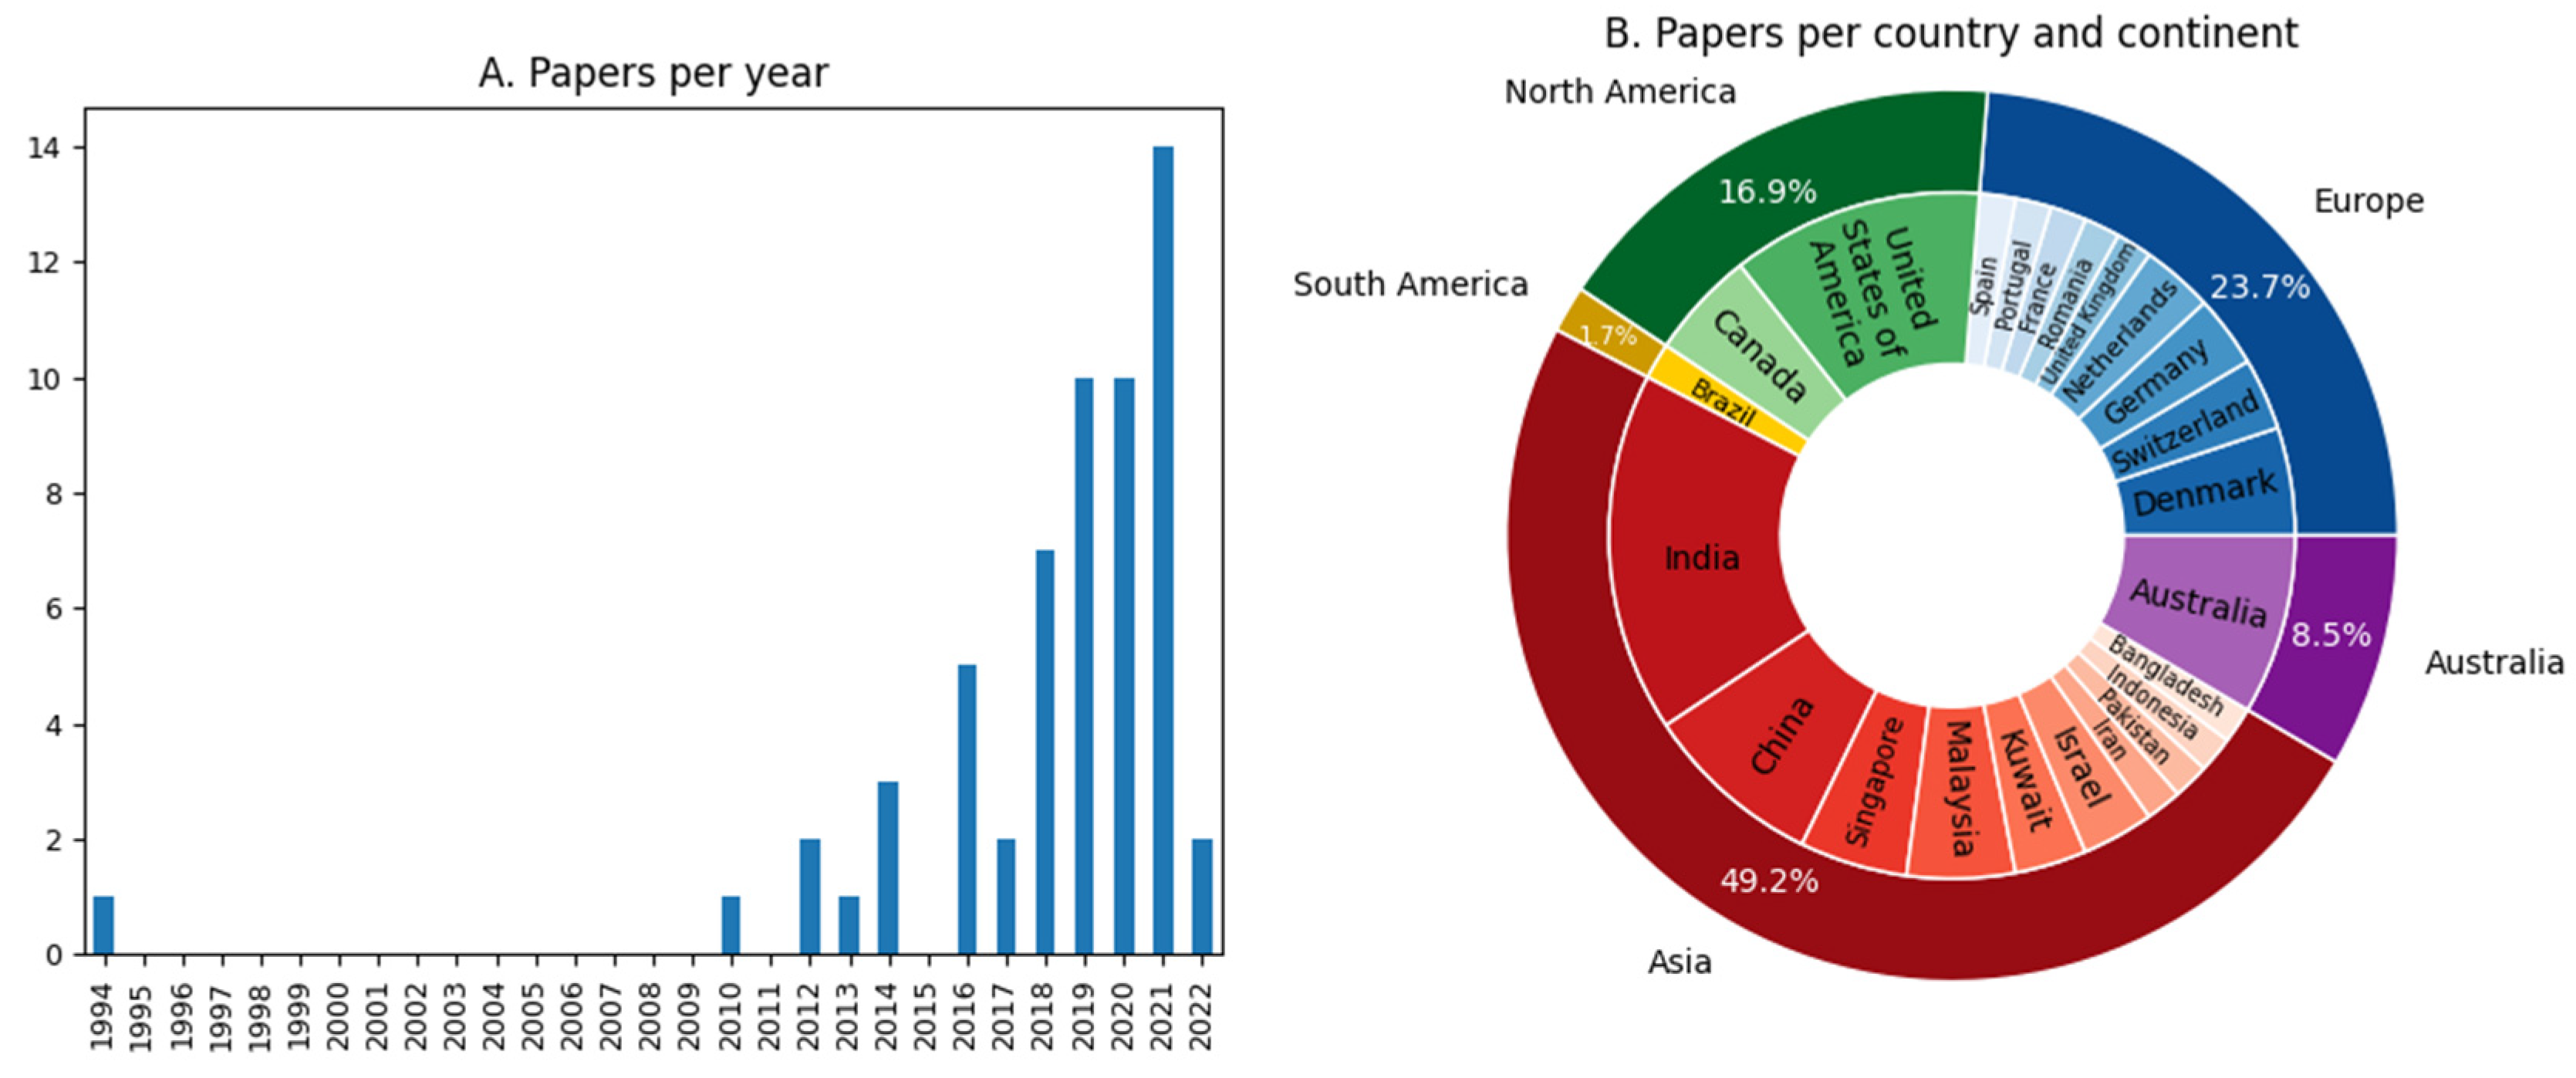
3.2. Statistical Analysis
- Evaluation of the quality of the dataset. It was evaluated if the articles considered balanced datasets, and if the samples were statistically equivalent, by means of the number of subjects in each group and the demographic data of the patients. Other clinical parameters related to PD progression were also evaluated, such as the Hoehn-Yahr (HY) scale, UPDRS, years of disease, and whether the data collection was recorded with active dopaminergic medication. These parameters provided information about the quality of the dataset, allowing for assessing the performance results of the model. Finally, parameters related to the recording of EEG signals were evaluated, such as the number of channels, duration of the test, and type of test performed, which provided information about the quality of the signal recording process. Regarding Table 3, this point corresponds to the Participants column, Stage PD column, and part of the EEG Pre-processing column.
- Data pre-processing. The cleaning protocol of the EEGs and the extraction of features were analyzed. The cleaning protocol of the EEG is a process that is sometimes omitted. Moreover, there is no gold standard defined, and the great variety of techniques usually considered produce different modifications in the EEG signals. Thus, the cleaning of the EEG was evaluated in each article to verify the impact of this pre-processing on the results of the models. With regard to the extraction of features from the EEG signals, it should be taken into account that the features introduced as inputs in the models play a transcendental role in the ML techniques, so they were collected to extract those used most frequently and those for which better results were obtained. The information associated with this point was specified in part of the EEG Pre-processing column, and the Features Column, of Table 3.
- Evaluation of the models used. The type of model used together with its architecture and its training and validation methods were examined. This set of parameters was considered to assess which models obtained the best results depending on the objective of the article. More specifically, the analysis of the validation process carried out allowed for evaluating the quality of the results and provided a more objective assessment of the scope of the predictive results of the model. Within Table 3, this information corresponds to the Models, Model Parameters, and Validation columns.

| Objective | Evaluation of the Quality of the Dataset | Data Pre-Processing | Evaluation of the Models Used | Results | |||||
|---|---|---|---|---|---|---|---|---|---|
| Ref. | Objective | Participants | Stage PD | EEG Pre-Processing | Features | Models | Model Parameters | Validation | Best Results |
| [29] | Classification of PD patients vs. controls. | Subjects: 20 PD and 21 controls Age: PD: 67.6 ± 7.0 HC: 67.5 ± 6.4 | HY scale: 1–2 UPDRS: 23.5 ± 9.8 Disease Duration: 7.6 ± 4.3 Medication: ON and OFF | Sixty-four-channel EEG recorded during 1 min in resting state at 1 kHz. In total, 27 electrodes were considered. Impedances were kept below 15 kΩ. The EEG was divided into non-overlapping 3 s segments. | The segments of EEG were introduced as input. | CNN + RNN | Two 1D-conv layers with 64 each, LSTM with 80 cells and a fully connected layer with 50 units. The activation function was sigmoid, the loss function was “binary crossentropy” and the optimizer was Adam with learning rate = 0.001. | Data were split into 80% for training and 20% for test sets. | Results without medication: Accuracy = 96.9 Precision = 100 Recall = 93.4 |
| [30] | Classification of PD patients vs. controls. | Subjects: 20 PD and 21 controls Age: PD: 67.6 ± 7.0 HC: 67.5 ± 6.4 | HY scale: 1–2 UPDRS: 23.5 ± 9.8 Disease Duration: 7.6 ± 4.3 Medication: ON and OFF | Sixty-four-channel EEG recorded during 1 min in resting state at 1 kHz. In total, 27 electrodes were considered. Impedances were kept below 15 kΩ. A band-pass filtered was used at 1–55 Hz, and re-referenced to average reference. Artifacts were removed using ICA. The data were standardized and segmented into 1 s or 2 s epochs. | For the CNN/CRNN models, 1 s segments without overlapping were introduced. For the others, two datasets were considered. First, with 2 s epochs and 13 features of HOS. Second, 794 time-series features in 1 s epochs using the bands theta, alpha beta, and gamma. Top significant features were selected through ANOVA. | CNN + RNN, CNN, KNN, SVM, RF | The final architecture for KNN, SVM, and RF were not specified. CNN + RNN: 2 1D-conv (kernel size 3, filters 32 and 64), max-pooling, a GRU cells with 35 units, and 2 fully connected layers (time distributed and dense with 35 units). Dropout were used. Activation function was ReLU and a softmax for the final layer. Optimizer Adam (learning rate = 0.001) and a binary cross-entropy as loss. CNN: 4 consecutive blocks, with 8, 12, 12, and 16 filters in each 1D-conv layer (kernel size = 9). Max-pooling layer. Three fully connected layers with 30 and 5 units, activation function ReLU, and softmax for the last one. Adam optimizer (learning rate = 0.001), and binary cross-entropy as loss function. | Nested cross-validation (inner 5-fold for hyperparameter tunning and outer 10 fold) | The CNN + RNN model obtained: Accuracy = 99.2 Precision = 98.9 Recall = 99.4 F1-score = 99.2 AUC = 99.2 |
| [31] | Classification of PD patients vs. controls. | Subjects: 20 PD and 20 controls. Age: PD: (45–65) HC: 58.1 ± 2.95 | HY scale: 1: n = 2; 2: n = 11; 3: n = 7 UPDRS: Not specified Disease Duration: 5.75 ± 3.52 Medication: ON | Fourteen-channel EEG recorded during 5 min in resting state at 128 Hz. Epochs of 2 s were segmented and a threshold technique was applied at ±100 µV. A band-pass filter was used at 1–49 Hz. | The EEG signals were the input. | CNN | Thirteen layers with 4 1D-conv layers, 4 max-pooling layers, and 3 fully connected layers. Adam optimizer (learning rate = 10−4). Activation function Relu and the last one softmax. Dropout of 0.5. | Ten-fold cross-validation with stratified data. In total, 20% of the training data was also used for validation at the end of each epoch. | The results were: Accuracy = 88.25 Sensitivity = 84.71 Specificity = 91.77 |
| [32] | Classification of PD patients with MCI vs. patients without MCI. | Subjects: 27 PD with MCI and 43 PD without MCI Age: MCI: (53–84) Non-MCI: (46–82) | HY scale: MCI: 0–5 Non-MCI: 0–4 UPDRS: MCI: 0–41 Non-MCI: 0–36 Disease Duration: MCI: 0–23 Non-MCI: 0–17 Medication: Not specified | Two-hundre-fifty-six-channel EEG recorded during 12 min in resting state with eyes-closed at 1 kHz. In total, 214 electrodes were associated with 10 ROI. Signals were filtered at 0.5–70 Hz, with a 50 Hz notch, and an inverse Hanning window was used to stitch together segments to get 3 min of EEG data. Artifacts were removed. The average of all “good” channels was used to reference the signals to an average value. | The spectral power was calculated in 10 ROI and globally for 6 frequency intervals resulting in 66 spectral features. The PLI was calculated between all pairs of ROI resulting in 330 connectivity features. | RF | The standard implementation in R was applied. | Data were split into 70% for training and 30% for test sets. 20 runs of 5-fold cross-validation. | The results with the combination of both features. ROI Train AUC = 0.73 ± 0.16 Test AUC = 0.71 Without ROI: Train AUC = 0.7 ± 0.14 Test AUC = 0.875 |
| [33] | Selection of the QEEG parameters that best distinguish between controls and PD patients. | Subjects: 50 PD and 41 controls. Age: PD: 68.8 ± 7 HC: 71 ± 7 | HY scale: Not specified UPDRS: Not specified Disease Duration: 5.3 ± 5.1 Medication: Not specified | Two-hundred-fifty-six-channel EEG recorded during 12 min in resting state with eyes-closed at 500 Hz. Three min were constructed with segments of at least 30 s without artifacts, and a 0.5–70 Hz filter was applied. An inverse Hanning window was used to join segments. It was referenced with respect to mean and defective channels that were interpolated with the spherical spline method. Artifacts were removed. | Ten brain regions were considered with 79 different measurements. All features were extracted from the frequency spectrum. | RF, SVM, DT, LR, LR with LASSO | SVM: RBF kernel. Optimization was carried out for tuning parameters. | Ten-fold cross-validation. | The most significant models were: RF: Accuracy = 78 AUC = 0.8 LR with LASSO: AUC = 0.76 |
| [34] | Cognition classification of patients with PD | Subjects: 20 PD H-COG, 20 PD L-COG and 72 inter-COG Age: H-COG: 59.5 (54.6–66.4) L-COG: 67.8 (60.1–72.1) Inter-COG: 63.5 (57.7–68.0) | HY scale: Not specified UPDRS: H-COG: 18.5 L-COG: 23 Inter-COG: 20.5 Disease Duration: H-COG: 11.2 ± 4.5, L-COG: 10.9 ± 5.1, Inter-COG: 11.8 ± 8.0 Medication: ON | Twenty-one-channel EEG recorded in resting state with eyes-closed. Data were re-referenced. After visual confirmation of artefact-free signals, 5 consecutive non-overlapping 4096-point (8.192 s) epochs were selected. Recordings with less than five epochs were excluded. | In total, 16,674 features were extracted per patient. Feature-selection was performed using a Boruta algorithm. Small feature sets were considered as input. | RF | The hyperparameters were optimized with a variant of Bayesian Optimization technique called Mixed Integer Parallel Efficient Global Optimization (MIP-EGO) for mixed-integer categorical search spaces. | Ten-fold cross-validation. Additional assessment with a combination of cross-validation and split-sample validation. | Using all features from all cross-validation runs in L-COG vs. H-COG: Accuracy: 92 Sensitivity: 90 Specificity: 94 |
| [35] | Prediction of FOG episodes | Subjects: 16 PD Age: PD: 70.88 ± 6.92 | HY scale: 2.75 ± 0.61 UPDRS: 42.50 ± 14.25 Disease Duration: 8.63 ± 6.58 Medication: Not specified | Four-channel EEG during 404 FOG episodes in structured series of Timed Up and Go tasks at 500 Hz, with a duration between 1 and 220 s. Segments with artefacts were rejected using visual inspection. In total, 1902 selected samples of data were filtered using band-pass (0.5–60 Hz) and band-stop (50 Hz) Butterworth IIR filters with zero phase shift. The data were normalized and ICA was applied. | DTF was applied. The non-parametric Wilcoxon Sum Rank Test was used to select the most significant feature. A p-value < 0.05 and r-value > 0.25 were chosen for further processing. | BNN | Three layers Back Propagation BNN was used as a classifier with Bayesian regularisation and Levenberg-Marquardt optimization. | Eleven patients were randomly chosen. Fifty runs of random training/validation (50%) and test (50%). Remaining 5 patients were considered for test. | In train set: Sensitivity: 82.65 Specificity: 86.60 In test set: Sensitivity: 85.86 Specificity: 80.25 |
| [36] | Clasification of early-stage PD patients vs. HC | Subjects: 19 PD and 30 HC Age: PD: 63.7 ± 7.8 HC: 64.4 ± 6.2 | HY scale: 1.8 ± 0.6 UPDRS: 20.1 ± 8.8 Disease Duration 1.1 ± 0.9 Medication: OFF | Sixty-four-channel EEG recorded at 250 Hz while performing visual Go/No-Go and AOB during 15 min in cognitive tasks. Signals were referenced to average mastoid electrodes and band-pass filtered in 4 bands with overlap. Then they were cut into epochs based on stimulus onset and response, and averaged across trials of the same condition. | In total, 199 features extracted by the BNA analysis from the HC and PD groups were used. In each iteration, the FPR feature selection method was applied. | LR | Not specified | Ten-fold cross-validation with stratified data. | Cross validation results in discriminating HC vs. early stage PD: AUC: 79 Sensitivity: 74 Specificity: 73 |
| [37] | Classification of PD patients vs. controls using 6 emotional stimuli. | Subjects: 20 PD and 20 controls Age: PD: (40–65) HC: (40–65) | HY scale: Not specified UPDRS: Not specified Disease Duration: Not specified Medication: Not specified | Fourteen-channel EEG recorded during 6 emotional stimuli. The signals were segmented into 10 s epochs with overlapping of 75%. Then, pass-band elliptic filters were used to obtain the alpha, beta, and gamma bands. | Three spectral features were calculated, that is, Spectral Entropy (SEN), Spectral Energy-Entropy (SEEN), and SpectralTeager Energy-Entropy (STEEN) for each band. | PNN, KNN, SVM | KNN: k between 1 and 10. PNN: A multilayer feed-forward network with 4 layers was considered. It used an exponential activation function with σ ranged from 0.55 to 0.65. | Not specified | The best accuracy for each emotion: Happiness: 96.8 with PNN and SEEN Sadness: 90.2 with KNN and SEN Fear: 95.07 with KNN and SEEN Anger: 91.4 with SVM and SEEN Surprise: 94.53 with KNN and SEEN Disgust: 88.18 with SVM and SEEN. |
| [38] | Classification of PD patients vs. controls | Subjects: Dataset1: 15 PD and 16 HC Dataset2: 20 PD and 20 HC Age: Dataset1: PD: 63.5 ± 9.6 HC: 63.2 ± 8.2 Dataset2: PD: 58.1 ± 2.95 HC: 59.05 ± 5.94 | HY scale: Dataset1: 2 and 3 Dataset2: 1–3 UPDRS: Not spedified Disease Duration: Dataset1: 4.5 ± 3.5 Dataset2: 5.75 ± 3.52 Medication: Dataset1: ON and OFF | Dataset1: 32-channel EEG recorded during 3 min in resting state at 512 Hz. Artifacts were manually removed and a highpass filter at 0.5 Hz was used. Dataset2: 14-channel EEG during 5 min in resting state at 128 Hz. Signals were segmented into 2 s windows. Eye blinking artifacts were removed with a threshold at ±100 V and a forward and reverse filtering technique using sixth-order Butterworth filter at 1–49 Hz was used. | EEG signals are subjected to SPWVD to obtain TFR. After Kaiser window selection and resizing, the two-dimensional plots are fed to the model. Experiments are carried out by maintaining the same setup for both datasets. | CNN | Four 2D-Conv Layers, 2 MaxPooling layers, 2 Fully Connected Layers (50 and 32 neurons), and a Softmax layer. The number of filters selected were 96, 32, 16, and 8. A filter size of 7 × 7, 5 × 5, and 3 × 3 with a stride of 2 was used. A dropout of 0.5 was considered. Adam optimizer was used with learning rate = 10−4. | Ten-fold cross validation | The best results were for dataset1 HC vs. PD ON medication: Accuracy: 100 Specificity: 100 Sensitivity: 100 Precision: 100 F1 Score: 100 |
| [39] | Classification of controls vs. PD patients with ON and OFF medication | Subjects: 15 PD and 16 HC Age: PD: 63.2 ± 8.2 HC: 63.5 ± 9.6 | HY scale: 2 or 3 UPDRS: ON: 33.7 ± 10.9 OFF: 45.5 ± 13.0 Disease Duration: Not specified Medication ON and OFF | Thirty-two-channel EEG during 3 min focusing on an image at 512 H. | EEG recordings were split in half and then converted into spectrograms using Gabor transform. | CNN | Two-dimensional-Conv (16 filters kernel 5 × 5, ReLu), Dropout (0.2), 2D-Conv (32 filters, kernel 3 × 3, ReLu), MaxPooling, Flatten, Dense (unit size of 512, ReLu), Dropout (0.7), Dense (unit size of 3 for Softmax and 1 for sigmoid). Adam optimizer was used with a learning rate = 0.001 and a decay rate of 0.01. | 10-fold cross validation | Results for 3 class classification: Accuracy: 99.46 ± 0.73 Precision: 99.48 ± 0.01 Sensitivity: 99.46 ± 0.01 F1 Score: 99.46 ± 0.01 |
| [40] | Determine the optimal montage to detect FOG. | Subjects: 7 PD Age: Not specified | HY scale: Not specified UPDRS: Not specified DiseaseDuration: Not specified Medication: OFF | Thirty-two-channel EEG in main cortical regions at 512 Hz during a structured series of Timed Up and Go tasks. Average of 2 ear lobes electrodes was taken as reference. Data were segmented into 1 s windows and filtered at 0.5–50 Hz. 343 s of EW and 343 s of FOG samples were collected. | Division in bands was implemented. Z-transformation was applied to normalize EEG data. Power spectral density, centroid frequency and power spectral entropy were extracted. | Feed-forward neural network | Six hidden nodes. Levenberg Marquardt’s algorithm with early stopping was used. | Fifty times runs. Data was divided into training 34%, validation 33%, and testing 33%. | Results with only 2 channels C4-O2: Sensitivity: 72.54 Accuracy: 69.71 |
| [41] | Classification of PD patients vs. controls. | Subjects: 100 PD and 100 controls. Age: PD: (50–70) HC: (50–70) | HY scale: 1–1.5 UPDRS: Not specified Disease Duration: Not specified Medication: Not specified | Two-channel EEG recorded for 30 min for the flexion and extension of the wrist. 5–50 Hz band-pass filter was applied. | EEG: Lyapunov and inverse Lyapunov exponent, Shannon Entropy EMG: power, standard deviation, root mean square, variance, waveform length, modified median, and mean frequency. | MLP | Three algorithms were tested. 1. Gradient Descent algorithms (traingd, traingdm), 2. Conjugate Gradient algorithms (traininscg, traincgp), and 3. Quasi-Newton algorithms (trainbfg, trainlm). Sigmoid function was used in the hidden layer. The number of hidden neurons was checked for 5, 7, 9, 10, 20, and 30. | The dataset was divided into training 70%, validation 15%, and testing 15%. | ANN with trainlm and 10 neurons: Accuracy = 100 RMSE = 4.03 × 10⁻³ R value = 0.9998 |
| [42] | Classification of PD patients vs. controls. | Subjects: 40 PD and 30 controls Age: PD: 63.53 ± 4.95 HC: 64.72 ± 5.74 | HY scale: Not specified UPDRS: Not specified Disease Duration: Not specified Medication: Not specified | Sixty-four-channel EEG recorded during 40 vocalizations of 5–6 s of the vowel /u/ with 5 pitch shifts each. The impedances were kept below 50 kΩ. A band-pass filter at 1–20 Hz was applied. The signals were segmented in epochs of 700 ms that contained the pitch shift. Referenced to the average of the mastoid electrodes. Trials with artifacts were rejected. | The epochs were the input data. | CNN, RNN, 2D-CNN-RNN, 3D-CNN-RNN | CNN: 8 layers. 2 -Conv, max-pooling, Conv, max-pooling, Conv, 2 fully connected layers with 1000 and 500 units. RNN: GRU layer with 6 units and 2 fully connected layers with 1280 and 300 units. 2D-CNN-RNN: Conv, GRU with 6 units and 2 fully connected layers with 2000 and 300 units. 3D-CNN-RNN: 2 Conv, max-pooling, GRU with 6 units and 2 fully connected layers with 2000 and 300 units. All models shared Adam optimizer with learning rate 0.001, ReLU activation, and softmax for the output layer. Filters, strides, and depths were specified. | Five-fold cross-validation. The trials from the same patient were involved in either training or test. | The best model was 3D-CNN-RNN: Accuracy = 82.89 ± 9.60 |
| [43] | Classification of PD patients vs. controls. | Subjects: 27 PD and 30 controls Age: Not specified | HY scale: Not specified UPDRS: Not specified Disease Duration: Not specified Medication: Not specified | Two-hundred-fifty-six-channel EEG recorded during 2 types of visual stimuli (Stim and No-Stim) of 2.4 s. 185 electrodes were selected removing the channels located on the face and neck. Cleaning was not specified. | For each trial, the FFT of the last 2.24 s was computed. The features consisted of the spectral amplitudes. Six channels over the occipital area were selected providing a total of 162 patient data and 180 control data. | LR, DT, RF | DT: Gini index measure of entropy was used, maximum depth of 5, minimum of 2 samples for split, and a minimum number of 1 sample per leaf as stopping criterion. RF: 100 trees of a max depth of 30. | For each stimulus 1000 runs of random train (70%) and validation (30%). The models were tested using the other stimulus. | For both methodologies, the best model was RF. Stim for train: AUC_val = 0.994 AUC_test = 0.71 No-Stim for train: AUC_val = 0.998 AUC_test = 0.66 |
| [44] | Classification of PD patients vs. controls. | Subjects: 21 PD and 25 controls. Age: PD: 62.7 ± 7.32 HC: 54.6 ± 10.5 | HY scale: 2.07 ± 0.39 UPDRS: PD: 31.00 ± 10.37 HC: 0.83 ± 1.27 Disease Duration: Not specified Medication: OFF | Twenty-channel EEG recorded during 5 min in resting state with eyes-closed. Two recordings were performed per patient. Cleaning was not specified. | Coherence analysis with 2 s windows with 50% overlap was carried out. Pearson’s correlation was calculated to assess the relationships between coherence and disease severity. The relative and absolute PSD were calculated at 1–40 Hz. Only 14 EEG-based features were used. | DFA | A linear DFA was used. The classifier input was selected by utilizing the step-wise discriminant analysis procedure in the SPSS software package. | Cross-validation. | Accuracy = 95.24 Sensitivity = 94.74 Specificity = 95.65 PPV = 94.74 NPV = 95.65 An excessive coherence was observed in the beta and gamma bands for PD. |
| [45] | Clasification of PD patients with MCI vs. NC | Subjets: 36 PD with MCI and 35 PD with NC Age: PD-MCI: 61.1 ± 8.2) PD-NC: 57.0 ± 11.9 | HY scale: PD-MCI: 2.1 ± 0.7 PD-NC: 1.9 ± 0.7 UPDRS: PD-MCI: 21.9 ± 8.7 PD-NC: 21.7 ± 9.4 Disease Duration: PD-MCI: 2.8 ± 2.3 PD-NC: 3.6 ± 3.6 Medication: ON | Sixteen-channel EEG recorded during 30 min at 250 Hz. The impedances were set to Z > 100 MΩ. High-pass filter at 0.16 Hz and low-pass filter at 500 Hz were applied before pre-amplification. Wavelet decomposition and reconstruction were made. Within 60 s segments, epochs with eyes-open without any obvious artefacts were selected. Artefacts were further eliminated by ICA. | Sixty-four features were calculated from power spectrum for 4 bands. Other features from MR were calculated. The feature importance method of Mean Impact Value was used to categorize the contribution of all features. | SVM | RBF kernel was applied. The regularization parameters were identified using a “grid search”. | Five-fold cross-validation on 80% of patients. 20% for test. Additional LOO cross-validation. | Only features from EEG Train: Accuracy: 64 Sensitivity: 68 Specificity: 62 PPV: 54 NPV: 75 AUC: 66 LOO-CV: 66 In test: Accuracy: 67 Sensitivity: 67 Specificity: 67 PPV: 75 NPV: 57 AUC: 71 |
| [46] | Classification of HC vs. patients with different types of psychological disorders. | Subjets: 25 PD and 25 controls Age: PD: 69.68 ± 8.73 HC: 69.32 ± 9.58 | HY scale: Not specified UPDRS: Not specified Disease Duration: Not specified Medication: Not specified | Sixty-channel EEG in Oddball task at 500 Hz. A band-pass filter at 0.1–60 Hz was applied. Low variance electrodes are dropped, so 30 electrodes were selected. | Pre-processed data were segmented into 4 s epochs in case of non ERP data and original trial length is kept in case of ERP data. In total, 26 linear and non linear features including time and frequency domain features were calculated using linear SVM classifier. | SVM, LR, KNN, DT | SVM: RBF kernel. Grid search technique is used to tune the hyper-parameters | Five-fold cross validation | On PD patients vs. HC the best results for the selection of electrodes: Accuracy: 82 F1 Score: 80 Precision: 85 Recall: 82 Model not specified. |
| [47] | Selection of the best QEEG features to identify different levels of cognitive impairment in PD. | Subjects: 118 PD classified into 5 groups according to the severity of the disease. G1: n = 28, G2: n = 33, G3: n = 43, G4: n = 5, G5: n = 9. Age: G1 = 60.54 ± 8.75 G2 = 66.09 ± 6.65 G3 = 67.04 ± 7.94 G4 = 73.19 ± 5.29 G5 = 67.56 ± 5.51 | HY scale: G1 = 1.93 ± 0.4 G2 = 2.14 ± 0.55 G3 = 2.21 ± 0.59 G4 = 2.40 ± 0.55 G5 = 2.00 ± 0.97 UPDRS: G1 = 26.00 ± 11.73 G2 = 29.55 ± 12.22 G3 = 28.74 ± 11.44 G4 = 31.00 ± 12.79 G5 = 29.00 ± 18.87 Disease Duration: G1 = 7.75 ± 5.29 G2 = 8.36 ± 7.49 G3 = 8.81 ± 5.02 G4 = 6.60 ± 3.58 G5 = 12.00 ± 6.56 Medication: ON | One-hundre-twenty-two-channel EEG recorded during 10 min in resting state. Average reference and 0.1–100 Hz bandwidth filter. Ocular artifacts were corrected and a 50 Hz filter was applied. Periods of drowsiness were removed, and the semi-automatic rejection of artifacts was performed to eliminate muscle activity. Each channel was divided into 4 s epochs. At least 20 segments were used for the analysis. | The relative and absolute spectral power were obtained for each epoch using a FFT and a 50% overlap for the delta, theta, alpha, and beta bands. A division into 5 ROI was performed. For each case, high and low electrode density were considered. A statistical dependency study with an analysis of variance and the selection of characteristics with Pearson’s correlation method was carried out. | SVM, KNN | SVM: Gaussian kernel KNN: k = 9 and the Euclidean distance as a metric. | Data were split into a training set (n = 100) and a test set (n = 18). The training set was used for 5-fold cross-validation. | SVM: Accuracy = 87 ± 3.5 KNN: Accuracy = 88 ± 2.8 Both were achieved for the relative power with low-electrode density. Groups with few patients had worse results. |
| [48] | Identify patients with early PD. | Subjets: 29 drug-off early PD, 12 drug-on early PD and 22 controls Age: PD-OFF: 62.4 ± 6.3 PD-ON: 65.3 ± 5.4 HC: 63.8 ± 5.5 | HY scale: 1 UPDRS: PD-OFF: 15.8 ± 7.5 PD-ON: 14.3 ± 6.2 Disease Duration: Not specified Medication: ON and OFF | Nineteen-channel EEG recorded in resting state with eyes-closed at 500 Hz with additional channels for ECG, EMG, and EOG. Impedances were kept below 5 kΩ. Fast-ICA was applied to remove artifacts. Epochs with amplitude > 80 μV were rejected. More than 5 min signals were kept for each subject. A band-pass FIR filter at 0.5–45 Hz was used. Signals were segmented into 2 s non-overlapping epochs. | EEG signals were decomposed into two bands through the FIR filter. The P-Welch function was used to calculate the PSD of each channel within each epoch at 0.5–45 Hz with step size of 0.5 Hz. Models were fed with channel-frequency PSD and structured PSD. A personalized characteristic index of frequency domain was calculated for statistical anlysis. | CNN, SVM, MLP | SVM: linear kernel CNN: 3 2D-convolutional layers (with 3 × 3 filters and 8, 16 and 32 neurons respectively), with layer normalization after each of them, and 2 full-connect layers (with 4576 and 40 neurons) before the ‘Softmax’ layer. Nadam optimizer with learning rate of 0.001 was used. | The dataset was obtained shuffling drug-off early PD group and HC group. It was divided into training (80%) and test (20%). The training set was used for 8-fold cross-validation. | The CNN model on the test set of structured PSD yielded: Accuracy: 99.87 ± 0.03 AUC: 99.88 ± 0.05. |
| [49] | Classification of HC vs. PD patients. | Subjects: 15 PD and 18 HC Age: PD: 67.3 ± 6.5 HC: 67.6 ± 8.9 | HY scale: 1.3 UPDRS: 23.3 ± 9.1 Disease Duration: 7.4 ± 4.3 Medication OFF | Twenty-seven-channel EEG recorded during 60 s in resting-state with eyes-open at 1000 Hz. The noise was removed. | Signals were filtered into four frequency bands, by a two-way FIR filter. A general orthogonalized directed coherence was used in each band to compute directional connectivity maps, which were normalized and converted into 2D images, resized to fed the VGG-16 model. LASSO regression models were computed for 30 runs separately on latent and non-latent cases. In each run, data were ramdomly divided in train (25) and test (8) sets. In total, 30 results with least MSE at each run were considered as the LASSO coefficients. | VGG-16 | VGG-16 with modifications: functional VGG-16, maxpooling layer (512 units), fully connected layer (512 units), fully connected layer (64 units) with ReLU activation function, and fully connected layer (2 units) with Softmax activation function. Optimizer: SGD. Learning rate: 0.01. Decay: 0.001. Batch size: 8. Loss function: binary cross entropy. | The model was tested 10 times on randomly chosen train/test partitions. The test data set was 25% of data that had been randomly selected. | After 10 random repetitions with deep transfer learning Accuracy: 99.62 Precision: 100 Recall: 99.17 F1-score: 0.996 AUC: 0.996 Latent features were correlated with five clinical indices. |
| [50] | Classification of HC vs. PD patients. | Subjects: 9 PD and 9 HC Age: PD: 55.22 ± 6.25 HC: 52.11 ± 4.98 | HY scale: 2.28 ± 0.71 UPDRS: 25.89 ± 7.32 Disease Duration: Not specified Medication: Not specified | Thirty-two-channels EEG recorded in resting state with eyes-open during 15 min at 1000 Hz. Impedances were kept below 5 kΩ. An online bandpass filter at 0.1–100 Hz and an offline bandpass filter at 0.1–45 Hz were used. Artifacts were removed with ICA. Segments exceeding 150 μV were removed. ECG, PPG and RA signals were synchronously recorded. In total, 14 epochs of 60 s without artifacts were selected per subject. | Absolute and relative powers, were computed for each electrode for 4 frequency bands, as well as sensory-motor rhythm, and the ratio of alpha to theta spectrums. For feature selection, the elastic network was employed with optimal norm regularization parameters L1 and L2. | SVM | A linear kernel was used. | Nine-fold cross validation. Experiments were randomly repeated 10 times. In each one, the model parameters and feature selection were determined by inner iterations | For only EEG: Accuracy: 87.54 ± 13.46 Sensitivity: 86.19 ± 15.14 Specificity: 88.89 ± 19.75 The EEG of PD patients had a significant decrease in high-frequency power. |
| [51] | Classification of 3 diseases between them and vs. controls. | Subjects: 16 PD and mached controls Age: Not specified | HY scale: Not specified UPDRS: Not specified Disease Duration: Not specified Medication: ON | Eight-channel EEG during 10 s in a CNV trial. Some artifacts were removed and a low-pass filter at 30 Hz was applied. Mean level and baseline corrections were performed. For each trial, 2 epochs of 512 ms were extracted. | Sixteen amplitude measures and a time measure were generated. The time measure included the post-imperative negative variation. | MLP | Input layer with 17 nodes, 1 hidden layer with 40 nodes, and 1 node for the output layer. The parameters were: gain = 1, momentum = 0.6 and learning rate = 0.9. Back-propagation was used. | LOO cross-validation. | For PD vs. controls: Sensitivity = 100 Specificity = 94 False-ve = 0 False+ve = 6 PPV = 94 NPV = 100 FAR = 6 FRR = 0 |
| [52] | Clasification of HC vs. PD patients with and without medication. | Subjects: 15 PD and 16 HC Age: PD: 63.2 ± 8.2 HC: 63.5 ± 9.6 | HY scale: 2–3 UPDRS Not specified Disease Duration: 4.5 ± 3.5 Medication: ON and OFF | Thirty-two-channel EEG during 3 min in resting state with eyes-open at 512 Hz. The mean of the data was removed and were re-referenced to the common average. A highpass filtering at 0.5 Hz was used. The artifacts were manually examined and removed. Data were segmented into 2 s epochs. | An automated tunable Q wavelet transform was used to extract representative subbands. Five features were extracted from the subbands. The clinical significance of features are tested using the Kruskal–Wallis test. | SVM, ANN, KNN, RF, LSSVM | LSSVM: polynomial (d = 10), RBF (sigma = 0.05), Morlet (ai = 0.01), Sinc and Mexican Hat (ai = 22 and constant omega = 0.5) were tested. KNN: k = 10. RF: total number of learner was 10. SVM: Fine Gaussian kernel with automatic boxconstraint level. ANN: 10 hidden neurons. | Ten-fold cross-validation. | The results with LSSVM were: HC vs. PD OFF Accuracy: 96.13 AUC: 97 HC vs. PD ON Accuracy: 97.65 AUC: 98.56 |
| [53] | Identification of the cognitive decline in PD patients. | Subjects: 20 PD patients with good cognition and 20 PD patients with poor cognition Age: Not specified | HY scale: Not specified UPDRS: Not specified Disease Duration: Not specified Medication: Not specified | Twenty-one-channel EEG recorded during 15–20 min in resting state with eyes-closed. The signals were band-pass filtered at 0.16–70 Hz. For each patient, 5 visually inspected artifact-free epochs of 8.192 s were extracted. | Seven-hundred-ninety-four-time features were extracted from each channel. In addition, several clinical and spectral features were considered. The boruta algorithm was used for feature selection. | RF | The Bayesian algorithm was chosen for hyperparameter optimization. The depth of each tree and the number of trees were 1 to 100. The minimum number of samples in the leaf node and to split a node were 1 to 10 and 2 to 20, respectively. | Five runs of 10-fold cross-validation | The modeling approach (4) had the best performance. The boruta algorithm selected 1 to 3 features. None of them were clinical. Accuracy = 84.0 ± 4.2 F1 = 85.6 ± 3.2 Precision = 88.3 ± 6.9 Sensitivity = 83.0 ± 2.7 AUC = 86.8 ± 6.0 |
| [54] | Classification of PD patients vs. HC. | Subjects: 25 PD and 25 HC Age: PD: 58.7 ± 7.7 HC: 54.6 ± 7.7 | HY scale: 1–2 UPDRS: Not specified Disease Duration: 5.6 ± 3.5 Medication: Not specified | Seventeen-channel EEG recorded during 5 min in resting state with eyes-colsed at 200 Hz. Impedances were kept below 5 kΩ. Signals were amplified, a notch filter at 50 Hz, and a bandpass filter at 0.5–30 Hz were applied. ICA was used. The data were re-referenced to the average reference. Signals were segmented into 5 s windows with 2.5 s overlap. | EEG segments were decomposed, using dynamic mode decomposition, into stable and unstable components at four frequency band. By Pearson correlation, stable brain network, unstable brain network, and inter-connected brain network were constructed and thresholded separately. Traditional brain network was also constructed. Topological attributes were extracted. | SVM, BN, RF, SGD, KNN, Adaboost, RT, bagging, SL, vote methods | Not specified | Ten-fold cross-validation | The average results for all classifiers: Using the stable brain network attributes Precision: 89.6 Recall: 89.5 AUC: 90.8 Using traditional brain network attributes Precision: 85.4 Recall: 85.0 AUC: 85.4 |
| [55] | Detection of Turning Freezing in PD patients. | Subjects: 6 PD Age: Not specified | HY scale: Not specified UPDRS: Not specified Disease Duration: Not specified Medication: OFF | Fifteen-channel EEG recorded during Timed Up and Go tasks. The EEG was segmented to 1 s epochs associated with normal turning or turning freezing, which resulted in 204 s of each of them. A band-pass filter at 0.5–40 Hz was used. Artifacts were removed. Z-transformation was applied to normalize the signals. | Two parameters were extracted from the theta, alpha, low beta, and high beta spectral bands using S-transform. These were the maximum amplitude for each band and the sum of amplitude of each band. ICA-EBM was considered for source separation. | BNN | Three-layer (input, hidden, and output layers) feed-forward structure. Either 4 (for 15 channels) or 7 (for 4 channels) hidden nodes were considered. | Data were randomly split into 50% for training and 50% for test sets. | Best results with ICA, 4-channels and 7 hidden nodes. Train: Accuracy = 86.8 Sensitivity = 85.8 Specificity = 88.0 Test: Accuracy = 86.2 Sensitivity = 84.2 Specificity = 88.0 AUC = 0.9296 |
| [56] | Detecting the occurrence of GIF | Subjects: 4 PD Age: Not specified | HY scale: Not specified UPDRS: Not specified Disease Duration: Not specified Medication: OFF | Thirty-two-channel EEG during a structured series of Timed Up and Go tasks at 512 Hz. Only data from 9 electrodes positioned in locations of interest were processed. Average of 2 ear lobes electrodes was taken as reference. Data were segmented into 1 s windows and filtered using a nonlinear IIR band-pass filter with a cut-off frequency lower than 1 Hz and higher than 50 Hz to remove artifacts. In total, 122 EEG samples were collected, associated to Good Start (61) and Gait Initiation Failure (61). | Welch’s method with a 256 points FFT with 55% overlapping was used to analyze four frequency sub-bands. Power spectra density and centroid frequency of each band were calculated. | BP-NN | Two-layer feed-forward neural network with 10 hidden nodes. Activation function of the hidden layer was tan sig. Levenberg Marquardt’s algorithm with early stopping was used. | In total, 50 times runs. Data was randomly divided into training 34%, validation 33%, and testing 33%. | The best performance of the classification system was achieved with a combination of nine channels: Sensitivity: 84.27 Specificity: 85.02 Accuracy: 84.80 |
| [57] | Classification of PD patients with medication, without medication, and controls. | Subjects: 10 PD and 12 controls Age: PD: (40–80) HC: (40–80) | HY scale: 1–2 UPDRS: Not specified Disease Duration: Not specified Medication: ON and OFF | Sixty-one-channel EEG recorded during 2 min in resting state followed by 140 s of intermittent photic stimulation with eyes-closed. In total, 10 electrodes were selected. Band-pass filter at 0.5–50 Hz and a 60 Hz notch filter were applied. Average reference was used. The artifacts were removed. The impedance remained below 5 kΩ. | The last 10 s stretch of stimulation was divided into 20 segments of 0.5 s which were used to calculate the partial directed coherence for 6 bands (delta, theta, alpha, beta, gamma1, and gamma2). A total of 60 features were calculated. In total, 19 features were selected using GA with a population of 20 individuals, 20 generations, a crossover probability of 0.6, and a mutation probability of 0.03. Both approaches were considered as inputs. | BN, NB, MLP, SVM, J48, RT, RF, ELM, mELM | MLP: hidden layers 1 and 2, learning rate 0.3, momentum 0.2, iterations 500. SVM: polynomial kernel (exponent = 1 to 5) RBF kernel (gamma = 0.25 and 0.5). RF: Trees 10 and 50. ELM: 100 neurons in the hidden layer and sigmoid kernel. mELM: 100 neurons in the hidden layer, dilatation, and erosion kernels. | K-fold cross-validation. | The best model was RF with 50 trees. All features: Accuracy = 99.22 19 features: Accuracy = 98.09 |
| [58] | Classification of PD patients vs. controls using 6 emotional stimuli. | Subjects: 20 PD and 20 controls Age: PD: (40–65) HC: (40–65) | HY scale: Not specified UPDRS: Not specified Disease Duration: Not specified Medication: Not specified | Fourteen-channel EEG recorded during emotional stimuli. The signals were segmented into 10 s epochs with overlapping of 75%. Then, pass-band elliptic filters were used to obtain the alpha, beta, and gamma bands. | For each band, 6 features were calculated: Entropy (EN), Energy-Entropy (EEN), Teager Energy-Entropy (TEEN), Spectral Entropy (SEN), Spectral Energy-Entropy (SEEN), and Spectral Teager Energy-Entropy (STEEN). | PNN, KNN, SVM | KNN: k in the range 1 to 10. PNN: used exponential activation function with σ ranged from 0.55 to 0.65. | Not specified. | The best accuracy for each emotion: Happiness: 99.59 with SVM and TEEN Sadness: 90.81 with KNN and EN Fear: 95.07 with KNN and SEEN Anger: 91.42 with SVM and SEEN Surprise: 94.53 with KNN and SEEN Disgust: 88.18 with SVM and SEEN. |
| [59] | Classification of PD patients vs. controls using 6 emotional stimuli. | Subjects: 20 PD and 20 controls Age: PD: (40–65) HC: (40–65) | HY scale: Not specified UPDRS: Not specified Disease duration: Not specified Medication: Not specified | Fourteen-channel EEG recorded during emotional stimuli. The signals were segmented into 10 s epochs with overlapping of 75%. Then, pass-band elliptic filters were used to obtain the alpha, beta, and gamma bands. | For each band, 4 features were calculated: Entropy (EN), Energy-Entropy (EEN), Spectral Entropy (SEN), and Spectral Energy-Entropy (SEEN). | PNN, KNN | KNN: k in the range 1 to 10. PNN: exponential activation function with σ ranged from 0.55 to 0.65. | Not specified. | The best accuracy for each emotion: Happiness: 96.8 with PNN and SEEN Sadness: 90.81 with KNN and EN Fear: 95.07 with KNN and SEEN Anger: 88.65 with KNN and EN Surprise: 94.53 with KNN and SEEN Disgust: 87.43 with KNN and EN. |
| [60] | Classification of 3 diseases and controls through 4 methodologies. | Subjects: 15 PD and 16 controls Age: Not specified | HY scale: Not specified UPDRS: Not specified Disease Duration: Not specified Medication: Not specified | Twelve-channel EEG recorded during approximately 250 ms. Cleaning and task were not specified. | Features selected through 4 methodologies: 1. The maximum amplitude and frequency of the FFT in alpha, beta, theta, and gamma bands. 2. Amplitudes of the first 8 peaks of the FFT and their frequency values up to 30 Hz. 3. The FFT of the EEG signal below 30 Hz. 4. The maximum amplitude and frequency of the FFT in each band were applied to the combination of the 12 electrodes. | ANN | Feed-forward architecture with 16 nodes in the hidden layer. Activation functions were logsig and tansig. The training algorithm was Levenberg-Marquardt. | In total, 75% training, 12.5% validation and 12.5% test. The sets were balanced in terms of pathologies that contained each one. | Bad results were expressed in terms of the correlation coefficient between target and predicted values. |
| [61] | Classification of RBD patients vs. controls. Some patients were eventually diagnosed with PD and dementia. | Subjects: 118 RBD and 74 controls. 14 RBD became PD. No direct patient data. Age: Not specified | HY scale: Not specified UPDRS: Not specified Disease Duration: Not specified Medication: Not specified | Fourteen-channel EEG recorded in resting state with open-eyes periods followed by closed-eyes periods. Only eyes-closed sequences were considered. The EEG was recorded when the patients were RBD. A band-pass filter at 0.3–100 Hz and a notch filter at 60 Hz were applied. Artifacts were removed. | Using a sliding window of 1 s, 148 spectrograms per subjet were generated (of 20 s of duration each) using only the FFT amplitude bins in the band 4–44 Hz. The spectrograms were centered and normalized to unit variance for each frequency and channel. | CNN, RNN | CNN: 4 hidden-layer convolutional. Dropout, max-pooling layers, and cross-entropy loss function were used. RNN: with LSTM and GRU, with 3 cells which 32 units each. Dropout was used. | LOO cross-validation. For training, the dataset was balanced by random replication preserving the distribution of the subjects. | The results for controls vs. PD: CNN: Accuracy = 79 ± 1 AUC = 0.87 ± 0.1 RNN: Accuracy = 81 ± 1 AUC = 0.87 ± 0.1 In RNN, there was no difference between LSTM and GRU. |
| [62] | Classification of PD patients with RBD vs. controls. | Subjects: 14 RBD with PD and 14 controls. Age: Not specified | HY scale: Not specified UPDRS: Not specified Disease Duration: Not specified Medication: Not specified | Fourteen-channel EEG recorded in resting state with open-eyes periods followed by closed-eyes periods. Only eyes-closed sequences were considered. The EEG was recorded when the patients were RBD. A band-pass filter at 0.3–100 Hz and a notch filter at 60 Hz were applied. Artifacts were removed. | Several spectrograms were computed to extract temporal series of power for each electrode and band (10 bands in total). The use of 4 s and 1 s spectrogram windowing was explored. | RNN | ESN layer with 3000 nodes, least-squares regularization. Spectral radius ranged from 0.5 to 2. | For each parameter set, 50 runs were carried out with random and balanced training (90%) and test (10%) sets. | The best performance was obtained with 1 s. Test set: Average_accuracy = 85 |
| [63] | Classification of PD patients vs. controls. | Subjects: 30 PD and 30 controls. Age: PD: (50–70) HC: (50–70) | HY scale: 1–1.5 UPDRS: Not specified Disease Duration: Not specified Medication: Not specified | Two-channel EEG recorded for 30 min for the flexion and extension of the wrist. Cleaning was not specified. | EEG: Shannon entropy, Lyapunov, and inverse Lyapunov exponent were calculated. EMG: power, standard deviation, root mean square, variance, waveform length, modified median, and mean frequency. | MLP | Back Propagation was used as the learning algorithm and “trainlm” was used as the training function. Sigmoid transfer function was used for the hidden layer. | The dataset was divided into training 70%, validation 15%, and testing 15%. | MLP with inputs: EEG: accuracy = 62 EMG: accuracy = 73 EEG + EMG: accuracy = 98.8 |
| [64] | Classification PD and HC | Subjects: 16 PD and 15 controls Age: PD: 62.6 ± 8.3 HC: 63.5 ± 9.6 | HY scale: Not specified UPDRS: Not specified Disease Duration: Not especified Medication: OFF | Forty-channel EEG during 2 min in resting state at 512 Hz. Signals were segmented into patches of 512 time samples. | EEG patches of 512 samples were used as input. Channels were considered independently. | ANN | Twelve layers with 512, 512, 128, 128, 64, 64, 32, 32, 16, 16, 8, and 2 (output) units. The conjugate gradient backpropagation with Polak-Ribiére updates was used for updating the weights, and biases of the network. Grid search was used for hyper-parameters selection. | In total, 20% for testing and the rest was used for training and validation. | The Oz/P8/FC2 channels were selected and used with majority voting. Results on test set were: Accuracy: 98 Sensitivity: 97 Specificity: 100 |
| [65] | Classification of PD patients with ON medication vs. OFF medication. | Subjects: 28 PD Age: 69.75 ± 8.43 | HY scale: Not specified UPDRS: Not specified Disease Duration: Not specified Medication: ON and OFF | Sixty-four-channel EEG recorded during 12 min in the oddball task. In total, 60 electrodes were selected during the period without stimuli. A band-pass filter at 13–30 Hz was applied. Non-brain activities were subtracted. | The average spectral power over all the frequency ranges was calculated and added together. The differences between OFF and ON medication data were compared. In total, 12 channels were selected. A preprocess with delay (τ = 12) and embedding dimension (m = 3) were applied. Three sets of 12 time-series (non-delayed, τ-delayed and 2τ-delayed) were generated. | EEGNet, HNet, DGHNet | ADAM optimizer with learning rate = 10−4 for 500 epochs was used. HNet: 3 layers (Convolutional, LSTM, LSTM) with 28 filters, 14 and 2 neurons, with sigmoid, sigmoid, and Softmax activation. DGHNet: 2Dconvolutional as input layer with 4 filters and exponential linear activation. Values of m = 4 and τ = 3, 6, 9, 12, and 17 were trained. 1Dconvolutional with exponential linear activation. LSTM with 2 outputs and softmax activation. | Intra-patient: the data was randomly shuffled and split into 90% training and 10% test. The training dataset was divided into 85% training and 15% validation. Inter-patient: 2 patients with ON and OFF medication were randomly left out for the test. The remaining patients were partitioned at 85% training and 15% validation. | The results of HNet and DGHNet were similar (accuracy: 99.74 vs. 99.22). DGHNet was considered better for containing fewer parameters. Test: Accuracy = 99.22 Sensitivity = 98.98 Specificity = 99.46 MCC = 98.44 F1 = 99.24 |
| [66] | Classification of PD patients vs. HC | Subjects: 9 PD and 9 HC Age: Not specified | HY scale: Not specified UPDRS: Not specified Disease Duration: Not specified Medication: Not specified | Twenty-channel EEG recorded in 3 epochs of 1 min during externally paced bilateral, cyclical foot in the sitting position at 1200 Hz. | Kolmogorov Complexity, Sample Entropy, and Approximate Entropy were extracted for each channel. Different subsets of electrodes were considered, and their associated features were used as input. | MLP | Five hidden layers chosen by trial and error method. | Ten-fold cross validation | The best results were obtained for the channels Fz, F1, and F2: Accuracy: 97.5 Precision: 100 Sensitivity: 96.7 Specificity: 100 AUC: 0.978 |
| [67] | Selection of the best classifier of PD vs. controls using the minimum number of HOS features. | Subjects: 20 PD and 20 controls. All right-handed. Age: PD: 59.05 ± 5.64 HC: 58.10 ± 2.95 | HY scale: 1: n = 2; 2: n = 11; 3: n = 7 UPDRS: Not specified Disease Duration: 5.75 ± 3.52 Medication: ON | Fourteen-channel EEG recorded during 5 min in resting state with eyes-closed. Threshold technique at 80 µV. A band-pass filter at 1–49 Hz was applied. 2 s epochs with 50% overlap were considered. | For each epoch, a total of 13 HOS characteristics were calculated. The Student’s t-test was also obtained to determine the importance of the characteristics. | DT, KNN, FKNN, NB, PNN, SVM | FKNN: Euclidean distance, m = 1.24 and k = 3. KNN: k = 2 and Euclidean distance. PNN: exponential activation and σ = 0.284. SVM: polynomial (orders 2 and 3), RBF, and linear kernels. | Ten-fold cross-validation. The characteristics were added one by one to each classifier until maximum precision was achieved. | The best model was SVM with RBF kernel: Accuracy = 99.62 ± 0.58 Sensitivity = 100 ± 0.0 Specificity = 99.25 ± 0.53 Precision = 99.38 ± 0.47 F1 Score = 0.98 ± 0.05 |
| [68] | Identification of the onset of freezing of PD patients during walking | Subjects: 26 PD Age: 69.8 ± 8.41 | HY scale: Not specified UPDRS: Not specified Disease Duration: Not specified Medication: Not specified | Four-channel EEG recorded in periods of 1–2 h per patient at 500 Hz during a structured series of video-recorded Timed Up and Go tasks. Only data from 10 patients and differential channels O1-T4 and P4-T3 were used. Epochs of 1 s from individual freezing events were taken. Band-pass at 0.5–60 Hz, and band-stop at 50 Hz butterworth IIR filters were applied. An additional threshold filter was applied. | Data were divided into normal, onset, and freezing with 40 samples per subject and group. Discrete wavelet transform was used to calculate waveled entropy for 5 frequency bands, and total waveled entropy. The model was fed with the wavelet entropy of 3 bands an total for channel O1-T4, and all bands and total for channel P4-T3, separately and in combination. | BP-NN | Three layers with 4–7 hidden nodes depending on the number of inputs dimension and the number of training pairs. Levenberg Marquardt algorithm was used. Activation function was Tangent Sigmoid. | Twenty runs for each feature. Data was divided in training 56%, validation 25%, and test 19%. | The results for Normal vs. Onset for P4-T3 were: Accuracy: 76.6 ± 3.4 Sensitivity: 74.2 ± 6.8 Specificity: 78.9 ± 7.3 Normal vs. Freezing for O1-T4 and P4-T3: Accuracy: 73.9 ± 2.8 Sensitivity: 71.2 ± 6.1 Specificity: 77.2 ± 4.7 |
| [69] | Predicting transition to FOG from normal walking | Subjects: 26 PD Age: 69.8 ± 8.41 | HY scale: Not specified UPDRS: Not specified Disease Duration: Not specified Medication: Not specified | Four-channel EEG recorded in periods of 1–2 h per patient at 500 Hz during a structured series of video-recorded Timed Up and Go tasks. Data from 10 patients without significant artifacts were selected and differential channels O1-T4 and P4-T3 were used. Epochs of 1 s were taken. Band-pass at 0.5–60 Hz, and band-stop at 50 Hz butterworth IIR filters were applied. Ocular and muscular artifacts were removed. | Data were divided into normal, transition, and freezing with 40 samples per subject and group. Discrete wavelet transform was used to calculate total, global and centroid frequency wavelet cross spectrum for 5 bands, wavelet cross frequency energy ratios por specific pairs of bands. Other statistical features were computed. In total, 131 features were selected to feed the model separately and in combination. | MLP, KNN | MLP: 3 layers with 8 to 12 hidden layer neurons. The Levernberg Marquardt algorithm was used. Error goal of 0.01. KNN: 15 to 40 nearest neighbors based on the Euclidian distance. | Twenty runs for each feature and their combination. Data was divided into training 56%, validation 25%, and test 19%. | Using MLP with statistical features: Sensitivity: 75.47 Specificity: 71.47 Accuracy: 73.47 For kNN with all features were: Sensitivity: 87.25 Specificity: 70.00 Accuracy: 52.75 |
| [70] | Classification of HC vs. PD patients through different emotional states. | Subjects: 5 PD and 5 controls Age: PD: 45–65 HC: 20–25 Age for each subject were specified | HY scale: Not specified UPDRS: Not specified Disease Duration: Not specified Medication: Not specified | One-channel EEG recorded while watching happy, sad, and neutral videos, and during meditation in resting state with eyes-closed. The EEG collecting device produced power values for eight frequency bands, and attention values. | Benjamini-Hochberg corrected F-tests and t-tests were applied on attention level, average power of frequency bands, and on absolute value of first and second order derivatives. An initial model was fed with first and second order derivatives for each pair emotion-band. Meditation was not used. The three best pairs were combined in the final model. Input features were preprocessed to have zero mean and unit variance. | MLP | Initial model: 1 hidden layer with 4 neurons. Final model: 2 hidden layers with 4 and 2 neurons, respectively. Adam optimizer, Log-loss loss function, and activation function tanh were used in both. | Five-fold cross validation | The results of the final model were: Accuracy: 0.965 F1 score: 0.976 Recall: 0.970 Precision: 0.955 |
| [71] | Classification of patients with neurological diseases vs. controls. | Subjects: 31 PD and 264 controls. Age: PD: 56.62 ± 12.32 HC: 49.51 ± 12.54 | HY scale: 1–3 UPDRS: 43.44 ± 15.53 Disease Duration: Not specified Medication: Not specified | Nineteen-channel EEG recorded during 5 min in resting state with eyes-closed. The impedances were kept below 5 kΩ. A high-pass filter at 0.15 Hz and a low-pass filter at 200 Hz were used. A band-pass filter at 2–44 Hz was applied. Artifacts were manually removed. Channels were divided into ROI. | The power spectrum was calculated for each subject and 5 frequency bands (delta, theta, alpha, beta, and gamma) were considered for each ROI. | SVM | The default settings were used as the running parameters. | Ten-fold cross-validation. The distribution of the patients was kept. Controls with obesity were used to validate the model. | The results for controls vs. PD: Accuracy = 94.34 ± 1.81 Sensitivity = 0.93 ± 0.02 FPR = 0.11 ± 0.01 ROC = 0.95 ± 0.02 MAE = 0.07 ± 0.02 RMSE = 0.16 ± 0.02 |
3.2.1. Assessment of the Quality of the Dataset
3.2.2. Data Pre-Processing
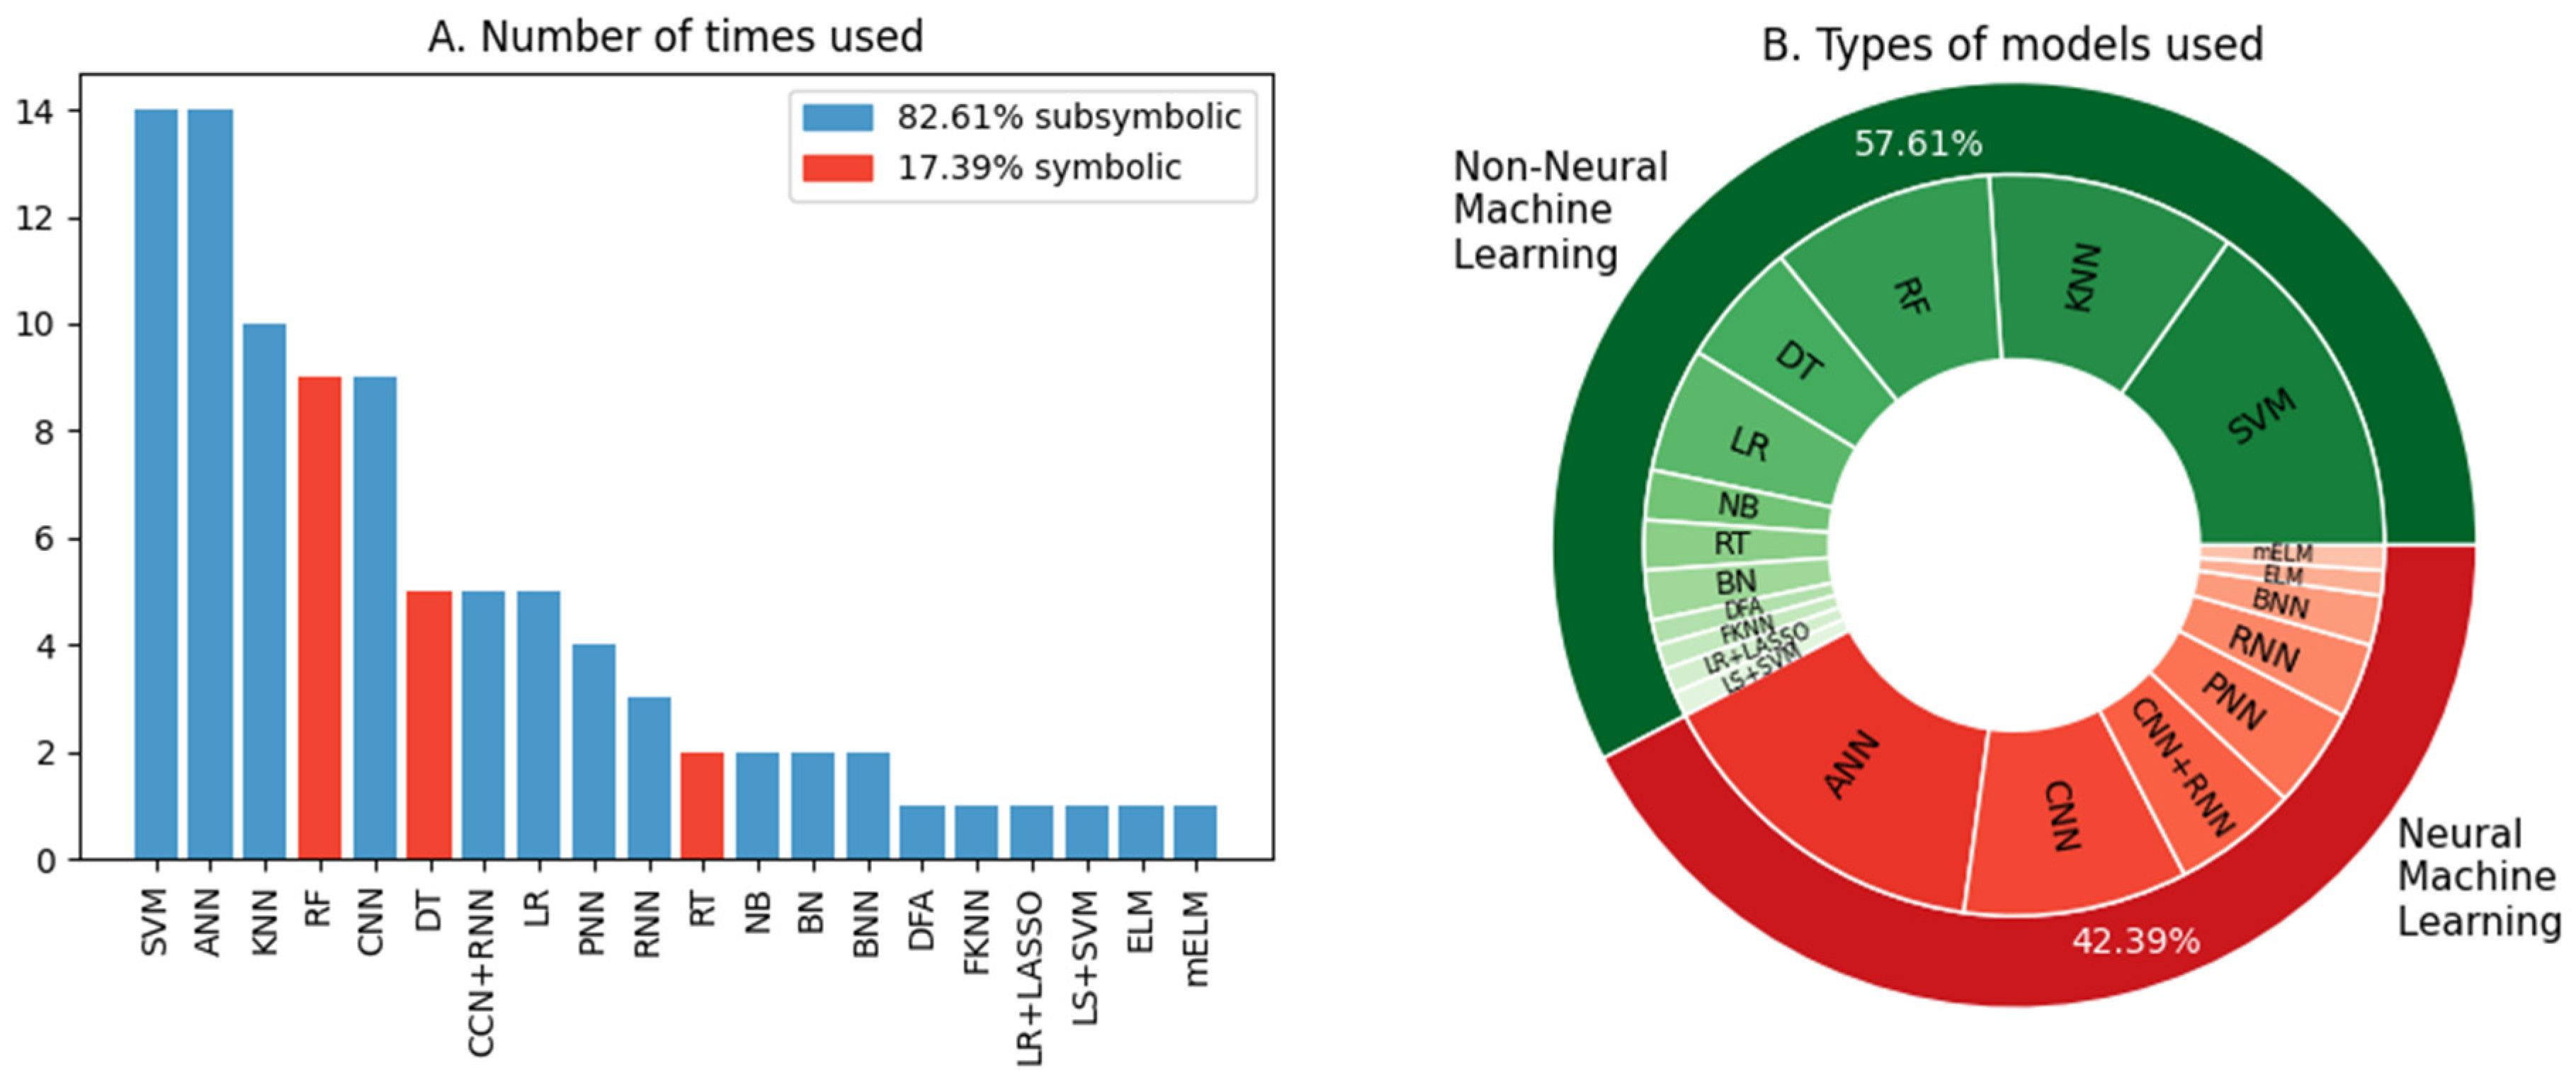
3.2.3. Evaluation of the Models Used
4. Discussion
4.1. Quality of the Dataset
4.2. Data Pre-Processing
4.3. Models Evaluation
4.4. Global Discussion
5. Conclusions
Author Contributions
Funding
Institutional Review Board Statement
Informed Consent Statement
Acknowledgments
Conflicts of Interest
References
- National Institute of Neurological Disorders and Stroke. Parkinson’s Disease: Challenges, Progress, and Promise; Publication No 15-5595; NIH: Bethesda, MD, USA, 2015. Available online: https://www.ninds.nih.gov/health-information/patient-caregiver-education/hope-through-research/parkinsons-disease/parkinsons-disease-challenges-progress-and-promise (accessed on 1 July 2022).
- Dickson, D.W. Neuropathology of Parkinson disease. Parkinsonism Relat. Disord. 2018, 46, S30–S33. [Google Scholar] [CrossRef] [PubMed]
- Jankovic, J. Progression of Parkinson Disease: Are We Making Progress in Charting the Course? Arch. Neurol. 2005, 62, 351–352. [Google Scholar] [CrossRef]
- Beitz, J.M. Parkinson’s Disease: A Review. Front. Biosci. 2014, 6, 65–74. [Google Scholar] [CrossRef] [PubMed]
- Djaldetti, R.; Ziv, I.; Melamed, E. The mystery of motor asymmetry in Parkinson’s disease. Lancet Neurol. 2006, 5, 796–802. [Google Scholar] [CrossRef]
- Kostrzewa, R.M.; Nowak, P.; Kostrzewa, J.P.; Kostrzewa, R.A.; Brus, R. Peculiarities of L-DOPA treatment of Parkinson’s disease. Amino Acids 2005, 28, 157–164. [Google Scholar] [CrossRef] [PubMed]
- Kalia, L.V.; Lang, A.E. Parkinson’s Disease. Lancet 2015, 386, 896–912. [Google Scholar] [CrossRef]
- Beach, T.G.; Adler, C.H. Importance of low diagnostic Accuracy for early Parkinson’s disease. Mov. Disord. Off. J. Mov. Disord. Soc. 2018, 33, 1551–1554. [Google Scholar] [CrossRef]
- Gandal, M.J.; Edgar, J.C.; Klook, K.; Siegel, S.J. Gamma synchrony: Towards a translational biomarker for the treatment-resistant symptoms of schizophrenia. Neuropharmacology 2012, 62, 1504–1518. [Google Scholar] [CrossRef] [Green Version]
- Smailovic, U.; Jelic, V. Neurophysiological Markers of Alzheimer’s Disease: Quantitative EEG Approach. Neurol. Ther. 2019, 8, 37–55. [Google Scholar] [CrossRef] [Green Version]
- Kannathal, N.; Choo, M.L.; Acharya, U.R.; Sadasivan, P.K. Entropies for detection of epilepsy in EEG. Comput. Methods Programs Biomed. 2005, 80, 187–194. [Google Scholar] [CrossRef]
- Bigdely-Shamlo, N.; Mullen, T.; Kothe, C.; Su, K.-M.; Robbins, K.A. The PREP pipeline: Standardized preprocessing for large-scale EEG analysis. Front. Neuroinform. 2015, 9, 16. [Google Scholar] [CrossRef] [PubMed]
- Cole, S.; Voytek, B. Cycle-by-cycle analysis of neural oscillations. J. Neurophysiol. 2019, 122, 849–861. [Google Scholar] [CrossRef] [PubMed]
- Samuel, A.L. Some Studies in Machine Learning Using the Game of Checkers. II-Recent Progress. In Computer Games I; Levi, D.N.L., Ed.; Springer: New York, NY, USA, 1988; pp. 366–400. [Google Scholar] [CrossRef]
- Litjens, G.; Kooi, T.; Bejnordi, B.E.; Setio, A.A.A.; Ciompi, F.; Ghafoorian, M.; Sánchez, C.I. A survey on deep learning in medical image analysis. Med. Image Anal. 2017, 42, 60–88. [Google Scholar] [CrossRef] [PubMed] [Green Version]
- Jiang, F.; Jiang, Y.; Zhi, H.; Dong, Y.; Li, H.; Ma, S.; Wang, Y. Artificial intelligence in healthcare: Past, present and future. Stroke Vasc. Neurol. 2017, 2, 230–243. [Google Scholar] [CrossRef] [PubMed]
- Miller, D.D.; Brown, E.W. Artificial Intelligence in Medical Practice: The Question to the Answer? Am. J. Med. 2018, 131, 129–133. [Google Scholar] [CrossRef] [PubMed]
- LeCun, Y.; Bengio, Y.; Hinton, G. Deep learning. Nature 2015, 521, 436–444. [Google Scholar] [CrossRef] [PubMed]
- Ru, G.; Crescio, M.I.; Ingravalle, F.; Maurella, C.; Gregori, D.; Lanera, C.; Azzolina, D.; Lorenzoni, G.; Soriani, N.; Zec, S.; et al. Machine Learning Techniques applied in risk assessment related to food safety. EFSA Supporting Publ. 2017, 14, EN-1254. [Google Scholar] [CrossRef]
- Roy, Y.; Banville, H.; Albuquerque, I.; Gramfort, A.; Falk, T.H.; Faubert, J. Deep learning-based electroencephalography analysis: A systematic review. J. Neural Eng. 2019, 16, 051001. [Google Scholar] [CrossRef]
- Sheng, J.; Wang, B.; Zhang, Q.; Liu, Q.; Ma, Y.; Liu, W.; Shao, M.; Chen, B. A novel joint HCPMMP method for automatically classifying Alzheimer’s and different stage MCI patients. Behav. Brain Res. 2019, 365, 210–221. [Google Scholar] [CrossRef]
- Raghavendra, U.; Acharya, U.R.; Adeli, H. Artificial Intelligence Techniques for Automated Diagnosis of Neurological Disorders. Eur. Neurol. 2019, 82, 41–64. [Google Scholar] [CrossRef]
- Jahmunah, V.; Oh, S.L.; Rajinikanth, V.; Ciaccio, E.J.; Cheong, K.H.; Arunkumar, N.; Acharya, U.R. Automated detection of schizophrenia using nonlinear signal processing methods. Artif. Intell. Med. 2019, 100, 101698. [Google Scholar] [CrossRef] [PubMed]
- Chen, Y.; Gong, C.; Hao, H.; Guo, Y.; Xu, S.; Zhang, Y.; Yin, G.; Cao, X.; Yang, A.; Meng, F.; et al. Automatic Sleep Stage Classification Based on Subthalamic Local Field Potentials. IEEE Trans. Neural Syst. Rehabil. Eng. 2019, 27, 118–128. [Google Scholar] [CrossRef] [PubMed]
- Zhou, M.; Tian, C.; Cao, R.; Wang, B.; Niu, Y.; Hu, T.; Guo, H.; Xiang, J. Epileptic Seizure Detection Based on EEG Signals and CNN. Front. Neuroinform. 2018, 12, 95. [Google Scholar] [CrossRef] [PubMed] [Green Version]
- Dhivya, S.; Nithya, A. A Review on Machine Learning Algorithm for EEG Signal Analysis. In Proceedings of the Second International Conference on Electronics, Communication and Aerospace Technology (ICECA), Coimbatore, India, 29–31 March 2018; pp. 54–57. [Google Scholar] [CrossRef]
- Rasheed, K.; Qayyum, A.; Qadir, J.; Sivathamboo, S.; Kwan, P.; Kuhlmann, L.; O’Brien, T.; Razi, A. Machine Learning for Predicting Epileptic Seizures Using EEG Signals: A Review. arXiv 2020, arXiv:2002.01925. [Google Scholar] [CrossRef] [PubMed]
- Maitin, A.M.; García-Tejedor, A.J.; Romero Muñoz, J.P. Machine Learning Approaches for Detecting Parkinson’s Disease from EEG Analysis: A Systematic Review. Appl. Sci. 2020, 10, 8662. [Google Scholar] [CrossRef]
- Lee, S.; Hussein, R.; McKeown, M.J. A deep convolutional-recurrent neural network architecture for Parkinson’s disease EEG classification. In Proceedings of the IEEE Global Conference on Signal and Information Processing (GlobalSIP), Ottawa, ON, Canada, 11–14 November 2019; pp. 1–4. [Google Scholar] [CrossRef]
- Lee, S.; Hussein, R.; Ward, R.; Wang, A.J.; McKeown, M.J. A convolutional-recurrent neural network approach to resting-state EEG classification in Parkinson’s disease. J. Neurosci. Methods 2021, 361, 109282. [Google Scholar] [CrossRef]
- Oh, S.L.; Hagiwara, Y.; Raghavendra, U.; Yuvaraj, R.; Arunkumar, N.; Murugappan, M.; Acharya, U.R. A deep learning approach for Parkinson’s disease diagnosis from EEG signals. Neural Comput. Appl. 2020, 32, 10927–10933. [Google Scholar] [CrossRef]
- Chaturvedi, M.; Bogaarts, J.G.; Kozak, V.V.; Hatz, F.; Gschwandtner, U.; Meyer, A.; Fuhr, P.; Roth, V. Phase lag index and spectral power as QEEG features for identification of patients with mild cognitive impairment in Parkinson’s disease. Clin. Neurophysiol. 2019, 130, 1937–1944. [Google Scholar] [CrossRef]
- Chaturvedi, M.; Hatz, F.; Gschwandtner, U.; Bogaarts, J.G.; Meyer, A.; Fuhr, P.; Roth, V. Quantitative EEG (QEEG) measures differentiate Parkinson’s disease (PD) patients from healthy controls (HC). Front. Aging Neurosci. 2017, 9, 3. [Google Scholar] [CrossRef] [Green Version]
- Geraedts, V.J.; Koch, M.; Contarino, M.F.; Middelkoop, H.A.M.; Wang, H.; van Hilten, J.J.; Back, T.H.W.; Tannemaat, M.R. Machine learning for automated EEG-based biomarkers of cognitive impairment during Deep Brain Stimulation screening in patients with Parkinson’s Disease. Clin. Neurophysiol. 2021, 132, 1041–1048. [Google Scholar] [CrossRef]
- Handojoseno, A.M.A.; Naik, G.R.; Gilat, M.; Shine, J.M.; Nguyen, T.N.; Ly, Q.T.; Lewis, S.J.G.; Nguyen, H.T. Prediction of Freezing of Gait in Patients with Parkinson’s Disease Using EEG Signals. Stud. Health Technol. Inform. 2018, 246, 124–131. [Google Scholar] [PubMed]
- Hassin-Baer, S.; Cohen, O.S.; Israeli-Korn, S.; Yahalom, G.; Benizri, S.; Sand, D.; Issachar, G.; Geva, A.B.; Shani-Hershkovich, R.; Peremen, Z. Identification of an early-stage Parkinson’s disease neuromarker using event-related potentials, brain network analytics and machine-learning. PLoS ONE 2022, 17, e0261947. [Google Scholar] [CrossRef]
- Kamalraj, S.; Rejith, K.N.; Prasanna Venkatesan, G.K.D. Frequency domain analysis for the classification of Parkinson’s disease patients. In Proceedings of the IOP Conference Series: Materials Science and Engineering, Tamil Nadu, India, 12–13 April 2019; Volume 561. [Google Scholar] [CrossRef]
- Khare, S.K.; Bajaj, V.; Acharya, U.R. PDCNNet: An Automatic Framework for the Detection of Parkinson’s Disease Using EEG Signals. IEEE Sens. J. 2021, 21, 17017–17024. [Google Scholar] [CrossRef]
- Loh, H.W.; Ooi, C.P.; Palmer, E.; Barua, P.D.; Dogan, S.; Tuncer, T.; Baygin, M.; Acharya, U.R. GaborPDNet: Gabor Transformation and Deep Neural Network for Parkinson’s Disease Detection Using EEG Signals. Electronics 2021, 10, 1740. [Google Scholar] [CrossRef]
- Ly, Q.T.; Handojoseno, A.M.A.; Gilat, M.; Nguyen, N.; Chai, R.; Tran, Y.; Lewis, S.J.G.; Nguyen, H.T. Identifying montages that best detect the electroencephalogram power spectrum alteration during freezing of gait in Parkinson’s disease patients. In Proceedings of the 38th Annual International Conference of the IEEE Engineering in Medicine and Biology Society (EMBC), Orlando, FL, USA, 16–20 August 2016; pp. 6094–6097. [Google Scholar] [CrossRef]
- Saikia, A.; Hussain, M.; Barua, A.R.; Paul, S. Performance analysis of various neural network functions for Parkinson’s disease classification using EEG and EMG. Int. J. Innov. Technol. Explor. Eng. 2019, 9, 3402–3406. [Google Scholar] [CrossRef]
- Shi, X.; Wang, T.; Wang, L.; Liu, H.; Yan, N. Hybrid convolutional recurrent neural networks outperform CNN and RNN in Task-state EEG detection for Parkinson’s disease. In Proceedings of the 2019 Asia-Pacific Signal and Information Processing Association Annual Summit and Conference (APSIPA ASC), Lanzhou, China, 18–21 November 2019; pp. 939–944. [Google Scholar] [CrossRef]
- Vanegas, M.I.; Ghilardi, M.F.; Kelly, S.P.; Blangero, A. Machine learning for EEG-based biomarkers in Parkinson’s disease. In Proceedings of the IEEE International Conference on Bioinformatics and Biomedicine (BIBM), Madrid, Spain, 3–6 December 2018; pp. 2661–2665. [Google Scholar] [CrossRef]
- Waninger, S.; Berka, C.; Karic, M.S.; Korszen, S.; Mozley, P.D.; Henchcliffe, C.; Kang, Y.; Hesterman, J.; Mangoubi, T.; Verma, A. Neurophysiological Biomarkers of Parkinson’s Disease. J. Parkinson’s Dis. 2020, 10, 471–480. [Google Scholar] [CrossRef] [Green Version]
- Zhang, J.; Gao, Y.; He, X.; Feng, S.; Hu, J.; Zhang, Q.; Zhao, J.; Huang, Z.; Wang, L.; Ma, G.; et al. Identifying Parkinson’s disease with mild cognitive impairment by using combined MR imaging and electroencephalogram. Eur. Radiol. 2021, 31, 7386–7394. [Google Scholar] [CrossRef]
- Anwar, T.; Rehmat, N.; Naveed, H. A Generic Approach for Classification of Psychological Disorders Diagnosis using EEG. In Proceedings of the 43rd Annual International Conference of the IEEE Engineering in Medicine & Biology Society (EMBC), Guadalajara, Jalisco, Mexico, 1–5 November 2021; pp. 2025–2029. [Google Scholar] [CrossRef]
- Betrouni, N.; Delval, A.; Chaton, L.; Defebvre, L.; Duits, A.; Moonen, A.; Leentjens, A.F.G.; Dujardin, K. Electroencephalography-based machine learning for cognitive profiling in Parkinson’s disease: Preliminary results. Mov. Disord. 2019, 34, 210–217. [Google Scholar] [CrossRef]
- Chu, C.; Zhang, Z.; Wang, J.; Liu, S.; Wang, F.; Sun, Y.; Han, X.; Li, Z.; Zhu, X.; Liu, C. Deep learning reveals personalized spatial spectral abnormalities of high delta and low alpha bands in EEG of patients with early Parkinson’s disease. J. Neural Eng. 2021, 18, 066036. [Google Scholar] [CrossRef]
- Emamzadeh-Hashemi, E.A.; Mahdizadeh, A.; Mirian, M.S.; Lee, S.; McKeown, M.J. Deep transfer learning for parkinson’s disease monitoring by image-based representation of resting-state EEG using directional connectivity. Algorithms 2022, 15, 5. [Google Scholar] [CrossRef]
- Guo, G.; Wang, S.; Wang, S.; Zhou, Z.; Pei, G.; Yan, T. Diagnosing Parkinson’s Disease Using Multimodal Physiological Signals. In Human Brain and Artificial Intelligence. HBAI 2021. Communications in Computer and Information Science, Yokohama, Japan, January 7, 2021; Wang, Y., Ed.; Springer: Singapore, 2021; Volume 1369. [Google Scholar] [CrossRef]
- Jervis, B.W.; Saatchi, M.R.; Lacey, A.; Roberts, T.; Allen, E.M.; Hudson, N.R.; Oke, S.; Grimsley, M. Artificial neural network and spectrum analysis methods for detecting brain diseases from the CNV response in the electroencephalogram. IEE Proc. Sci. Meas. Technol. 1994, 141, 432–440. [Google Scholar] [CrossRef]
- Khare, S.K.; Bajaj, V.; Acharya, U.R. Detection of Parkinson’s disease using automated tunable Q wavelet transform technique with EEG signals. Biocybern. Biomed. Eng. 2021, 41, 679–689. [Google Scholar] [CrossRef]
- Koch, M.; Geraedts, V.; Wang, H.; Tannemaat, M.; Back, T. Automated Machine Learning for EEG-Based Classification of Parkinson’s Disease Patients. In Proceedings of the 2019 IEEE International Conference on Big Data (Big Data), Los Angeles, CA, USA, 9–12 December 2019; pp. 4845–4852. [Google Scholar] [CrossRef]
- Liu, S.; Li, M.; Feng, Y.; Zhang, M.; Acquah, M.E.E.; Huang, S.; Chen, J.; Ren, P. Brain Network Analysis by Stable and Unstable EEG Components. IEEE J. Biomed. Health Inform. 2021, 25, 1080–1092. [Google Scholar] [CrossRef] [PubMed]
- Ly, Q.T.; Gilat, M.; Chai, R.; Martens, K.A.E.; Georgiades, M.; Naik, G.R.; Tran, Y.; Lewis, S.J.G.; Nguyen, H.T. Detection of turning freeze in Parkinson’s disease based on S-transform decomposition of EEG signals. In Proceedings of the 2017 39th Annual International Conference of the IEEE Engineering in Medicine and Biology Society (EMBC), Jeju Island, Korea, 11–15 July 2017; pp. 3044–3047. [Google Scholar] [CrossRef] [Green Version]
- Ly, Q.T.; Handojoseno, A.M.A.; Gilat, M.; Nguyen, N.; Chai, R.; Tran, Y.; Lewis, S.J.G.; Nguyen, H.T. Detection of Gait Initiation Failure in Parkinson’s disease patients using EEG signals. In Proceedings of the 38th Annual International Conference of the IEEE Engineering in Medicine and Biology Society (EMBC), Orlando, FL, USA, 16–20 August 2016; pp. 1599–1602. [Google Scholar] [CrossRef]
- Oliveira, A.P.S.; de Santana, M.A.; Andrade, M.K.S.; Gomes, J.C.; Rodrigues, M.C.A.; dos Santos, W.P. Early diagnosis of Parkinson’s disease using EEG, machine learning and partial directed coherence. Res. Biomed. Eng. 2020, 36, 311–331. [Google Scholar] [CrossRef]
- Rejith, K.N.; Subramaniam, K. Analysis of emotional states in Parkinson’s disease using entropy, energy-entropy and teager energy-entropy features. Indian J. Public Health Res. Dev. 2018, 9, 1099–1102. [Google Scholar] [CrossRef]
- Rejith, K.N.; Subramaniam, K. Classification of emotional states in Parkinson’s disease patients using machine learning algorithms. Biomed. Pharmacol. J. 2018, 11, 333–341. [Google Scholar] [CrossRef]
- Rodrigues, P.M.; Teixeira, J.P. Classification of electroencephalogram signals using artificial neural networks. In Proceedings of the 2010 3rd International Conference on Biomedical Engineering and Informatics, Yantai, China, 16–18 October 2010; pp. 808–812. [Google Scholar] [CrossRef] [Green Version]
- Ruffini, G.; Ibañez, D.; Castellano, M.; Dubreuil-Vall, L.; Soria-Frisch, A.; Postuma, R.; Gagnon, J.-F.; Montplaisir, J. Deep learning with EEG spectrograms in rapid eye movement behavior disorder. Front. Neurol. 2019, 10, 806. [Google Scholar] [CrossRef] [Green Version]
- Ruffini, G.; Ibañez, D.; Castellano, M.; Dunne, S.; Soria-Frisch, A. EEG-driven RNN classification for prognosis of neurodegeneration in at-risk patients. Lect. Notes Comput. Sci. (Incl. Subser. Lect. Notes Artif. In tell. Lect. Notes Bioinform.) 2016, 9886, 306–313. [Google Scholar] [CrossRef]
- Saikia, A.; Hussain, M.; Barua, A.R.; Paul, S. EEG-EMG correlation for Parkinson’s disease. Int. J. Eng. Adv. Technol. 2019, 8, 1179–1185. [Google Scholar] [CrossRef]
- Shaban, M. Automated Screening of Parkinson’s Disease Using Deep Learning Based Electroencephalography. In Proceedings of the 2021 10th International IEEE/EMBS Conference on Neural Engineering (NER), Virtually, 4–6 May 2021; pp. 158–161. [Google Scholar] [CrossRef]
- Shah, S.A.A.; Zhang, L.; Bais, A. Dynamical System Based Compact Deep Hybrid Network for Classification of Parkinson Disease Related EEG Signals. Neural Netw. 2020, 130, 75–84. [Google Scholar] [CrossRef]
- Shreya Prabhu, K.; Martis, R.J. Diagnosis of Parkinson’s Disease using Computer Aided Tool based on EEG. In Proceedings of the IEEE 17th India Council International Conference INDICON, New Delhi, India, 10–13 December 2020; pp. 1–4. [Google Scholar] [CrossRef]
- Yuvaraj, R.; Acharya, U.R.; Hagiwara, Y. A novel Parkinson’s Disease Diagnosis Index using higher-order spectra features in EEG signals. Neural Comput. Appl. 2018, 30, 1225–1235. [Google Scholar] [CrossRef]
- Handojoseno, A.M.A.; Shine, J.M.; Nguyen, T.N.; Tran, Y.; Lewis, S.J.G.; Nguyen, H.T. The Detection of Freezing of Gait in Parkinson’s Disease Patients Using EEG Signals Based on Wavelet Decomposition. In Proceedings of the Annual International Conference of the IEEE Engineering in Medicine and Biology Society, San Diego, CA, USA, August 28–September 1 2012; pp. 69–72. [Google Scholar] [CrossRef]
- Handojoseno, A.M.A.; Shine, J.M.; Nguyen, T.N.; Tran, Y.; Lewis, S.J.G.; Nguyen, H.T. Using EEG Spatial Correlation, Cross Frequency Energy, and Wavelet Coefficients for the Prediction of Freezing of Gait in Parkinson’s Disease Patients. In Proceedings of the 35th Annual International Conference of the IEEE Engineering in Medicine and Biology Society (EMBC), Osaka, Japan, 3–7 July 2013; pp. 4263–4266. [Google Scholar] [CrossRef]
- Rahman, M.A.; Tutul, A.A.; Islam, A.B.M.A.A. Solving the Maze of Diagnosing Parkinson’s Disease based on Portable EEG Sensing to be Adaptable to Go In-The-Wild. In Proceedings of the 7th International Conference on Networking, Systems and Security, Dhaka, Bangladesh, 22–24 December 2020; pp. 65–73. [Google Scholar] [CrossRef]
- Vanneste, S.; Song, J.-J.; Ridder, D.D. Thalamocortical Dysrhythmia Detected by Machine Learning. Nat. Commun. 2018, 9, 1103. [Google Scholar] [CrossRef] [PubMed] [Green Version]
- Yuvaraj, R.; Murugappan, M.; Ibrahim, N.M.; Sundaraj, K.; Omar, M.I.; Mohamad, K.; Palaniappan, R. Optimal set of EEG features for emotional state classification and trajectory visualization in Parkinson’s disease. Int. J. Psychophysiol. 2014, 94, 482–495. [Google Scholar] [CrossRef] [PubMed]
- Yuvaraj, R.; Murugappan, M.; Ibrahim, N.M.; Omar, M.I.; Sundaraj, K.; Mohamad, K.; Palaniappan, R.; Satiyan, M. Emotion classification in Parkinson’s disease by higher-order spectra and power spectrum features using EEG signals: A comparative study. J. Integr. Neurosci. 2014, 13, 89–120. [Google Scholar] [CrossRef]
- Yuvaraj, R.; Murugappan, M.; Ibrahim, N.M.; Sundaraj, K.; Omar, M.I.; Mohamad, K.; Palaniappan, R. Detection of emotions in Parkinson’s disease using higher order spectral features from brain’s electrical activity. Biomed. Signal Processing Control. 2014, 14, 108–116. [Google Scholar] [CrossRef]
- Murugappan, M.; Alshuaib, W.B.; Bourisly, A.; Sruthi, S.; Ranjana, R. Recurrence Quantification Analysis based Emotion Detection in Parkinson’s disease using EEG Signals. In Proceedings of the 4th International Conference on Computer, Communication and Signal Processing (ICCCSP), Chennai, India, 28–29 April 2020; pp. 1–6. [Google Scholar] [CrossRef]
- Murugappan, M.; Alshuaib, W.; Bourisly, A.K.; Khare, S.K.; Sruthi, S.; Bajaj, V. Tunable Q wavelet transform based emotion classification in Parkinson’s disease using Electroencephalography. PLoS ONE 2020, 15, e0242014. [Google Scholar] [CrossRef]
- Cesari, M.; Christensen, J.A.E.; Muntean, M.L.; Mollenhauer, B.; Sixel-Döring, F.; Sorensen, H.B.D.; Trenkwalder, C.; Jennum, P. A data-driven system to identify REM sleep behavior disorder and to predict its progression from the prodromal stage in Parkinson’s disease. Sleep Med. 2020, 77, 238–248. [Google Scholar] [CrossRef]
- Sorensen, G.L.; Jennum, P.; Kempfner, J.; Zoetmulder, M.; Sorensen, H.B.D. A Computerized Algorithm for Arousal Detection in Healthy Adults and Patients with Parkinson Disease. J. Clin. Neurophysiol. 2012, 29, 58–64. [Google Scholar] [CrossRef]
- Patanaik, A.; Ong, J.L.; Gooley, J.J.; Ancoli-Israel, S.; Chee, M.W.L. An end-to-end framework for real-time automatic sleep stage classification. Sleep 2018, 41, zsy041. [Google Scholar] [CrossRef]
- Sorensen, G.L.; Kempfner, J.; Jennum, P.; Sorensen, H.B.D. Detection of Arousals in Parkinson’s Disease Patients. In Proceedings of the Annual International Conference of the IEEE Engineering in Medicine and Biology Society, Boston, MA, USA, 30 August–3 September 2011; pp. 2764–2767. [Google Scholar] [CrossRef]
- Castano-Candamil, S.; Piroth, T.; Reinacher, P.; Sajonz, B.; Coenen, V.A.; Tangermann, M. Identifying controllable cortical neural markers with machine learning for adaptive deep brain stimulation in Parkinson’s disease. Neuroimage Clin. 2020, 28, 102376. [Google Scholar] [CrossRef]
- Geraedts, V.J.; Koch, M.; Kuiper, R.; Kefalas, M.; Back, T.H.W.; van Hilten, J.J.; Wang, H.; Middelkoop, H.A.; Gaag, N.A.; Contarino, M.F.; et al. Preoperative Electroencephalography-Based Machine Learning Predicts Cognitive Deterioration after Subthalamic Deep Brain Stimulation. Mov. Disord. 2021, 36, 2324–2334. [Google Scholar] [CrossRef] [PubMed]
- Stuart, M.; Wickramasinghe, C.S.; Marino, D.L.; Kumbhare, D.; Holloway, K.; Manic, M. Machine Learning for Deep Brain Stimulation Efficacy using Dense Array EEG. In Proceedings of the 2019 12th International Conference on Human System Interaction (HSI), Richmond, VR, USA, 25–27 June 2019; pp. 143–150. [Google Scholar] [CrossRef]
- Sand, D.; Arkadir, D.; Snineh, M.A.; Marmor, O.; Israel, Z.; Bergman, H.; Hassin-Baer, S.; Israeli-Korn, S.; Peremen, Z.; Geva, A.B.; et al. Deep Brain Stimulation Can Differentiate Subregions of the Human Subthalamic Nucleus Area by EEG Biomarkers. Front. Syst. Neurosci. 2021, 15, 747681. [Google Scholar] [CrossRef] [PubMed]
- Maurer, A.; Hanrahan, S.; Nedrud, J.; Hebb, A.O.; Papandreou-Suppappola, A. Suppression of Neurostimulation Artifacts and Adaptive Clustering of Parkinson’s Patients Behavioral Tasks using EEG. In Proceedings of the 50th Asilomar Conference on Signals, Systems and Computers, Pacific Grove, CA, USA, 6–9 November 2016; pp. 851–855. [Google Scholar] [CrossRef]
- Saikia, A.; Majhi, V.; Hussain, M.; Barua, A.R.; Paul, S.; Verma, J.K. Machine Learning based Diagnostic System for Early Detection of Parkinson’s Disease. In Proceedings of the International Conference on Computational Performance Evaluation (ComPE), Shillong, India, 2–4 July 2020; pp. 275–279. [Google Scholar] [CrossRef]
- Geman, O.; Chiuchisan, I.; Covasa, M.; Eftaxias, K.; Sanei, S.; Ferreira Madeira, J.G.; Mancebo Boloy, R.A. Joint EEG-EMG Signal Processing for Identification of the Mental Tasks in Patients with Neurological Diseases. In Proceedings of the 24th European Signal Processing Conference (EUSIPCO), Budapest, Hungary, 29 August–2 September 2016; pp. 1598–1602. [Google Scholar] [CrossRef]
- Barrachina-Fernández, M.; Maitín, A.M.; Sánchez-Ávila, C.; Romero, J.P. Wearable Technology to Detect Motor Fluctuations in Parkinson’s Disease Patients: Current State and Challenges. Sensors 2021, 21, 4188. [Google Scholar] [CrossRef] [PubMed]


| Exclusion Criteria | Reason for Exclusion |
|---|---|
| Studies focused on neurological diseases different from PD | Outside the objectives of this review |
| Studies not using ML techniques | Outside the objectives of this review |
| Studies not considering EEG | Outside the objectives of this review |
| Studies with invasive EEG | Invasive EEG signals are not comparable with non-invasive EEG ones. Moreover, non-invasive EEG was chosen for being low-cost, widely available, and easy to acquire, which are properties not shared by invasive EEG. |
| Studies on animals | The results obtained in studies with animals may not be always extrapolated to humans. Moreover, EEG of animals and humans are not comparable. |
| Pharmacological studies | The studies focused on the development and analysis of the components of medications are outside the objectives of this review. |
| Review articles | Outside the objectives of this review |
| Item | Description |
|---|---|
| 1. Dataset quality | Through clinical and technical parameters such as the number of patients in the study, the stage of the disease, the administration of medication, and the type of EEG tests performed |
| 2. Pre-processing of data | Through the EEG cleaning protocol and feature extraction methods |
| 3. Analysis of ML techniques | Through the types of models, model architecture, evaluation of the quality of the training/validation process, metrics used, and results of each model |
Publisher’s Note: MDPI stays neutral with regard to jurisdictional claims in published maps and institutional affiliations. |
© 2022 by the authors. Licensee MDPI, Basel, Switzerland. This article is an open access article distributed under the terms and conditions of the Creative Commons Attribution (CC BY) license (https://creativecommons.org/licenses/by/4.0/).
Share and Cite
Maitin, A.M.; Romero Muñoz, J.P.; García-Tejedor, Á.J. Survey of Machine Learning Techniques in the Analysis of EEG Signals for Parkinson’s Disease: A Systematic Review. Appl. Sci. 2022, 12, 6967. https://0-doi-org.brum.beds.ac.uk/10.3390/app12146967
Maitin AM, Romero Muñoz JP, García-Tejedor ÁJ. Survey of Machine Learning Techniques in the Analysis of EEG Signals for Parkinson’s Disease: A Systematic Review. Applied Sciences. 2022; 12(14):6967. https://0-doi-org.brum.beds.ac.uk/10.3390/app12146967
Chicago/Turabian StyleMaitin, Ana M., Juan Pablo Romero Muñoz, and Álvaro José García-Tejedor. 2022. "Survey of Machine Learning Techniques in the Analysis of EEG Signals for Parkinson’s Disease: A Systematic Review" Applied Sciences 12, no. 14: 6967. https://0-doi-org.brum.beds.ac.uk/10.3390/app12146967