
Experimental Research on Reducing Flow-Induced Cavity Resonance with a Narrowband Active Noise Control System

1
School of Mechanical and Automotive Engineering, Qingdao University of Technology, Qingdao 266520, China
2
Qingdao Branch, Institute of Acoustics, Chinese Academy of Sciences, Qingdao 266114, China
*
Authors to whom correspondence should be addressed.
Appl. Sci. 2022, 12(14), 7044; https://0-doi-org.brum.beds.ac.uk/10.3390/app12147044
Submission received: 9 May 2022
/
Revised: 7 July 2022
/
Accepted: 11 July 2022
/
Published: 12 July 2022
(This article belongs to the Special Issue Application of Active Noise and Vibration Control)
Abstract
:In this paper, active control of flow-induced cavity resonance noise is addressed. A hybrid numerical method is presented to predict the resonance frequency and, instead of traditional active flow control, a narrowband active noise control system is utilized to suppress the resonance. A duct system is built up at low Mach numbers and experiments are carried out to validate the proposed methods. The results have shown that the resonance frequency could be predicted with 1.5% errors and the flow-induced narrowband noise could be effectively suppressed at both the fundamental frequency and its first harmonic. More than 10 dB global attenuations could be achieved for the fundamental resonance frequency without noise enhancements at other frequencies. Further, it was also found that the optimal reference frequency of the narrowband active noise control system could be largely biased from the original resonance frequency, which indicates a nonlinear mechanism of the control system.
1. Introduction
Grazing flows over side-wall cavities might generate high-level noise if the acoustic resonance frequency of the cavity matches with the flow oscillations [1,2,3]. This acoustic resonance noise, which is narrowband in nature, could not only cause psychological discomfort for humans, but also could strengthen the structural load and hence give rise to fatigue damage. Further, this problem is also an important issue for some weapons or underwater vehicles to reduce their noise radiation and remain invisible from detectors. Consequently, the generation mechanism of this flow-induced cavity resonance as well as its control methods have drawn a great deal of interests for several decades.
Both passive and active strategies can be considered to reduce this flow-induced resonance noise. Lawson and Barakos [4] gave a comprehensive review on the topic of simulation and control of cavity flows, in which over 60 experimental and computational studies before 2011 were summarized and various passive strategies were presented. In recent years, it has also been reported that flow-induced cavity resonance could be alleviated by adding sawtooth spoilers [5] or a span-wise rod [6] at the leading edge, attaching sound-absorbing materials at the cavity bottom [7], or even reshaping the cavity with slanted rear and front walls [8].
Compared with passive strategies, external energy is generally necessary for active methods, where actuators are utilized to achieve better control performance. A comprehensive review on active strategies before 2008 can be found in [9], where different kinds of actuators and sensors as well as different control methods were summarized and compared. Among them, the most common method is active flow control, in which leading-edge actuators are usually used to regulate the flow field on the opening surface of the cavity, so that both the flow oscillations and acoustic resonance could be reduced. It has been reported by recent works that using plasma actuators [10,11] as well as injecting extra flows [12,13,14] at the leading edge could effectively suppress the cavity resonance noise. Lu et al. [15,16,17] developed the surface perturbation technique, in which a piezo actuator was designed and installed upstream in a duct system so that the resonance noise of the downstream side-wall cavity could be reduced. Leclercq et al. [18] also presented a closed-loop control method, where a series of linear controllers are iteratively designed to control the nonlinear oscillations of resonating flows. Although different methods of active flow control have been confirmed to be effective to suppress the cavity resonance noise, an obvious drawback of such methods is that the noise level at other frequencies would possibly be enhanced, as could be observed in [10,11,12,13,14,15,16,17,18].
Since the final objective is to reduce resonance noise, active noise control (ANC) [19] can naturally be considered as another approach. In an ANC system, a secondary noise is generated by a loudspeaker with the same amplitude but the opposite phase when compared with the primary noise. Thus, when the two noise interfere with each other, the total noise level could be greatly reduced. Some early attempts [20,21] have been performed around 2000. Kestens et al. [20] gave simulation results with an ANC system. The filtered-x least mean square (FxLMS) algorithm [19], which is the most basic adaptive algorithm in ANC literatures, was used to control the cavity resonance. It was pointed out that only local noise reduction could be expected around the position of the error microphone. Williams et al. [21] compared the noise reduction performance with a fixed analog controller and a digital adaptive controller. It was claimed that the adaptive controller would lose its efficiency when dealing with multiple acoustic modes of the cavity.
With the rapid development of digital signal processing, various ANC algorithms [22,23,24,25,26,27] specially designed for narrowband disturbances have been proposed in the past two decades. Compared with the original FxLMS algorithm in which the reference signal is picked up by a reference microphone, Xiao et al. [22] proposed to use internally generated tonal signals as the references. However, the noise reduction performance is rather sensitive to the frequency mismatch (FM) [23,24], which is the frequency error between the references and the disturbances. Consequently, different adaptive control methods with online frequency estimation algorithms [25,26,27] have been proposed. Since the cavity resonance noise is narrowband and the resonance frequency is fixed, it is interesting to test the control performance with narrowband ANC systems. This is the basic motivation of this work. Compared with traditional methods of active flow control, this method should not introduce noise enhancement at other frequencies, since the secondary noise generated by the loudspeaker only contains tonal components corresponding to the resonance frequency.
In this paper, experimental researches are carried out, in which the effectiveness of narrowband ANC systems on the control of flow-induced cavity resonance noise is tested. Instead of the wind tunnel, a duct system is built up with rectangular side-wall cavities. Numerical simulations are conducted to predict the frequency of flow-induced resonance noise. The hybrid method combining Large Eddy Simulations (LES) and the Ffowcs Williams-Hawkings (FW-H) equation is used, which has been widely used in practical applications [28,29,30]. Then, a narrowband active noise control system is established to reduce the flow-induced resonance noise. It has been shown by experimental results that the flow-indued resonance could be globally suppressed, even with relatively large FMs.
2. Numerical and Control Methods
2.1. Numerical Method for Flow-Induced Acoustic Resonance Frequency Prediction
The frequency of flow-induced acoustic resonance is predicted numerically in this paper, where the LES model and the FW-H equation are used to calculate the flow and the acoustic field, respectively. The LES model is employed to simulate the transient flow field in ducts with cavities. The governing equations for LES are established by filtering the Navier–Stokes (N-S) equations in the physical space. The continuity equation and the N-S equation for incompressible fluids can be expressed as [29]
where and represent the physical space, and are the fluid velocity components in the physical space, is the time, is the static pressure, is the density, is the kinematic viscosity and is the subgrid-scale (SGS) stress. Here is calculated as follows
In (3), is the isotropic part of the subgrid scale stress, is the Kronecker Delta symbol, is the subgrid scale turbulent viscosity and is the rate-of-strain tensor for the resolved scale
In the Smagorinsky–Lilly (SL) model, the subgrid-scale turbulent viscosity is determined by (5) to (7)
where is the mixing length for subgrid scales, is the Von Karman constant, is the distance to the closest wall, is the volume of the computational cell and is the Smagorinsky constant, which is taken as the default value of 0.1 in this paper.
The FW-H equation based on Lighthill’s acoustic analogy theory is used to simulate the characteristics of the flow-induced resonance noise. The FW-H equation can be expressed as [30]
where is the fluid velocity component in direction , is the fluid velocity component perpendicular to the object surface, is the object surface velocity component in direction , is the object surface normal velocity component, is the Dirac delta function, is the Heaviside function and is the Lighthill stress tensor.
In this work, FLUENT is used for geometrical modelling and structured meshing. The flow field calculation is the most computationally intensive step in the whole calculation process. It is stabilized by the condition that the main flow trends are fully developed and the statistical values of the time-varying flow variables are constant. In the calculation of the acoustic signal, several source surfaces need to be selected simultaneously to investigate their contribution to the sound field.
2.2. Active Control Method of the Flow-Induced Resonance Noise
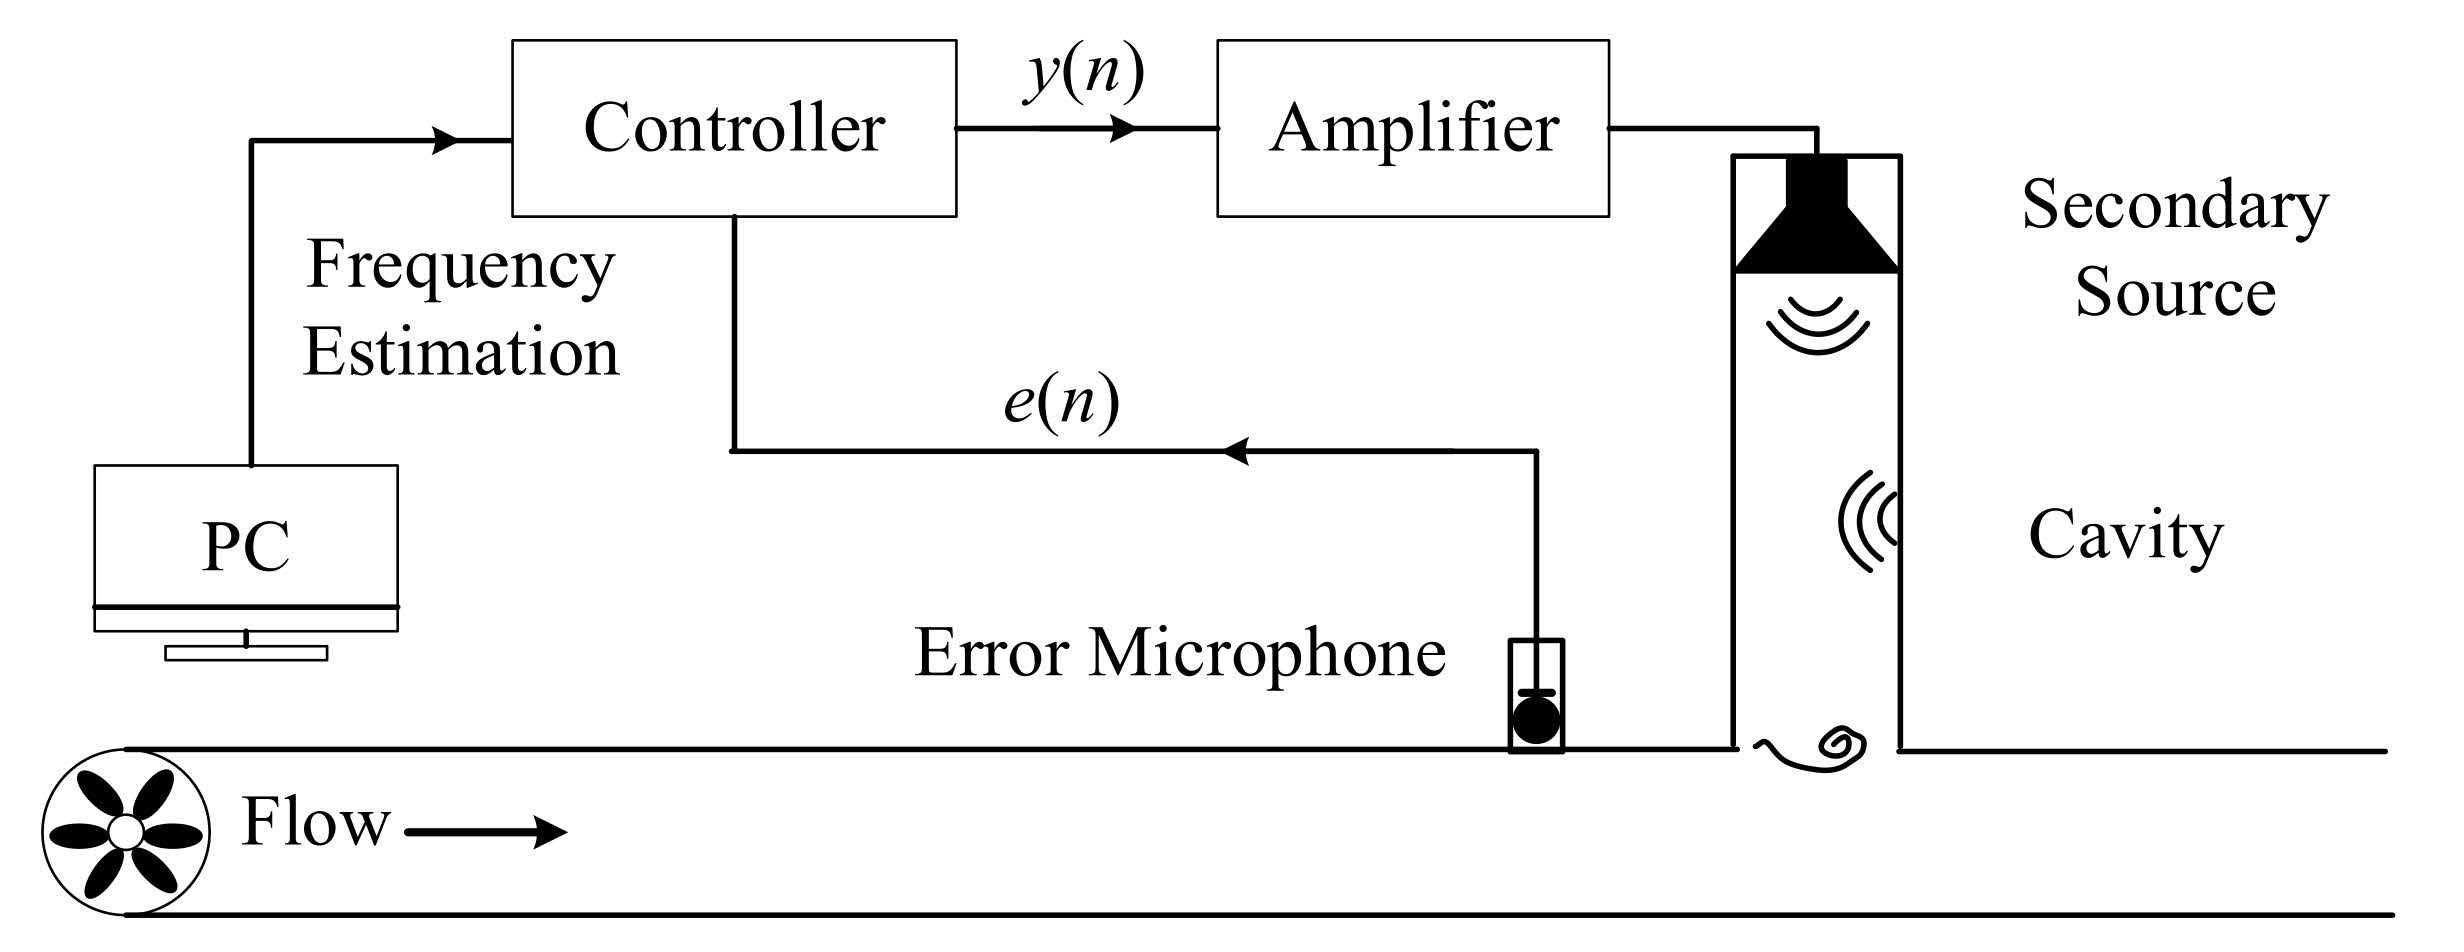
The narrowband ANC system for resonance noise mainly consists of the computer, the controller, the amplifier, the secondary source and the error microphone, as shown in Figure 1. The error microphone is installed on the side-wall of the upstream duct of the cavity to pick up the residual noise signal e(n), while the secondary source is placed at the bottom of the cavity. The controller calculates the output signal y(n) using the estimated resonance frequency, which is then amplified and used as the stimulus for the secondary source. As a result, an acoustic wave of the same amplitude and the opposite phase corresponding to the narrowband resonance noise would be generated, with which the noise cancellation could be achieved.
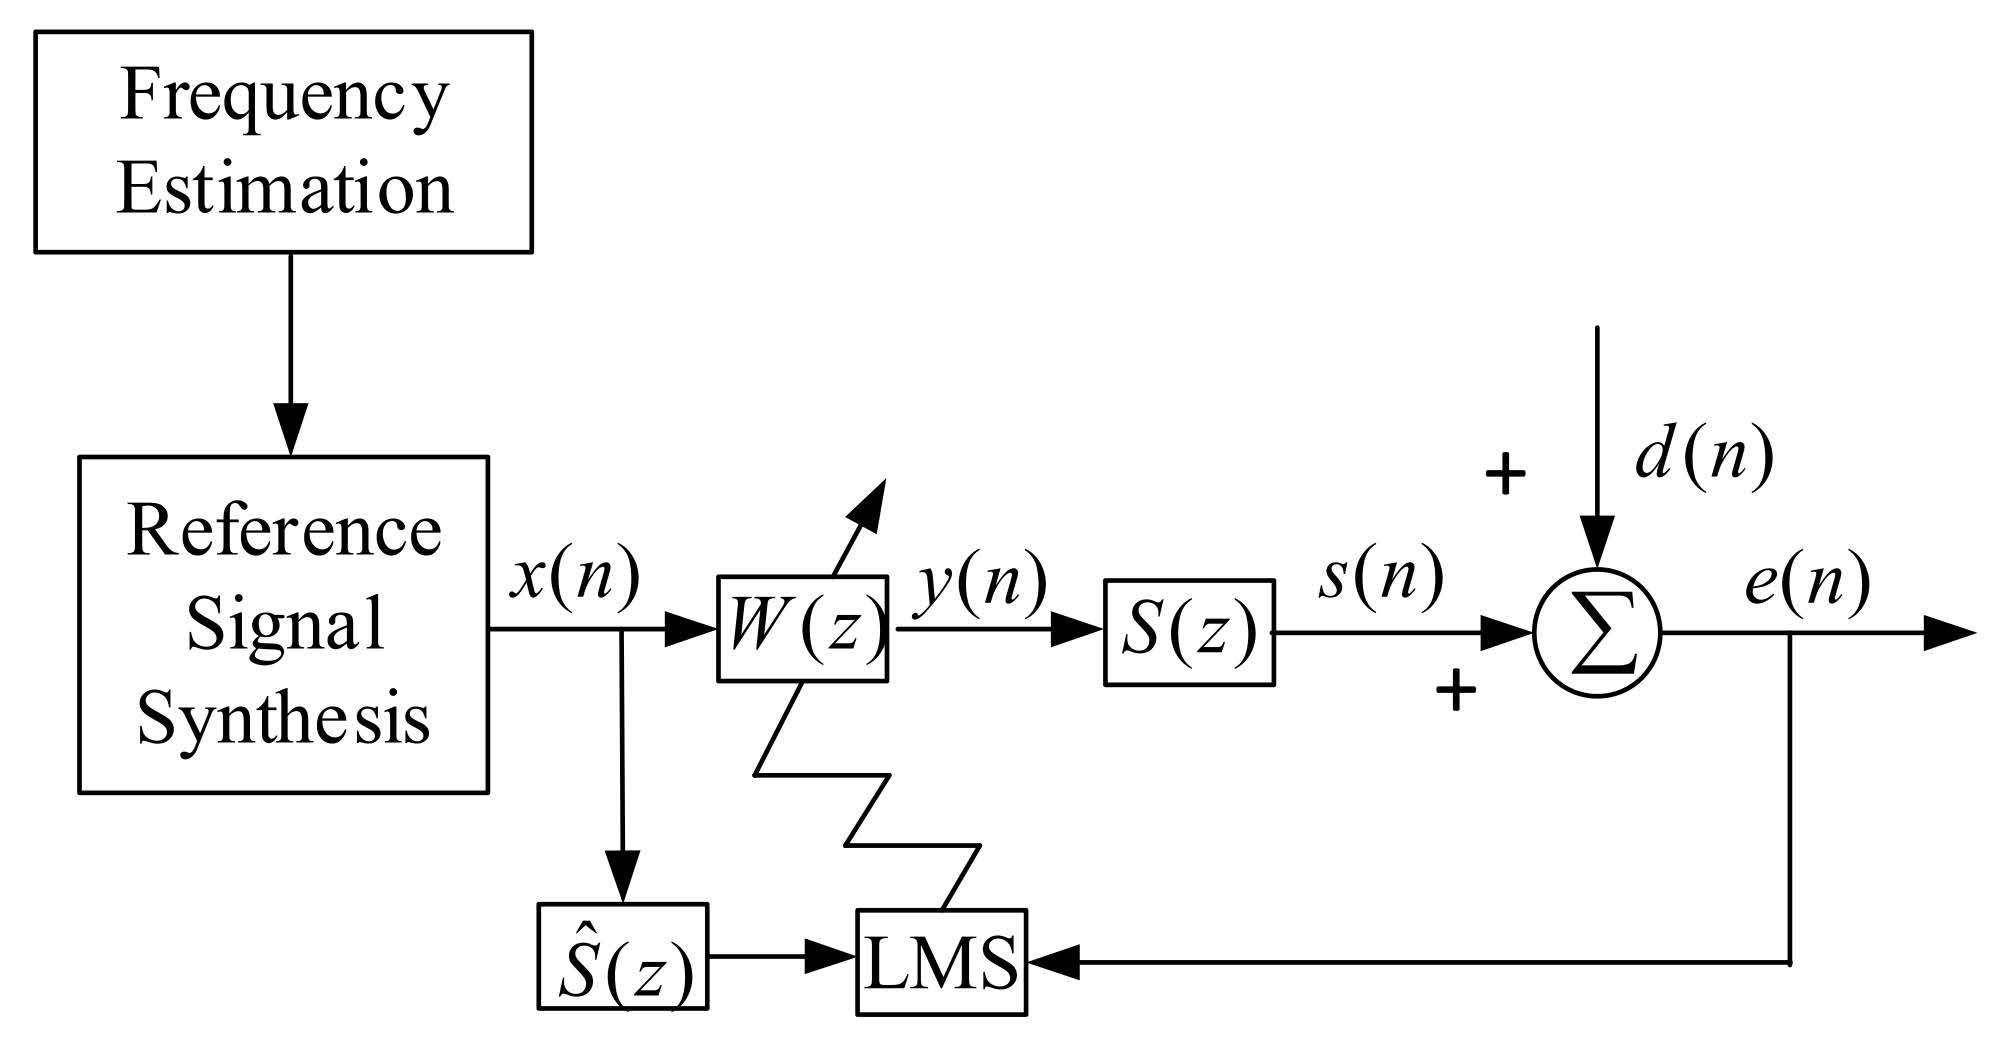
The narrowband FxLMS algorithm used in this paper is shown in Figure 2. The secondary path S(z) is the system between the controller output and the error microphone, whose model could be obtained offline. The sinusoidal reference signal x(n) is synthesized internally in the controller based on an estimation of the resonance frequency. The output signals of the control filter and the secondary path are denoted as y(n) and s(n), respectively. The disturbance signal d(n) is the external narrowband resonance noise. The control filter is denoted as W(z).
The controller coefficient vector and the reference signal vector can be expressed as
where L is the order of the controller and n is the time index. The controller coefficients are adjusted adaptively according to the FxLMS algorithm, which could be described by the following set of equations
where r(n) is the filtered-x signal, is the stepsize, hi (i = 0,…, Ls) and (i = 0,…, ) are the coefficients of the impulse responses of the secondary path and its model, respectively.
How to generate the reference signal is one of the key issues for narrowband ANC systems. In this paper, the reference signal is internally generated with an estimate of the resonance frequency [23,24,25,26,27]. Considering that the frequency of the narrowband resonance noise depends on the physical structure, the frequency is fixed and does not vary with time. Thus, it is tested offline and used directly in the algorithm, as shown in Figure 2. It should be noted that for ordinary linear systems, the control performance of such a narrowband system is extremely sensitive to the FM, which is the frequency difference between the reference signal and the disturbance signal. In principle, the offline estimation of the resonance frequency should be made as accurate as possible.
3. Experimental System
In order to validate the proposed methods, a ventilation duct system with side-wall cavities is built up, which is shown in Figure 3. A centrifugal fan is used to generate the air flow, which is equipped with mufflers at its inlet and outlet, respectively. The wind speed can be adjusted from 6.0 to 35.0 m/s. The geometry of the experimental duct system is presented in Figure 3a and the dimensions are listed as follows: 80 × 80 mm for the overall cross-section and 12 mm for the wall thickness; 870 mm for the distances between the test microphones and the cavity; mm for the cavity width; the cavity depth H is variable.
To reduce the flow-induced resonance noise, the ANC system is established at the cavity position of the experimental system, as shown in Figure 4. A loudspeaker is used as the secondary source, which is installed at the bottom of the cavity. An electret condenser microphone (ECM) is used as the error microphone, which is placed near the leading edge of the cavity. The resonance frequency of the flow-induced noise is first estimated. The noise power spectrum inside the duct is tested, and the frequency corresponding to the peak value is taken as the estimation. The frequency resolution of the noise power spectrum is 1.25 Hz, which is also the upper bound of the frequency estimation error. The estimated frequency is used by the controller to generate the tonal reference signal. Then, a secondary path modelling process is conducted, in which a tonal stimulus with the estimated frequency is used. The least mean square (LMS) algorithm is utilized to calculate the model of the secondary path model. The sampling frequency of the controller is 16k Hz. The orders of the control filter and the secondary model are both set to 150. The noise reduction performance in the duct is evaluated by comparing the acoustic energy of the narrowband resonance noise at the error microphone, test microphone I and test microphone II before and after the control system is switched on.
4. Numerical and Experimental Results
4.1. Resonance Frequency Prediction of Flow-Induced Noise
In order to validate the numerical method for resonance frequency prediction, the experimental system in Figure 3 is modelled, and the flow-induced resonance noise is numerically calculated. Figure 5 gives the numerical model for a cavity depth of 261 mm, with boundary conditions which are consistent with the experimental parameters. Numerical microphones (M1 and M2) are set at the leading and trailing edges of the cavity. In the numerical simulations, 905,769 structured grids over the whole area are used and the near-wall cells are refined. In addition, the time term is discretized in second-order implicit format. The momentum equation is discretized in bounded central difference format. The pressure-velocity coupling equation is solved using the Pressure Implicit with Splitting of Operator (PISO) algorithm with a calculated time step of s. Thus, its corresponding analysis frequency is 10 kHz.
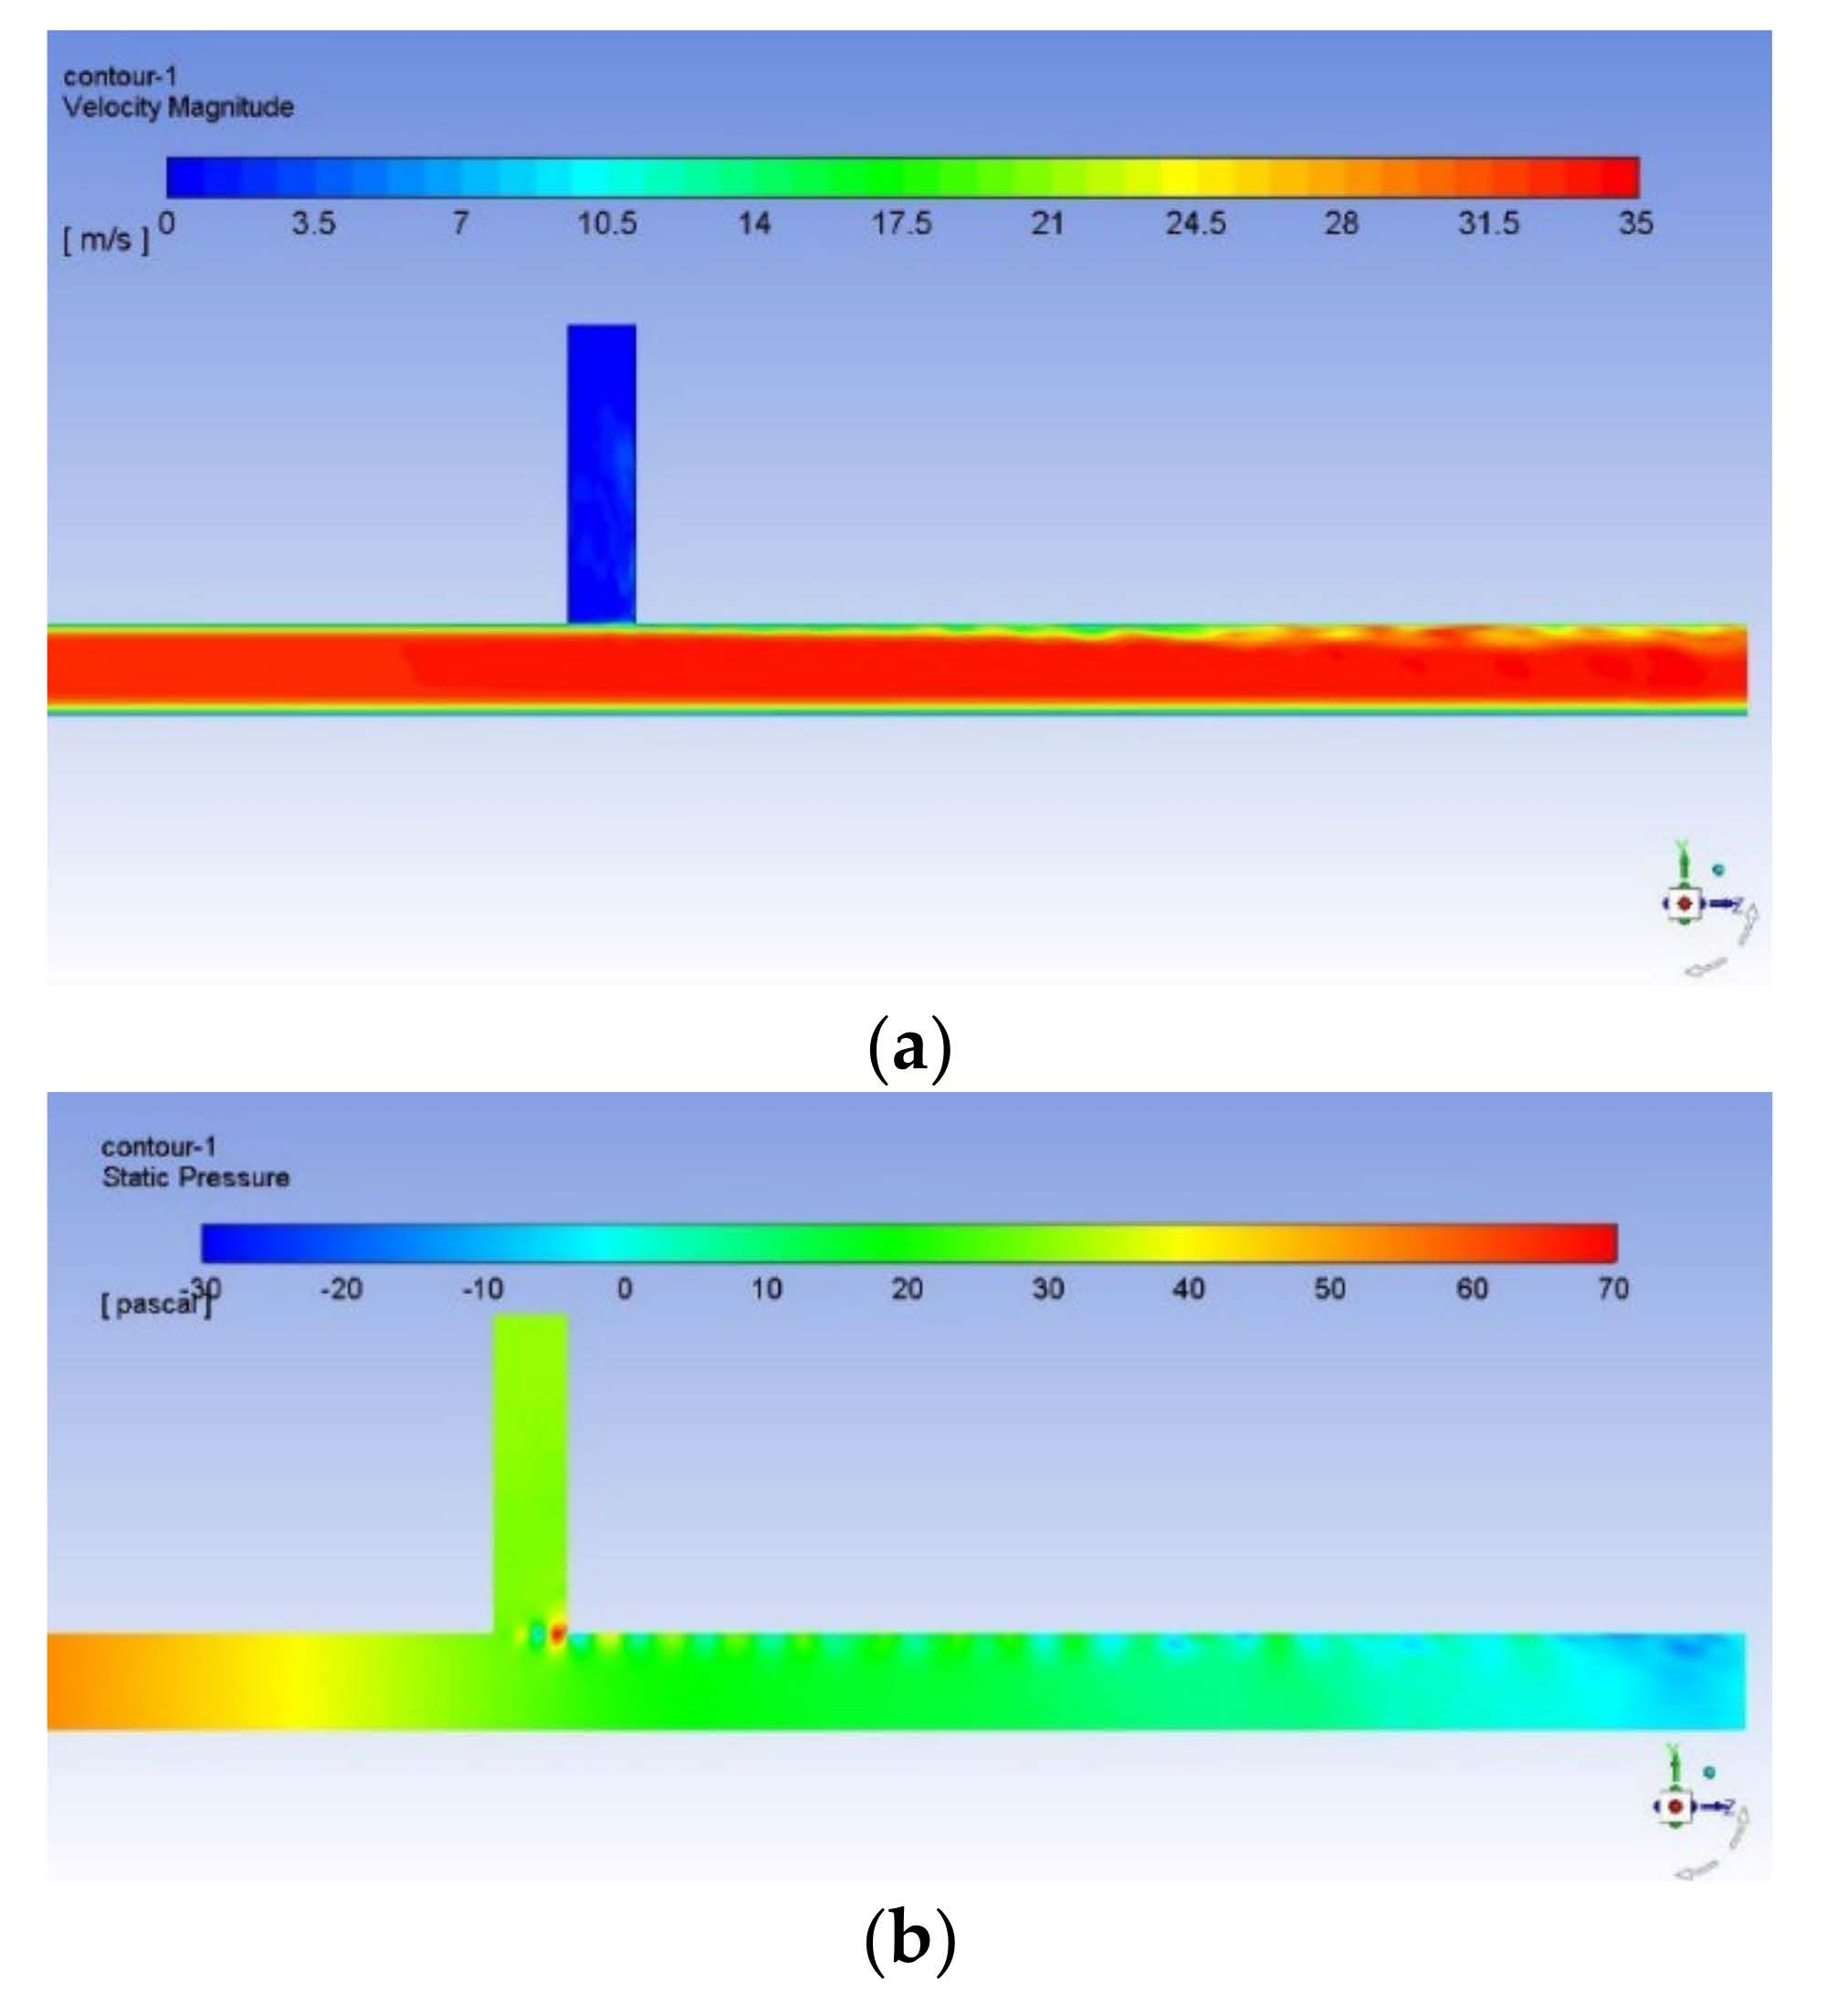
The pressure and velocity in the ventilation ducts are obtained with the commercial software FLUENT. The results of the flow field calculation for a 261 mm depth cavity are given in Figure 6. As can be seen from the flow velocity calculations, the areas where the flow velocity varies are mainly inside the cavity and at the boundary layer of the duct. The calculations show that the area of pressure variation is mainly at the mouth of the cavity. Further, a series of high and low pressures are distributed near the duct wall after the trailing edge of the cavity. This indicates that the downstream edge of the cavity is directly impacted by the unsteady flow, creating vortexes at the mouth of the cavity and causing fluid oscillations. Furthermore, the pressure pulses generated by the vortex–edge interactions trigger the vortex shedding at the upstream edge and regulate the feedback loop. The feedback is provided by the acoustic particle velocity of the resonant standing wave in the duct systems with cavities. This particle velocity causes new perturbations in the unstable shear layer at the separation location. As the perturbations in the shear layer are amplified downstream, they interact with the acoustic field and generate acoustic energy, enhancing the resonance of the acoustic modes. The acoustic resonances of the ducts with side-wall cavities are caused by a feedback excitation mechanism referred in the literatures as the fluid-resonant mechanism [2]. The calculated noise power spectrums are shown in Figure 7, from which it can be observed that obvious resonance noise appear at 336 Hz for the leading edge microphone M1 and 337 Hz for the trailing edge microphone M2.
The mesh-independent verification of grid is given in Table 1 together with a comparison between the numerical and experimental results, from which it can be seen that relatively accurate models could be achieved with more than 361,464 grids. It can also be observed that the numerical results for resonance noise frequencies are in good agreement with the experimental results. The amplitudes of the numerical results are closer to the experimental results when more small-scale vortices are identified as the number of grid encryption grids increases.
4.2. Active Control of the Flow-Induced Resonance Noise
Based on the system shown in Figure 4, ANC experiments are further carried out to verify the effectiveness of the proposed method. In each experiment, the optimum stepsize is obtained by the trial-and-error method so that the best noise reduction performance could be achieved. For each case, some other adjacent frequencies (with intervals of 1 Hz) are also used as the reference frequencies to test if a better performance could be achieved. The best control results for the narrowband resonance noise with 236 mm, 249 mm and 261 mm cavity depths are summarized in Table 2. The effective reference frequency ranges within which attenuations of resonance noise could be achieved is also given. Although the original flow-induced noise spectrums show two resonance frequencies corresponding to different modes, only the first resonance is under control, i.e., the tonal reference signal of the ANC system only contains the first resonance frequency component.
As can be seen from Table 2, resonance noise can be effectively reduced by the narrowband ANC system. The noise energy at the fundamental resonance frequency and its first harmonic could be greatly attenuated at the same time, although only the former is under control in the ANC system. Moreover, it was also observed that both the upstream and downstream noise could be effectively reduced by the control system, which indicates that the total energy of resonance noise is attenuated for the whole duct system and a global control performance can been achieved. These results go against with the ones in early researches [20,21], in which it was concluded that only local noise reduction performance is expected and adaptive algorithms are not effective for multiple modes. It should be noted that in this paper the cavity is installed inside a duct system with extremely low Mach numbers, which might give rise to different noise reduction behaviors.
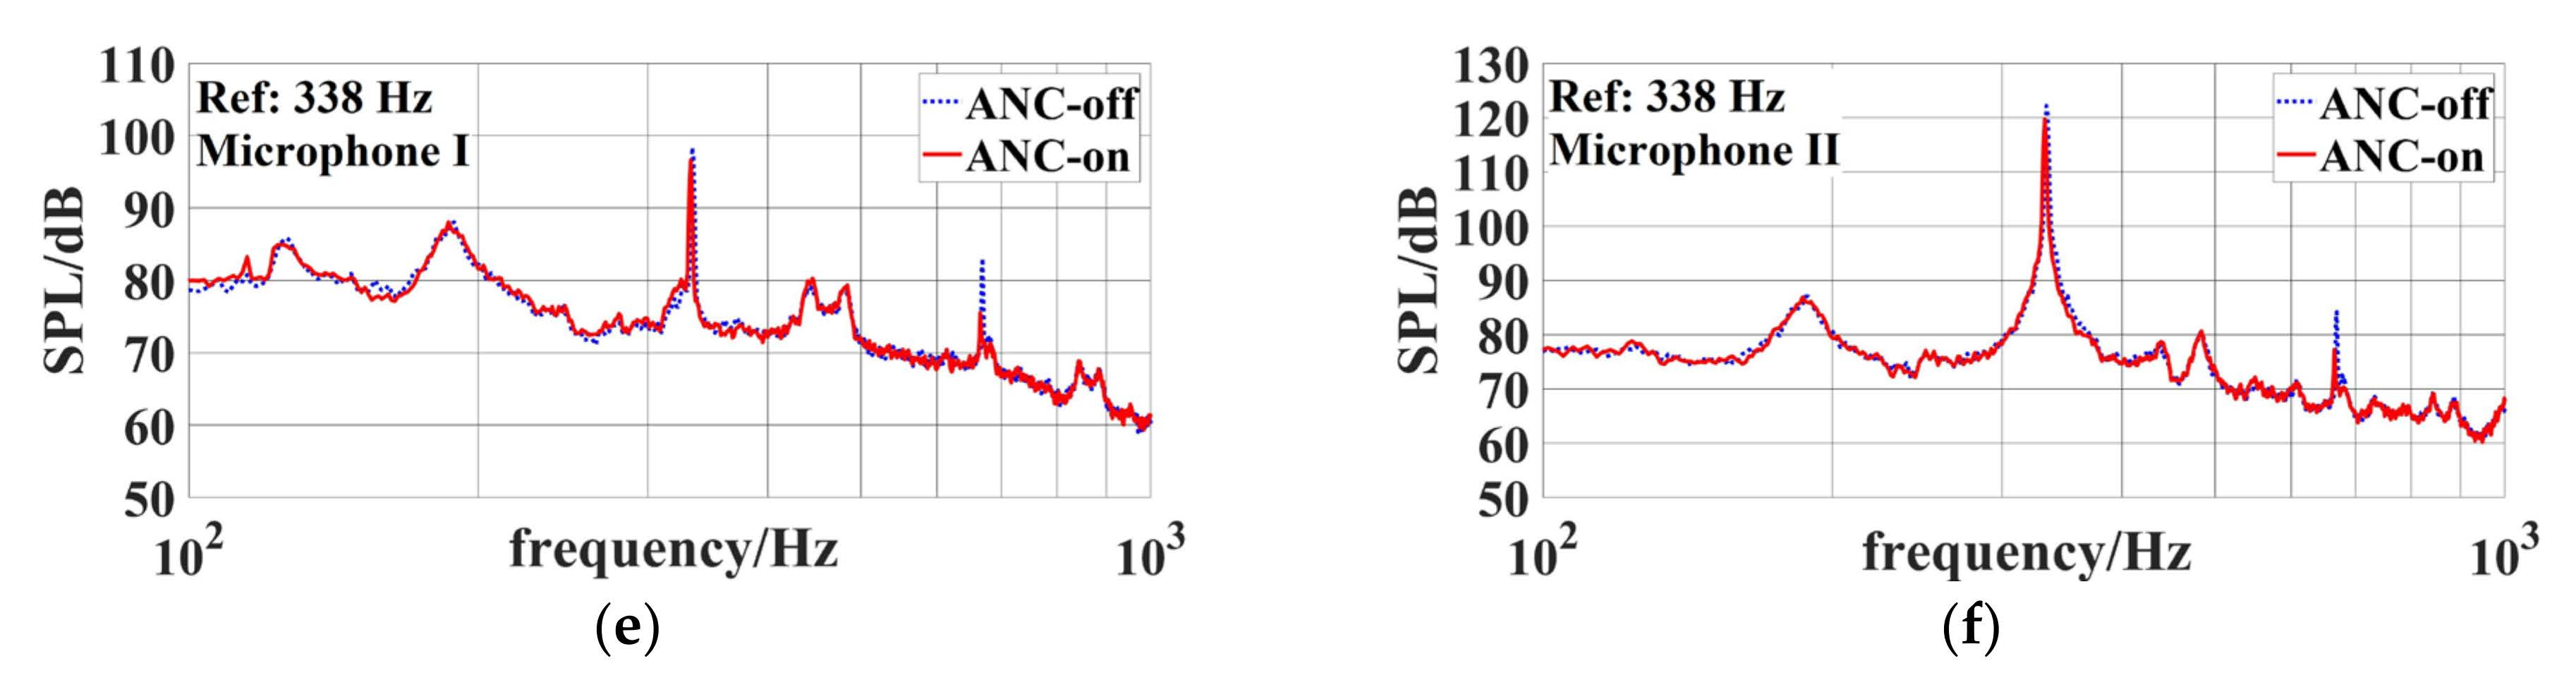
It can also be observed from Table 2 that, in some cases, the optimal reference frequencies are not in accordance with the resonance frequencies. The difference between these two frequencies could be up to 6–8 Hz. Further, the ANC system is effective over a relatively wide range of the reference frequency (approximately 12 Hz for all 3 cases). The specific power spectrums of resonance noise before and after control are given in Figure 8, Figure 9 and Figure 10 for different cavity depths. These relatively wide reference frequency ranges are very different from linear systems, where the noise reduction performance could be greatly reduced by only 1 Hz FM [23,24]. Furthermore, the optimal reference frequency corresponding to the best noise reduction performance shows some randomness when compared with the resonance frequency. For the 249 mm cavity, the optimal reference frequency is the same as the resonance noise frequency, which is a common result for a narrowband ANC system. For the 236 mm cavity, however, the best control performance could be obtained with a 332 Hz reference, which is much lower than the resonance frequency 340 Hz. While in the case with a 261 mm cavity, the optimum reference frequency 337 Hz becomes much higher than the resonance frequency 331 Hz.
The offset of the optimal reference frequency and the control performance at the first harmonic indicate that the control mechanism should be nonlinear. By injecting tonal secondary noise near the resonance frequency, the narrowband ANC system changes the boundary condition of the cavity bottom at the controlling frequency and destroys the original nonlinear feedback excitation conditions. Therefore, significant reductions could be simultaneously obtained at both the original resonance frequency as well as its first harmonic. The higher tolerance for the reference FM could also result from the nonlinear mechanism of flow-induced cavity resonance.
5. Conclusions
In this paper, active control of flow-induced cavity resonance noise is experimentally investigated with the usage of a narrowband ANC system. An experimental duct system with side-wall cavities is built up at low Mach numbers. First, a hybrid numerical method combining LES and the FW-H equation is applied to predict the frequency of the flow-induced resonance noise. Then, a narrowband ANC system is further established to suppress this resonance noise, where the secondary loudspeaker and the acoustic sensor are placed at the bottom and near the leading edge of the cavity, respectively. The FxLMS algorithm is used as the control algorithm, within which an internally generated sinusoidal signal is used as the reference.
Experiments are carried out, whose results show that the resonance frequency could be predicted with 1.5% errors by the hybrid numerical method, and more than 10 dB attenuations can be obtained for both the upstream and the downstream resonance noise, which indicates a global control performance. Compared with methods of active flow control, resonance noise is suppressed without enhancements at other frequencies. Further, it was also found that the noise energy for both the fundamental resonance frequency and its first harmonic can be suppressed at the same time, although only the former is under control inside the ANC system. Furthermore, the optimal reference frequency could differ significantly from the original resonance frequency and a relatively high tolerance for the reference FM could be observed, which is rather different from the cases in linear systems. All these results indicate a nonlinear control mechanism for the control of flow-induced resonance noise with a narrowband ANC system proposed in this paper.
Although the effectiveness of the proposed method has been confirmed experimentally, the explicit nonlinear control mechanism is still not clear. Future work would focus on the joint simulations of the physical and the control systems, through which guidelines for the choices of the best reference frequencies might be obtained.
Author Contributions
Conceptualization, F.A. and H.L.; methodology, data curation and investigation, H.L. and C.S.; validation and software, F.A. and X.Z.; resources and supervision, B.L.; writing—original draft preparation, H.L.; writing—review and editing, F.A. and X.Z. All authors have read and agreed to the published version of the manuscript.
Funding
This research is funded by the National Natural Science Foundation of China (grant number 11874034), and the Taishan Scholar Program of Shandong (No. ts201712054).
Data Availability Statement
The data presented in this study are available on request from the corresponding author.
Conflicts of Interest
The authors declare no conflict of interest.
References
- Howe, M.S. Low Strouhal number instabilities of flow over apertures and wall cavities. J. Acoust. Soc. Am. 1997, 102, 772–780. [Google Scholar] [CrossRef]
- Rockwell, D.; Naudascher, E. Review—Self-sustaining oscillations of flow past cavities. ASME Trans. J. Fluids Eng. 1978, 100, 152–165. [Google Scholar] [CrossRef]
- Nelson, P.A.; Halliwell, N.A.; Doak, P.E. Fluid dynamics of a flow excited resonance. I—Experiment. J. Sound Vib. 1981, 78, 15–38. [Google Scholar] [CrossRef]
- Lawson, S.J.; Barakos, G.N. Review of numerical simulations for high-speed, turbulent cavity flows. Prog. Aerosp. Sci. 2011, 47, 186–216. [Google Scholar] [CrossRef]
- Luo, K.; Zhe, W.; Xiao, Z.; Fu, S. Improved delayed detached-eddy simulations of sawtooth spoiler control before supersonic cavity. Int. J. Heat Fluid Flow 2017, 63, 172–189. [Google Scholar] [CrossRef]
- Li, B.; Ye, C.C.; Wan, Z.H.; Liu, N.S.; Sun, D.J.; Lu, X.Y. Noise control of subsonic flow past open cavities based on porous floors. Phys. Fluids 2020, 32, 125101. [Google Scholar] [CrossRef]
- Guo, Z.; Liu, P.; Guo, H. Control effect on deep cavity noise by slanted walls at low Mach numbers. J. Vib. Control 2021, 27, 998–1008. [Google Scholar] [CrossRef]
- Abdelmwgoud, M.; Mohany, A. Control of the self-sustained shear layer oscillations over rectangular cavities using high-frequency vortex generators. Phys. Fluids 2021, 33, 045115. [Google Scholar] [CrossRef]
- Cattafesta III, L.N.; Song, Q.; Williams, D.R.; Rowley, C.W.; Alvi, F.S. Active control of flow-induced cavity oscillations. Prog. Aerosp. Sci. 2008, 44, 479–502. [Google Scholar] [CrossRef]
- de Jong, A.; Bijl, H. Corner-type plasma actuators for cavity flow-induced noise control. AIAA J. 2014, 52, 33–42. [Google Scholar] [CrossRef]
- Yokoyama, H.; Otsuka, K.; Otake, K.; Nishikawara, M.; Yanada, H. Control of cavity flow with acoustic radiation by an intermittently driven plasma actuator. Phys. Fluids 2020, 32, 106104. [Google Scholar] [CrossRef]
- Bennett, G.J.; Okolo, P.N.; Zhao, K.; Philo, J.; Guan, Y.; Morris, S.C. Cavity resonance suppression using fluidic spoilers. AIAA J. 2019, 57, 706–719. [Google Scholar] [CrossRef] [Green Version]
- Sun, Y.; Liu, Q.; Cattafesta III, L.N.; Ukeiley, L.S.; Taira, K. Effects of sidewalls and leading-edge blowing on flows over long rectangular cavities. AIAA J. 2019, 57, 106–119. [Google Scholar] [CrossRef] [Green Version]
- Haddabi, N.A.; Kontis, K.; Zare-Behtash, H. The Impact of Steady Blowing from the Leading Edge of an Open Cavity Flow. Aerospace 2021, 8, 255. [Google Scholar] [CrossRef]
- Lu, Z.B.; Cheng, L. Active control of flow-induced acoustic resonance through surface perturbation. AIAA J. 2012, 50, 2566–2573. [Google Scholar] [CrossRef]
- Lu, Z.B.; Halim, D.; Cheng, L. Closed-loop control of flow-induced sound in a flow duct with downstream resonant cavities. J. Acoust. Soc. Am. 2013, 133, 1468–1479. [Google Scholar] [CrossRef] [Green Version]
- Lu, Z.B.; Halim, D.; Cheng, L. Flow-induced noise control behind bluff bodies with various leading edges using the surface perturbation technique. J. Sound Vib. 2016, 369, 1–15. [Google Scholar] [CrossRef]
- Leclercq, C.; Demourant, F.; Poussot-Vassal, C.; Sipp, D. Linear iterative method for closed-loop control of quasiperiodic flows. J. Fluid Mech. 2019, 868, 26–65. [Google Scholar] [CrossRef] [Green Version]
- Elliott, S.J. Signal Processing for Active Control; Academic Press: San Diego, CA, USA, 2001. [Google Scholar]
- Kestens, T.; Nicoud, F. Active control of an unsteady flow over a rectangular cavity. In Proceedings of the 4th AIAA/CEAS Aeroacoustics Conference, Toulouse, France, 2–4 June 1998. [Google Scholar]
- Williams, D.; Morrow, J. Adaptive control of multiple acoustic modes in cavities. In Proceedings of the 15th AIAA Computational Fluid Dynamics Conference, Anaheim, CA, USA, 11–14 June 2001. [Google Scholar]
- Xiao, Y.; Ikuta, A.; Ma, L.; Khorasani, K. Stochastic analysis of the fxlms-based narrowband active noise control system. IEEE Trans. Audio Speech Lang. Process. 2008, 16, 1000–1014. [Google Scholar] [CrossRef]
- Jeon, H.J.; Chang, T.G.; Kuo, S.M. Analysis of frequency mismatch in narrowband active noise control. IEEE Trans. Audio Speech Lang. Process. 2010, 18, 1632–1642. [Google Scholar] [CrossRef]
- Xiao, Y.; Ma, L.; Khorasani, K.A.; Ikuta, A. A new robust narrowband active noise control system in the presence of frequency mismatch. IEEE Trans. Audio Speech Lang. Process. 2006, 14, 2189–2200. [Google Scholar] [CrossRef]
- Wang, H.; Sun, H.; Sun, Y.; Wu, M.; Yang, J. A narrowband active noise control system with a frequency estimation algorithm based on parallel adaptive notch filter. Signal Process. 2019, 154, 108–119. [Google Scholar] [CrossRef]
- Han, R.; Wu, M.; Liu, F.; Sun, H.; Yang, J. A narrowband active noise control system with a frequency estimator based on Bayesian inference. J. Sound Vib. 2019, 455, 299–311. [Google Scholar] [CrossRef]
- Gong, C.; Wu, M.; Guo, J.; Zhang, Z.; Cao, Y.; Yang, J. Multichannel narrowband active noise control system with a frequency estimator based on DFT coefficients. J. Sound Vib. 2022, 521, 116660. [Google Scholar] [CrossRef]
- Yang, Z.D.; Gu, Z.Q.; Tu, J.Y.; Dong, G.P.; Wang, Y.P. Numerical analysis and passive control of a car side window buffeting noise based on Scale-Adaptive Simulation. Appl. Acoust. 2014, 79, 23–34. [Google Scholar] [CrossRef]
- Zhang, Y.O.; Zhang, T.; Ouyang, H.; Li, T.Y. Flow-induced noise analysis for 3D trash rack based on LES/Lighthill hybrid method. Appl. Acoust. 2014, 79, 141–152. [Google Scholar] [CrossRef]
- Han, T.; Wang, L.; Cen, K.; Song, B.; Shen, R.Q.; Liu, H.B.; Wang, Q.S. Flow-induced noise analysis for natural gas manifolds using LES and FW-H hybrid method. Appl. Acoust. 2020, 159, 107101. [Google Scholar] [CrossRef]
Figure 1.
Schematic diagram of the ANC system for acoustic resonance noise.

Figure 2.
The narrowband FxLMS algorithm.

Figure 3.
The experimental system: (a) the schematic diagram; (b) the experimental setup.


Figure 4.
The experimental ANC system.

Figure 5.
The numerical model of the 261 mm depth cavity.

Figure 6.
Simulation results with 261 mm cavity: (a) the computed flow rate; (b) the computed static pressure.
Figure 6.
Simulation results with 261 mm cavity: (a) the computed flow rate; (b) the computed static pressure.

Figure 7.
Calculation results of the noise power spectrum.

Figure 8.
Experimental results with 236 mm cavity: the noise spectrum at the test (a) microphone I and (b) microphone II with a 328 Hz reference; the noise spectrum at the test (c) microphone I and (d) microphone II with a 332 Hz reference (best); the noise spectrum at the test (e) microphone I and (f) microphone II with a 340 Hz (resonance frequency) reference.

Figure 9.
Experimental results with 249 mm cavity: the noise spectrum at the test (a) microphone I and (b) microphone II with a 326 Hz reference; the noise spectrum at the test (c) microphone I and (d) microphone II with a 334 Hz (resonance frequency) reference (best); the noise spectrum at the test (e) microphone I and (f) microphone II with a 338 Hz reference.


Figure 10.
Experimental results with 261 mm cavity: the noise spectrum at the test (a) microphone I and (b) microphone II with a 331 Hz (resonance frequency) reference; the noise spectrum at the test (c) microphone I and (d) microphone II with a 337 Hz reference (best); the noise spectrum at the test (e) microphone I and (f) microphone II with a 343 Hz reference.


Table 1.
Independence verification of grid.
| Cavity Depth/mm | Number of Grids | Numerical Prediction | Experiment Result/Hz | |||
|---|---|---|---|---|---|---|
| M1/Hz | Error | M2/Hz | Error | |||
| 261 | 171,595 | 351 | 6.0% | 358 | 8.2% | 331 |
| 361,464 | 336 | 1.5% | 337 | 1.8% | ||
| 905,769 | 336 | 1.5% | 337 | 1.8% | ||
Table 2.
Experimental control performance of the flow-induced acoustic resonance noise.
| Cavity Depth/mm | Noise Frequency/Hz | Optimal Stepsize | Effective Reference Frequency Range/Hz | Optimal Reference Frequency/Hz | Control Results/dB | ||
|---|---|---|---|---|---|---|---|
| Error | Test I | Test II | |||||
| 236 | 340 | 0.011 | [328, 340] | 332 | 19 | 20 | 18 |
| 680 | 14 | 12 | 13 | ||||
| 249 | 334 | 0.008 | [326, 338] | 334 | 22 | 13 | 11 |
| 668 | 12 | 13 | 13 | ||||
| 261 | 331 | 0.0038 | [331, 343] | 337 | 11 | 12 | 20 |
| 662 | 7 | 6 | 10 | ||||
Publisher’s Note: MDPI stays neutral with regard to jurisdictional claims in published maps and institutional affiliations. |
© 2022 by the authors. Licensee MDPI, Basel, Switzerland. This article is an open access article distributed under the terms and conditions of the Creative Commons Attribution (CC BY) license (https://creativecommons.org/licenses/by/4.0/).
Share and Cite
MDPI and ACS Style
An, F.; Li, H.; Zhang, X.; Sun, C.; Liu, B. Experimental Research on Reducing Flow-Induced Cavity Resonance with a Narrowband Active Noise Control System. Appl. Sci. 2022, 12, 7044. https://0-doi-org.brum.beds.ac.uk/10.3390/app12147044
AMA Style
An F, Li H, Zhang X, Sun C, Liu B. Experimental Research on Reducing Flow-Induced Cavity Resonance with a Narrowband Active Noise Control System. Applied Sciences. 2022; 12(14):7044. https://0-doi-org.brum.beds.ac.uk/10.3390/app12147044
Chicago/Turabian StyleAn, Fengyan, Hao Li, Xilong Zhang, Chengpu Sun, and Bilong Liu. 2022. "Experimental Research on Reducing Flow-Induced Cavity Resonance with a Narrowband Active Noise Control System" Applied Sciences 12, no. 14: 7044. https://0-doi-org.brum.beds.ac.uk/10.3390/app12147044
Note that from the first issue of 2016, this journal uses article numbers instead of page numbers. See further details here.