
Study of the Utilization of Spent Grain from Malt Whisky on the Quality of Wafers


Faculty of Food Engineering, Stefan cel Mare University of Suceava, 720229 Suceava, Romania
*
Author to whom correspondence should be addressed.
Appl. Sci. 2022, 12(14), 7163; https://0-doi-org.brum.beds.ac.uk/10.3390/app12147163
Submission received: 1 July 2022
/
Revised: 11 July 2022
/
Accepted: 14 July 2022
/
Published: 15 July 2022
(This article belongs to the Special Issue Unconventional Raw Materials for Food Products)
Abstract
:This study aimed at determining the quality parameters of the wafer formulated with the addition of grain spent (SG), resulting from the obtainment of whisky. In this sense, wafers were formulated from chickpea flour, spent grain, wild garlic paste, golden flaxseed, and hemp seeds. These food products were analyzed in terms of texture, density, and pH of the batter, but also of the final product for proximate analysis, baking loss, texture, water activity, color, antioxidant capacity, water holding capacity and oil holding capacity, microstructure, and sensorial analysis. The addition of spent grain in the wafer formulation led to products with a high acceptability, the texture of the batter underwent changes due to the addition of spent grain, all parameters increased, and only adhesiveness decreased. The density and pH of the samples with SG decreased. The fracturability of the products with SG decreased with the addition of SG compared to the control sample, and the color becomes darker, influenced by the specific color of the SG. With the addition of spent grain, it increases the fiber and protein content, the antioxidant capacity, but also the baking loss due to the fibers contained in it. The microstructure of samples with the addition of SG shows a heterogeneous distribution of pores on the cross section of the samples, with larger pores in the center of the wafer samples.
1. Introduction
Wafers are food products obtained from thin batter, baked on metal molds, and characterized by the fact that they are found in the form of sheets, empty round figures or covered with chocolate, ice cream cones, and wafer sticks, but also dub other shapes [1]. Baked wafers are used for the manufacture of several confectionery products by spraying a liquid batter between two heated closed plates to allow the dough to spread evenly [2]. Along with crackers, pretzels, and cookies, wafers belong to the category of bakery products with a long shelf life [3]. Flour products in this category are known in a wide variety of assortments, obtained by baking in special forms a fluid batter prepared from wheat flour, water, salt, leaving agents, and other materials used for taste and aroma, which are presented in the form of sheets or different alveoli formats with a high porosity and without filling [4]. The disadvantages lie in the fact that part of these products may have a low nutritional value and poorly outlined sensory characteristics, with a low level of essential amino acids and dietary fiber [5]. Although the basic ingredient in the formulation of waffles is wheat flour, lately, the partial or total replacement of wheat flour has become increasingly used. Crispiness is one of the defining parameters for wafers and reflects the density of the cellular structure [6]. The crispiness of the waffles is given by their low moisture of 1–2%, the crispy texture losing approximately6–7% moisture. The term wafer is often confused with waffle, but between the two products there are major differences: waffles have a soft texture with a moisture of 10% or more, while wafers have a crispy texture, are thin, and with a moisture content of 1–2% [7]. Non-creamed wafers refer to crispy wafers without typical cream fillings, an option being the use of other flours besides wheat, such as chickpea flour or corn flour, or the use of fermented batters to give it a special flavor.
Spent grain is the main by-product resulting in huge quantities in the beer industry and whisky production, with a rich content of fiber and protein, but also minerals, vitamins, and phenolic compounds. Even if lately, it is trying to reuse it, much of the spent grain remains to be managed efficiently still. There is a growing focus on exploring sustainable recovery processes for active compounds released from spent grain [8,9]. In food products, spent grain tends to improve the nutritional value of spent grain-added food products. Due to the biologically active compounds contained, spent grain shows antioxidant activity, antimicrobial, and anti-inflammatory activity, but also potential as a functional ingredient in food or as a nutraceutical ingredient [10,11].
Chickpea (Cicer arietinum L.) beans are known all over the world, being used in a wide range of foods as such or used for the fortification of some foods. Chickpea flour can improve the quality of products and increase their nutritional value [12]. Chickpea flour is an excellent source of proteins, carbohydrates with a low and easily digestible glycemic index, dietary fiber, mineral substances: potassium, phosphorus, calcium, manganese, copper, iron and zinc, and vitamins of the B complex, provitamin A, vitamins C, E, and K [12]. Wild garlic (Alliumursinum) contains allyl sulfide, vitamin A, vitamin C, carotenoids, ethereal oil, volatile oils, allicin, adenosine, and mineral substances [13]. The seeds of golden flax (Linumusitatissimum) and hemp (Cannabis sativa L.) are rich in fatty acids, easily digestible proteins, and rich in essential amino acids, carbohydrates, soluble and insoluble fiber, B-complex vitamins, vitamin E, β-carotene, calcium, magnesium, iron, and zinc [14]. Frequent consumption of products based on chickpea flour is effective in reducing cardiovascular risk, type 2 diabetes, some types of cancer and obesity. Wild garlic has depurative, detoxifying, antiseptic, antiviral, antimicrobial, blood fluidifying, expectorant, and antitumor action. Spent grain flour, through fiber intake, has major implications in digestion by slowing down gastric emptying, prolonging the intestinal transit time, and reducing the speed of absorption of nutrients in the small intestine. Golden flax and hemp seeds have potentially beneficial effects on immune function, chronic-degenerative inflammatory diseases, obesity, cancer prevention, and glucose metabolism regulation.
The aim of this study is to develop wafers with sensorial characteristics and improved nutritional value by using the addition of spent grain from malt whisky. The finished product was analyzed in terms of texture, water activity, color, antioxidant capacity, water holding capacity and oil holding capacity, microstructure, and sensorial analysis.
2. Materials and Methods
2.1. Materials
Spent grain from distillery industry was provided from a local factory, Alexandrion Group (Ploiesti, Romania); wet spent grain was stored at −18 °C, dried at 50 °C for 24 h, ground by a mill, and then sieved. Spent grain flour was obtained from a fraction of less than 200 µm and was stored in paper bags at room temperature until further use. Spent grain used in this study has the following characteristics: moisture—5.04 ± 0.42, ash—3.47 ± 0.02, fiber—22.67 ± 0.42, protein—18.88 ± 0.37, and lipids—7.11 ± 0.39, as described in our previous study [15]. Chickpea flour, wild garlic, golden flax, and hemp seeds were purchased from a local market.
All chemicals used in this paper were of analytical grade and were purchased from Sigma Aldrich (St. Louis, MO, USA).
2.2. Wafer Making
The realization of the product provides for the qualitative and quantitative reception of raw and auxiliary materials, dosing and preparation of raw and auxiliary materials, mixing components with the obtainment of fluid batter, filtering the batter for the separation of possible agglomerations, pouring into molds, baking in electric oven, and cooling and packaging of the finished product. In Table 1, the recipe and quantity percentage of wafers used in this study is presented.
2.3. Batter Texture
The density of the wafer can be changed by changing the water–flour ratio used in the formulation of the liquid batter or by using a process trick to release additional moisture. Using a Perten TVT-6700 texturometer (Perten Instruments, Stockholm, Sweden), the batter wafer parameters (batter gumminess, chewiness, springiness, firmness, adhesiveness, and cohesiveness) were analyzed. Texturometer was equipped with a 35 mm compression plate, the flask diameter was 65 mm. Batter was analyzed directly from the glass jar (bowl height = 60 mm; diameter = 50 mm). Two compression cycles were performed for each sample analyzed in the present study at a trigger force of 7 g, test speed 1 mm/s, and retract speed 5 mm/s, method adapted by Oroian et al., 2022 [16] and Iuga and Mironeasa, 2021 [17]. All the measurements have been done in triplicate.
2.4. Batter Density and pH
The density of the waffle batter was determined by the method of Ekramian et al., 2021 [3], with a measuring cylinder by means of the relationship between the weight of the batter and the same volume of distilled water. The density of the dough batter gives us information about how fluffy (aerated) a batter is: the lower its density, the more aerated the batter [18]. The pH of the batter was measured using a Mettler Toledo pH-meter (Columbos, OH, USA) and the optimum pH-value for wafer batter is between pH 5.5 and 7.0 [19].
2.5. Proximate Analysis of Wafers
The moisture of wafers was determined by the method of drying in the air oven at 105 °C until the constant weight. The ash content was determined in an oven at 550 °C for 8 h, until a white or light grey residue is obtained [20]. The protein content was determined by standard Kjeldhal method and lipids content was determined by standard Soxhlet method [20]. Total dietary fibre was assessed by enzymatic method using the AOAC Method 2011.25 with a Megazyme total dietary fiber assay kit (Megazyme, Ireland), according to Lee et al., method [21]. All samples were measured in triplicate.
2.6. Baking Loss
Baking loss was calculated to the following Equation (1) and gives information on the moisture loss during baking [18]:
Baking loss (%) = [1 − (wafer weight [g]/batter weight [g])] × 100
2.7. Wafers Texture
A very important sensory property is the texture that affects consumer choices and food stability [22]. Dry wafer fracturability was determined using the maximum force F (N) needed to break a wafer piece. A Perten TVT-6700 device (Perten Instruments, Stockholm, Sweden) equipped with an aluminum break rig set adjusted to 50 mm width was used. The test speed was 2 mm/s and the trigger force 0.0005 N [23]. Instrument settings were pulled to break mode: test speed 2 mm/s [24,25]. Three replicates of wafer from each formulation were determined.
2.8. Water Activity
2.9. Wafers Color
2.10. Antioxidant Capacity of Wafers
The phenolic content was determined by the Folin–Ciocalteau method: 2 g of wafers were ground and mixed with 20 mL 80% methanol (v/v) and sonicated for 40 min in a sonication bath at 37 °C and 45 Hz, then the mixture was centrifuged for 5 min at 4000 rpm. A volume of 0.2 mL of the extract was mixed with 2 mL of 1:10 Folin–Ciocalteau reagent and 1.8 mL of 7.5% (w/v) sodium carbonate in a container. The mixture was left for 30 min at room temperature in the dark [23]. The total polyphenol content was determined at 750 nm using a UV–VIS–NIR spectrophotometer (Shimadzu Corporation, Kyoto, Japan). The calibration curve of polyphenols was achieved using gallic acid at concentrations of 10–200 mg/L with regression coefficient R2 = 0.99872. The samples were analyzed in triplicate.
Total antioxidant activity was determined by DPPH assay scavenging activity by adding 2 mL of extract described above with 2 mL of DPPH solution 0.1 mM in methanol [28]. The mixture was vortexed for 2 min and kept for 30 min at room temperature in a dark place, and then the absorbance was determined at 517 nm using a UV–VIS–NIR spectrophotometer (Schimadzu Corporation Kyoto, Japan). The antioxidant capacity was measured in triplicate, using distilled water as a blank sample, as described in Equation (2).
where As= absorbance of sample, Ab = absorbance of blank sample.
% Inhibition of DPPH = [(1 − As/Ab)] × 100
2.11. Water Holding Capacity and Oil Holding Capacity
To determine the water holding capacity (WHC), 1 g of sample and 10 mL of distilled water are placed in a centrifuge tube and vortexed for 30 min, left to stand for 30 min at room temperature, then centrifuged for 25 min at 3000 rpm [6,24]. Subsequently, the sediment is weighed and water holding capacity is calculated with the Equation:
where W0 is the weight of the sample, W1 is the weight of the centrifuge tube plus sample, and W2 is the weight of the centrifuge tube plus sediments.
WHC (%) = (W2− W1) × 100/W0
Oil holding capacity (OHC)was determined by 0.5 g of sample over which is added 5 mL canola oil placed in a centrifuge tube and vortexed for 30 min, left to stand for 30 min at room temperature, then centrifuged for 25 min at 3000 rpm [24]. Oil holding capacity is determined in the same way as water holding capacity, using the Equation:
where W0 is the weight of the sample, W1 is the weight of the centrifuge tube plus sample, and W2 is the weight of the centrifuge tube plus sediments.
OHC (%) = (W2− W1) × 100/W0
2.12. Microstructure (SEM)
The microstructure was characterized by a scanning electron microscope (SEM) VEGA II LSH (Tescan, Czech Republic) at an acceleration strain of 30 kV and a magnification of 100× and 200× by capturing different images of the cross-section to measure the size of the pores [2,3,29]. The samples were fixed with double adhesive carbon bands.
2.13. Sensory Analysis
For sensory analysis, a trained consumer test panel was recruited by a panel of fifteen experts selected according to their sensorial skills and trained in sensory vocabulary and identification of particular attributes. Panelists were selected based on interest and time availability. The samples were coded and presented randomly. The sensory panel was used to determine the texture rated according to appearance, color, taste, crunchiness, smell, and general acceptance. Panelists used a 5-point scale for sensory evaluation: 5 = appreciated extreme; 4 = pleasant; 3 = I neither liked nor liked; 2 did not like, and 1 =did not liked it extremely [4,30,31]. The acceptability index (AI) was calculated according to the equation
where Y =the average score obtained for the product and Z = the maximum score given to the product.
AI (%) = Y × 100/Z
2.14. Statistical Analysis
All of the analyses in the present study were performed in triplicate. Statistical software SPSS 25.0 (trial version) (IBM, New York, NY, USA) was used to calculate the mean values and standard deviations for the quantitative data (https://www.ibm.com/analytics/spss-trials (accessed on 21 June 2022)). A principal component analysis (PCA) was performed to observe the similarities or dissimilarities between the evaluated parameters and formulated samples.
3. Results and Discussion
The textural characteristics of batter wafer are affected by the structural components of the ingredients and manufacturing processes [16]. Gumminess, chewiness, springiness, firmness, and cohesiveness increased in the spent grain sample, while the adhesiveness decreased with the spent grain addition. The wafers batter textural parameters are presented in Table 2. The protein and fibre contents of spent grain affected all those parameters. In comparison, Iuga, 2020 [32] and Chetrariu and Dabija, 2021 [23] obtained the same tendency in their study.
The batter control sample density was higher (105.26% ± 0.05%) than the batter sample density (89.71% ± 0.03%), which means that the sample density was decreased with adding spent grain into formula wafers; those results are in accord with Ekramian et al., 2021 [3]. The low density indicates that more air is embedded in the batter and is desirable in the wafer batter, being tied to more gas bubbles in the wafers, leading to more bubbles during baking and making a larger volume of the finished product.
A proximate analysis of the wafers is shown in Table 3. The pH value of the samples (6.78 for wafer sample and 6.88 for control sample) are relatively close and fall within the optimal values found in Huber’s and Schoenlechner’s 2017 study [18]. A slight decrease in pH has been observed with the addition of spent grain to the wafer formulation and these changes can be attributed to the enzymatic reactions between the components of the wafers. A small addition of baking soda gives a slight increase in the pH value of the dough and influences the formation of the more intense Maillard reaction [33].
The moisture content contributes predominantly to the stickiness of the batter, but also to the crispiness of final products and a small moisture extended shelf life of food products [27]. The value for the moisture of the control sample was close to the value of the spent grain wafer sample (5.86% ± 0.02% vs. 5.88% ± 0.02%);the results found in this study were in agreement with Raza et al., 2016 [20]. Matinez-Navarrete et al., 2004, showed a good shelf-life stability and reported that wafers contain 7.00% ± 0.02% moisture and less than 0.52 water activity [34]. Most of the moisture evaporates during the baking process, resulting in a porous foamed cellular structure [29].
The crude proteins content is contributed to by spent grain addition and chickpea flour, with the highest content in the spent grain sample (11.17% ± 0.21%) compared to the control sample (9.66% ± 0.35%), in accordance with Raza et al., 2016 [20].
The lipids content was highest (17.69% ± 0.03%) in the spent grain sample and 16.03% ± 0.02% was the fat content in the control sample, due to the lipid contents of hemp seeds and golden flax seeds. Silva et al., 2022, obtained in their study a lower fat content, between 2.2% and 3.7% [35].
The total dietary fiber content was higher in the wafer sample (11.64% ± 0.04%) compared to the control sample (9.82% ± 0.03%) due to the addition of spent grain that contains a higher amount of fiber; the same trend was observed in study reported by Chetrariu and Dabija, 2022 [36].
The ash content was found to be highest in the control sample (7.35% ± 0.01%) followed by the spent grain sample (6.22% ± 0.01%), in accordance with Tiwari et al., 2020 [26].
The force measured at the first maximum point of the first significant change of the first curve is the force recorded at the breaking or destruction of the sample, i.e., the fracturability. If under stress a material can be fractured then it is considered to be a fragile material [23]. The fracturability of dried wafers decreases with the increase in the addition of spent grain (control sample 5.47 ± 0.09 N, spent grain wafers 3.86 ± 0.07 N), the same result obtained by Iuga, 2020 [32], and with a decrease in pasta fracturability with the increase in the content of whey powder and corn starch and by Chetrariu and Dabija [23] in their study about spent grain pasta.
Baking loss can be influenced by several factors: baking temperature, batter moisture, or leaving agents used. The values for baking loss were 50.15% for the control sample and 56.12% for the spent grain sample, respectively, compared to 19.52–27.48% baking losses in the case of waffle [18], which is to be expected because the wafer humidity is much lower than that of waffles.
Water activity (Aw) is a simple instrumental measure of crispness in wafer, making it an excellent way to monitor crispness over time and from batch to batch [37]. Traditionally, crispness intensity decreases as Aw increases. In their study, Goerlitz et al., 2007, found values for ice cream cones between 0.387 and 0.520, in agreement with this study (0.4302 for the control sample and 0.4350 for the spent grain sample) [37].
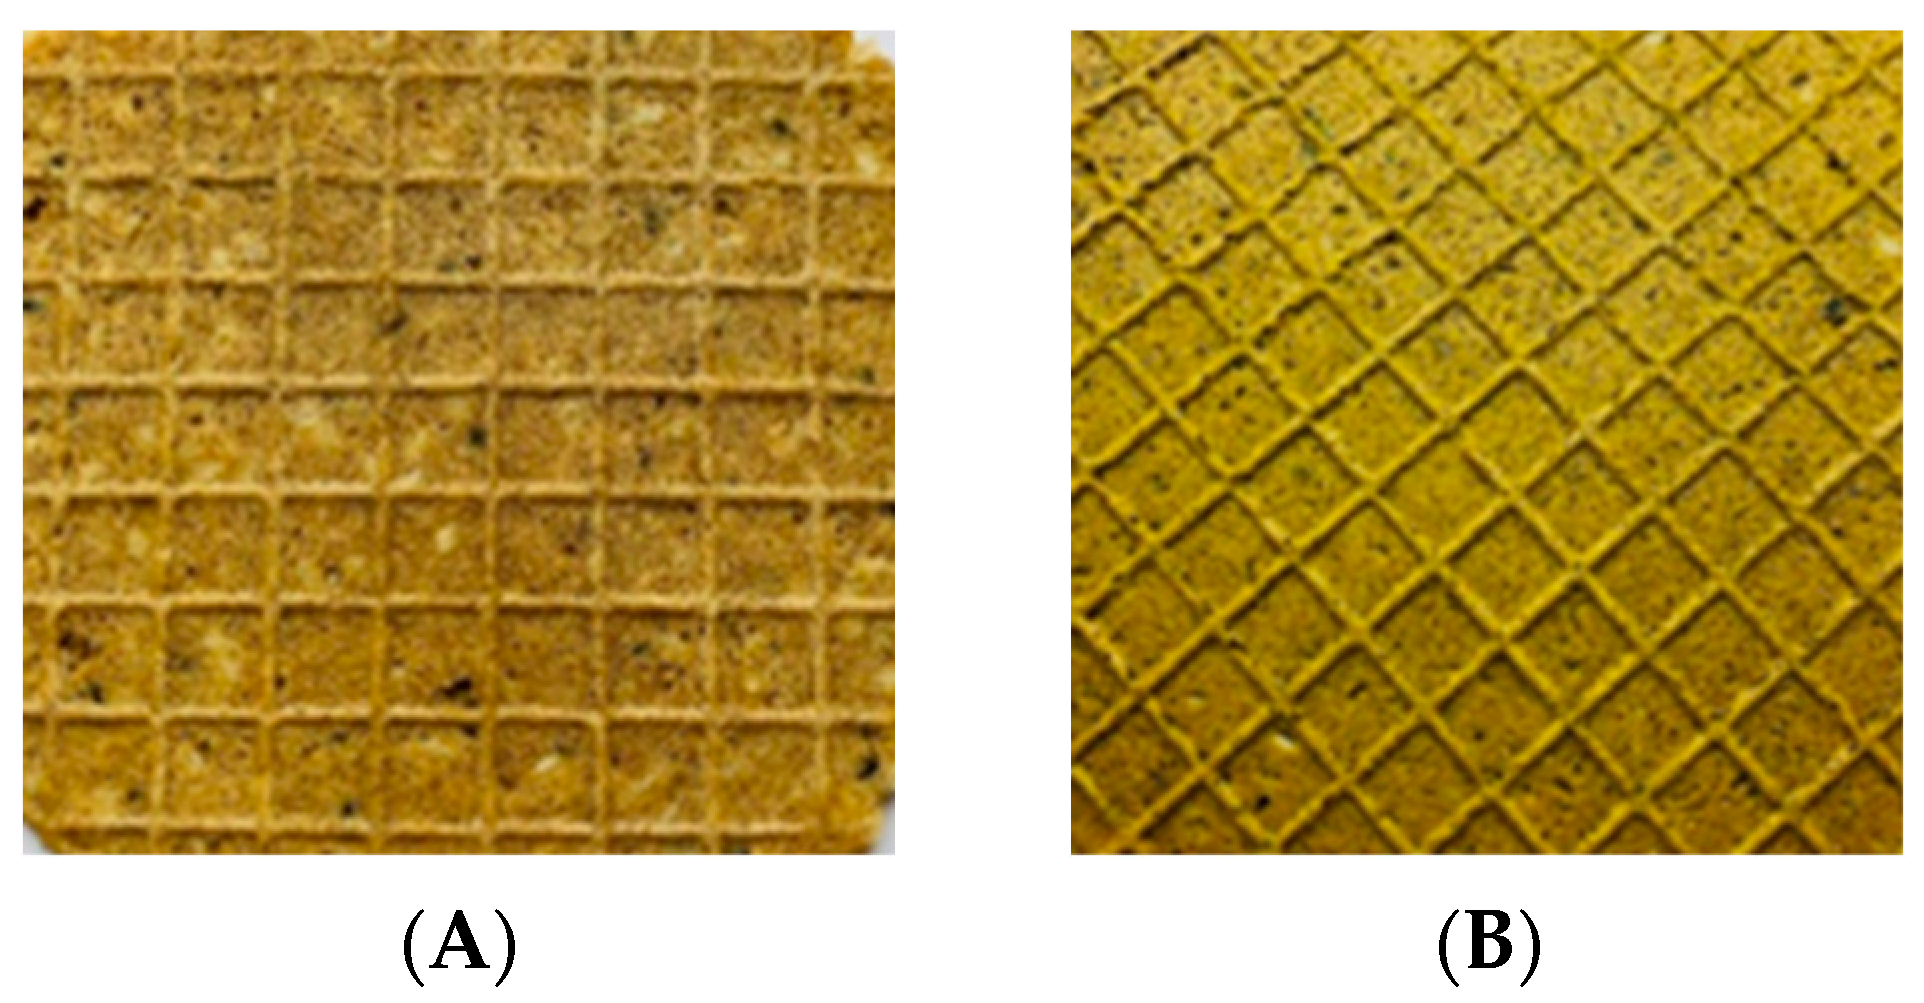
The acceptability of a product given by consumers is also influenced by the color of the product. The lightness of the spent grain wafer sample decreased compared to the control sample (Figure 1), a process due to the addition of spent grain, which has a specific dark color. There is a decrease in yellowness (b*) and an increase in redness (a*) in the spent grain wafer sample compared to the control sample (Table 4), in accordance with a study made by Chetrariu and Dabija, 2021 [23].
The total content of polyphenols increased in the spent grain wafer sample (6.46 µg GAE/g) compared to the blank sample (5.29 µg GAE/g), which means that spent grain has a polyphenol intake in the finished product. Spent grain had a contribution of polyphenols also in the case of pasta with the addition of spent grain flour, where the polyphenol content increased with the percentage of added spent grain (17.21 ± 0.19 µg GAE/g—23.06 ± 0.11 µg GAE/g) [23]. The radical scavenging activity on DPPH was higher for the spent grain wafer sample (24.44 ± 0.04) compared to the control sample (1.71 ± 0.01).
The water holding capacity refers to retained water that cannot be removed by ordinary drying processes, bound by electrostatic or chemical interactions. This correlates with the level of protein or ash. The water holding capacity (WHC) is often used to determine the interactions between fiber and water [6]. WHC is closely correlated with the degree of hydration of both proteins and other polar constituents, but also their hydrophilic interactions through hydrogen bonds [38]. The values of the two samples are close (301.88% ± 9.36% for spent grain wafers and 298.22% ± 17.16% for the control sample), with a higher WHC for the sample of spent grain wafers, which is due to the increase in fiber content, in accordance to Dom et al., 2020 [24]. The high protein content could be responsible for the formation of a large number of hydrogen bonds.
The oil holding capacity (OHC) is determined by the size and porosity (density) of the particles, the content of starch, and the concentration and hydrophobic nature of flour proteins [38]. The mechanism of foil absorption is mainly attributed to the physical retention of oils and their binding to the non-polar protein chain by hydrophobic interactions. The retention of oils has significant effects on the rheology of the dough and the quality of the finished product. The values for OHC are close for the two samples (135.28% ± 11.46% for the spent grain wafers and 136.02% ± 11.88% for the control sample), these functional properties not being influenced by the addition of spent grain.
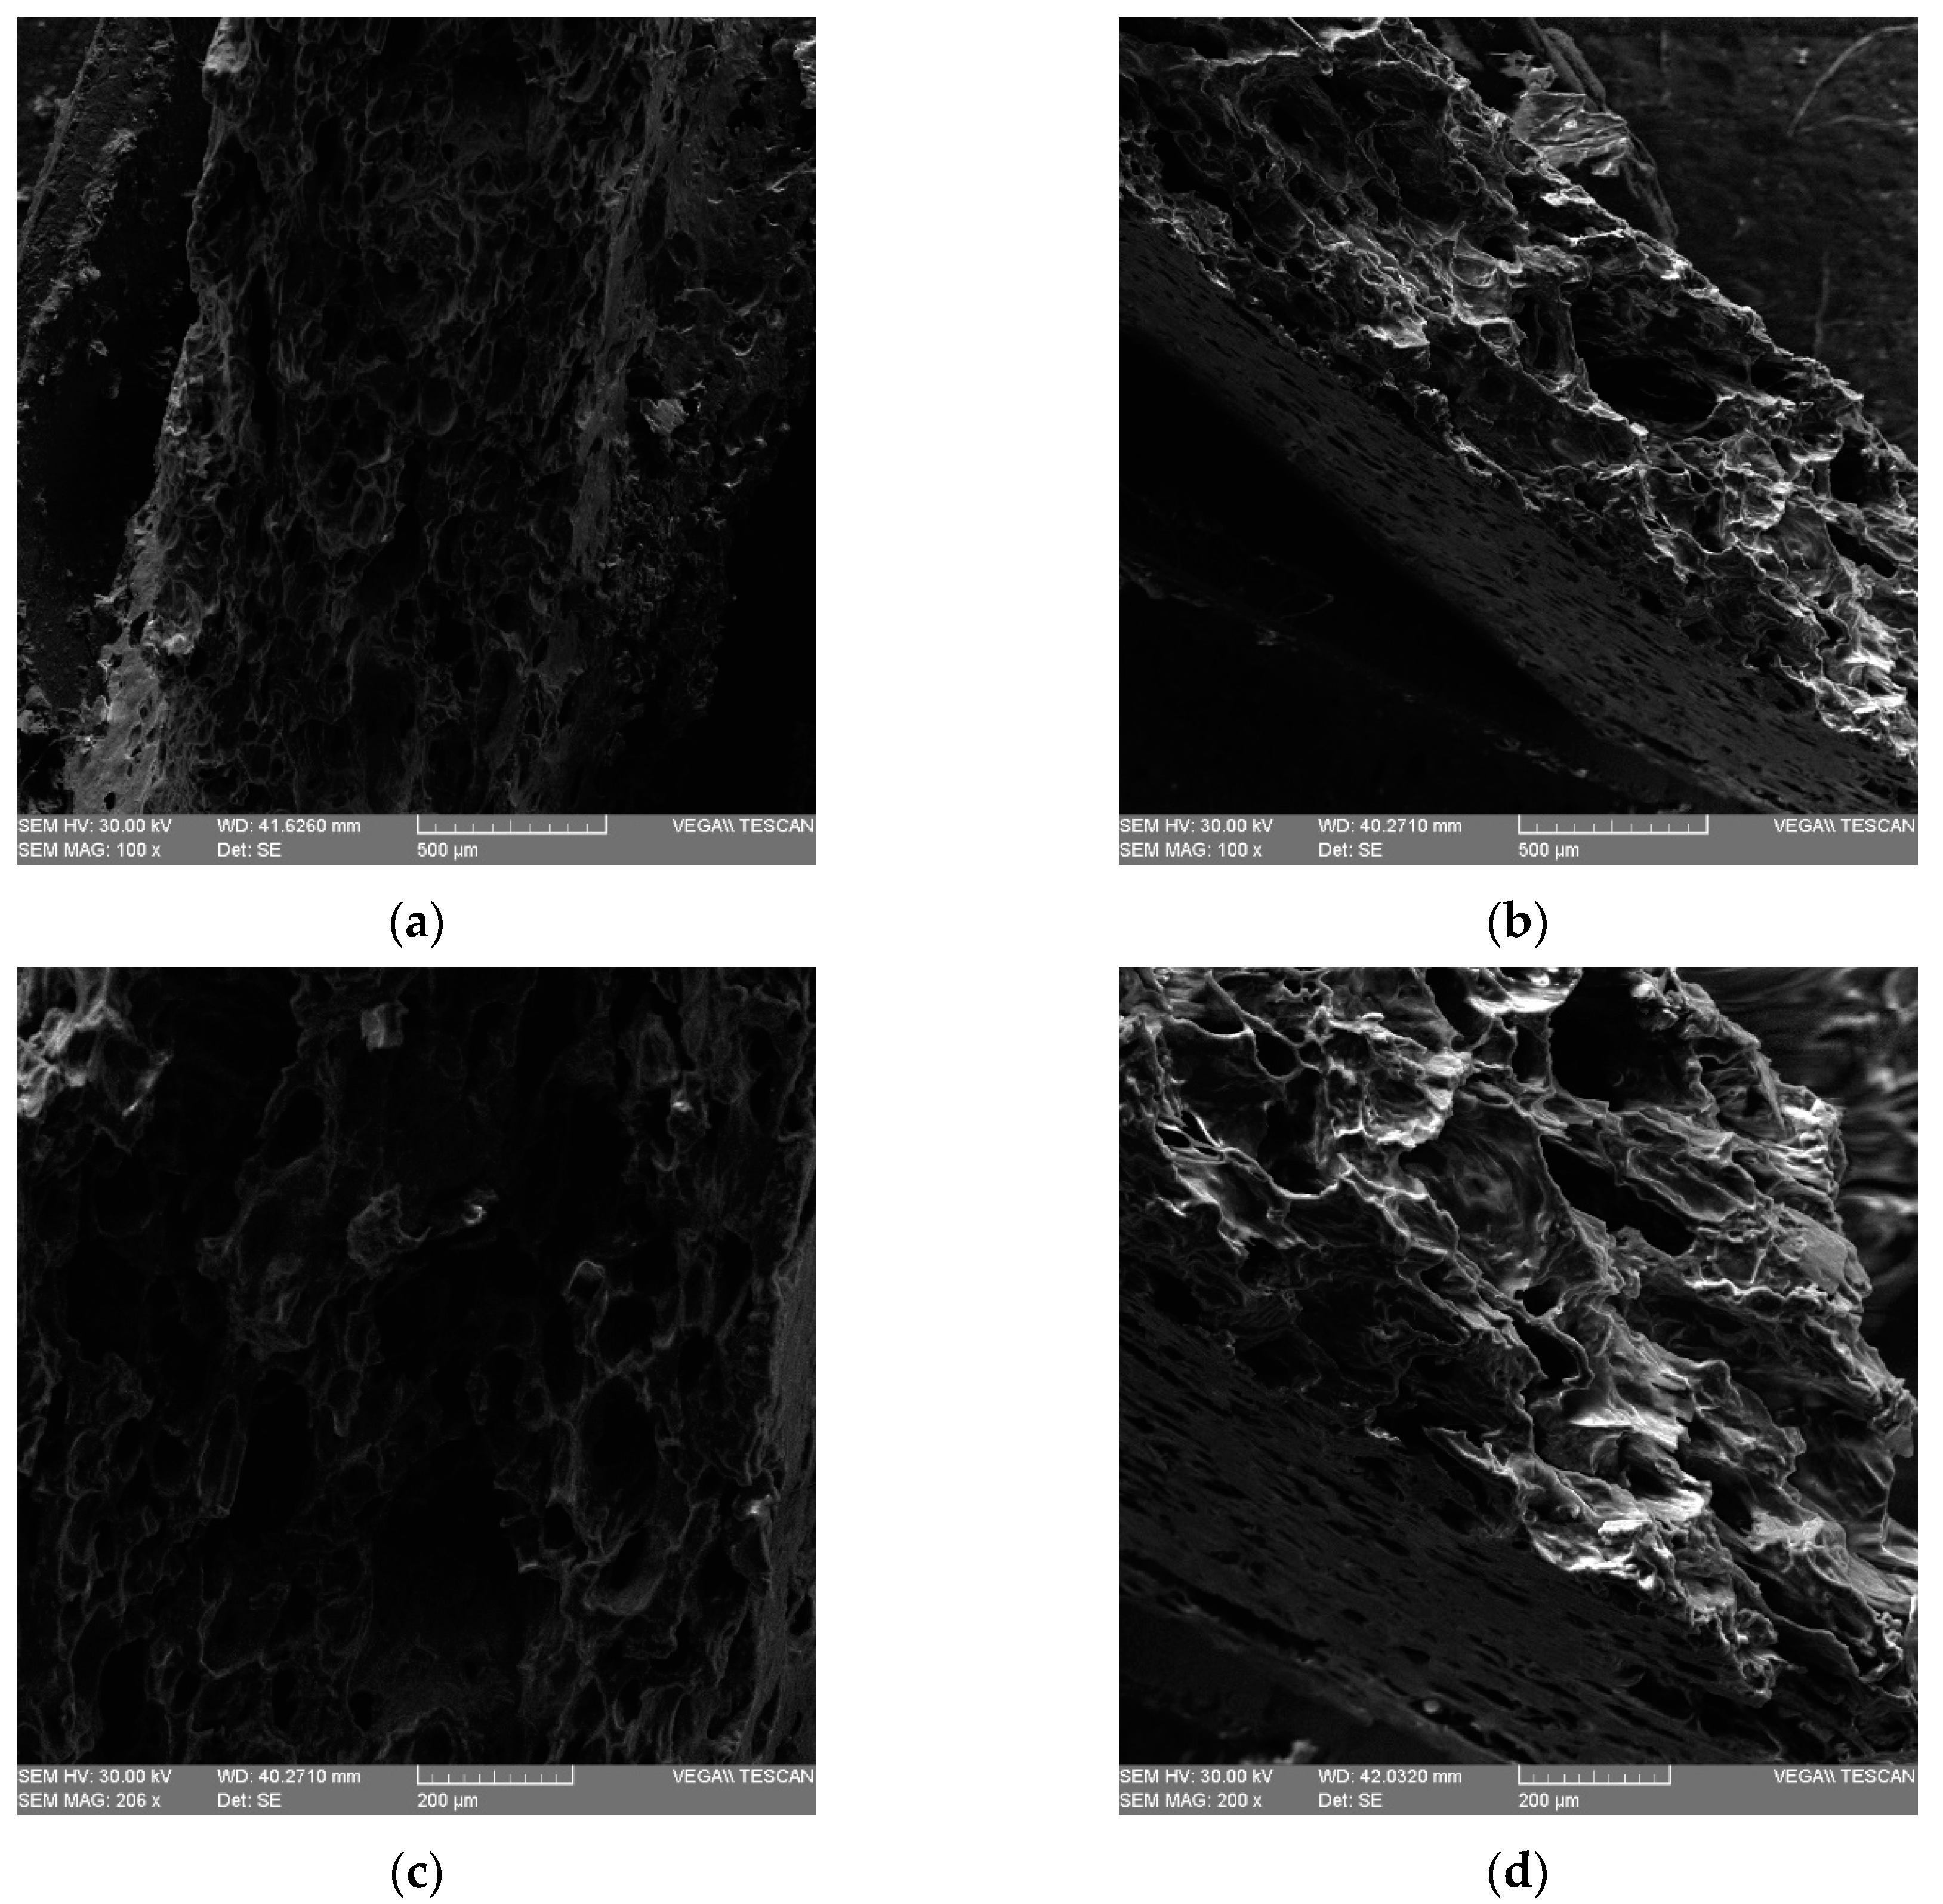
The wafer sheet was examined with a scanning electron microscope (SEM) to determine the dimensions of the wafer as well as to characterize the internal microstructure, as can be seen in Figure 2.
The samples were carefully placed inside the SEM so that the cross-section of the sample was directed towards the microscope lens. The characterization of the internal microstructure of the wafers was made using a scanning electron microscope, a suitable choice for imaging studies in that the samples are easy to use, do not require prior sample preparation, and the data acquisition is fast. The microstructure of the wafers is represented by a compact aggregate, giving it a fragile appearance. The presence of a considerable number of air bubbles and surface pores thatpenetrate the matrix is the main textural trait of tenderness and crispness. The microstructure is important because this method can understand why the viscosity and aeration of the batter are important for the quality and resistance of the wafers [39]. SEMs are also an attractive choice for imaging studies because they have an easy-to-use interface, are easy to operate, and require minimal sample preparation. The microstructure of baked wafers is usually associated with the cross-sections of the entire wafer that have dense skin and porous regions of the core, in accordance with Ekramian et al., 2021 [3], and Butt, 2017 [2]. A heterogeneous distribution of pores was observed on the cross section of the samples, with larger pores in the center of the wafer samples, in accordance with the study conducted by Butt, 2017 [2], and Mohammed et al., 2011 [29].
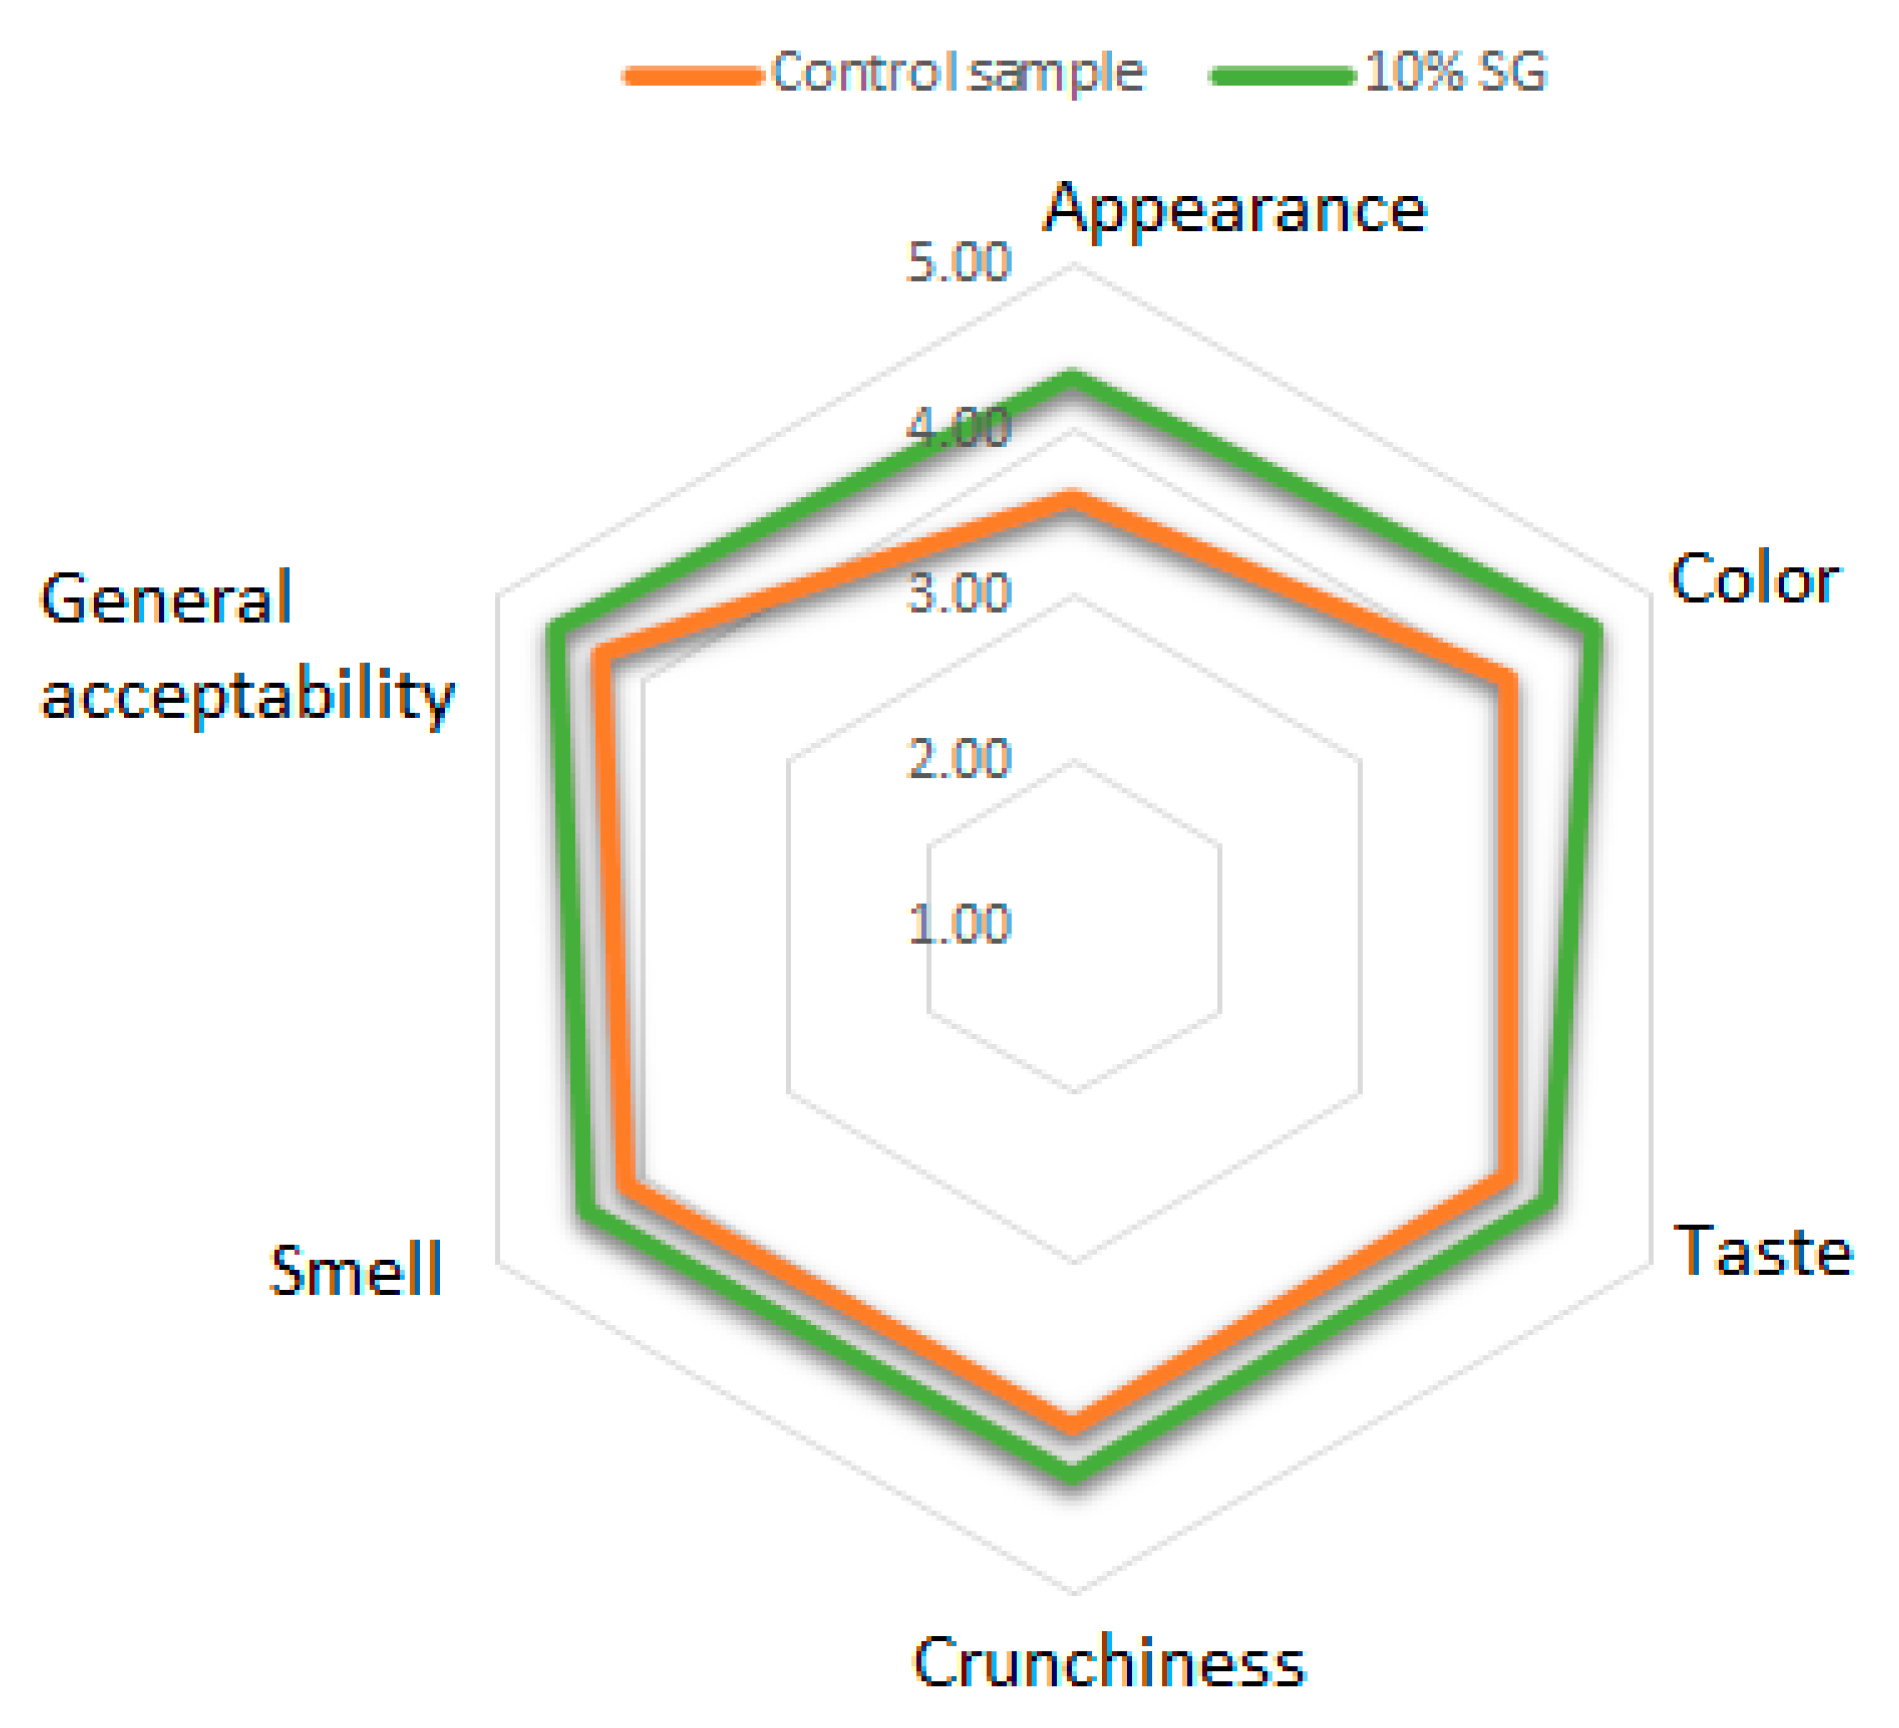
Sensory evaluation, from a statistical perspective, is a scientific method in which experimental results are collected on a set of consumers expressing preferences and reactions to the characteristics of food [2]. The sensory properties of the wafers are shown in Figure 3. The general acceptability showed acceptable values with scores higher than four throughout the analyzed range, indicating that the wafers were pleasant to some extent [35]. The spent grain wafers sample obtained a higher score than the control sample for each of the properties analyzed. The appearance of a food is an important attribute that influences the consumer’s perception of a particular product [26]. The biggest difference between the averages of the spent grain wafers sample compared to the control sample was recorded for appearance, and the closest scores were recorded for taste, crunchiness, and smell, which means that the addition of spent grain did not alter these properties, but on the contrary, enriched them. Sensory analysis is useful to see whether or not consumers can detect differences between products or changes in the product’s recipe [2]. The acceptability index was higher for spent grain wafers (92%) compared to the control sample (86%).
The principal component analysis (PCA) has been used to highlight similarities or differences between specified characteristics (Figure 4). The loads of the characteristics studied on the first main component, FC1 (70.58%), and the second main component, FC2 (15.22%), described 85.80% of the total variance. The moisture and water holding capacity has a small contribution to the variation of the data, as suggested by their position on the graph, close to the center. In contrast, the proximity of some individual parameters, for example for proteins, firmness, overall acceptability, lipids, color, chewiness, fibers, and total polyphenols content, confirm a close pair correlation, as well as the association between fracturability, adhesiveness, ash, and antioxidant activity (DPPH).
PC1 has been associated with fiber, carbohydrates, fracturability, chewiness, ash, lipids, overall acceptability, color, baking loss, adhesiveness, DPPH, cohesiveness, total polyphenols content, firmness, proteins, and springiness, while PC2 has been associated with water activity, OHC, and gumminess. It may be noted that a high opposition betweenwater holding capacity and moisture, oil holding capacity, and water activity.
4. Conclusions
The study verified that the addition of spent grain can be used to prepare wafers with good sensory and nutritional value, which provide a substantial amount of protein, fat, and dietary fiber. It has been concluded that spent grain wafers are the potential nutritional food that can increase demand and change the consumption pattern of food by-products. The product is economical and can be easily manufactured on a commercial scale compared to other snack products. The addition of spent grain had a positive impact on the formulation of wafers, increasing the protein and fiber content, and antioxidant capacity; wafer samples with the addition of spent grain also led to darker samples. Fracturability decreases with the addition of grain spent. The microstructure of samples with the addition of SG shows a heterogeneous distribution of pores on the cross section of the samples, with larger pores in the center of the wafer samples. The results of the sensory analysis reveal that the addition of spent grain in the wafers recipe leads to valuable value-added products with a high acceptability among consumers. Because of the recent global context, the application of sustainable, clean, and waste-free technologies is no longer just an innovative solution, but an imperative requirement. Therefore, it is very important to adopt a sustainable approach to the management of food by-products, which represent valuable resources from a nutritional and economic or environmental point of view, revealed in the implementation of the system solutions based on the fundamentals of a circular economy.
Author Contributions
Conceptualization, A.C. and A.D.; Methodology, A.C.; Formal Analysis, A.C. and A.D.; Investigation, A.C.; Resources, A.D.; Writing—Original Draft Preparation, A.C.; Writing—Review and Editing, A.C. and A.D. All authors have read and agreed to the published version of the manuscript.
Funding
This research received no external funding.
Institutional Review Board Statement
Not applicable.
Informed Consent Statement
Not applicable.
Data Availability Statement
The data presented in this study are available in this article.
Acknowledgments
We would like to thank Alexandrion Group Romania for providing the spent grain used in this work. The authors acknowledge financial support from Stefan cel Mare University of Suceava, Romania.
Conflicts of Interest
The authors declare no conflict of interest.
Sample Availability
Samples were available from Alexandrion Group Romania.
References
- Sruthi, V.; Waghray, K.; Narayan Rathod, A. Development of Wafers Incorporated with Pearl Millet Flour & Barnyard Millet Flour. Int. J. Res. Sci. Technol. 2018, 4, 962–969. [Google Scholar]
- Butt, S.S. Geometrical and Material Effects on Sensory Properties of Confectionery Wafers and Similar Extruded Products. Ph.D. Thesis, Mechanics of Materials Department of Mechanical Engineering Imperial College London, London, UK, 2016. [Google Scholar]
- Ekramian, H.; Saedi Asl, M.; Karimi, M.; Sheikholeslami, Z.; Pedram Nia, A. Comparison the effect of fruits extract with fungal protease on waffle quality. J. Food Sci. Technol. 2021, 58, 4766–4774. [Google Scholar] [CrossRef] [PubMed]
- Kigozi, J.; Kigozi, J.; Banadda, N.; Byaruhanga, Y.; Kaaya, A.; Lule, F. Sorghum Ice Cream Cone Texture; Correlations Between Instrumental and Sensory Analysis. J. Adv. Food Sci. Technol. 2016, 3, 134–145. [Google Scholar]
- Mahatre, R.; Thankamani, M.; Sonawane, S.K.; Bhushette, P. Comparative Study of Ice-Cream Cones Developed from Refined Wheat, Ragi, Buckwheat, Bajra, Amaranth, and Composite Flour. Meas. Food 2022, 6, 100033. [Google Scholar] [CrossRef]
- Leonard, W.; Zhang, P.; Ying, D.; Fang, Z. Application of extrusion technology in plant food processing byproducts: An overview. Compr. Rev. Food Sci. Food Saf. 2020, 19, 218–246. [Google Scholar] [CrossRef]
- Tiefenbacher Karl, F. Glossary of Terms in Wafers, Waffles and Adjuncts. In The Technology of Wafers and Waffles II; Elsevier: Cham, Switzerland, 2019; ISBN 9780128094372. [Google Scholar]
- Chetrariu, A.; Dabija, A. Pre-treatments used for the recovery of brewer’s spent grain—A minireview. J. Agroaliment. Process. Technol. 2020, 26, 304–312. [Google Scholar]
- Lech, M.; Labus, K. The methods of brewers’ spent grain treatment towards the recovery of valuable ingredients contained therein and comprehensive management of its residues. Chem. Eng. Res. Des. 2022, 183, 494–511. [Google Scholar] [CrossRef]
- Naibaho, J.; Butula, N.; Jonuzi, E.; Korzeniowska, M.; Laaksonen, O.; Föste, M.; Kütt, M.L.; Yang, B. Potential of brewers’ spent grain in yogurt fermentation and evaluation of its impact in rheological behaviour, consistency, microstructural properties and acidity profile during the refrigerated storage. Food Hydrocoll. 2022, 125, 107412. [Google Scholar] [CrossRef]
- Naibaho, J.; Korzeniowska, M. Brewers’ spent grain in food systems: Processing and final products quality as a function of fiber modification treatment. J. Food Sci. 2021, 86, 1532–1551. [Google Scholar] [CrossRef]
- Lu, L.; He, C.; Liu, B.; Wen, Q.; Xia, S. Incorporation of chickpea flour into biscuits improves the physicochemical properties and in vitro starch digestibility. LWT 2022, 159, 113222. [Google Scholar] [CrossRef]
- Khandagale, K.; Roylawar, P.; Randive, P.; Karuppaiah, V. Isolation and Expression Profiling of Insecticidal Lectins from Wild Alliums Against Onion Thrips (Thrips tabaci Lindeman). Proc. Natl. Acad. Sci. India Sect. B Biol. Sci. 2022, 92, 451–459. [Google Scholar] [CrossRef]
- Pareek, A.; Singh, N. Seeds as nutraceuticals, their therapeutic potential therapeutic potential and their role in improving sports performance. J. Phytol. Res. 2021, 34, 127–138. [Google Scholar]
- Chetrariu, A.; Dabija, A. Characterization of spent grain from a malt whisky. Adv. Biotechnol. SGEM Int. Multidiscip. Sci. GeoConf. 2021, 21, 33–40. [Google Scholar] [CrossRef]
- Oroian, M.; Codină, G.G.; Dabija, A. Quality Characteristics of Yogurt with Different Levels of Cranberries Powder Addition of Different Particle Sizes. J. Culin. Sci. Technol. 2022, 1–13. [Google Scholar] [CrossRef]
- Iuga, M.; Mironeasa, S. Application of heat moisture treatment in wheat pasta production. Food Control 2021, 128, 108176. [Google Scholar] [CrossRef]
- Huber, R.; Kalss, G.; Schoenlechner, R. Waffle Production: Influence of Baking Plate Material on Sticking of Waffles. J. Food Sci. 2017, 82, 61–68. [Google Scholar] [CrossRef]
- Huber, R.; Schoenlechner, R. Waffle production: Influence of batter ingredients on sticking of waffles at baking plates—Part II: Effect of fat, leavening agent, and water. Food Sci. Nutr. 2017, 5, 513–520. [Google Scholar] [CrossRef] [Green Version]
- Raza, K.; Nadeem, M.; Hussain, S.; Jabbar, S.; Din, A.; Qureshi, T.M.; Ainee, A. Development and Physico-Chemical Characterization of Date Wafers. J. Agric. Res. 2016, 54, 368–1157. [Google Scholar]
- Escarnot, E.; Agneessens, R.; Wathelet, B.; Paquot, M. Quantitative and qualitative study of spelt and wheat fibres in varying milling fractions. Food Chem. 2010, 122, 857–863. [Google Scholar] [CrossRef]
- Kigozi, J.; Kigozi, J.; Banadda, N.; Byaruhanga, Y.; Kaaya, A.; Lule, F. Mathematical Modeling of Sorghum Ice-Cream Cone Texture Characteristics Using the Cone Formulation. J. Adv. Food Sci. Technol. 2015, 2, 71–80. [Google Scholar]
- Chetrariu, A.; Dabija, A. Quality Characteristics of Spelt Pasta Enriched with Spent Grain. Agronomy 2021, 11, 1824. [Google Scholar] [CrossRef]
- Dom, Z.M.; Atikah, N.; Zulkeple, M.; Basha, R.K. Sweet Potato Peel Flour Applications in The Textural Quality of Waffle Ice Cream Cone and Other Food Products. Adv. Agric. Food Res. J. 2020, 1, 1–12. [Google Scholar]
- Huber, R.; Schoenlechner, R. Waffle production: Influence of batter ingredients on sticking of fresh egg waffles at baking plates—Part I: Effect of starch and sugar components. Food Sci. Nutr. 2017, 5, 504–512. [Google Scholar] [CrossRef]
- Tiwari, M.; Barooah, M.S.; Bordoloi, P.L. Quality Characterization of Wafers Enriched with Fish Powder Developed from Small Bony Fish. J. Aquat. Food Prod. Technol. 2020, 29, 775–788. [Google Scholar] [CrossRef]
- Schmidt, C.; Geweke, I.; Struck, S.; Zahn, S.; Rohm, H. Blackcurrant pomace from juice processing as partial flour substitute in savoury crackers: Dough characteristics and product properties. Int. J. Food Sci. Technol. 2018, 53, 237–245. [Google Scholar] [CrossRef]
- Ikram, S.; Zhang, H.; Ahmed, M.S.; Wang, J. Ultrasonic pretreatment improved the antioxidant potential of enzymatic protein hydrolysates from highland barley brewer’s spent grain (BSG). J. Food Sci. 2020, 85, 1045–1059. [Google Scholar] [CrossRef]
- Mohammed, I.K.; Charalambides, M.N.; Williams, J.G.; Rasburn, J. Modelling deformation and fracture in confectionery wafers. Procedia Food Sci. 2011, 1, 499–504. [Google Scholar] [CrossRef] [Green Version]
- Hardacre, A.K.; Clark, S.M.; Riviere, S.; Monro, J.A.; Hawktns, A.J. Some textural, sensory and nutritional properties of expanded snack food wafers made from corn, lentil and other ingredients. J. Texture Stud. 2006, 37, 94–111. [Google Scholar] [CrossRef]
- Kigozi, J.; Banadda, N.; Byaruhanga, Y.; Kaaya, A.; Musoke, L. Optimization of Texture in Sorghum Ice Cream Cone Production Using Sensory Analysis. Open Food Sci. J. 2015, 8, 18–21. [Google Scholar] [CrossRef] [Green Version]
- Iuga, M. By-products ingredients in corn based pasta: Effects on the technological and quality characteristics. Sci. Bull. Ser. F Biotechnol. 2020, XXIV, 97–106. [Google Scholar]
- Tiefenbacher, K.F. Recipes for Wafer Disks and Crunchy Waffle Cookies. In The Technology of Wafers and Waffles II; Academic Press: Cambridge, MA, USA, 2019; pp. 73–80. [Google Scholar] [CrossRef]
- Martínez-Navarrete, N.; Moraga, G.; Talens, P.; Chiralt, A. Water sorption and the plasticization effect in wafers. Int. J. Food Sci. Technol. 2004, 39, 555–562. [Google Scholar] [CrossRef]
- Silva, C.D.S.; Greiner, R.; Queiroz, L.; Sophia, A.; Alves, B.; Almeida, L.; Leonardo, F.; de Almeida, T. Development of a gluten-free ice cream basket alternative using cowpea flour (Vigna unguiculata(L.) Walp), rice flour (Oryza sativa) and crude palm oil (Elaeisguineensis Jacq.). Int. J. Gastron. Food Sci. 2022, 28, 100431. [Google Scholar] [CrossRef]
- Chetrariu, A.; Dabija, A. Valorisation of Spent Grain from Malt Whisky in the Spelt Pasta Formulation: Modelling and Optimization Study. Appl. Sci. 2022, 12, 1441. [Google Scholar] [CrossRef]
- Goerlitz, C.D.; Harper, W.J.; Delwiche, J.F. Relationship of water activity to cone crispness as assessed by positional relative rating. J. Sens. Stud. 2007, 22, 687–694. [Google Scholar] [CrossRef]
- Sathe, S.K.; Deshpande, S.; Salunkhe, D.K. Functional properties of lupin seed (Lupinus mutabilis) proteins and protein concentrates. Food Sci. 1982, 47, 491–497. [Google Scholar] [CrossRef]
- Huang, V.T.; Luebbers, S.T.; Lindamood, J.B.; Hansen, P.M.T. Ice cream cone baking: 2. Textural characteristics of rolled sugar cones. Top. Catal. 1989, 3, 41–55. [Google Scholar] [CrossRef]
Figure 1.
Control sample (A) vs. spent grain sample (B).

Figure 2.
Wafer microstructure by scanning electron microscopy (SEM) of control sample and spent grain sample.(a) Control sample at magnification 100×; (b) Spent grain sample at magnification 100×; (c) Control sample at magnification 200×; (d) Spent grain sample at magnification 200×.
Figure 2.
Wafer microstructure by scanning electron microscopy (SEM) of control sample and spent grain sample.(a) Control sample at magnification 100×; (b) Spent grain sample at magnification 100×; (c) Control sample at magnification 200×; (d) Spent grain sample at magnification 200×.

Figure 3.
Sensory scores for spent grain wafers.

Figure 4.
Principal component analysis.


Table 1.
Wafers recipe.
| Ingredients | Control Sample Wafer (kg) | Spent Grain Wafer (kg) |
|---|---|---|
| Chickpea flour | 60 | 60 |
| Spent grain flour | - | 10 |
| Wild garlic paste | 20 | 20 |
| Golden flax seeds | 5 | 5 |
| Hemp seeds | 5 | 5 |
| Leaving agents | 1.5 | 1.5 |
| Salt | 2.5 | 2.5 |
Table 2.
Wafer batter textural parameters.
| Gumminess (g) | Chewiness (g) | Springiness (%) | Firmness (g) | Adhesiveness (g × s) | Cohesiveness (Adim.) | |
|---|---|---|---|---|---|---|
| Control sample | 94.46 ± 3.7 a | 90.20 ± 4.1 a | 0.9995 ± 0.0 a | 64.5 ± 1.5 a | −359.86 ± 7.0 b | 1.42 ± 0.0 a |
| Spent grain wafers | 717.85 ± 52.9 a | 725.27 ± 44.0 b | 1.00045 ± 0.0 a | 203.93 ± 24.9 b | −904.30 ± 33.8 a | 3.61 ± 0.7 b |
| p value | n.s. | <0.001 | n.s. | 0.001 | <0.001 | 0.006 |
Mean values with different letters in the same column are significantly different (p < 0.05), n.s.—not significant.
Table 3.
Proximate analysis of spent grain wafer.
| Determination | Control Sample(%) | Spent Grain Wafer Sample(%) | p Value |
|---|---|---|---|
| Proteins | 9.66 ± 0.35 a | 11.17 ± 0.21 a | 0.001 |
| Lipids | 16.03 ± 0.02 a | 17.69 ± 0.03 b | <0.001 |
| Fibers | 9.82 ± 0.03 a | 11.64 ± 0.04 b | <0.001 |
| Carbohydrates | 51.28 ± 0.06 b | 47.40 ± 0.05 a | 0.003 |
| Ash | 7.35 ± 0.01 b | 6.22 ± 0.01 a | <0.001 |
| Moisture | 5.86 ± 0.02 a | 5.88 ± 0.02 a | n.s. |
Mean values with different letters in the same column are significantly different (p < 0.05), n.s.—not significant.
Table 4.
Wafer colors.
| L | a* | b* | ∆L* | ∆E* | |
|---|---|---|---|---|---|
| Spent grain wafersample | 48.86 ± 0.08 | 2.10 ± 0.03 | 29.39 ± 0.05 | −45.3 ± 0.08 | 51.93 ± 0.04 |
| Control sample | 61.6 ± 0.21 | −6.27 ± 0.04 | 35.65 ± 0.21 | −32.57 ± 0.21 | 45.67 ± 0.01 |
Publisher’s Note: MDPI stays neutral with regard to jurisdictional claims in published maps and institutional affiliations. |
© 2022 by the authors. Licensee MDPI, Basel, Switzerland. This article is an open access article distributed under the terms and conditions of the Creative Commons Attribution (CC BY) license (https://creativecommons.org/licenses/by/4.0/).
Share and Cite
MDPI and ACS Style
Chetrariu, A.; Dabija, A. Study of the Utilization of Spent Grain from Malt Whisky on the Quality of Wafers. Appl. Sci. 2022, 12, 7163. https://0-doi-org.brum.beds.ac.uk/10.3390/app12147163
AMA Style
Chetrariu A, Dabija A. Study of the Utilization of Spent Grain from Malt Whisky on the Quality of Wafers. Applied Sciences. 2022; 12(14):7163. https://0-doi-org.brum.beds.ac.uk/10.3390/app12147163
Chicago/Turabian StyleChetrariu, Ancuța, and Adriana Dabija. 2022. "Study of the Utilization of Spent Grain from Malt Whisky on the Quality of Wafers" Applied Sciences 12, no. 14: 7163. https://0-doi-org.brum.beds.ac.uk/10.3390/app12147163
Note that from the first issue of 2016, this journal uses article numbers instead of page numbers. See further details here.