
Angle-Angle Diagrams in the Assessment of Locomotion in Persons with Multiple Sclerosis: A Preliminary Study

 ,
,  , ,
, ,
Abstract
:1. Introduction
2. Materials and Methods
2.1. Participants
2.2. Surface EMG
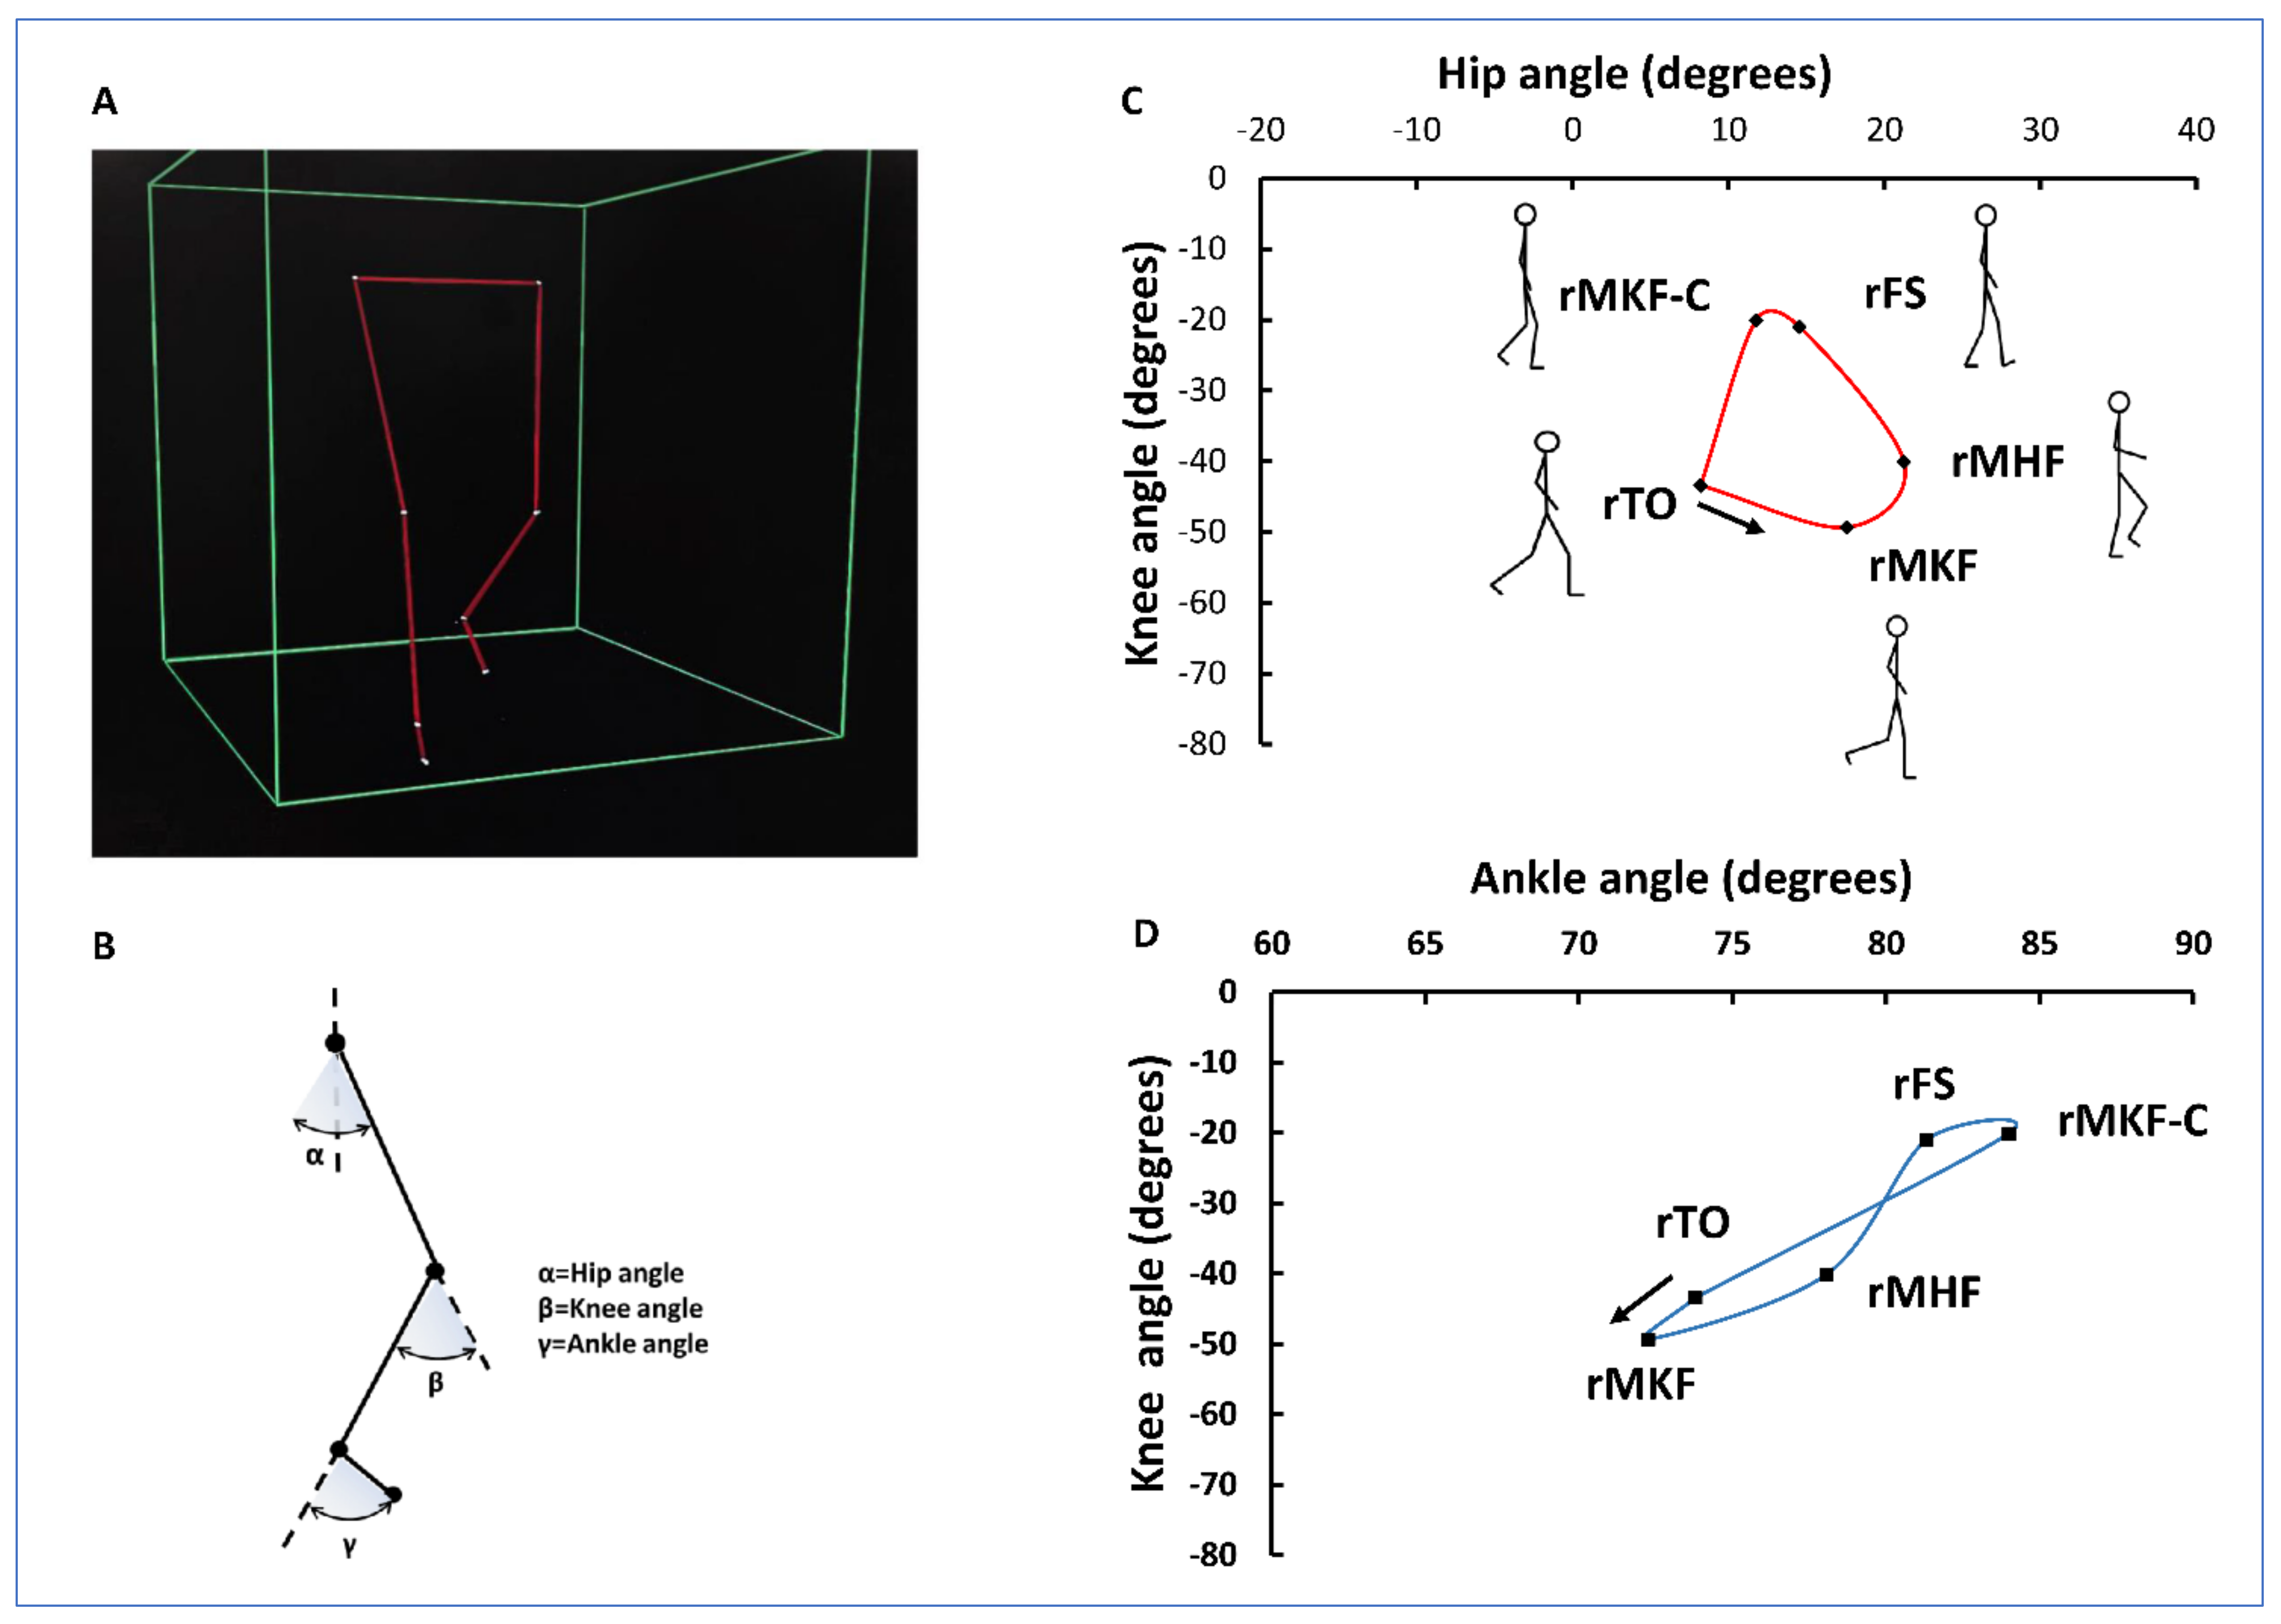
2.3. Gait Analysis
2.4. Statistical Analysis
3. Results
3.1. Reliability of the Measurements
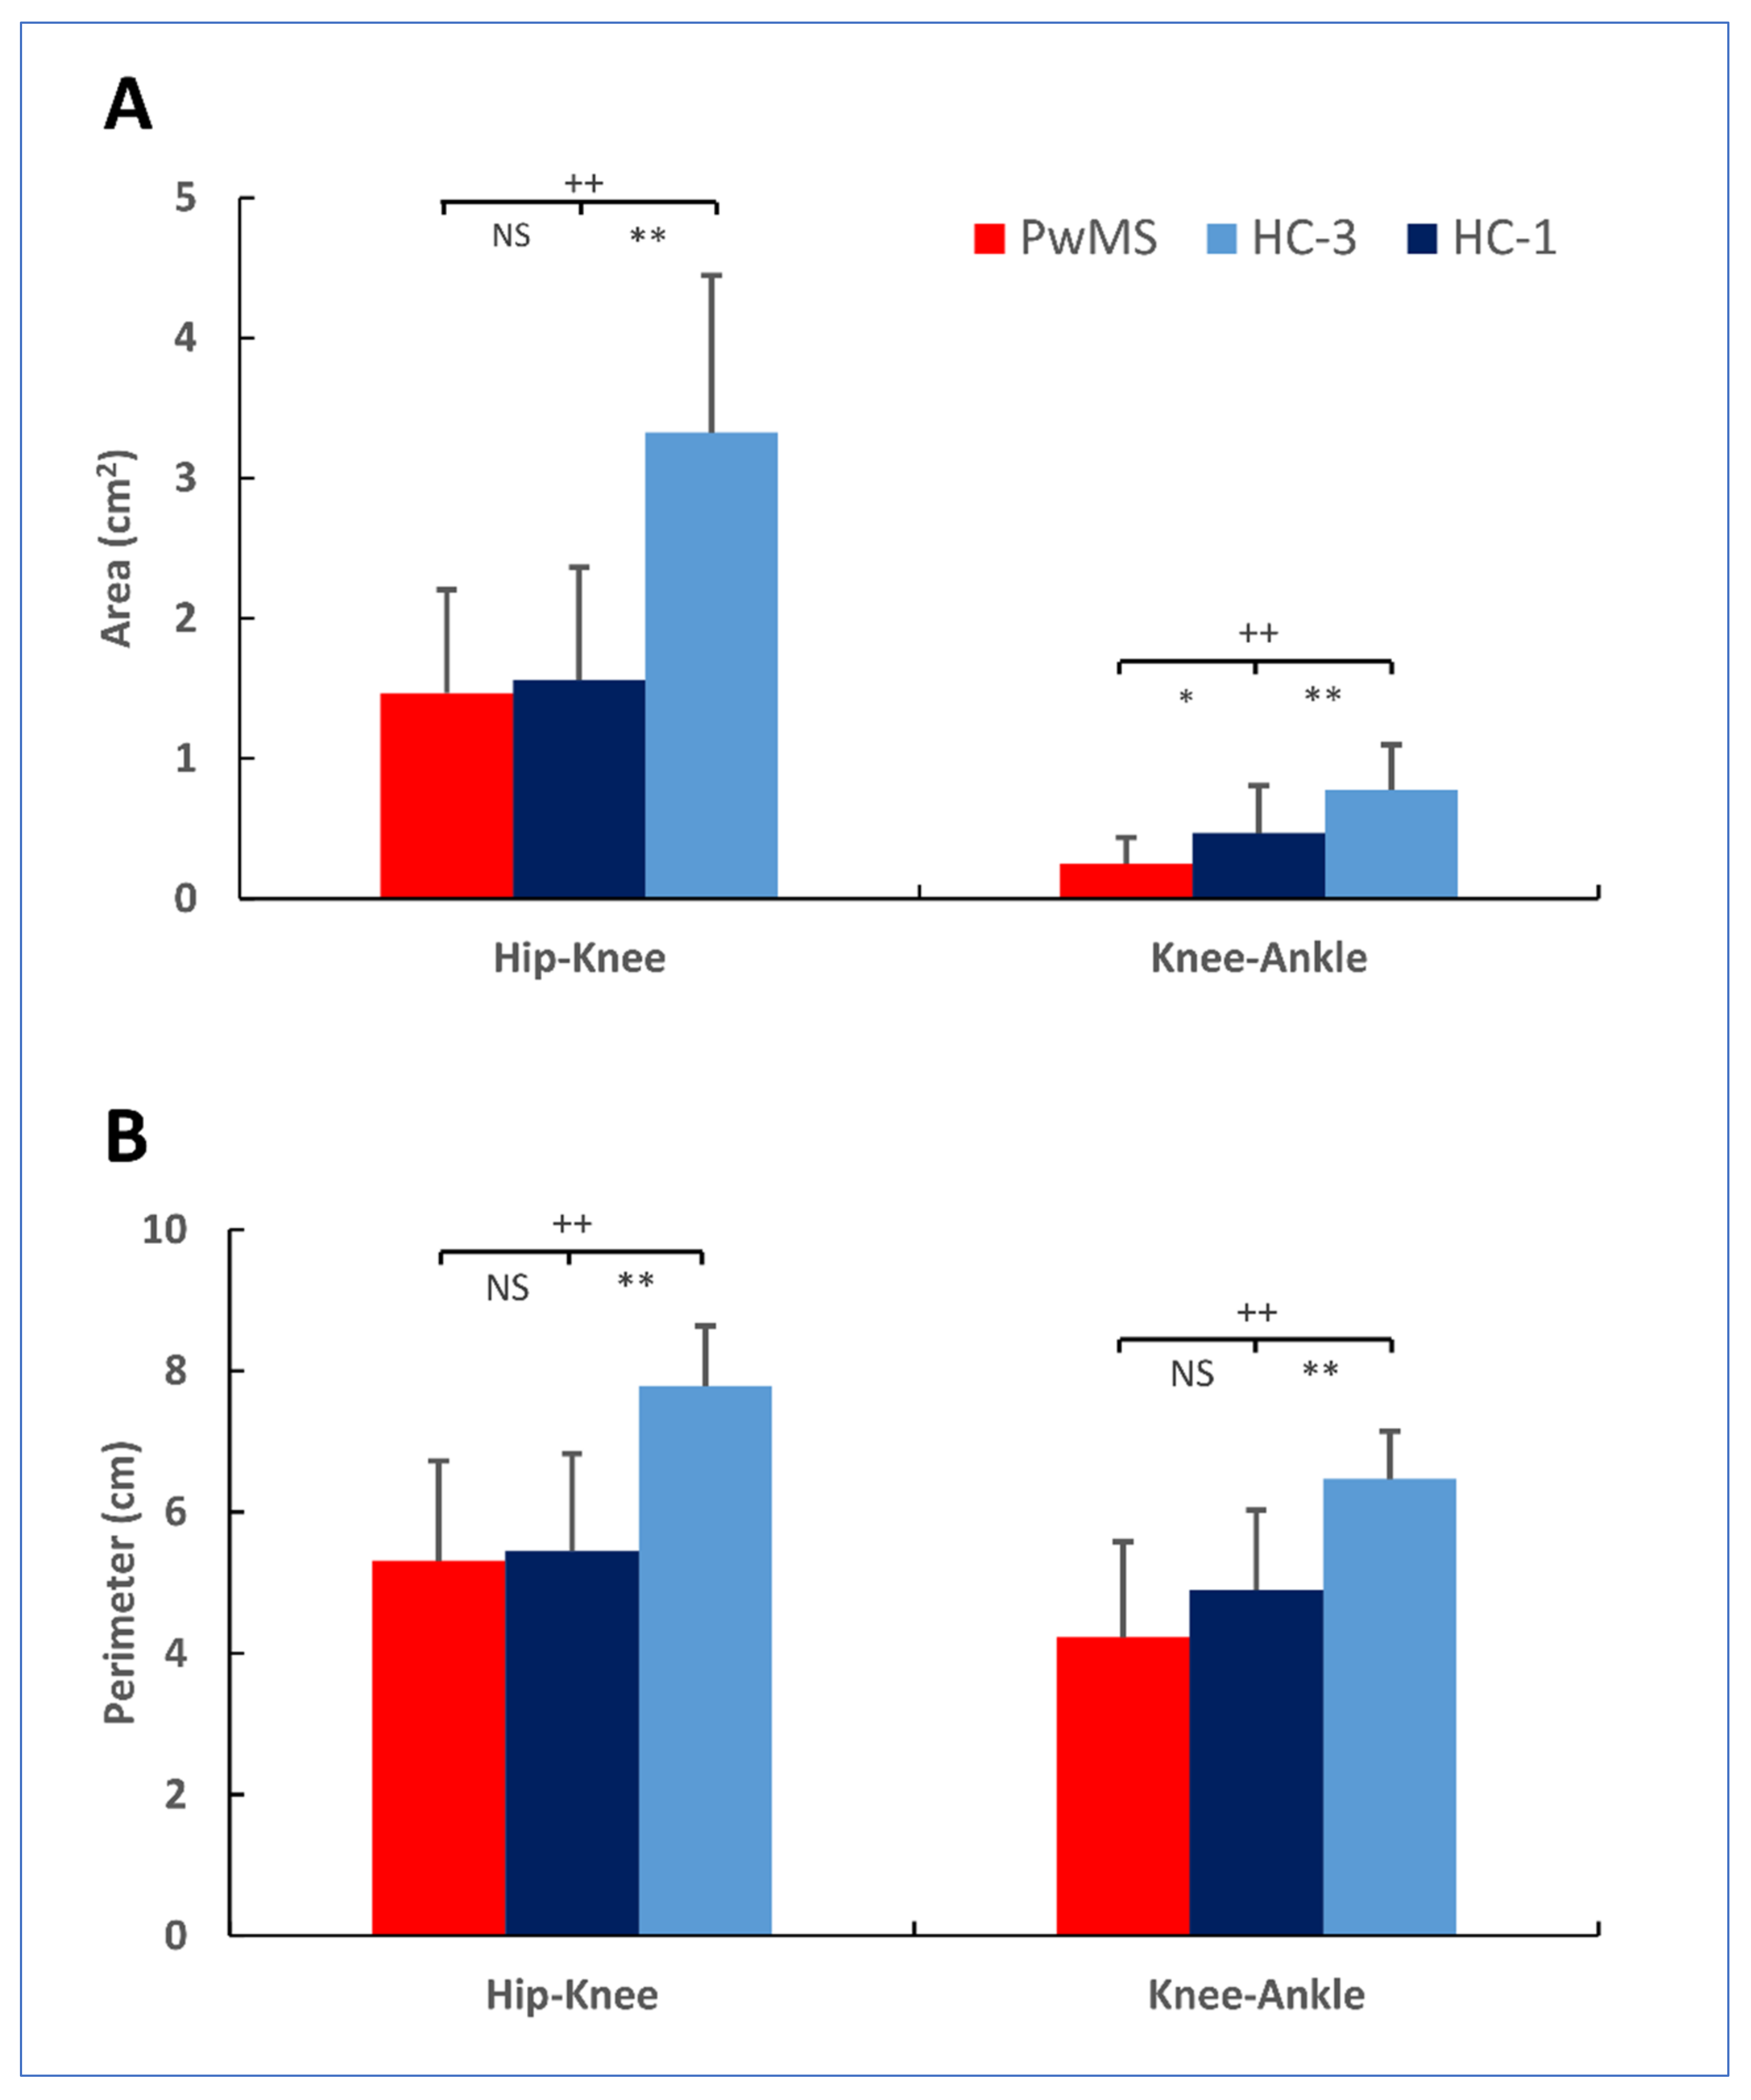
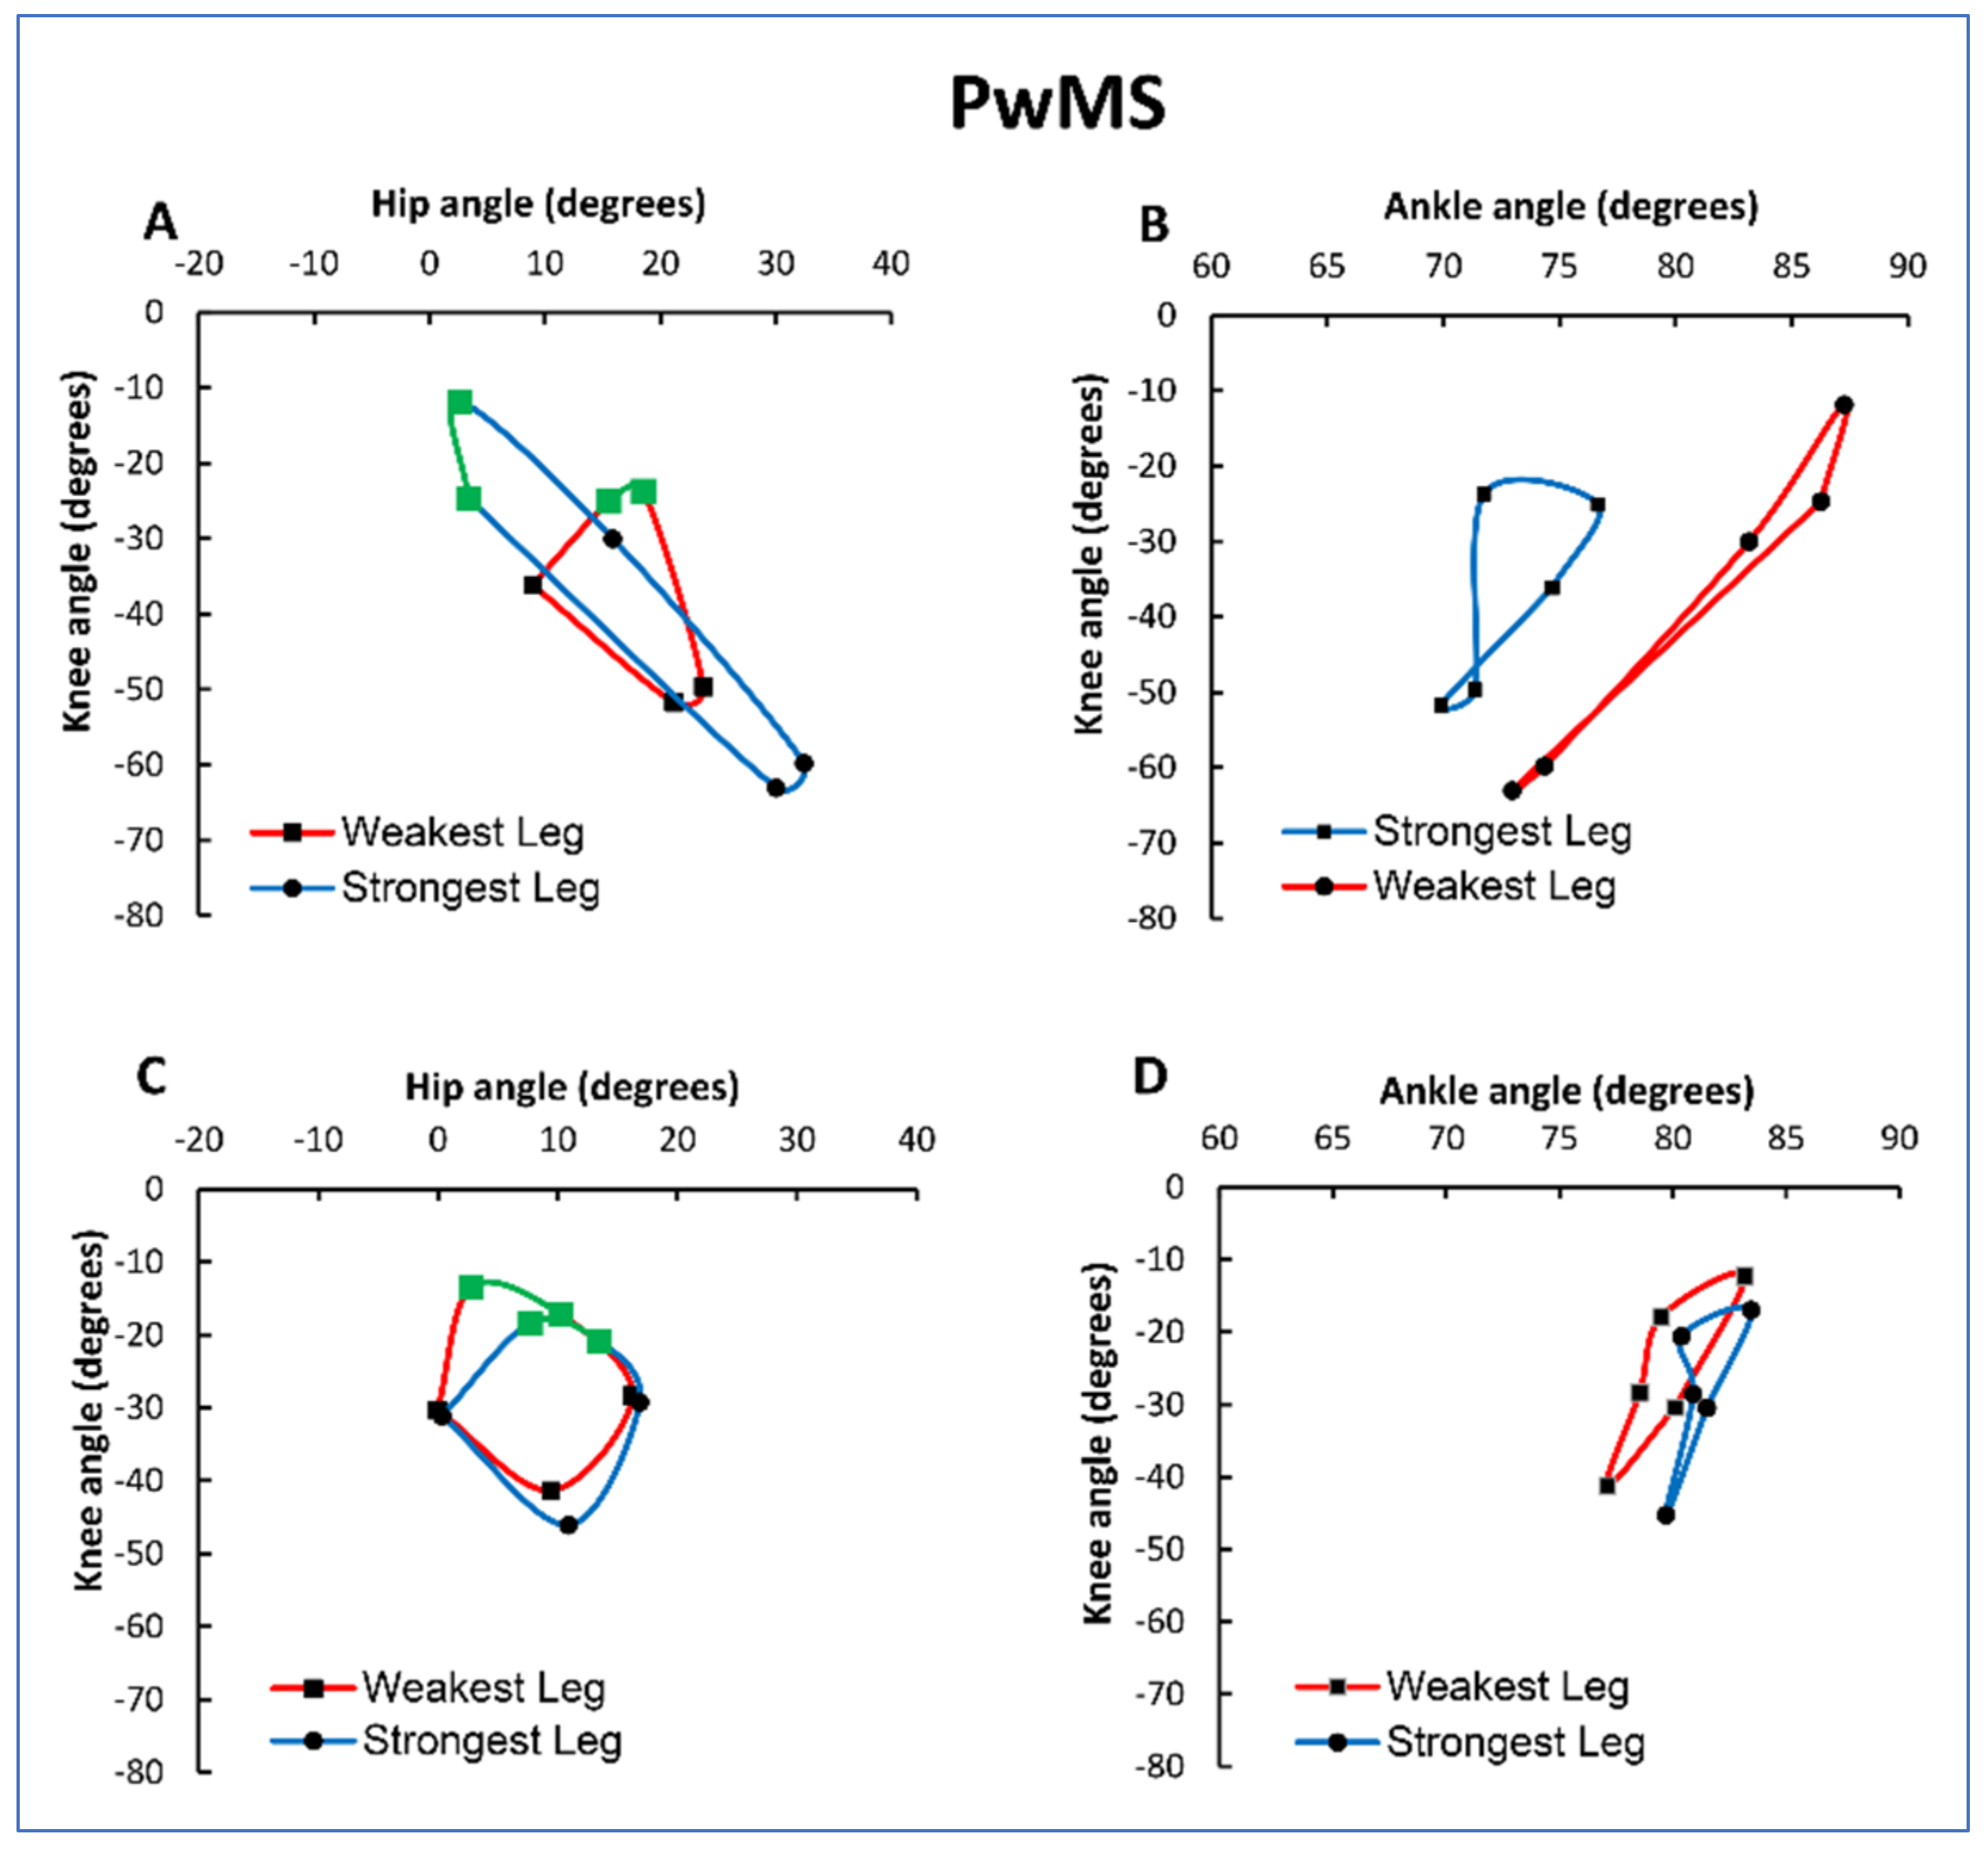
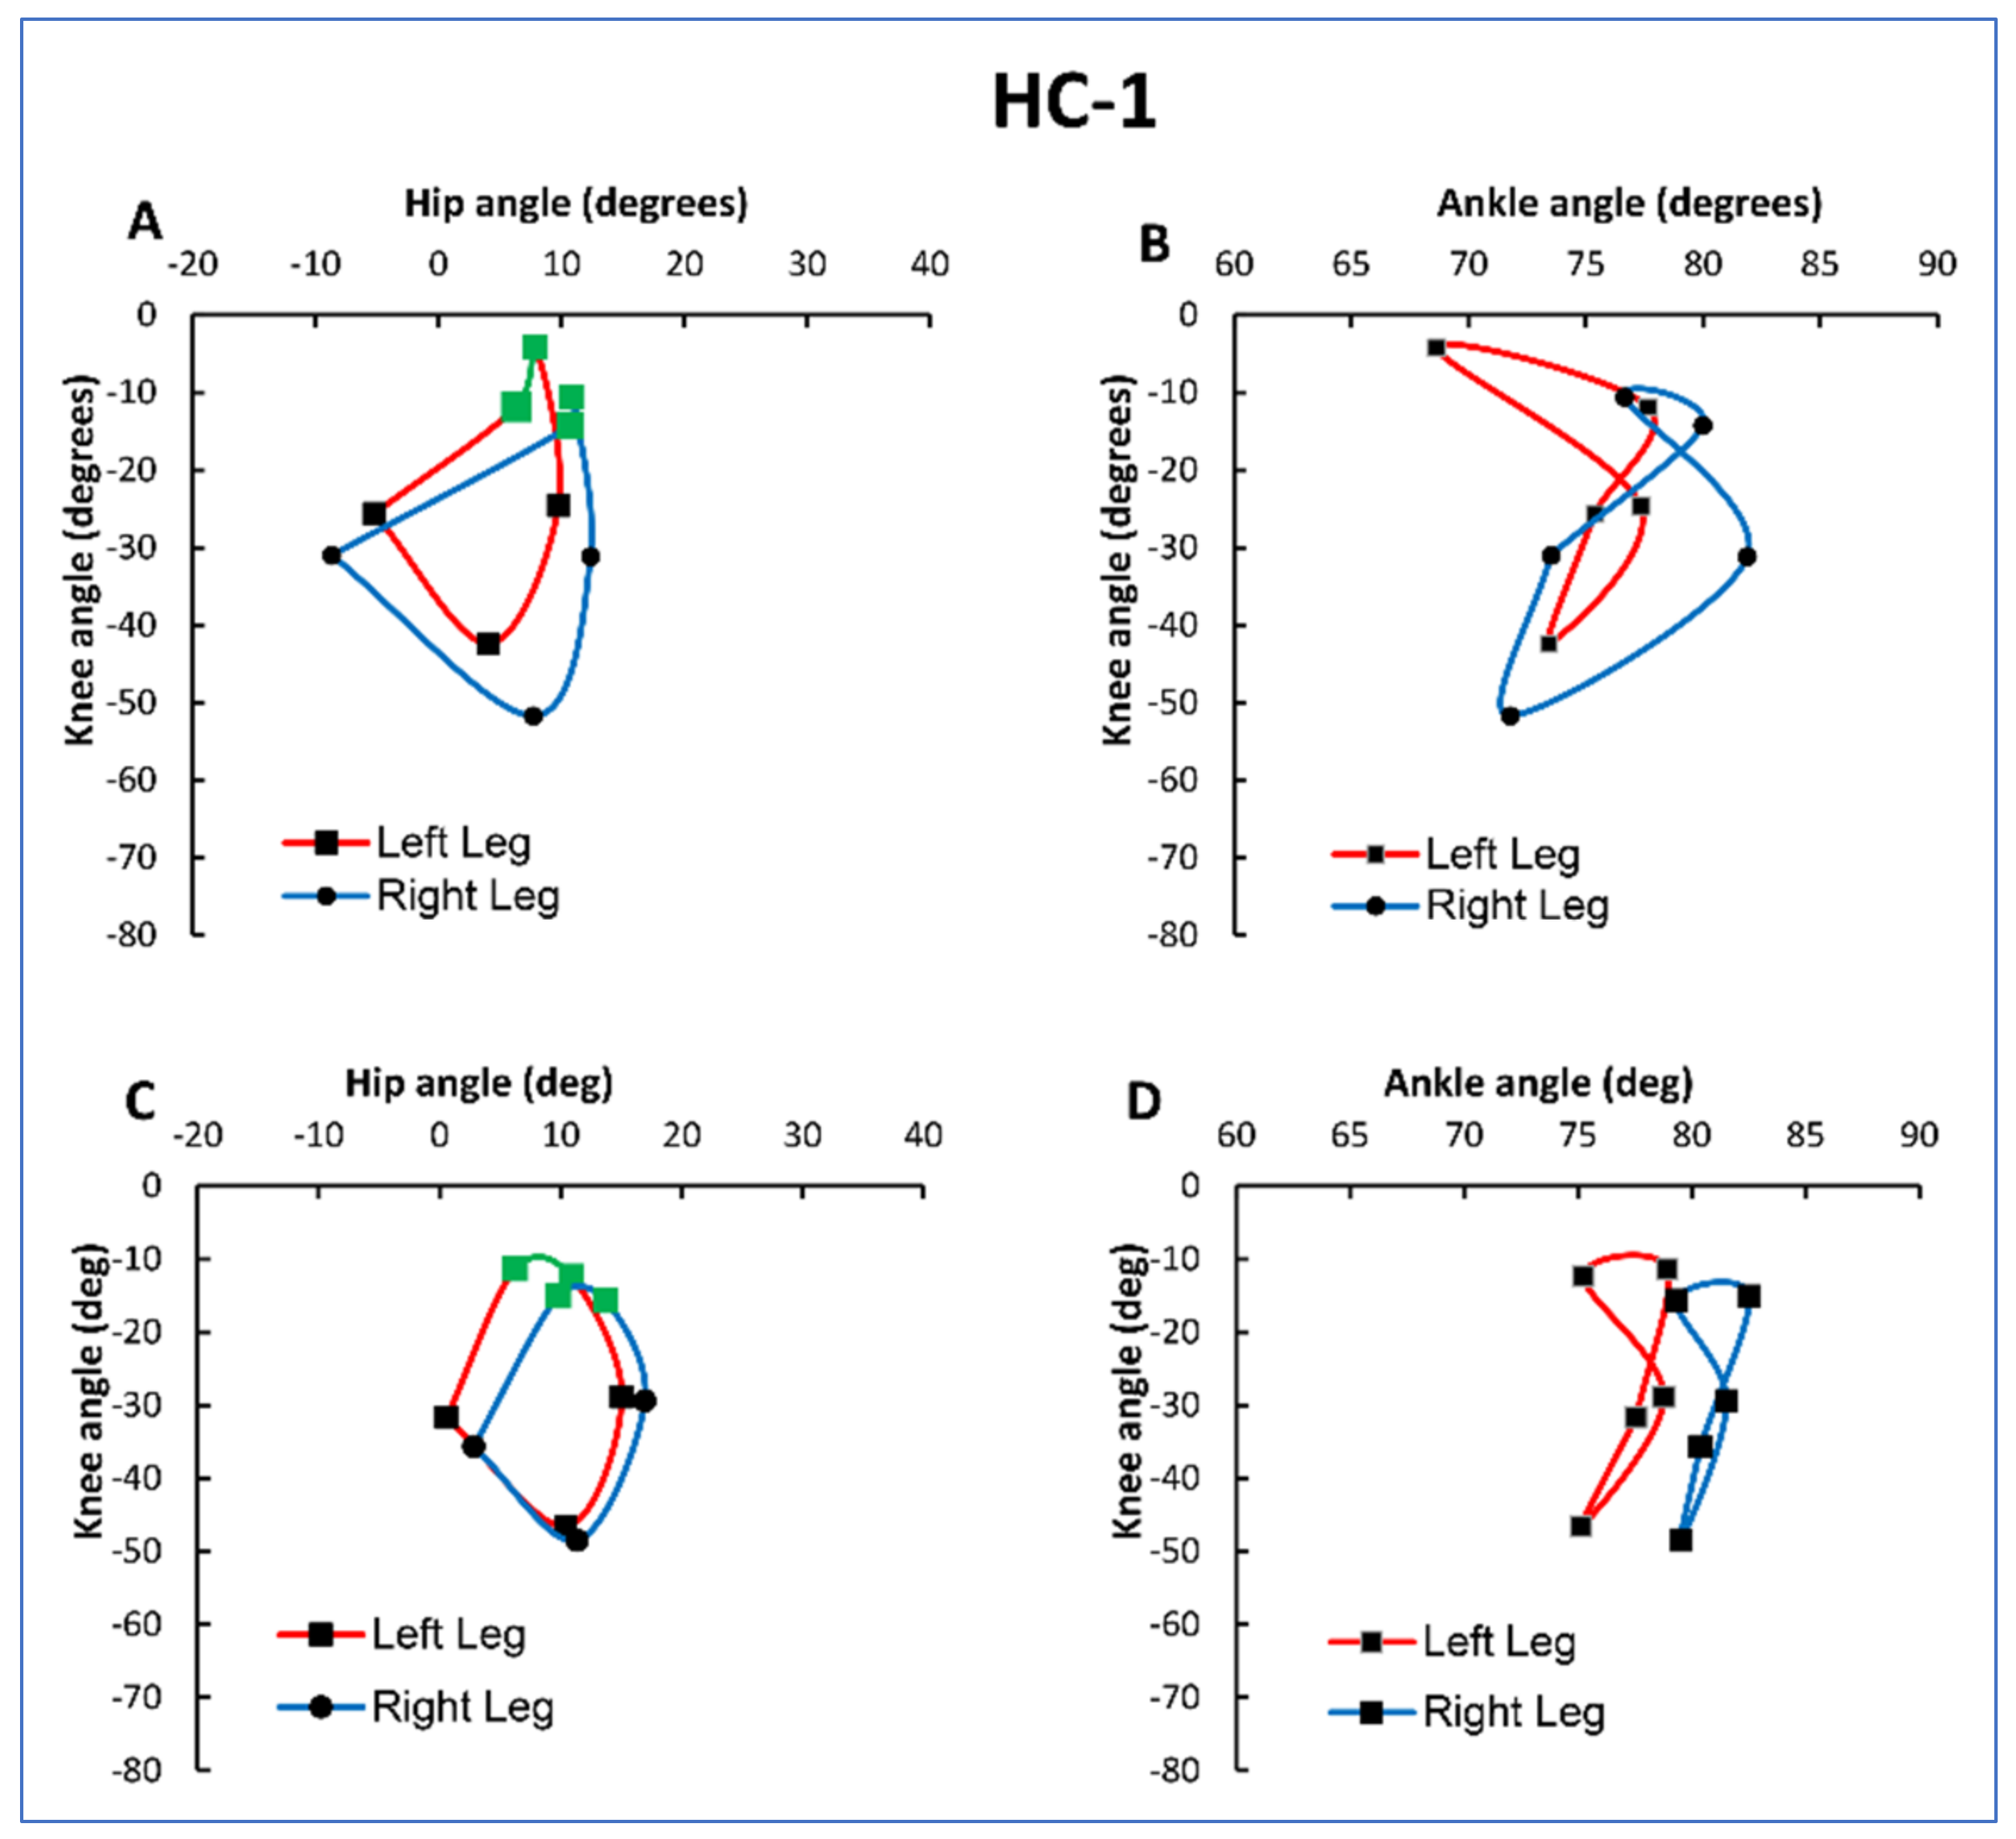
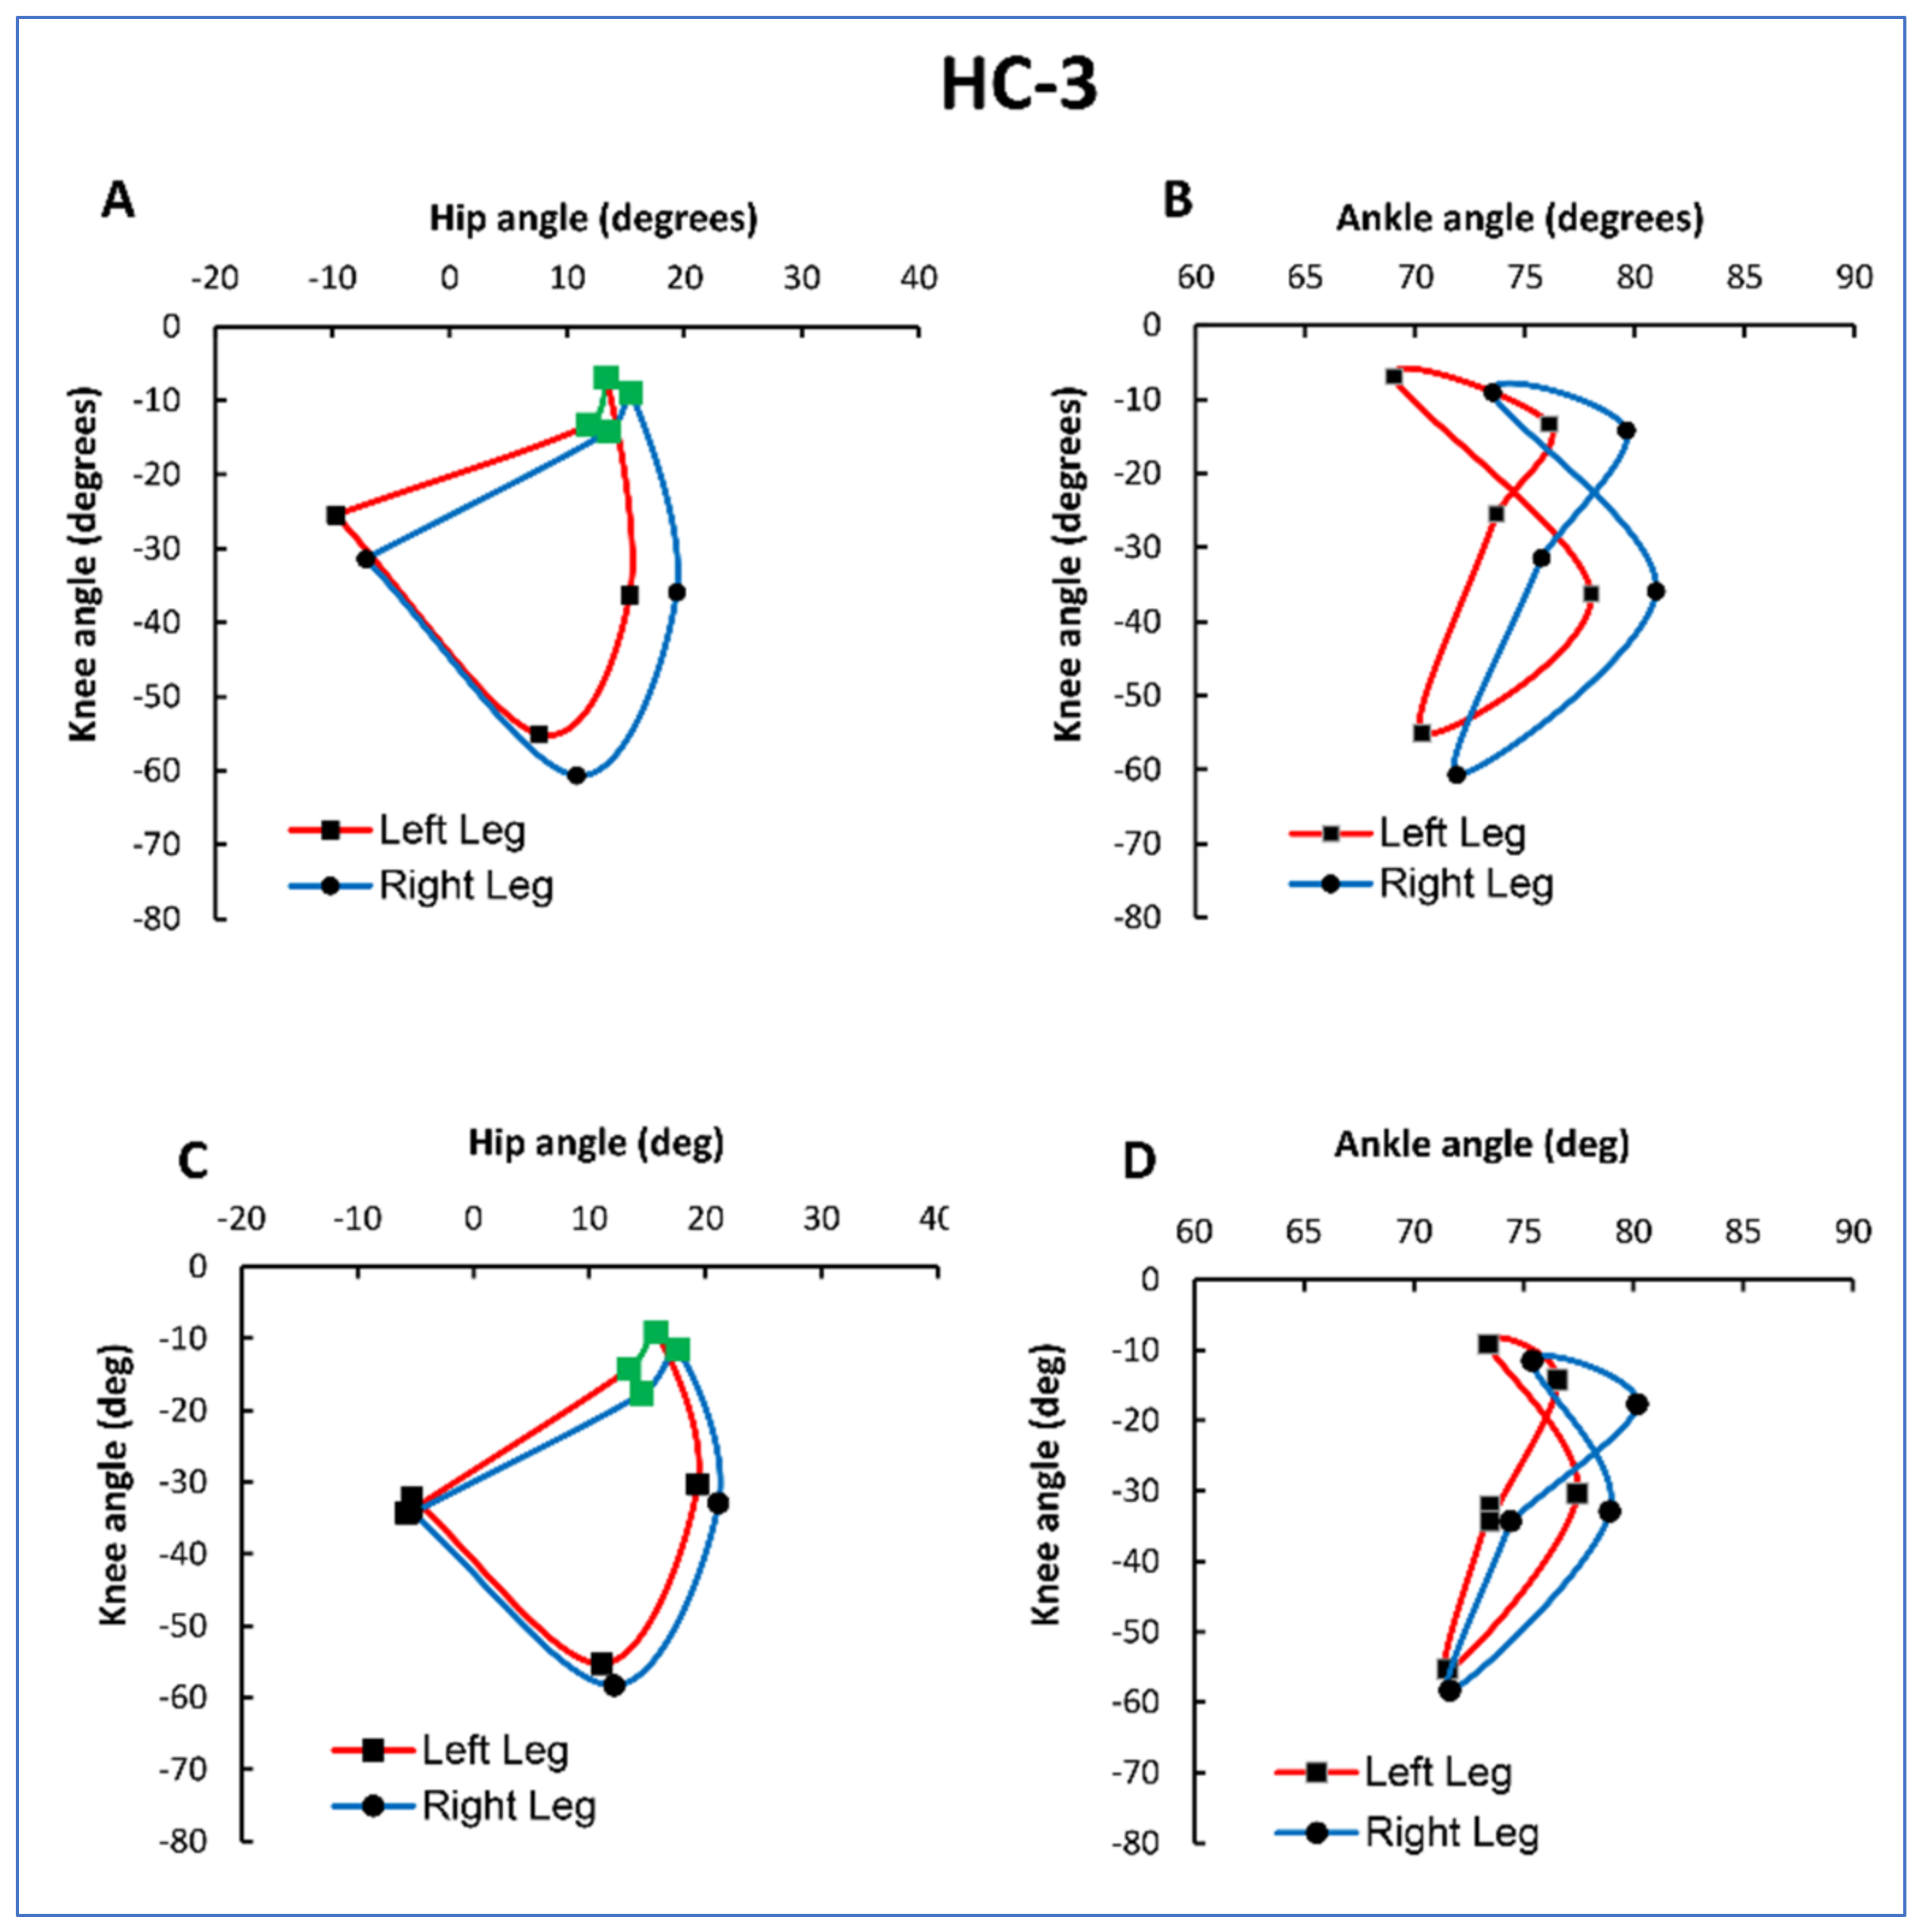
3.2. Angle-Angle Diagrams
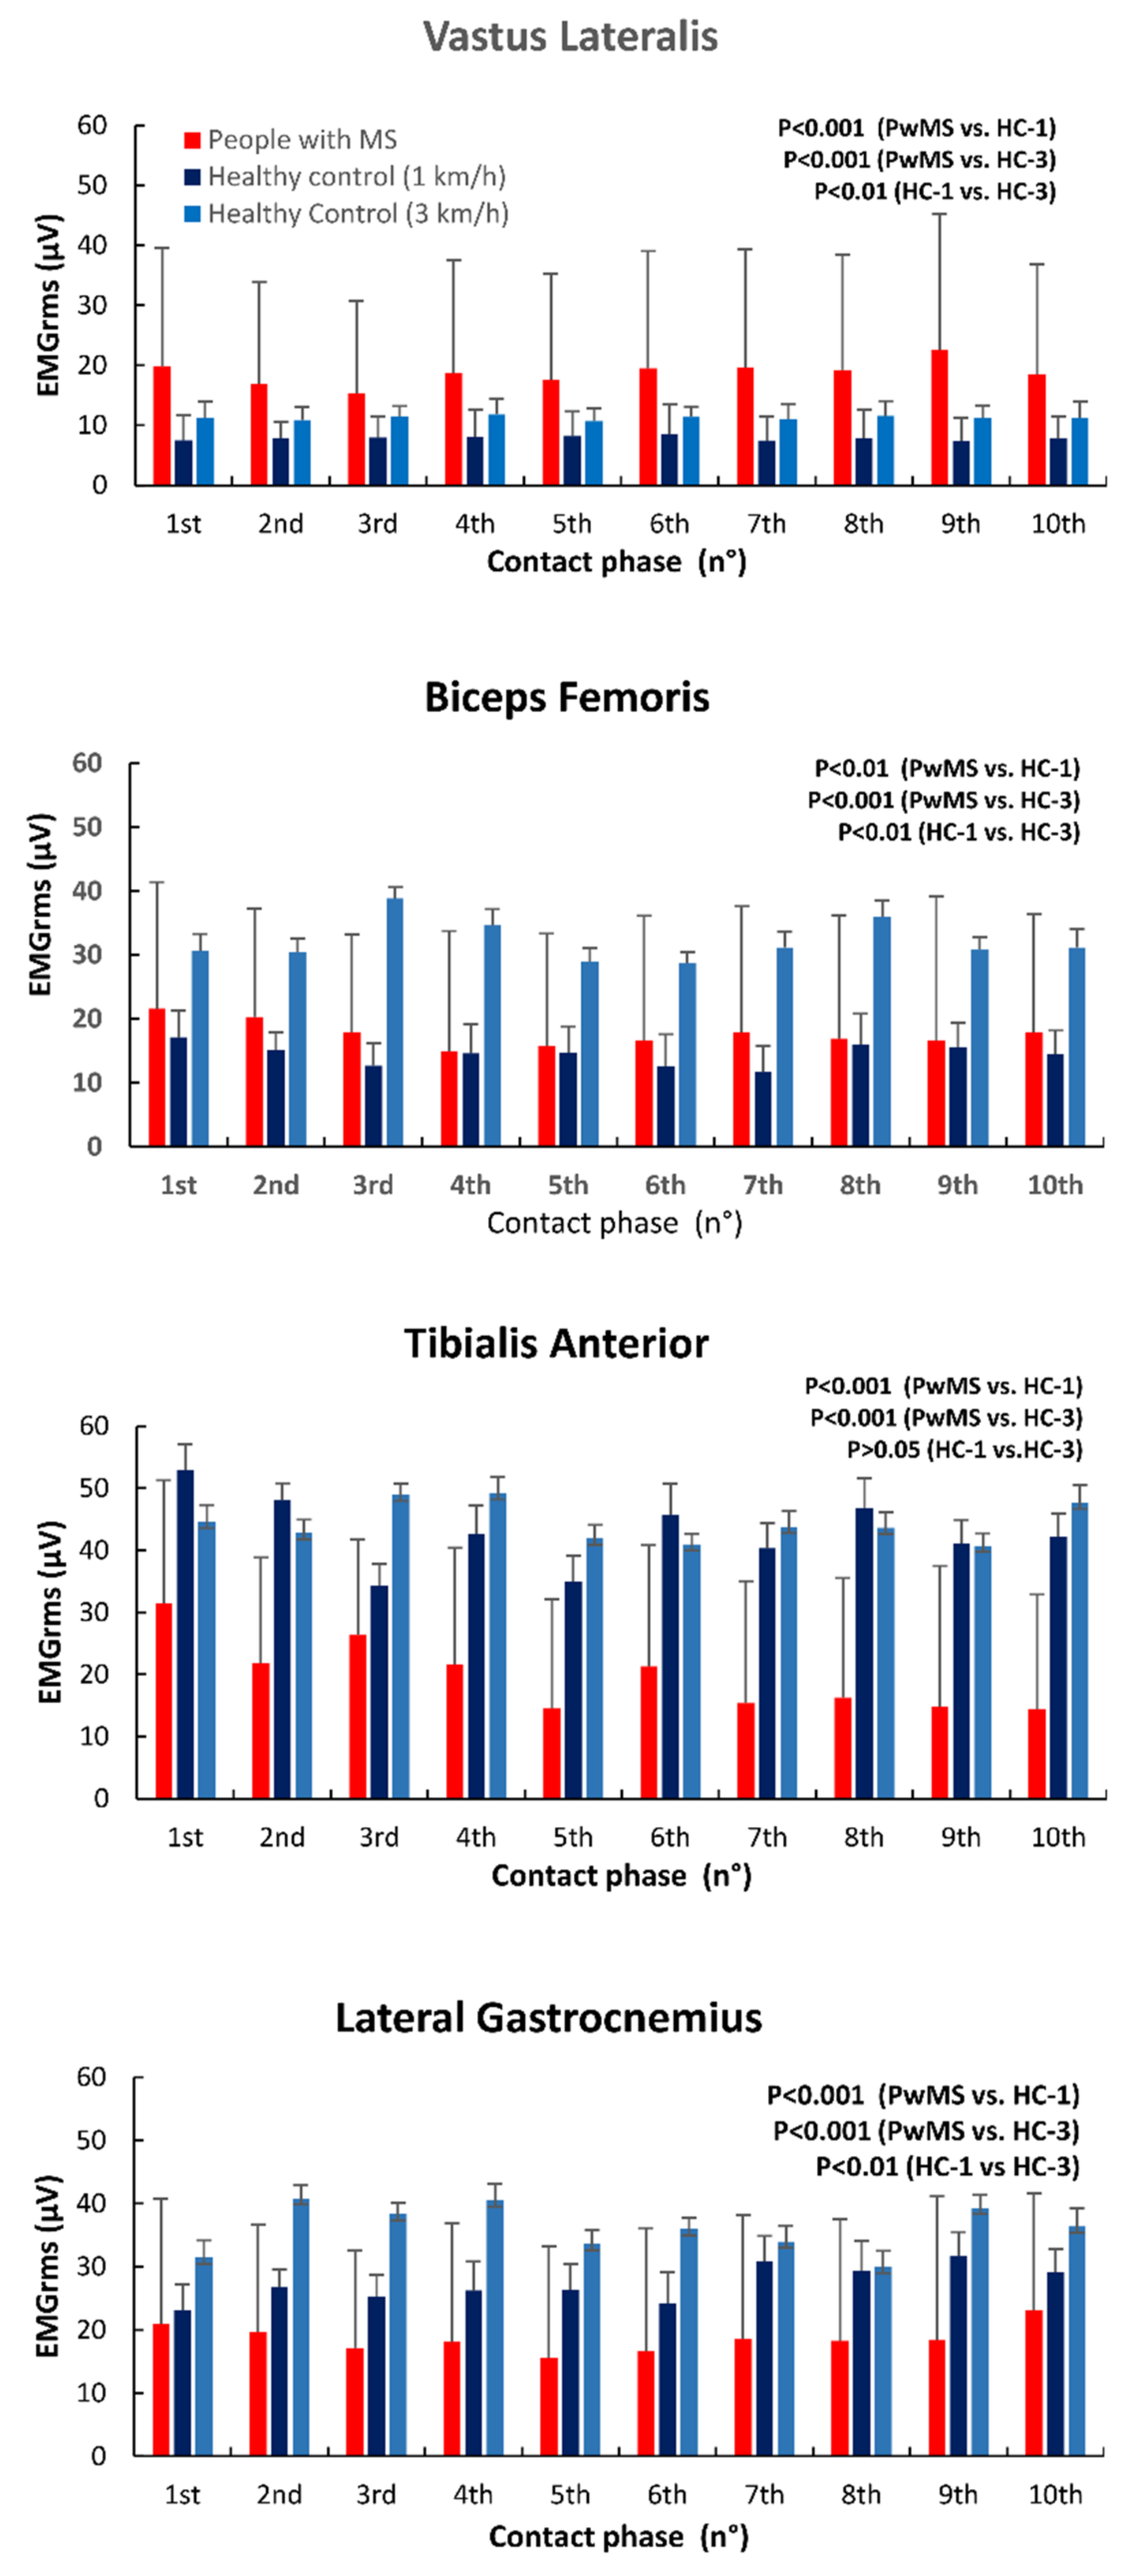
3.3. EMG Activity
4. Discussion
Author Contributions
Funding
Institutional Review Board Statement
Informed Consent Statement
Data Availability Statement
Acknowledgments
Conflicts of Interest
References
- Correale, J.; Gaitán, M.I.; Ysrraelit, M.C.; Fiol, M.P. Progressive Multiple Sclerosis: From Pathogenic Mechanisms to Treatment. Brain 2016, 140, 527–546. [Google Scholar] [CrossRef] [PubMed] [Green Version]
- Kamm, C.P.; Uitdehaag, B.M.; Polman, C.H. Multiple Sclerosis: Current Knowledge and Future Outlook. Eur. Neurol. 2014, 72, 132–141. [Google Scholar] [CrossRef] [PubMed]
- Reich, D.S.; Lucchinetti, C.F.; Calabresi, P.A. Multiple Sclerosis. N. Engl. J. Med. 2018, 378, 169–180. [Google Scholar] [CrossRef] [PubMed]
- Algahtani, H.; Shirah, B.; Alzahrani, F.; Abobaker, H.; Alghanaim, N.; Manlangit Jr, J. Quality of Life among Multiple Sclerosis Patients in Saudi Arabia. Neurosciences 2017, 22, 261–266. [Google Scholar] [CrossRef] [PubMed] [Green Version]
- Lavery, A.M.; Verhey, L.H.; Waldman, A.T. Outcome Measures in Relapsing-Remitting Multiple Sclerosis: Capturing Disability and Disease Progression in Clinical Trials. Mult. Scler. Int. 2014, 2014, 262350. [Google Scholar] [CrossRef] [PubMed]
- Comber, L.; Galvin, R.; Coote, S. Gait Deficits in People with Multiple Sclerosis: A Systematic Review and Meta-Analysis. Gait Posture 2017, 51, 25–35. [Google Scholar] [CrossRef] [PubMed]
- Severini, G.; Manca, M.; Ferraresi, G.; Caniatti, L.M.; Cosma, M.; Baldasso, F.; Straudi, S.; Morelli, M.; Basaglia, N. Evaluation of Clinical Gait Analysis Parameters in Patients Affected by Multiple Sclerosis: Analysis of Kinematics. Clin. Biomech. 2017, 45, 1–8. [Google Scholar] [CrossRef] [PubMed]
- Filli, L.; Sutter, T.; Easthope, C.S.; Killeen, T.; Meyer, C.; Reuter, K.; Lörincz, L.; Bolliger, M.; Weller, M.; Curt, A.; et al. Profiling Walking Dysfunction in Multiple Sclerosis: Characterisation, Classification and Progression over Time. Sci. Rep. 2018, 8, 4984. [Google Scholar] [CrossRef] [PubMed]
- Hershler, C.; Milner, M. Angle—Angle diagrams in the assessment of locomotion. Am. J. Phys. Med. Rehabil. 1980, 59, 109–125. [Google Scholar]
- Grieve, D.W. The Assessment of Gait. Physiotherapy 1969, 55, 452–460. [Google Scholar] [PubMed]
- Cofré Lizama, L.E.; Khan, F.; Lee, P.V.; Galea, M.P. The Use of Laboratory Gait Analysis for Understanding Gait Deterioration in People with Multiple Sclerosis. Mult. Scler. 2016, 22, 1768–1776. [Google Scholar] [CrossRef] [PubMed]
- Hermens, H.J.; Freriks, B.; Disselhorst-Klug, C.; Rau, G. Development of Recommendations for SEMG Sensors and Sensor Placement Procedures. J. Electromyogr. Kinesiol. 2000, 10, 361–374. [Google Scholar] [CrossRef]
- Motl, R.W.; Cohen, J.A.; Benedict, R.; Phillips, G.; LaRocca, N.; Hudson, L.D.; Rudick, R. Validity of the Timed 25-Foot Walk as an Ambulatory Performance Outcome Measure for Multiple Sclerosis. Mult. Scler. 2017, 23, 704–710. [Google Scholar] [CrossRef] [PubMed]
- Cavanagh, P.R. The Biomechanics of Lower Extremity Action in Distance Running. Foot Ankle 1987, 7, 197–217. [Google Scholar] [CrossRef] [PubMed]
- Zeni, J.A.; Richards, J.G.; Higginson, J.S. Two Simple Methods for Determining Gait Events during Treadmill and Overground Walking Using Kinematic Data. Gait Posture 2008, 27, 710–714. [Google Scholar] [CrossRef] [PubMed] [Green Version]
- Hopkins, W.G. Measures of Reliability in Sports Medicine and Science. Sports Med. 2000, 30, 1–15. [Google Scholar] [CrossRef] [PubMed] [Green Version]
- Sole, G.; Hamrén, J.; Milosavljevic, S.; Nicholson, H.; Sullivan, S.J. Test-Retest Reliability of Isokinetic Knee Extension and Flexion. Arch. Phys. Med. Rehabil. 2007, 88, 626–631. [Google Scholar] [CrossRef] [PubMed]
- Lencioni, T.; Jonsdottir, J.; Cattaneo, D.; Crippa, A.; Gervasoni, E.; Rovaris, M.; Bizzi, E.; Ferrarin, M. Are Modular Activations Altered in Lower Limb Muscles of Persons with Multiple Sclerosis during Walking? Evidence from Muscle Synergies and Biomechanical Analysis. Front. Hum. Neurosci. 2016, 10, 620. [Google Scholar] [CrossRef] [PubMed] [Green Version]
- Di Sapio, A.; Bertolotto, A.; Melillo, F.; Sperli, F.; Malucchi, S.; Troni, W. A New Neurophysiological Approach to Assess Central Motor Conduction Damage to Proximal and Distal Muscles of Lower Limbs. Clin. Neurophysiol. 2014, 125, 133–141. [Google Scholar] [CrossRef] [PubMed]
- Boudarham, J.; Hameau, S.; Zory, R.; Hardy, A.; Bensmail, D.; Roche, N. Coactivation of Lower Limb Muscles during Gait in Patients with Multiple Sclerosis. PLoS ONE 2016, 11, e0158267. [Google Scholar] [CrossRef] [PubMed]


| Muscle (EMGRMS) | PwMS ICC (LL–UL) | HC-1 ICC (LL–UL) | HC-3 ICC (LL–UL) |
|---|---|---|---|
| Weakest-Weakest Gait1-Gait2 | Dominant-Dominant Gait1-Gait2 | Dominant-Dominant Gait1-Gait2 | |
| VL | 0.94 (0.83–0.99) | 0.97 (0.97–1.00) | 0.95 (0.88–0.99) |
| BF | 0.94 (0.84–0.99) | 0.92 (0.80–0.99) | 0.91 (0.79–0.99) |
| TA | 0.76 (0.51–0.97) | 0.83 (0.62–0.98) | 0.75 (0.50–0.96) |
| LG | 0.95 (0.88–0.99) | 0.75 (0.50–0.96) | 0.75 (0.49–0.96) |
| Group | Angle | ICC (LL-UL) | ICC (LL-UL) | ICC (LL-UL) | ICC (LL-UL) |
|---|---|---|---|---|---|
| Weakest-Weakest Gait1–Gait2 | Weakest-Strongest Gait1–Gait2 | Strongest-Strongest Gait1–Gait2 | Mean | ||
| PwMS | Hip | 0.84 (0.48–0.96) | 0.78 (0.52–0.93) | 0.90 (0.77–0.96) | 0.84 (0.71–0.92) |
| Knee | 0.95 (0.82–0.99) | 0.82 (0.58–0.94) | 0.98 (0.94–0.99) | 0.95 (0.81–0.95) | |
| Ankle | 0.95 (0.80–0.99) | 0.27 (−0.06–0.68) | 0.89 (0.75–0.95) | 0.69 (0.48–0.84) | |
| Left-Left Gait1–Gait2 | Right-Left Gait1–Gait2 | Right-Right Gait1–Gait2 | Mean | ||
| HC-1 | Hip | 0.93 (0.73–0.98) | 0.81 (0.57–0.94) | 0.92 (0.81–0.96) | 0.87 (0.76–0.94) |
| Knee | 0.97 (0.87–0.99) | 0.88 (0.72–0.97) | 0.95 (0.89–0.98) | 0.91 (0.83–0.96) | |
| Ankle | 0.75 (0.28–0.93) | 0.66 (0.34–0.89) | 0.36 (−0.06–0.67) | 0.59 (0.35–0.79) | |
| HC-3 | Hip | 0.99 (0.96–1.00) | 0.94 (0.85–0.98) | 0.97 (0.92–0.99) | 0.96 (0.92–0.98) |
| Knee | 0.98 (0.93–1.00) | 0.93 (0.82–0.98) | 0.97 (0.94–0.99) | 0.95 (0.90–0.98) | |
| Ankle | 0.89 (0.61–0.97) | 0.60 (0.26–0.86) | 0.89 (0.74–0.95) | 0.76 (0.57–0.88) |
| Group | CV between Subjects (%) | CV within Subjects (%) | ||||
|---|---|---|---|---|---|---|
| Area (Hip-Knee) | Perimeter (Hip-Knee) | Area (Hip-Knee) | Perimeter (Hip-Knee) | |||
| W/L | S/R | W/L | S/R | W-S/L-R | W-S/L-R | |
| PwMS | 55.89 | 46.88 | 23.97 | 28.97 | 28.79 | 16.61 |
| HC-1 | 56.95 | 44.63 | 25.46 | 26.46 | 29.65 | 7.97 |
| HC-3 | 33.22 | 34.92 | 10.62 | 11.32 | 11.89 | 5.66 |
| Area (Knee-Ankle) | Perimeter (Knee-Ankle) | Area (Knee-Ankle) | Perimeter (Knee-Ankle) | |||
| W/L | S/R | W/L | S/R | W-S/L-R | W-S/L-R | |
| PwMS | 69.10 | 72.16 | 37.00 | 27.77 | 84.00 | 22.75 |
| HC-1 | 76.58 | 71.12 | 25.50 | 23.77 | 31.04 | 11.29 |
| HC-3 | 46.15 | 36.42 | 9.07 | 11.96 | 13.39 | 9.32 |
Publisher’s Note: MDPI stays neutral with regard to jurisdictional claims in published maps and institutional affiliations. |
© 2022 by the authors. Licensee MDPI, Basel, Switzerland. This article is an open access article distributed under the terms and conditions of the Creative Commons Attribution (CC BY) license (https://creativecommons.org/licenses/by/4.0/).
Share and Cite
Di Giminiani, R.; Di Lorenzo, D.; La Greca, S.; Russo, L.; Masedu, F.; Totaro, R.; Padua, E. Angle-Angle Diagrams in the Assessment of Locomotion in Persons with Multiple Sclerosis: A Preliminary Study. Appl. Sci. 2022, 12, 7223. https://0-doi-org.brum.beds.ac.uk/10.3390/app12147223
Di Giminiani R, Di Lorenzo D, La Greca S, Russo L, Masedu F, Totaro R, Padua E. Angle-Angle Diagrams in the Assessment of Locomotion in Persons with Multiple Sclerosis: A Preliminary Study. Applied Sciences. 2022; 12(14):7223. https://0-doi-org.brum.beds.ac.uk/10.3390/app12147223
Chicago/Turabian StyleDi Giminiani, Riccardo, Davide Di Lorenzo, Stefano La Greca, Luca Russo, Francesco Masedu, Rocco Totaro, and Elvira Padua. 2022. "Angle-Angle Diagrams in the Assessment of Locomotion in Persons with Multiple Sclerosis: A Preliminary Study" Applied Sciences 12, no. 14: 7223. https://0-doi-org.brum.beds.ac.uk/10.3390/app12147223