Article

Characteristics of Urban Heat Island in China and Its Influences on Building Energy Consumption

1
China Ship Development and Design Center, Wuhan 430064, China
2
Department of Refrigeration and Cryogenic Engineering, Xi’an Jiaotong University, Xi’an 710049, China
3
Department of Architecture, College of Civil Engineering and Architecture, Zhejiang University, Hangzhou 310058, China
4
Center for Balance Architecture, Zhejiang University, Hangzhou 310058, China
5
International Research Center for Green Building and Low-Carbon City, International Campus, Zhejiang University, Haining 314400, China
*
Author to whom correspondence should be addressed.
Submission received: 8 July 2022 / Revised: 27 July 2022 / Accepted: 28 July 2022 / Published: 30 July 2022
(This article belongs to the Special Issue Heat Transfer in Buildings)

Abstract

:
Urban heat island (UHI) draws more attention as it affects not only the health of residents but also the energy consumption of buildings at the city scale. To achieve carbon neutrality goals, it is crucial to better understand the mechanism of the UHI influences on building energy consumption. The characteristics of urban heat island intensity (UHII) and the relationship between the UHII effect and building electricity and related coal consumption were analyzed, based on the long period of monitoring data with hourly weather data from 1 January to 31 December 2019. Results show that a strong correlation between the annual mean UHII and the median daily mean UHII exists. The synthetic diurnal UHII of most cities presents a U-shaped variation trend. In different building climate zones in China, namely, severe cold region (SCR), cold region (CR), hot summer cold winter region (HSCWR), hot summer and warm winter region (HSWWR), and mild region (MR), the influences of UHII on building energy consumption were analyzed. The existence of UHI reduces building energy consumption in 96.7% of SCR cities and 60.8% of CR cities, while in HSCWR, HSWWR, and MR cities, the percentage of cities where the building energy consumption is increased by UHI is 69.4%, 80%, and 63.6%, respectively. Urban climate strongly influences building energy consumption, indicating that it should be considered and analyzed in detail for making future urban development or carbon emission reduction strategies.

1. Introduction

With the rapid urbanization, the residents in urban areas increased from 30% in the 1950s to over 56% in 2021, worldwide. It will continue to rise to 66% by 2050 [1]. Because of the tremendous modification of underlying surfaces and energy balance [2,3,4,5,6] and anthropogenic heat emissions [7], a specific phenomenon, i.e., urban heat island (UHI), presents in urban areas. The UHI phenomenon was first studied and documented by Howard [8] and then was systematically investigated by many studies [9,10,11,12,13,14]. The UHI not only increases the air temperature in the urban area but also affects its adjacent rural areas through urban heat-dome flow; [15,16,17] reported that during the day in summer, the UHII in Beijing is more than 2 °C and the footprint of the UHI is more than 1900 km2. Relative hot temperature induces building-scale and city-scale buoyancy-driven flows [18,19,20], which affect thermal comfort, pollutant dispersion, and building energy consumption [21,22,23].
The influence of UHI on building energy consumption have been found by many studies [24,25,26]. As the building sector accounts for approximately 31% (ranging from 22% to 57%) of global energy consumption, the UHI effect on building energy consumption draws increasingly more attention under the background of carbon neutrality goals [27]. UHI could have a great impact on building energy consumption by increasing cooling load and reducing heat load [28,29]. Hou et al. [30] suggested that urbanization has a significant effect on the spatial distribution of the number of cooling and heating degree days by analyzing the relationship between the average temperature and daily electricity consumption in Shanghai from 2003 to 2007. Street et al. [31] found that the cooling energy of a small office building located in the urban area of Boston is 22% and 42% higher compared to those located in two rural sites, respectively. KumAri et al. [32] showed that UHI formation caused an increased average electricity consumption of 2600 GWh (i.e., 11.4%) annually in eight districts of Delhi during the period April 2012 to March 2017. Meng et al. [33] found that the daily heating load in urban areas was significantly lower than that in rural areas, which was 10.1% and 7.5% less for residential and office buildings, respectively, in Tianjin.
Undoubtedly, the annual building energy consumption would be increased significantly in a hot climate where the cooling load dominates. However, it is still not clear whether the annual building energy consumption would be increased or decreased in a hot summer / cold winter climate, or in a cold / severe cold climate. Since the building energy consumption can be increased in summer and decreased in winter, the characteristics of UHI temporal variation also affects the annual overall energy consumption. For example, if the UHI is stronger in winter and weaker in summer, it would benefit the reduction in building energy consumption. In this study, the mechanisms of the UHI effect on the annual building energy consumption in different climate regions of China is investigated.
High spatial–temporal quantification of UHI is important to simulate the building energy consumption annually [34,35]. The UHI is usually quantified by the canopy-layer urban heat island intensity (UHII, [36,37,38]) or surface urban heat island intensity (SUHII, [39]). SUHII can be easily obtained based on satellite remote sensing infrared images with high spatial resolution at the city scale [40]. However, the temporal resolution of remote sensing images is low due to the limitation of satellite availability. Moreover, the deviation is excessively large for modeling building energy consumption when the SUHI is used [41]. Therefore, the UHII in the urban canopy layer was adopted in this study for modeling building energy consumption. Ramakreshnan et al. [37] found that Kuala Lumpur exhibited a distinct diurnal cycle with the maximum nocturnal UHII of 1.71 °C at about 8 p.m. after sunset under ideal meteorological conditions. He et al. [42] showed that UHII was enhanced by 0.78 °C during a heat-wave episode, with a greater increase at night than during day in Beijing.
In summary, the UHI becomes more pronounced with rapid growth of urban size and population, which significantly affects the building energy consumption. Existing studies focus on case studies of how the UHI affects building energy consumption. To the best of our knowledge, there are still no systematic investigations in terms of the UHI effect on annual building energy consumption in different climatic regions. We obtained UHI data for the main cities in China, which cover different building climate zones, i.e., severe cold region (SCR), cold region (CR), hot summer cold winter region (HSCWR), hot summer warm winter region (HSWWR), and mild region (MR). Hence, the influences of UHII characteristics on the building energy consumption in different climatic regions of China is focused on and investigated in detail.
Following this introduction (Section 1), data and methods are described in Section 2. The results are analyzed and discussed in Section 3. The conclusions are provided in Section 4.

2. Methods

2.1. Study Area and Weather Data

China has a vast territory and thus has various climate regions with different annual average temperatures, relative humidity, precipitation, etc. Based on the characteristics of local climates, China is divided into five building climate zones, i.e., severe cold region (SCR), cold region (CR), hot summer and cold winter region (HSCWR), hot summer and warm winter region (HSWWR), and mild region (MR) [43]. In this paper, the above five-building climate zones were used for the analysis, as shown in Figure 1. Hourly meteorological data for the calculation of UHII in 2019 were collected from the China Meteorological Data Network (http://data.cma.cn/, accessed on 31 December 2019). The urban–rural weather station pairs for calculating UHII were selected based on the following criteria. First, the urban stations were located in built up areas away from large parks or water bodies. Second, the altitude difference of the weather station pairs should be within 100 m. According to these criteria, 61 prefecture-level cities and 136 county-level cities with urban–rural station pairs were identified, which were used in the following UHII calculation for the corresponding cities, as marked in Figure 1.

2.2. Calculation of UHII

The UHII at a specific time t during a certain day is written as Equation (1) [44]:
UHII t = U t R t
where U t (°C) and R t (°C) are the urban air temperature and rural air temperature, respectively, at the time t.
The UHII normally shows a diurnal variation. Owing to the complex weather conditions, the diurnal profiles of UHII on different dates have differences. Therefore, a synthetic diurnal UHII profile ( UHII S D ) was proposed and given as Equation (2) [45] to present a typical UHII diurnal profile:
UHII S D = n = 1 N UHII t ( n ) / N
where n = 1 N UHII t ( n ) is the UHII of the nth day of the year at a certain hour t (t = 0, 1, 2, 3, …, 23). In this paper, the synthetic diurnal UHII ( UHII S D ) was based on the whole year data, i.e., N = 365.
The daily mean UHII d for a certain day is defined as Equation (3) [46]:
UHII d = t   =   0 23 UHII t / 24
Similarly, the monthly mean, seasonally mean, and annual mean UHII are the average UHIId of all days in a certain month, season, and the whole year, respectively.

2.3. Heating/Cooling Load-Related Electricity or Coal Consumption

DesignBuilder (DesignBuilder V3, DesignBuilder Software Ltd., Stroud, UK), which was used in this study, has been widely used in building cooling/heating load simulation with reasonable accuracy and efficiency [47]). The residential building model with a typical layout was adopted to simulate the building energy consumption. The building envelope performance-related parameters (Table 1) were set abiding by the building design standards [48,49,50,51]. The weather file for building energy simulation was formed based on the weather data recorded for 2019, which is the same dataset that was used for analyzing UHI in Section 2.2.
Based on the actual heating/cooling demand and according to published standards [52], we defined the heating season and cooling season. In the regions of HSCWR, HSWWR, and MR, the heating and cooling season is December–February and March–November, respectively. The indoor temperature setting in different building climate zones are shown in Table 1. The power density is the electricity consumption of electric appliances including lighting.
In addition to the heating/cooling load, the coefficient of performance (COP) of the energy conversion system also affects the final electricity or coal consumption. In the SCR and CR regions, a central heating system was applied and the central heating demand was mostly provided by heating boilers with coal consumption [49]. In the other building climate zones (HSCWR, HSWWR, and MR), heating and cooling are mainly provided by split air conditioners in residential buildings. The split air conditioner usually has a larger COP during cooling compared to heating, in which case, the same value of heating or cooling load results in different electricity consumption. Therefore, we calculated three values to understand how the UHII affects energy consumption, as follows: (1) the load (cooling load and heating load), (2) the electricity consumption (converted from the load), and (3) the coal consumption (converted from electricity consumption and heating load in SCR and CR). In the calculation of electricity consumption, a split air conditioner was assumed to be used in SCR and CR as those in the other three-building climate zones (HSCWR, HSWWR, and MR) for the sake of the comparison. For the coal consumption calculation, central heating with coal combustion boilers was applied in SCR and CR during the heating season, while the split air conditioner was adopted during the cooling season in all five building climate zones and during the heating season in HSCWR, HSWWR, and MR.
The typical required COP values in national standards [50] are listed in Table 2. The electricity consumption (EC, KWh) can be obtained with Equation (4):
E C   =   H L / C O P h   +   C L / C O P c
where HL (KWh) and CL (KWh) are heating load and cooling load, and COPh and COPc are the COP during heating and cooling, respectively.
Coal consumption (CC, kg) was calculated with Equation (5) (for area with central heating) or Equation (6) (for area without central heating):
C C = H L / η h + C L / ( η e × C O P c )
C C = H L / ( η e × C O P h ) + C L / ( η e × C O P c )
where η h (KWh kg−1) and η e (KWh kg−1) are the conversion efficiency from the coal to the heat (coal combustion boilers) and electricity (coal combustion power plant), respectively; η h and η e are set as 60% and 40%, respectively [50].

3. Results and Discussion

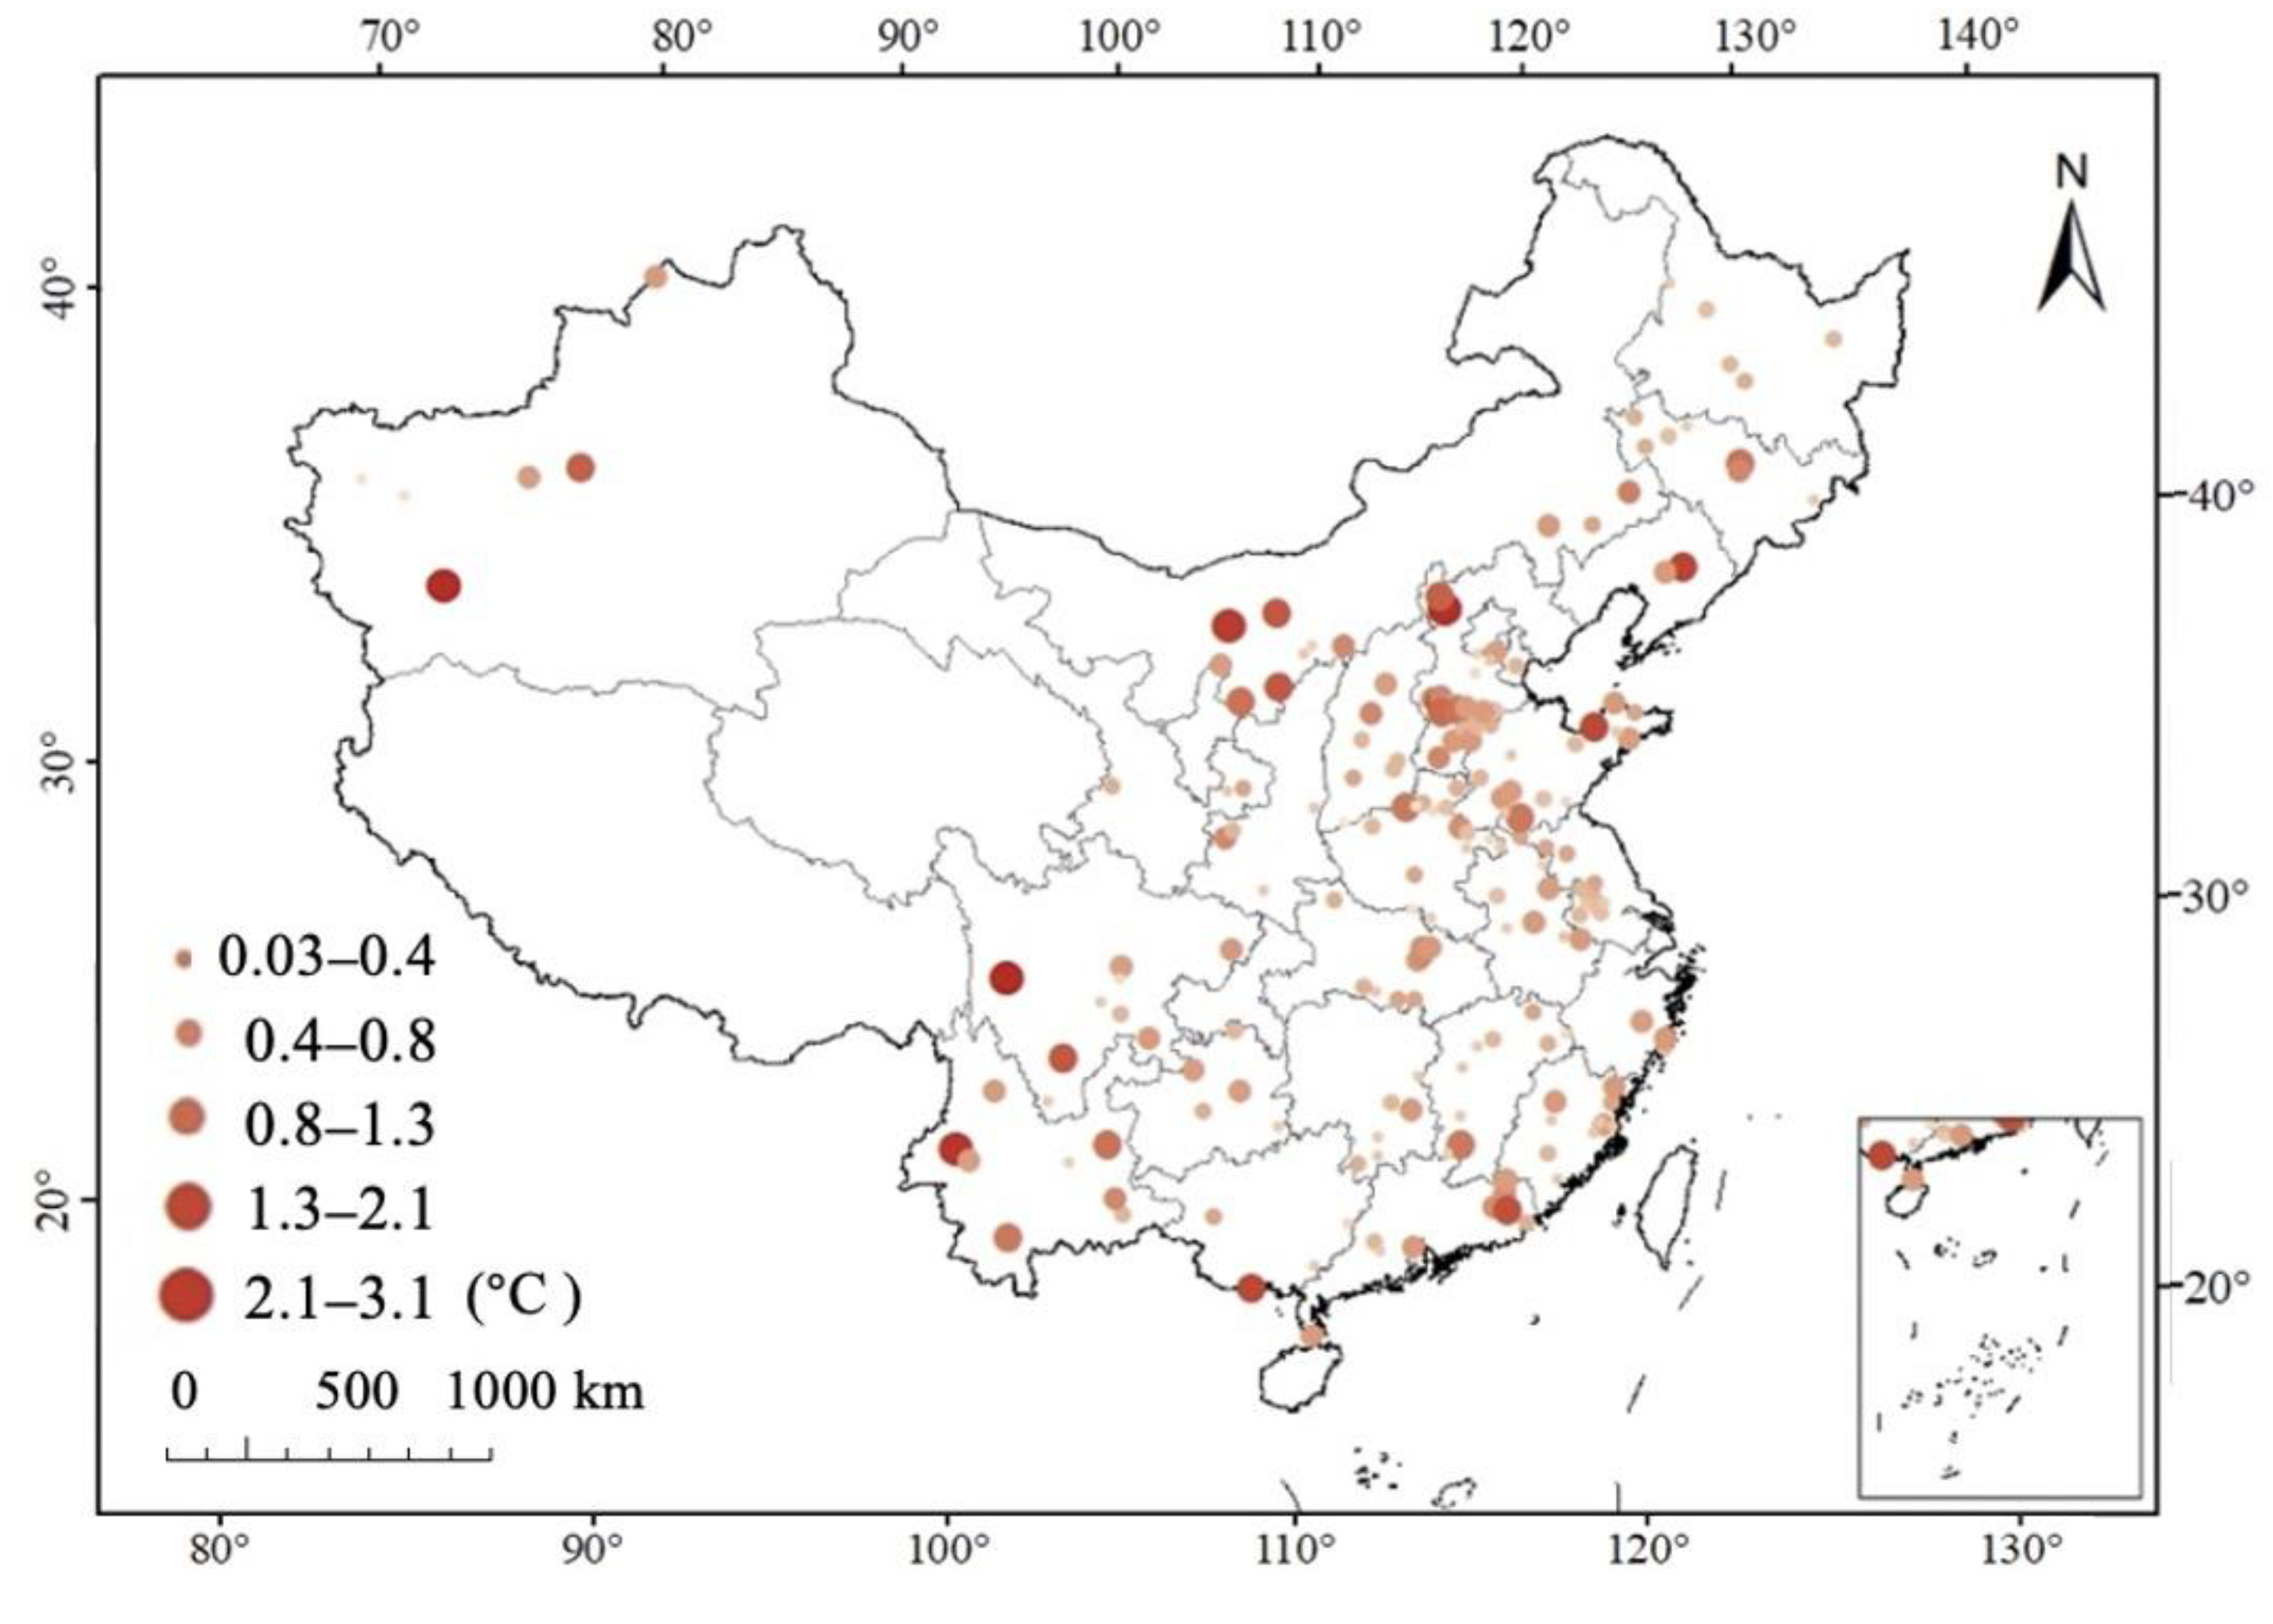
3.1. Spatial and Temporal Variation of UHII in Main Chinese Cities

The annual mean UHII is shown in Figure 2.
The annual mean UHII ranges from 0.03 to 3.1 °C; 52.3% of cities have an annual mean UHII between 0.5 and 1 °C. The relationship between annual mean UHII and daily maximum UHII or median daily UHII in different cities was analyzed and the results are shown in Figure 3. It is found that the annual mean UHII has positive correlations with the maximum of daily mean UHII (Figure 3a) and median of daily mean UHII (Figure 3b). With R2 = 0.97, the median of daily mean UHII can represent well the annual mean UHII. The maximum daily mean UHII has a weaker correlation with annual mean UHII (R2 = 0.26) as indicated by more scattered data points in Figure 3a compared to Figure 3b. It suggests that large-scale background weather, such as extreme heat waves [52], can affect the daily mean UHII occasionally, leading to extreme values of daily UHII. The deviation of the maximum daily mean UHII from the annual mean UHII is large, which suggests that we should consider extreme weather conditions in urban planning and policymaking to avoid dramatic damage.
The characteristics of temporal variation of UHII are shown in Figure 4. Figure 4a presents the typical variation of synthetic daily UHII profiles based on the whole year data for SCR cities (Equation (2)), i.e., UHII S D . A “U” shape forms for most cities. UHII S D begins to decrease around 6 am after sunrise because the rural air temperature increases rapidly because of its relatively low thermal capacity. During 10:00–14:00, the UHIISD reaches the lowest values and begins to increase after around 16:00 when the solar radiation decreases dramatically [53]. As for the seasonal mean UHII (Figure 4b), the values are lowest in summer and highest in winter. The relatively low value of solar radiation intensity and high anthropogenic heat emissions due to heating demand in buildings contribute to the high UHII in winter [52]. The magnitude of UHII during spring has a value similar to that during autumn. It should be mentioned that the temporal variation of UHII in other cities presents a similar trend as in typical SCR cities shown in Figure 4. For simplicity, the data are not shown here.

3.2. Electricity and Coal Consumption Induced by the Cooling and Heating Load

Figure 5 and Figure 6 present the simulated value of electricity consumption (Equation (4)) and coal consumption (Equation (5)), respectively, for a typical residential building in different cities across five building climate zones in China. Under the influences of the UHI, the consumption of electricity and coal decreased by 96.7% (29 out of 30) in SCR cities. The electricity consumption can be reduced by 0.5–18.8 kWh/m2, and the relative change ranges from 0.9% to 41.3%. The corresponding coal consumption can be reduced by 0.2–6.2 kg/m2. The energy consumption increases only in Naiman city, due to the different characteristics of its UHII. The winter UHII in Naiman city is 0.5 °C and the summer UHII is 1 °C, inducing more energy consumption in summer than energy saving in winter. The winter UHII helps to save electricity consumption by 1.28 kWh/m2 and coal consumption by 0.42 kg/m2. However, the summer UHII induces more electricity and coal consumption, 1.4 kWh/m2 and 0.43 kg/m2, respectively. Therefore, the overall effect of the UHI in Naiman city is to induce more energy consumption, 0.01 kg/m2 for coal consumption and 0.12 kWh/m2 for electricity consumption. In CR, 45 out of 74 cities (60.8%) have lower energy consumption in the presence of the UHI. The electricity consumption and coal consumption saving due to the UHI are in the range 0.03–4.5 kWh/m2 (saving 0.11–14.4%) and 0.04–1.5 kg/m2 (saving 0.4–14.7%), respectively. In the other 29 cities, the energy consumption was increased by the UHI. The percentage of increase for electricity and coal consumption are around 0.1–20.1% and 0.04–21.7%, respectively.
The building energy consumption is increased in most HSCWR cities (43 out of 64, 67.2%). The increasing value of electricity consumption and coal consumption are in the order of 0.05–6.2 kWh/m2 and 0.01–1.9 kg/m2, respectively, corresponding to the relative change of around 0.1%~22.7%. On the other hand, for the cities with a decreasing trend, the UHI can save electricity consumption by around 0.03–5.8 kWh/m2 and coal consumption by 0.01–1.8 kg/m2. The relative change is in the order of 0.1–18.3%. Similarly, most of the cities in HSWWR (15 out of 20, 75%) and MR (7 out of 11, 63.6%) have a higher energy consumption when the UHI is present.

4. Conclusions

The characteristics of UHII in 197 main Chinese cities across five building climate zones and their influences on building energy consumption were analyzed.
It was found that the annual mean UHII in most cities is around 0.5–1 °C. Based on data from 197 cities, the median daily mean UHII can best represent the annual mean UHII (R2 = 0.97). The synthetic daily UHII showed a relatively consistent ”U” shape diurnal profile in typical cities. The synthetic daily UHII decreased first around 6:00 and then began to increase after 16:00. The UHII also presents seasonal variations. The seasonal average UHII is lowest in summer and highest in winter.
The UHII affects the building energy consumption significantly with different effects across different building climate zones. As the heating demand dominates in SCR and CR cities, most cities in SCR (96.7%) and CR (60.8%) favor the UHI effect, i.e., the presence of UHI reduces the building energy consumption. However, in HSCWR, HSWWR, and MR, the situation inverses due to the importance of cooling load in these three building climate zones. The presence of UHI increases the annual building energy consumption by 69.4%, 80%, and 63.6% in HSCWR, HSWWR, and MR, respectively. Therefore, the background climate should be taken into account when considering the UHI mitigation strategies to reduce building energy consumption.

Author Contributions

Data analysis, Writing and Discussing, S.W.; Data processing, Drawing figures, Modelling, Z.W.; Discussing, Editing and Reviewing, Y.Z.; Project administration, Funding acquisition, Writing, Editing and Reviewing, Y.F. All authors have read and agreed to the published version of the manuscript.

Funding

This research was funded by the Ministry of Housing and Urban–Rural Development of China grant number K20210466 and The APC was funded by Zhejiang University.

Institutional Review Board Statement

Not applicable.

Informed Consent Statement

Not applicable.

Data Availability Statement

The data are included in the main text.

Acknowledgments

The research project of the Ministry of Housing and Urban–Rural Development of China (K20210466) is acknowledged.

Conflicts of Interest

The authors declare no conflict of interest.

References

  1. United Nations. Cities and Pollution; United Nations: New York, NY, USA, 2014. [Google Scholar]
  2. Yang, X.; Li, Y.; Yang, L. Predicting and understanding temporal 3D exterior surface temperature distribution in an ideal courtyard. Build. Environ. 2012, 57, 38–48. [Google Scholar] [CrossRef]
  3. Yang, X.; Li, Y.; Luo, Z.; Chan, P.W. The urban cool island phenomenon in a high-rise high-density city and its mechanisms. Int. J. Clim. 2017, 37, 890–904. [Google Scholar] [CrossRef]
  4. Yang, X.; Li, Y. The impact of building density and building height heterogeneity on average urban albedo and street surface temperature. Build. Environ. 2015, 90, 146–156. [Google Scholar] [CrossRef]
  5. Yang, S.; Zhang, D. Research progress and prospect of urban heat island effect. J. Meteorol. Res. 2012, 70, 338–353. [Google Scholar]
  6. Yang, X.C.; Zhang, Y.L.; Liu, L.S.; Zhang, W.; Ding, M.J.; Wang, Z.F. Sensitivity of surface air temperature change to land use/cover types in China. China Sci. 2009, 39, 638–646. [Google Scholar] [CrossRef]
  7. Han, S.; Tang, Q.; Xu, D.; Yang, Z. Impacts of urbanization and agricultural development on observed changes in surface air temperature over mainland China from 1961 to 2006. Theor. Appl. Climatol. 2019, 135, 1595–1607. [Google Scholar] [CrossRef]
  8. Howard, L. Climate of London Deduced from Metrological Observations (Volume 1); Harvey and Dorton Press: Lexington, KY, USA, 1833; Volume 348. [Google Scholar]
  9. Manley, G. On the Frequency of Snowfall in Metropolitan England. Q. J. R. Meteorol. Soc. 1958, 84, 70–72. [Google Scholar] [CrossRef]
  10. Oke, T.R. The energetic basis of the urban heat island. Q. J. R. Meteorol. Soc. 1982, 108, 1–24. [Google Scholar] [CrossRef]
  11. Mohajerani, A.; Bakaric, J.; Jeffrey-Bailey, T. The urban heat island effect, its causes, and mitigation, with reference to the thermal properties of asphalt concrete—ScienceDirect. J. Environ. Manag. 2017, 197, 522–538. [Google Scholar] [CrossRef] [PubMed]
  12. Li, D.; Liao, W.; Rigden, A.J.; Liu, X.; Shevliakova, E. Urban heat island: Aerodynamics or imperviousness? Sci. Adv. 2019, 5, eaau4299. [Google Scholar] [CrossRef] [PubMed] [Green Version]
  13. Martilli, A.; Krayenhoff, E.S.; Nazarian, N. Is the Urban Heat Island intensity relevant for heat mitigation studies? Urban Clim. 2020, 31, 100541. [Google Scholar] [CrossRef]
  14. Wang, Z.; Meng, Q.; Allam, M.; Hu, D.; Zhang, L.; Menenti, M. Environmental and anthropogenic drivers of surface urban heat island intensity: A case-study in the Yangtze River Delta, China. Ecol. Indic. 2021, 128, 107845. [Google Scholar] [CrossRef]
  15. Fan, Y.; Li, Y.; Bejan, A.; Wang, Y.; Yang, A.X. Horizontal extent of the urban heat dome flow. Sci. Rep. 2017, 7, 11681. [Google Scholar] [CrossRef] [PubMed] [Green Version]
  16. Fan, Y.; Li, Y.; Yin, S. Non-uniform ground-level wind patterns in a heat dome over a uniformly heated non-circular city. Int. J. Heat Mass Transf. 2018, 124, 233–246. [Google Scholar] [CrossRef]
  17. Fan, Y.; Li, Y.; Yin, S. Interaction of multiple urban heat island circulations under idealised settings. Build. Environ. 2018, 134, 10–20. [Google Scholar] [CrossRef]
  18. Fan, Y.; Li, Y.; Hang, J.; Wang, K.; Yang, X. Natural convection flows along a 16-storey high-rise building. Build. Environ. 2016, 107, 215–225. [Google Scholar] [CrossRef]
  19. Fan, Y.; Li, Y.; Hang, J.; Wang, K. Diurnal variation of natural convective wall flows and the resulting air change rate in a homogeneous urban canopy layer. Energy Build. 2017, 153, 201–208. [Google Scholar] [CrossRef]
  20. Fan, Y.; Zhao, Y.; Torres, J.F.; Xu, F.; Lei, C.; Li, Y.; Carmeliet, J. Natural convection over vertical and horizontal heated flat surfaces: A review of recent progress focusing on underpinnings and implications for heat transfer and environmental applications. Phys. Fluids 2021, 33, 101301. [Google Scholar] [CrossRef]
  21. Hang, J.; Xian, Z.; Wang, D.; Mak, C.M.; Wang, B.; Fan, Y. The impacts of viaduct settings and street aspect ratios on personal intake fraction in three-dimensional urban-like geometries. Build. Environ. 2018, 143, 138–162. [Google Scholar] [CrossRef]
  22. Yang, H.; Chen, T.; Lin, Y.; Buccolieri, R.; Mattsson, M.; Zhang, M.; Hang, J.; Wang, Q. Integrated impacts of tree planting and street aspect ratios on CO dispersion and personal exposure in full-scale street canyons. Build. Environ. 2019, 169, 106529. [Google Scholar] [CrossRef]
  23. Zhang, K.; Chen, G.; Wang, X.; Liu, S.; Mak, C.M.; Fan, Y.; Hang, J. Numerical evaluations of urban design technique to reduce vehicular personal intake fraction in deep street canyons. Sci. Total Environ. 2018, 653, 968–994. [Google Scholar] [CrossRef] [PubMed]
  24. Arifwidodo, S.; Chandrasiri, O. Urban Heat Island and Household Energy Consumption in Bangkok, Thailand. Energy Procedia 2015, 79, 189–194. [Google Scholar] [CrossRef] [Green Version]
  25. Ding, F.; Pang, H.; Guo, W. Impact of the urban heat island on residents’ energy consumption: A case study of Qingdao. IOP Conf. Ser. Earth Environ. Sci. 2018, 121, 032026. [Google Scholar] [CrossRef]
  26. Tian, L.; Lu, J.; Li, Y.; Bu, D.; Liao, Y.; Wang, J. Temporal characteristics of urban heat island and its response to heat waves and energy consumption in the mountainous Chongqing, China. Sustain. Cities Soc. 2021, 75, 103260. [Google Scholar] [CrossRef]
  27. Sharifi, E.; Larbi, M.; Omrany, H.; Boland, J. Climate change adaptation and carbon emissions in green urban spaces: Case study of Adelaide. J. Clean. Prod. 2020, 254, 120035. [Google Scholar] [CrossRef]
  28. Santamouris, M.; Papanikolaou, N.; Livada, I.; Koronakis, I.; Georgakis, C.; Argiriou, A.; Assimakopoulos, D.N. On the impact of urban climate on the energy consumption of buildings. Sol. Energy 2001, 70, 201–216. [Google Scholar] [CrossRef]
  29. Kolokotroni, M.; Ren, X.; Davies, M.; Mavrogianni, A. London’s urban heat island: Impact on current and future energy consumption in office buildings. Energy Build. 2012, 47, 302–311. [Google Scholar] [CrossRef] [Green Version]
  30. Hou, Y.; Mu, H.; Dong, G.; Shi, J. Influences of Urban Temperature on the Electricity Consumption of Shanghai. Adv. Clim. Change Res. 2014, 5, 74–80. [Google Scholar]
  31. Street, M.; Reinhart, C.; Norford, L.; Ochsendorf, J. Urban heat island in boston—An evaluation of urban airtemperature models for predicting building energy use. In Proceedings of the BS2013: 13th Conference of International Building Performance Simulation Association, Chambéry, France, 26–28 August 2013. [Google Scholar]
  32. Kumari, P.; Garg, V.; Kumar, R.; Kumar, K. Impact of urban heat island formation on energy consumption in Delhi. Urban Clim. 2021, 36, 100763. [Google Scholar] [CrossRef]
  33. Meng, F.; Guo, J.; Ren, G.; Zhang, L.; Zhang, R. Impact of urban heat island on the variation of heating loads in residential and office buildings in Tianjin. Energy Build. 2020, 226, 110357. [Google Scholar] [CrossRef]
  34. Aboelata, A.; Sodoudi, S. Evaluating urban vegetation scenarios to mitigate urban heat island and reduce buildings’ energy in dense built-up areas in Cairo. Build. Environ. 2019, 166, 106407. [Google Scholar] [CrossRef]
  35. Hwang, R.-L.; Lin, T.-P.; Lin, F.-Y. Evaluation and mapping of building overheating risk and air conditioning use due to the urban heat island effect. J. Build. Eng. 2020, 32, 101726. [Google Scholar] [CrossRef]
  36. Kotharkar, R.; Bagade, A. Evaluating urban heat island in the critical local climate zones of an Indian city. Landsc. Urban Plan. 2018, 169, 92–104. [Google Scholar] [CrossRef]
  37. Ramakreshnan, L.; Aghamohammadi, N.; Fong, C.S.; Ghaffarianhoseini, A.; Wong, L.P.; Sulaiman, N.M. Empirical study on temporal variations of canopy-level Urban Heat Island effect in the tropical city of Greater Kuala Lumpur. Sustain. Cities Soc. 2018, 44, 748–762. [Google Scholar] [CrossRef]
  38. Yao, R.; Wang, L.; Huang, X.; Liu, Y.; Niu, Z.; Wang, S.; Wang, L. Long-term trends of surface and canopy layer urban heat island intensity in 272 cities in the mainland of China. Sci. Total Environ. 2021, 772, 145607. [Google Scholar] [CrossRef] [PubMed]
  39. Xu, P.; Huang, Y.J.; Miller, N.; Schlegel, N.; Shen, P. Impacts of climate change on building heating and cooling energy patterns in California. Energy 2012, 44, 792–804. [Google Scholar] [CrossRef]
  40. Fu, P.; Weng, Q. A time series analysis of urbanization induced land use and land cover change and its impact on land surface temperature with Landsat imagery. Remote Sens. Environ. 2016, 175, 205–214. [Google Scholar] [CrossRef]
  41. Venter, Z.S.; Chakraborty, T.; Lee, X. Crowd sourced air temperatures contrast satellite measures of the urban heat island and its mechanisms. Sci. Adv. 2021, 7, eabb9569. [Google Scholar] [CrossRef]
  42. He, X.; Wang, J.; Feng, J.; Yan, Z.; Miao, S.; Zhang, Y.; Xia, J. Observational and modeling study of interactions between urban heat island and heatwave in Beijing. J. Clean. Prod. 2019, 247, 119169. [Google Scholar] [CrossRef]
  43. GB 50178-93; Standard for Climatic Regionalization for Building and Civil Engineering. China Planning Press: Beijing, China, 1993.
  44. Chuan, T.; Wu, J.; Zhao, D.; Yang, Q.; Fan, W.; Zhao, J. Fine structure analysis of urban heat island of a central city in low-latitude plateau of China. Urban Clim. 2022, 44, 101186. [Google Scholar] [CrossRef]
  45. Kolokotroni, M.; Giridharan, R. Urban heat island intensity in London: An investigation of the impact of physical characteristics on changes in outdoor air temperature during summer. Sol. Energy 2008, 82, 986–998. [Google Scholar] [CrossRef] [Green Version]
  46. Varentsova, S.A.; Varentsov, M.I. A new approach to study the long-term urban heat island evolution using time-dependent spectroscopy. Urban Clim. 2021, 40, 101026. [Google Scholar] [CrossRef]
  47. Zhou, Y.; Zhuang, Z.; Yang, F.; Yu, Y.; Xie, X. Urban morphology on heat island and building energy consumption. Procedia Eng. 2017, 205, 2401–2406. [Google Scholar] [CrossRef]
  48. JGJ 134-2010; Design Standard for Energy Efficiency of Residential Buildings in Hot Summer and Cold Winter Zone. China Architecture & Building Press: Beijing, China, 2010.
  49. JGJ 75-2012; Design Standard for Energy Efficiency of Residential Buildings in Hot Summer and Warm Winter Zone. China Architecture & Building Press: Beijing, China, 2012.
  50. JGJ 26-2018; Design Standard for Energy Efficiency of Residential Buildings in severe Cold and Cold Zones. China Architecture & Building Press: Beijing, China, 2018.
  51. JGJ/T 449-2018; Standard for Green Performance Calculation of civil buildings. China Architecture & Building Press: Beijing, China, 2018.
  52. Tian, C.; Huang, G.; Piwowar, J.M.; Yeh, S.-C.; Lu, C.; Duan, R.; Ren, J. Stochastic RCM-driven cooling and heating energy demand analysis for residential building. Renew. Sustain. Energy Rev. 2022, 153, 111764. [Google Scholar] [CrossRef]
  53. Aikawa, M.; Hiraki, T.; Eiho, J. Vertical atmospheric structure estimated by heat island intensity and temporal variations of methane concentrations in ambient air in an urban area in Japan. Atmos. Environ. 2006, 40, 4308–4315. [Google Scholar] [CrossRef]
Figure 1. The locations of the selected 61 prefecture-level cities and 136 county-level cities in the five building climate zones (SCR, CR, HSCWR, HSWWR, and MR) in China.
Applsci 12 07678 g001
Figure 2. Annual mean UHII for 61 prefecture-level cities and 136 county-level cities in 2019.
Applsci 12 07678 g002
Figure 3. (a) The relationship between annual mean UHII and daily mean maximum UHII. (b) The relationship between annual mean UHII and median daily UHII.
Applsci 12 07678 g003aApplsci 12 07678 g003b
Figure 4. (a) UHIISD in typical SCR cities. (b) Seasonal mean UHII in typical SCR cities.
Applsci 12 07678 g004aApplsci 12 07678 g004b
Figure 5. Cooling and heating load-related electricity consumption simulated with (a) urban air temperature and (b) rural air temperature. (c) The differences between urban electricity consumption (ECu) and rural electricity consumption (ECr) indicate the effect of UHII on electricity consumption in a typical residential building. (d) The relative change in electricity consumption due to UHII, i.e., (ECuECr)/ECr.
Applsci 12 07678 g005aApplsci 12 07678 g005b
Figure 6. Cooling and heating load-related coal consumption simulated with (a) urban air temperature and (b) rural air temperature. (c) The differences between urban coal consumption (CCu) and rural coal consumption (CCr) indicate the effect of UHII on coal consumption in a typical residential building. (d) The relative change in coal consumption due to UHII, i.e., (CCuCCr)/CCr.
Applsci 12 07678 g006aApplsci 12 07678 g006bApplsci 12 07678 g006c
Table 1. Parameters of the building envelope in different building climate zones.
Building Envelope ParametersSCRCRHSCWRHSWWRMR
External wall
(W/m2 K)
0.350.350.80.351.8
Roof
(W/m2 K)
0.150.150.60.650.8
External window
(W/m2 K)
22363.5
Window–wall ratio 0.25
Air tightness
(ACH)
0.50.5110.5
Power density
(W/m2)
5
Heating/cooling temperature (°C) 18/2618/2618/2616/2618/26
Table 2. COP of a split air conditioner used in a residential building for heating and cooling, which were provided according to standards [50].
Building Climate ZonesHeating/CoolingCOP Values
SCR
CR
For heating COPh1.6
For cooling COPc2.8
HSCWR
HSWWR
MR
For heating COPh1.8
For cooling COPc2.8
Publisher’s Note: MDPI stays neutral with regard to jurisdictional claims in published maps and institutional affiliations.

