Article

Free-Energy Landscape Analysis of Protein-Ligand Binding: The Case of Human Glutathione Transferase A1

1
Laboratoire Interdisciplinaire Carnot de Bourgogne, UMR 6303 CNRS-Université de Bourgogne Franche-Comté, 21078 Dijon, France
2
Centre des Sciences du Goût et de l’Alimentation (CSGA), Université de Bourgogne Franche-Comté, INRA, CNRS, 21000 Dijon, France
*
Author to whom correspondence should be addressed.
Submission received: 13 July 2022 / Revised: 11 August 2022 / Accepted: 12 August 2022 / Published: 16 August 2022
(This article belongs to the Special Issue Computational Approaches for Protein Dynamics and Function)

Abstract

:
Glutathione transferases (GSTs) are a superfamily of enzymes which have in common the ability to catalyze the nucleophilic addition of the thiol group of reduced glutathione (GSH) onto electrophilic and hydrophobic substrates. This conjugation reaction, which occurs spontaneously but is dramatically accelerated by the enzyme, protects cells against damages caused by harmful molecules. With some exceptions, GSTs are catalytically active as homodimers, with monomers generally constituted of 200 to 250 residues organized into two subdomains. The first is the N-terminal subdomain, which contains an active site named G site, where GSH is hosted in catalytic conformation and which is generally highly conserved among GSTs. The second subdomain, hydrophobic, which binds the substrate counterpart (H site), can vary from one GST to another, resulting in structures able to recognize different substrates. In the present work, we performed all-atom molecular dynamics simulations in explicit solvent of human GSTA1 in its APO form, bound to GSH ligand and bound to GS-conjugated ligand. From MD, two probes were analyzed to (i) decipher the local conformational changes induced by the presence of the ligand and (ii) map the communication pathways involved in the ligand-binding process. These two local probes are, first, coarse-grained angles ( θ , γ ) , representing the local conformation of the protein main chain and, second, dihedral angles χ representing the local conformation of the amino-acid side chains. From the local probes time series, effective free-energy landscapes along the amino-acid sequence were analyzed and compared between the three different forms of GSTA1. This methodology allowed us to extract a network of 33 key residues, some of them being located in the experimentally well-known binding sites G and H of GSTA1 and others being located as far as 30Å from the original binding sites. Finally, the collective motions associated with the network of key residues were established, showing a strong dynamical coupling between residues Gly14-Arg15 and Gln54-Val55, both in the same binding site (intrasite) but also between binding sites of each monomer (intersites).

1. Introduction

Proteins are biological macromolecules that perform a large variety of functions in living cells comprising biochemical (enzymes), structural, mechanical, and signaling functions. To perform their functions, proteins interact with small molecules referred to as ligands, which are able to bind to a protein with high affinity and specificity [1]. These protein/ligand interactions are crucial in biology, particularly in the context of drug design [2]. Since proteins interact with a broad range of drugs, it is of particular interest to study the mechanisms of binding of ligands to proteins and its impact on the structural dynamics to gain insights into (i) phenomena involved in the biological process and related to diseases [3] (misfolding, aggregation), and (ii) discovery, design, and development of new drugs [4]. The experimental structural data (e.g., X-ray crystallography, NMR, or cryo-EM) provide key structural information of the ligand-bound and ligand-unbound (APO) proteins [5]. Nevertheless, the static information is not always sufficient for understanding protein–ligand binding mechanisms, especially when pockets are highly flexible and contain several binding sites. Therefore, molecular dynamics (MD) is a powerful tool that provides a description of the dynamics and structures of protein–ligand systems with a high spatial and temporal resolution.
Glutathione transferases (GSTs) belong to a ubiquitous superfamily of enzymes that metabolize a broad range of reactive toxic compounds by catalyzing the conjugation of reduced tripeptide glutathione ( γ -Glu-Cys-Gly; named GSH) to the electrophilic center of a second substrate [6,7,8], the reactivity of GSH being due to the thiol group SH of the cysteine residue. The conjugation reaction occurs spontaneously but GST accelerates it dramatically. This process of detoxification protects cells against damages caused by both exogenous and endogenous molecules. GSTs were first discovered in liver cells [9,10], and since then, they have been found to exhibit ligand-binding properties for a large variety of compounds, which are not always their enzymatic substrates [11]. Therefore, GSTs participate in diverse biological processes, making them multifunctional proteins. Moreover, GSTs are classified into three families according to their location in the cell: cytosolic, mitochondrial, and microsomal, which is not evolutively related to the two other classes [12]. First-discovered and most-abundant cytosolic GSTs are divided into 13 classes based on homology of their sequences. Members of the same cytosolic class have at least 40% of sequence identity, while members of different classes must have at most 25% of sequence identity. Even if they present a low homology with the cytosolic GST, mitochondrial GSTs can be considered as a particular class of GSTs (Kappa). Humans possess GST members in seven different classes [13], particularly the Alpha-class (cytosolic GSTs), in which the GSTA1 protein, which is the protein of interest in the present work, belongs. An alternative classification is possible on the basis of the residue located in the G site and which favors the activation of GSH (deprotonation of GSH plus reduction of pKa): the Cys-GSTs, whose structures are very similar to the ancestral precursor of all GSTs, the Ser-GSTs (Delta, Theta, Zeta, and Phi classes, including also Nu-GST activated by a threonine), and the Tyr-GSTs (Alpha, Pi, Mu, and Sigma classes); this latter subfamily comprises the more recently evolved GSTs.
With some exceptions, GSTs are catalytically active as dimers. The GSTA1 dimer is stabilized by a “lock and key” motif consisting of two key residues (Met51 and Phe52) fitting into a hydrophobic cavity of the other dimer [14]. Human GSTA1 dimer revealed negative cooperativity properties depending on the substrates. It was proposed that this negative cooperativity allows the self-preservation of their functions [15,16]. Additionally, there is no clear evidence that monomeric forms of GSTA1 are active as well as folded [17]. GST monomers are, in general, made of 200 to 250 residues with a molecular weight generally comprising between 25 and 30 kDa [18,19] and are organized into two subdomains (Figure 1A): the typically 80-residue-long N-terminal subdomain (I) has the typical fold of thioredoxin. It contains a first active site where GSH is hosted in catalytic conformation, named G site (Figure 1B). The thioredoxin fold is composed of a characteristic sequence of α -helices and β -strands encountered in the thioredoxin protein family, i.e., β 1 α 1 β 2 α 2 β 3 β 4 α 3 , which is characteristic of enzymes dealing with gluthatione, such as glutaredoxin or glutathione peroxydase [20]. In addition, it has been shown that the region β 3 β 4 α 3 is well conserved among GSTs and enables GSH recognition by the enzyme [7]. Residues forming the G site are generally conserved among GSTs [19]. A noticeable exception is the residue of α 1 -helix which interacts with the sulfur atom of GSH and which can be a cysteine, a serine, or a tyrosin (as is the case for human GSTA1). Depending on the nature of this residue, GSTs develop slightly different catalytic functions and target a different range of substrates [21]. The second subdomain (II) is all-helical and contains the H site which binds the substrate. The number of helices varies between four and seven among GSTs. Subdomain (II) is hydrophobic, and therefore attractive for hydrophobic molecules. Together with the G site, the combined architecture of GST monomers is adapted to bind GSH to hydrophobic substrates [22]. Contrary to the G site, the residues of the H site strongly vary from one GST to the others, resulting in H sites of different natures and the ability to recognize different substrates [23].
Hereafter, we focus our interest on the structure of human GSTA1 (hGSTA1), which is a homodimer with each monomer made of 222 residues [24]. Among the 29 experimental structures of hGSTA1 available in the Protein Data Bank, 21 of them contain at least one ligand, which is GSH, substrates (R), or GS-conjugates (GS-R). For each structure, a sequence analysis is provided, featuring the residues of hGSTA1 which are in contact with the ligand. Collecting these data (Figure S1), we determined the list of residues bound to GSH and therefore involved in the G site of hGSTA1: Tyr9, Arg15, Arg45, Gln54, Val55, Pro56, Gln67, Thr68, Asp101, Arg131, and Phe220 (Asp101 and Arg131 belong to the opposite monomer; see Figure 1B). We performed the same analysis to identify residues bound to GS-conjugates and therefore involved in the H site of hGSTA1: Phe10, Gly14, Ser18, Arg69, Leu72, Ile96, Glu97, Ala100, Ile106, Leu107, Leu108, Val111, His159, Met208, Leu213, and Phe222. From one experimental X-ray resolved structure, we performed all-atom classical molecular dynamics (MD) in explicit solvent of hGSTA1 enzyme (see Supplementary Materials for details about the MD protocol) in three different ligand-binding forms of the conjugation reaction cycle shown in Figure 1C: (i) its APO form, when there is no compound bound to GST, (ii) its GSH form, when the glutathione is bound to the G-site, and (iii) its GS-R form, when the glutathione-S-conjugated substrate is bound to the G and H sites, the substrate considered here being the 1-chloro-2,4-dinitrobenzene (CDNB). Another existing form of the hGSTA1 enzyme is not considered in the present work, i.e., the R form (substrate-bound). Indeed, the binding of the gluthatione ligand and of the substrate is not sequential. The substrate can bind first to GST and then the GSH, or the opposite way, as presented in Figure 1C.
Overall, the present study aims at deciphering the local conformational changes and shifts of populations of different local minima of the main chain and side chains of hGSTA1 enzyme in its three different ligand-binding forms. Predicting ligand-induced local free-energy changes is relevant both for understanding sequence–structure–function relationships in enzymes and also for structure-based drug design. From MD, we explore local conformational changes using internal coordinates, i.e., coarse-grained angles of the main chain and dihedral angles of the side chains. Dissimilarities between effective free-energy landscapes of the internal coordinates were established in order to identify the network of residues involved in the ligand-binding process of hGSTA1. Finally, the coupling between internal coordinates was revealed by analyzing the correlation of their motions using the principal component analysis, allowing the definition of collective motions to which these degrees of freedom contribute the most.

2. Materials and Methods

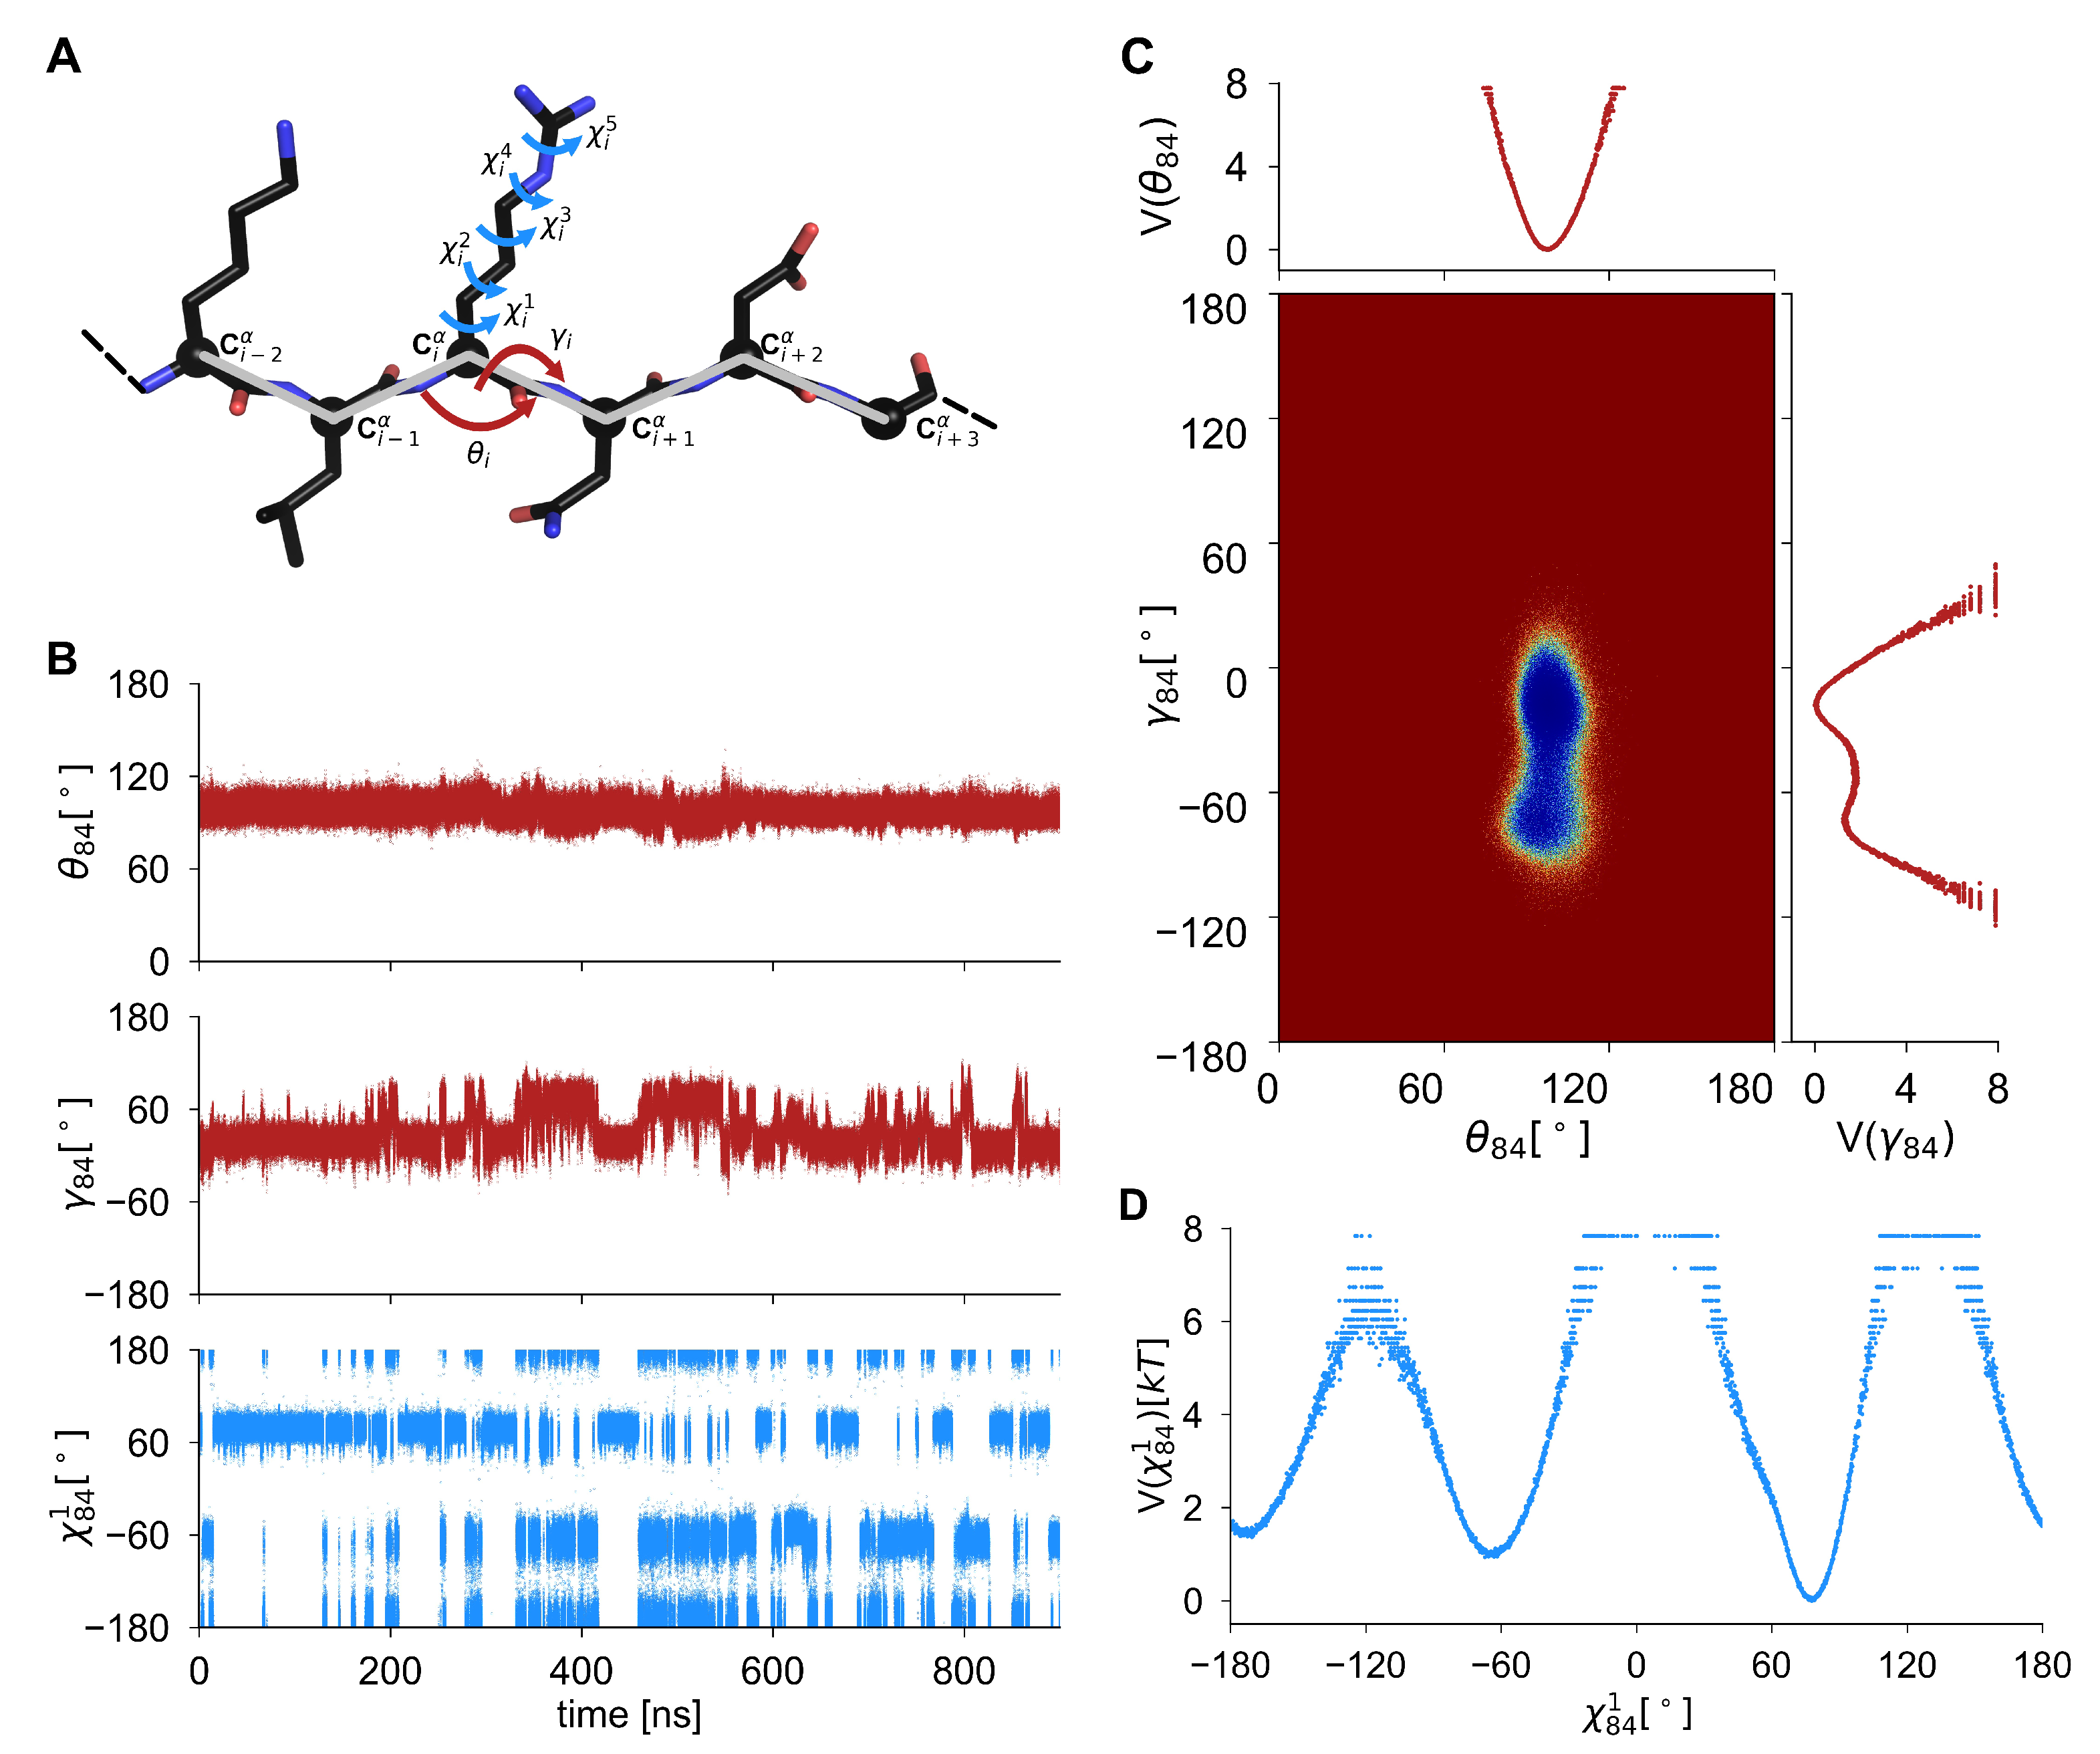
2.1. Internal Angles as Local Probes of the Protein Main and Side-Chain Conformational Changes

Local conformational changes of the main chain of human GSTA1 were analyzed using coarse-grained angles (CGAs) ( θ , γ ), which can be represented by a unit vector in spherical coordinates, where γ is the azimuth angle and θ the polar angle [25]. For a residue i along the amino-acid sequence (see Figure 2A), θ i is the bond angle formed by the virtual bonds joining three successive C α atoms ( i 1 , i and i + 1 ) and γ i is the dihedral angle formed by the virtual bonds joining four successive C α atoms ( i 1 , i, i + 1 and i + 2 ). The first pair of CGA ( θ , γ ) along the sequence is ( θ 2 , γ 2 ) and the last one is ( θ N 2 , γ N 2 ) , where N is the total number of residues. The convention for γ angles is the following: each angle varies between −180 and +180 , with γ = 0 being chosen when C i 1 α is cis to C i + 2 α and the clockwise rotation of C i + 1 α C i + 2 α is positive when looking from C i α to C i + 1 α . Because the length of the C α C α virtual bond between two consecutive residues is nearly constant, the main-chain conformation is entirely described by the main-chain bond angles θ and the main-chain torsional angles γ (Figure 2A). These CGAs ( θ , γ ) , which represent the torsion and curvature of the protein main chain and form a complete set of order parameters for protein folding [26], are part of coarse-grained protein models [27] and were used to analyze large conformational changes of proteins [28], protein folding, and dynamics in all-atom simulations [25,29,30] and conformational ensemble of intrinsically disordered proteins [31].
Moreover, local conformational changes of the side chains of human GSTA1 were analyzed using side-chain dihedral angles (SCAs) χ k . SCAs capture the rotation around C C or C N bonds of the side chain from its C β to its extremity. Each SCA is built from the coordinates of four successive atoms along the side chain of an amino acid. First of all, dihedral angle χ 1 is made of N C α C β X , where X depends on the amino acid. X can be S γ (Cys), O γ (Ser, Thr), or C γ for all the other amino acids except Gly and Ala, for which χ 1 dihedral angle is not defined. Second, χ 2 corresponds to the rotation around the bond C β C γ and is not defined for amino acids Gly, Ala, Cys, Ser, Thr, and Val. Third, χ 3 , corresponding to the rotation around the bond C γ C δ or C γ S δ (Met), is only defined for amino acids Gln, Glu, Met, Arg, and Lys. Finally, χ 4 are only defined for Arg and Lys amino acids and correspond to the rotation around the bond C δ C ϵ (Lys) or C δ N ϵ (Arg), and χ 5 is only defined for Arg and corresponds to the rotation of the side chain around the bond N ϵ C ζ (Figure 2A).

2.2. Free-Energy Surface, Free-Energy Profile, and Similarity Index

Effective 2D Free-Energy Surfaces (FESs) V ( θ i , γ i ) were computed for each pair of CGA ( θ i , γ i ) by using
V ( θ i , γ i ) = k B T log P ( θ i , γ i )
where k B is the Boltzmann constant, T is the temperature, and P ( θ i , γ i ) is the probability density function (PDF) of CGA pair ( θ i , γ i ) . Two-dimensional PDFs were computed on a sphere, using CGA time series (Figure 2B) extracted from concatenated MD trajectories for each hGSTA1 binding-state: APO (2 runs of 900 ns), GSH (2 runs of 900 ns), and GS-R (1 run of 1200 ns). An example of free-energy surface for CGA pair ( θ 84 , γ 84 ) (Gly83-Lys84-Asp85-Ile86) is shown in Figure 2C.
Then, to quantify the modifications between two FESs of identical CGA pair ( θ i , γ i ) due to different ligand-binding form of hGSTA1, i.e., APO vs. GSH, GSH vs. GS-R, or GS-R vs. APO, as shown in Figure 1C, we computed the similarity index H between their associated 2D PDFs using
H 1 | 2 ( θ i , γ i ) = 2 0 π sin θ i d θ i π + π P 1 ( θ i , γ i ) P 2 ( θ i , γ i ) d γ i 0 π sin θ i d θ i π + π P 1 ( θ i , γ i ) 2 d γ i + 0 π sin θ i d θ i π + π P 2 ( θ i , γ i ) 2 d γ i
where P 1 ( θ i , γ i ) is the PDF of CGA pair ( θ i , γ i ) in binding form 1 and P 2 ( θ i , γ i ) is the PDF of CGA pair ( θ i , γ i ) in binding form 2. The similarity index H varies between 0 (dissimilar) and 1 (identical). We consider similarity between 2 FESs to be (i) large if H > 0.70 , (ii) moderate if 0.30 H < 0.70 , and (iii) low if H < 0.3 , as per a previous work [28].
Similarly, effective 1D free-energy profiles (FEPs) V ( χ i k ) were computed for each SCA χ i k ( k = 1 , . . . , 5 ) by using
V ( χ i k ) = k B T log P ( χ i k )
where P ( χ i k ) is the PDF of the dihedral angle χ i k . One-dimensional PDFs were computed on a circle from time series extracted from MD (Figure 2B) using concatenated MD trajectories, as performed for 2D PDFs (see above). An example of free-energy profile for side-chain dihedral angle χ 84 1 (Lys) is shown in Figure 2D. Moreover, modifications between two FEPs of identical side-chain dihedral angle χ i k due to different ligand-binding forms of GST were quantified using the similarity index H between their associated 1D PDFs [28]:
H 1 | 2 ( χ i k ) = 2 π + π P 1 ( χ i k ) P 2 ( χ i k ) d χ i k π + π P 1 ( χ i k ) 2 d χ i k + π + π P 2 ( χ i k ) 2 d χ i k
where P 1 ( χ i k ) is the PDF of SCA ( θ i , γ i ) in binding form 1, and P 2 ( χ i k ) is the PDF of SCA ( χ i k ) in binding form 2. The same scale of similarity, as described above for FESs, is used to quantify similarities (large, moderate, and low).

3. Results

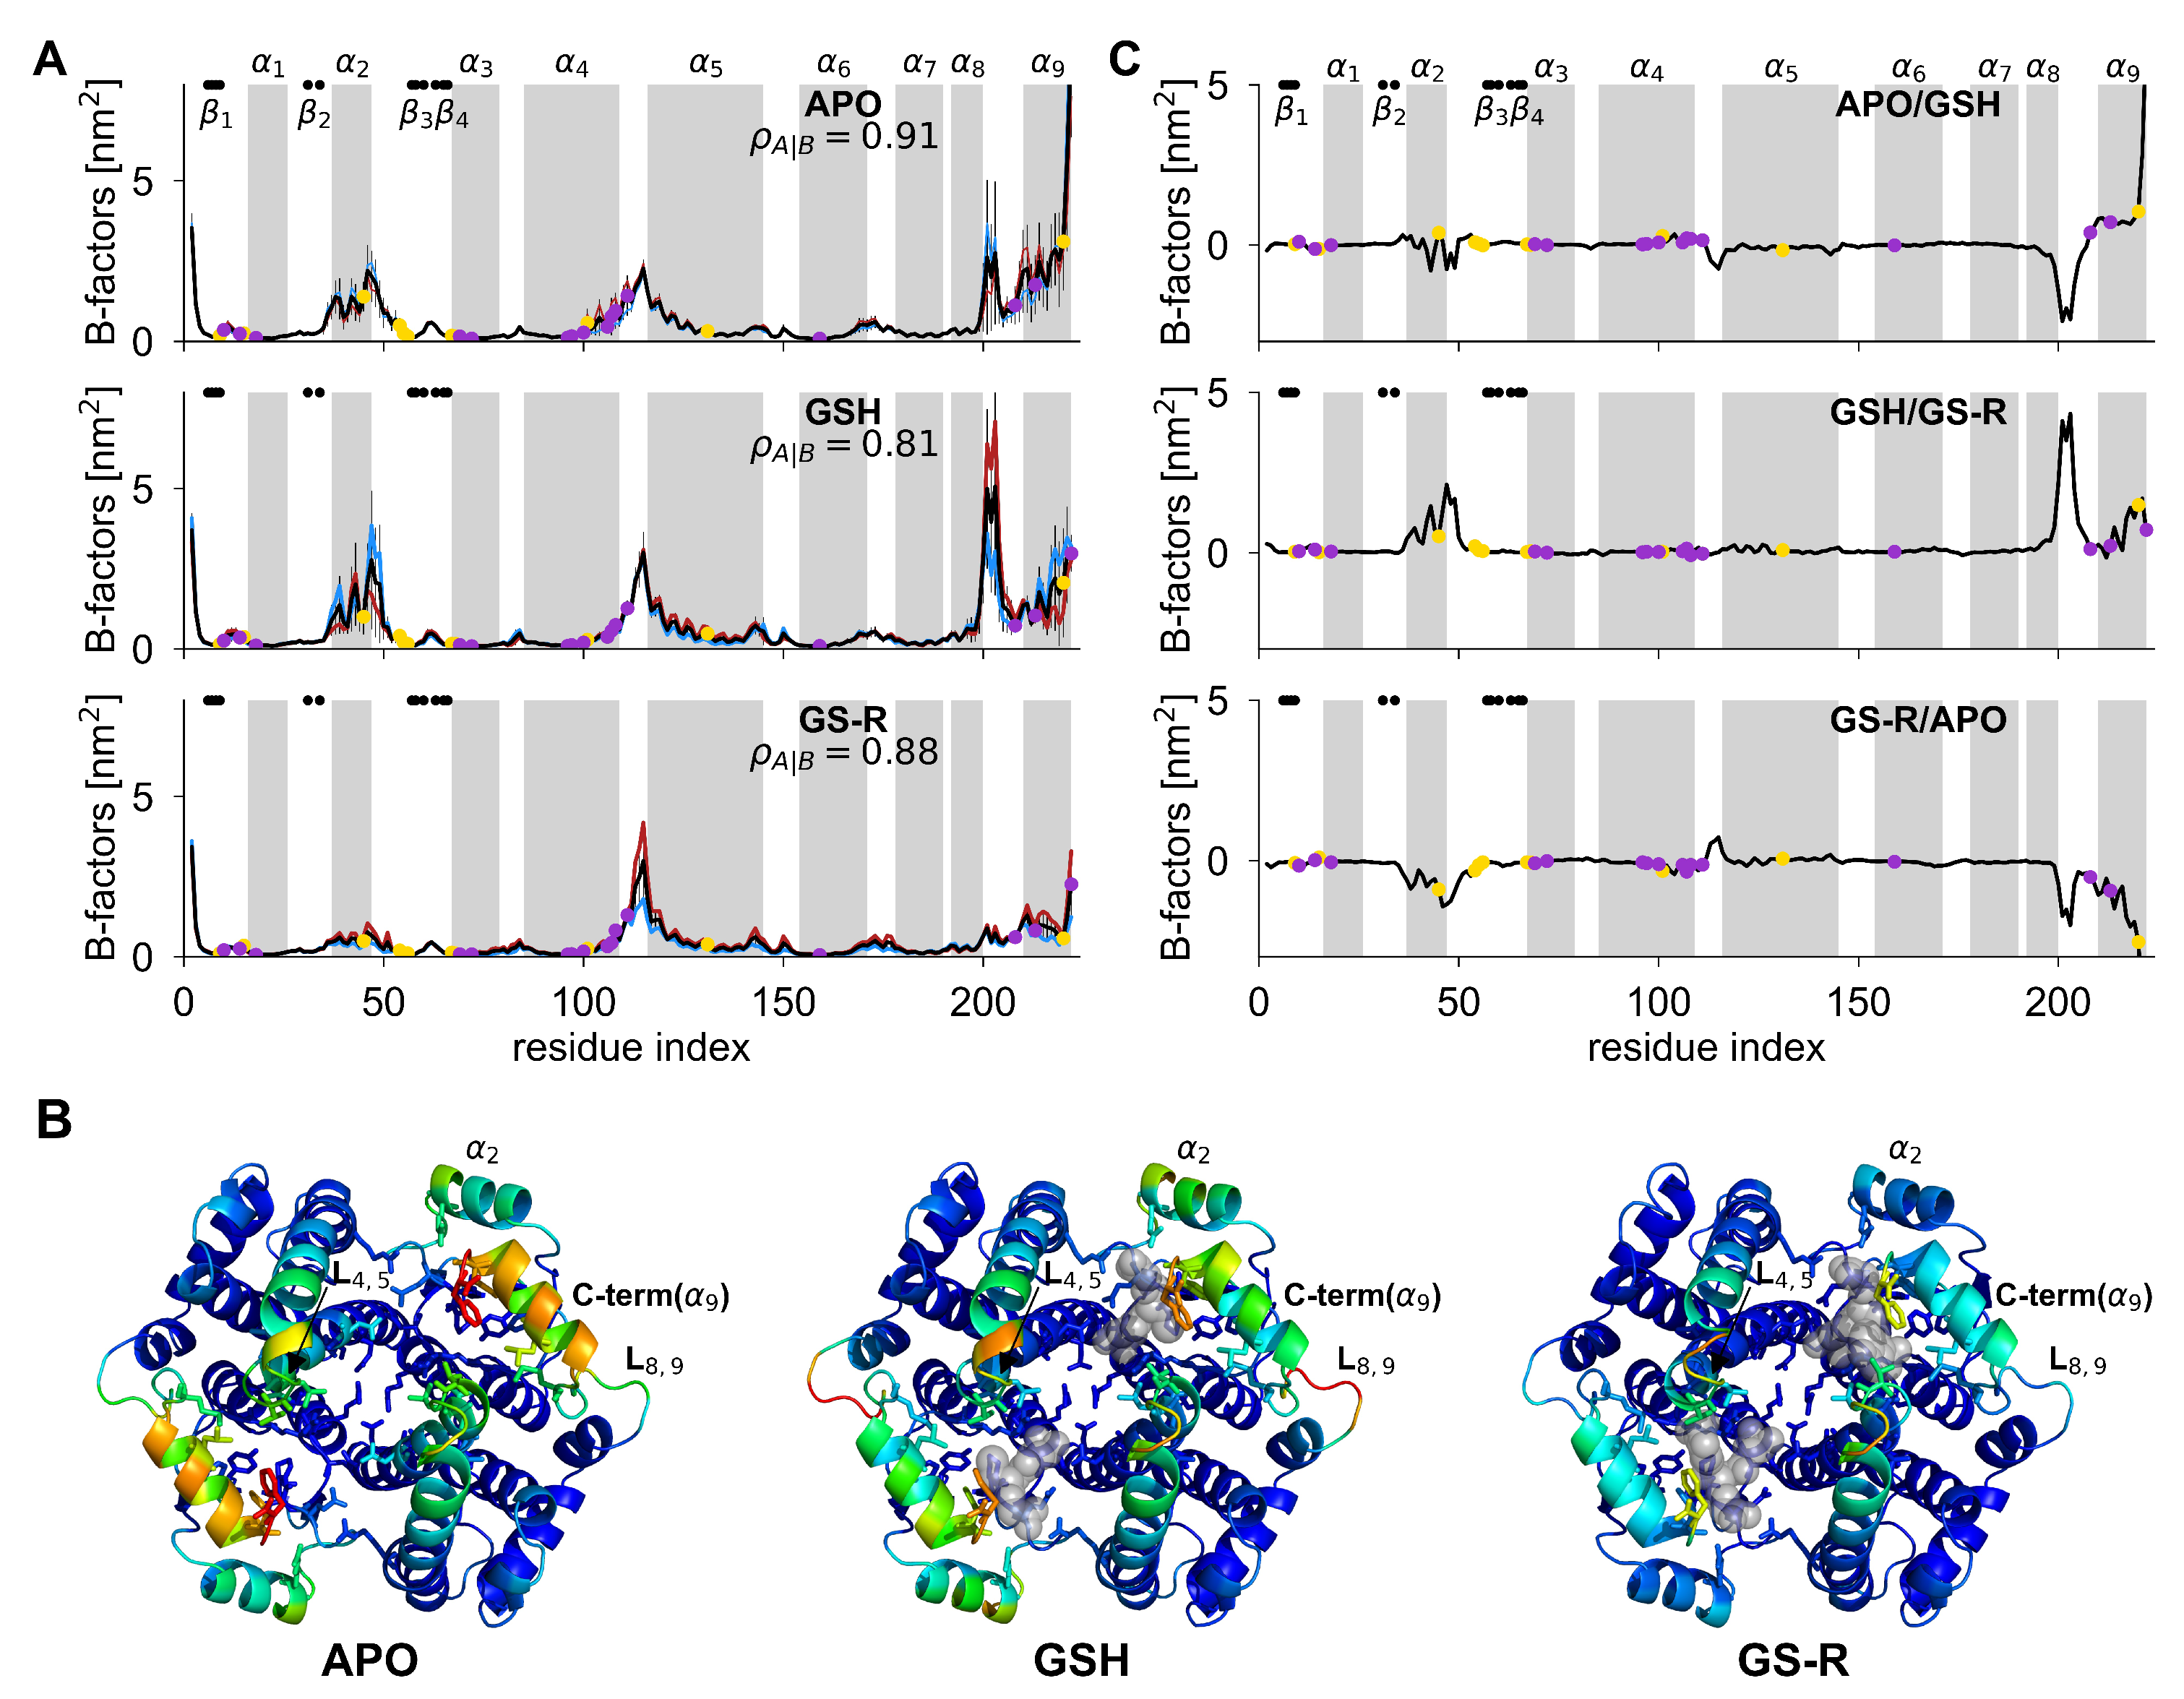
3.1. Structural Flexibility of Human GSTA1 in Its APO, GSH, and GS-R Form

Figure 3A presents thermal B-factors computed during MD simulations of hGSTA1 in its APO, GSH, and GS-R form. First, the correlation between B-factors of monomers A and B in each of the three forms independently is very high (more than 80%). Therefore, we compare average B-factors computed over the two monomers for each form. Overall, four regions of the hGSTA1 enzyme were found to exhibit a large flexibility (Figure 3B): the α 2 region (residues 38–50), which contains residue Arg45 that belongs to the G site; the loop between α 4 α 5 helices (residues 107–119), i.e., L 4 , 5 , which contains residues Leu107, Leu108, and Val111 that belong to the H site, the loop between α 8 α 9 helices, i.e., L 8 , 9 (residues 199–206), and, finally, the C-terminal region (residues 210–222) containing the α 9 helix with residues Phe220 and Phe222 that belong to the G and H sites, respectively. By computing the difference of flexibility of hGSTA1 between the three forms shown in Figure 1C, we found that the APO and GSH forms are more flexible than the GS-R form in the α 2 region, which contains residue Arg45. This flexibility in the absence of the substrate (APO and GSH forms) may promote its binding, the same region being constrained by the presence of the conjugated substrate (GS-R form). On the opposite, the loop and extremities of α 4 and α 5 helices are more flexible in the GS-R and GSH forms of hGSTA1 than in its APO form. It means that the presence of the ligand in the G and H sites of GST and, particularly, the interactions with residues Ala100, Asp101, Ile106, Leu107, Leu108, Val111, (in α 4 ) and Arg131 (in α 5 ) modify the flexibility of this region (Figure 1B). Moreover, the presence of GSH in the G site strongly increases the flexibility of the loop L 8 , 9 located a few residues away for the C-terminal helix α 9 of hGSTA1. This loop is also slightly flexible in the APO form and is not at all in the GS-R form. Last, but not least, the APO form of hGSTA1 shows a much larger flexibility in the C-terminal region (residue 210–222) than both the GSH and the GS-R forms. The sum of the B-factors in this region for each of the forms is 39, 21, and 12 nm 2 for APO, GSH, and GS-R, respectively. This result is in agreement with experimental observations showing that the protein flexibility of hGSTA1, including the dynamics of C-terminal α 9 helix on nanosecond-millisecond timescale and the protruding extremities of α 4 α 5 helices, contributes remarkably to the catalytic and noncatalytic ligand-binding functions of GSTs [32,33].

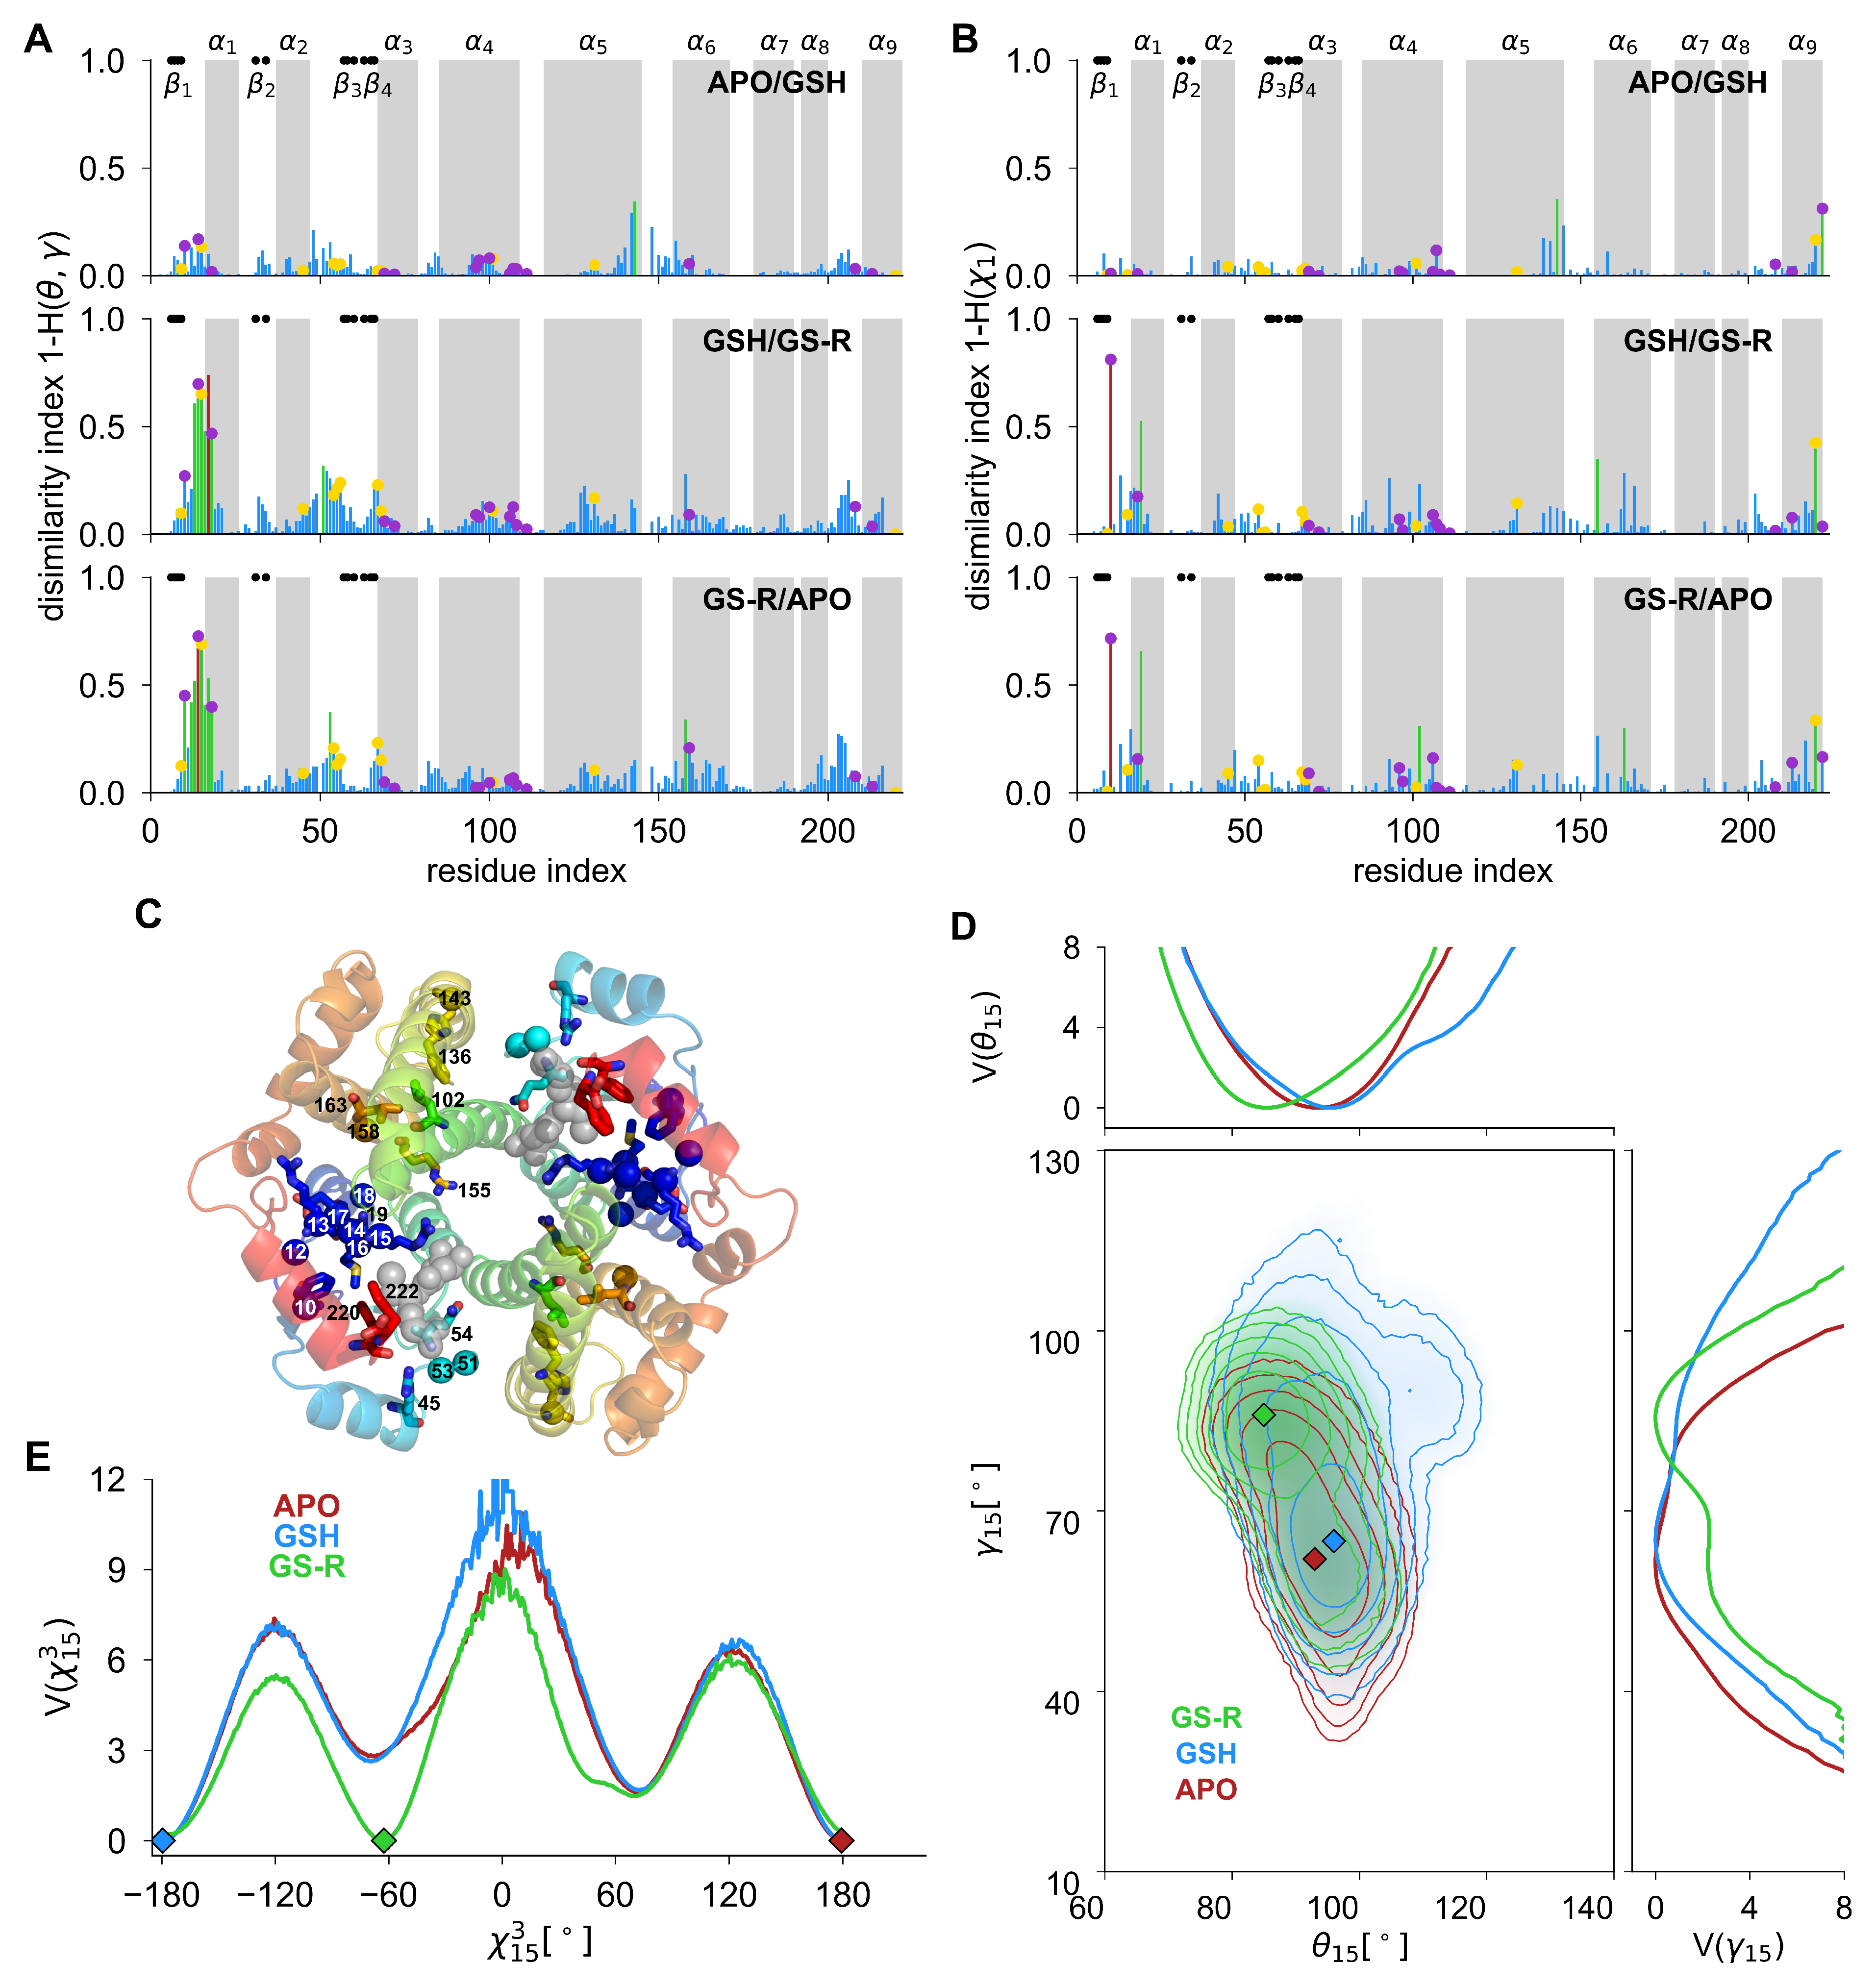
3.2. Identification of Key Residues Involved in Ligand Binding to hGSTA1 from Free-Energy Landscape Analysis of CGAs and SCAs

The network of residues influenced by ligand binding into hGSTA1 in the three different forms presented in Figure 1C is determined by computing similarity indices H between (i) 2D free-energy surfaces of CGAs ( θ , γ ) and (ii) 1D free-energy profiles of SCAs ( χ ) along the amino-acid sequence. First, only FESs that show large or moderate similarities ( H > 0.3 ) between monomers A and B of the homodimer are considered as the DATA. This ensures that non-converged FESs and FEPs between the two monomers are not taken into account. In fact, even though monomers A and B can have an asymmetrical dynamical behavior from MD due to the fact they are flexible monomers (sampling issue), no information can be exploited from these non-converged characteristics from a thermodynamical point of view. They might or might not be relevant to the conformational fluctuations of the protein. In total, 11 CGAs were excluded ( i = 50 for APO, i = 141 , 145 , 220 for GSH, and i = 144 , 146 , 147 , 149 , 217 , 218 , 219 , 220 for GS-R form). These CGAs are mainly located in the loop between helices α 5 and α 6 and in the C-terminal region, and they represent only 5% of the total number of CGAs ( N = 218 ).
Second, we computed similarity indices H between FESs of CGAs (from DATA) between the different forms of hGSTA1, (i) APO vs. GSH, (ii) GSH vs. GS-R, and (iii) GS-R vs. APO. Figure 4 shows dissimilarity 1 H along the amino-acid sequence for each comparison for both CGAs ( θ , γ ) (panel A) and SCAs χ 1 (panel B). On one hand, from APO vs. GSH comparison, only one CGA ( θ , γ ) i presents moderate similarity of its FES between the two forms. This result is not very surprising since at the microsecond timescale, the association/dissociation of GSH ligands from G sites of monomer A and B of hGSTA1 were observed during MD simulations (see Figure S3). It concerns CGA ( θ , γ ) 143 and involves residues Ser142, His143, Gly144, and Gln145, which are not directly involved in the ligand-binding sites of hGSTA1. However, these residues are located at the end of α 5 -helix, which contains residue Arg131 of the G site. On the other hand, comparisons involving the GS-R form of hGSTA1 present many more structural modifications. From GSH vs. GS-R comparison, seven CGAs ( θ , γ ) i present moderate or low similarities of their FESs between these two forms, for i = 13 , 14 , 15 , 16 , 17 , 18 , 51 . These seven CGAs involve 13 different amino acids with Gly14, Arg15, and Ser18, which are directly involved in the ligand-binding site of hGSTA1 (Figure 4C). Among the ten other residues detected and which are not located in the binding sites of hGSTA1, Arg20 is of great interest since this amino acid is highly conserved through GST classes. Moreover, by looking at FES of CGA ( θ , γ ) 15 in the three ligand-binding forms of hGSTA1 (Figure 4D), we show that both θ and γ angles are modified by the presence of gluathione-S-conjugated ligand compared to the APO and GSH forms. For instance, the global minimum of the FES V ( θ 15 ) is significantly shifted to lower values of θ and there is the creation of a new global minimum for V ( γ 15 ) in the GS-R form compared to the GSH form. It is also the case for residues 13 and 17 (see Figure S5). Therefore, the presence of GS-R ligand modifies the structure of hGSTA1 for some residues, which corresponds to an induced fit model of protein–ligand binding. On the opposite, for the comparison between the APO and GSH forms, the population shift model of protein–ligand binding is more pronounced since the similarity between FESs and FEPs is larger than comparisons with GS-R forms (Figure 4A,B).
Finally, 10 FESs of CGAs were identified as moderately or largely modified due to ligand binding for the comparison between GS-R and APO forms of hGSTA1. In detail, CGAs ( θ , γ ) i for i = 10 , 12 , 13 , 14 , 15 , 16 , 17 , 18 , 53 , and 158 were identified. Among these 10 CGAs, six were already detected from GSH vs. GS-R comparison (Table S1). It means that these six CGAs are GS-R specific, i.e., they are similar in the APO and GSH forms compared to the GS-R form. Particularly, CGA ( θ , γ ) 53 , which involves residues Gln54 and Val55, is of special interest since both residues belong to the G site. In addition, CGA ( θ , γ ) 158 , which involves residue His159, is also of special interest since this residue belongs to the H site. In total, from the three different comparisons of ligand-binding forms of hGSTA1 shown in Figure 4A, 12 unique CGAs were identified to be influenced by the absence/presence of a ligand; some of them being detected in two different comparisons (Table S1). It corresponds to a total of 26 different residues with four residues which belong to the G site (Tyr9, Arg15, Gln54, and Val55) and four residues which belong to the H site (Phe10, Gly14, Ser18, and His159). All 2D FESs of the 12 CGAs identified to be involved in the ligand binding process in hGSTA1 are presented in Figure S5.
We applied the exact same procedure to compare the one-dimensional FEPs of SCAs χ k . First, three amino acids were excluded from the DATA since they do not exhibit converged FEPs of SCAs between monomers A and B of hGSTA1. It concerns residues Glu146 ( χ 1 , 2 ), His159( χ 1 , 2 ), and Arg221 ( χ 1 , 2 , 3 , 4 , 5 ). It represents only 1.5% of the total number of residues characterized by SCAs ( N = 192 ). Then, from dissimilarity indices, 1 H , computed along the amino-acid sequence for the three different comparisons APO vs. GSH, GSH vs. GS-R, and GS-R vs. APO, as shown in Figure 4B for SCAs χ 1 and in Figure S3 for the other SCAs χ 2 , 3 , 4 , 5 , a total of 19 SCAs were identified to be influenced by the absence/presence of a ligand in the binding sites of hGSTA1 homodimer. It concerns 15 different residues, i.e., Phe10, Arg13, Arg15, Met16, Glu17, Thr19, Arg45, Gln54, Leu102, Phe136, His143, Arg155, Leu163, Phe220, and Phe222 (Table S1). Among these 15 residues, four are located in the G site (Arg15, Arg45, Gln54, and Phe220) and two in the H site (Phe10 and Phe222). In detail, the comparison between the APO and GSH forms of hGSTA1 highlights three SCAs, χ 143 1 , 2 and χ 222 1 (C-term). Particularly, residue His143 was also found to be crucial (the only one) for ligand binding from the analysis of the CGA ( θ i , γ i ) FESs. It means that residue His143 is an unexpected probe of ligand binding as both its local main chain conformation and its side chain are modified by the absence (APO) or presence (GSH) of the ligand, even though His143 is not directly located in the G or H binding site. In fact, this residue is at the surface of the hGSTA1 enzyme, at a distance around 30 Å from the binding sites.
Furthermore, 11 SCAs are found to show free-energy dissimilarities between their GSH and GS-R forms, i.e., χ 10 1 , 2 , χ 15 3 , χ 16 3 , χ 19 1 , χ 45 3 , χ 54 2 , χ 136 2 , χ 155 1 , 3 , and χ 220 1 . The six residues mentioned above for the comparison of APO vs. GSH forms and which belong to the G and H sites were also identified above from the comparison of CGA FESs for APO vs. GSH. In particular, SCA χ 15 3 is associated with Arg15 which is conserved in GST class Alpha and located at the interface between G and H sites. For this SCA, as shown in Figure 4E, the presence of GS-R ligand modifies the position of the global minimum of the FEP, from −180 in both APO and GSH forms to −60 . This local conformation exists in APO and GSH forms but as a local minimum (population shift). Finally, 12 SCAs were detected for the comparison GS-R vs. APO. Among these 12 SCAs, seven were already identified from the comparison GSH vs. GS-R, i.e., residues Phe10, Arg15, Met16, Thr19, Phe136, and Phe220 are, therefore, GS-R specific. The same kind of behavior was already observed for CGAs of the main chain with six coordinates GS-R specific. Among these six coordinates, residue Arg15 was identified, which support its case as one of the most important residues involved in ligand binding of hGSTA1. The five supplementary SCAs identified are χ 13 3 , χ 17 3 , χ 102 1 , and χ 163 1 , 2 , which correspond to residues Arg13, Glu17, Leu102, and Leu163. Particularly, Leu102 is located very close to the G site, Asp101 belonging to the G site and located in the opposite monomer of the dimer. All 1D FEPs of the 19 SCAs identified to be involved in the ligand binding process in hGSTA1 are presented in Figure S6.

3.3. Collective Motions of the Network of Residues Involved in Ligand Binding in hGSTA1 Revealed by PCA

As described in detail above, the free-energy landscape (FEL) comparison of CGAs ( θ , γ ) reveals that the absence/presence of ligands in hGSTA1 modifies at least 12 internal coordinates, located in both binding sites G and H or even further in the sequence (Figure 4C). In other words, the modification of the (unknown) free-energy landscape of hGSTA1 upon ligand binding can be represented here quantitatively by its projection over 12 dimensions. Obviously, these 12 coordinates are not independent and the local motions of the CGAs are coupled to each other. Hereafter, we establish the relation between these 12 local conformational changes by applying principal component analysis (see Supplementary Materials for details). From PCA for CGAs ( θ , γ ) in the three different forms of hGSTA1, we found that more than 30% of the total contribution to the MSF of the 12 CGAs is captured by the first two collective modes over the 72 existing ones (Figure S7). Then, we computed time series of the projections of vectors q i along the eigenvectors of collective modes 1 and 2, which defined the collective coordinates PC 1 and PC 2 . From the two-dimensional probability density functions of PC 1 and PC 2 time series computed from MD trajectories, the effective 2D FEL V 1 , 2 , shown in Figure 5, was computed for the three forms APO, GSH, and GS-R. The largest motions defined by the first and second PCs can be interpreted in terms of specific features of the two-dimensional FEL V 1 , 2 . The 2D FEL of the APO form of hGSTA1 presents two minima defined from the contour lines of free-energy (<2 k B T), whereas both GSH and GS-R forms present three minima. In addition, for GSH and GS-R forms, the different minima are well separated by energy barriers from around 3 to 4 k B T, whereas in the APO form, the two minima are separated by a barrier around 1 k B T. These 2D FELs are, in fact, in agreement with the observation that FEPs of θ and γ angles (Figure 4D and Figure S5) are more spread out and therefore contain more wells for GSH and GS-R forms in addition to the one(s) of the APO form.
From the 2D FEL shown in Figure 5A, the coupling between the 12 CGAs of the network identified as important for ligand binding in hGSTA1 was estimated by computing the influences of each coordinate into the largest amplitude collective motions, which are of particular interest for the biological function of proteins [34]. First of all, as shown in Figure 5B for each form, the dynamics of the 12 coordinates are highly asymmetrical between monomers A and B of hGSTA1. For collective mode 1 of APO, GSH, and GS-R forms, the contribution of monomer A is 66, 24, and 13%, respectively (with 34, 76, and 87% for monomer, B). For collective mode 2, the contribution of monomer A is even larger. Moreover, for the collective mode 1 of GSH form, the Pearson correlation of influences along the 12 CGAs is large, i.e., ρ A | B = 0.84 , whereas for the collective mode 2, the correlation is low, i.e., ρ A | B = 0.23 . However, PCA reveals two major dynamical couplings between residues. First, there is a coupling between CGAs 13–14–15 (including residues Gly14 of the H site and Arg15 of the G site) and CGAs 51, 53 (including residues Gln54 and Val55 of the G site) in the same monomer A or B. This coupling can be more or less pronounced between monomers and is modified by the presence of GS-R ligand, which modifies the location of CGA fluctuations in collective mode 1 (Figure 5B). Second, there is a coupling between the two binding sites of the two monomers, as shown particularly for CGAs 51, 53 in collective mode 1 for both APO and GSH form. This coupling is also present but is less pronounced in collective mode 2 of GS-R form. Therefore, dynamical coupling of intra-binding sites and inter-binding sites of hGSTA1 along the main chain of the enzyme was found and appears to be crucial for ligand binding in hGSTA1.
We applied the same procedure to the 19 SCAs detected from FEPs similarities. First, the two collective modes 1 and 2 contribute to 17, 18, and 36% for APO, GSH, and GS-R forms of hGSTA1, respectively (Figure S6). As shown in Figure 5C, 2D FELs V 1 , 2 from SCAs present much more minima than for CGAs. It comes from the fact that SCAs show unrestricted FEPs with values between −180 and +180 compared to CGAs. Moreover, the shape of the FEL for the GS-R form of hGSTA1 is much more different compared to the APO and GSH forms. The GS-R form of hGSTA1 explores the free-energy landscape less and is more restricted. However, the free-energy barriers between minima are much larger than the APO and GSH forms (up to 6 k B T), for which the multiple minima are more easily accessible to the system. This behavior is related to the fact that the binding of GS-R ligand, which is bigger than GSH ligand, involves more constraints on the side chains of the residues and, therefore, larger free-energy barriers to overcome. In addition, compared to CGAs, collective modes 1 and 2 are more spread out over the two monomers, particularly in the GSH form (Figure 5D). The analysis of the influences of each SCA in the collective motions of mode 1 and 2 reveals a strong coupling Leu163 and residue Glu17 and its neighbors in the G site in the APO form. In the GS-R form, the coupling is more pronounced with residue Arg155.

4. Discussion

From the three different comparisons of ligand-binding forms of human GSTA1 shown in Figure 1C, 12 CGAs and 19 SCAs were identified to be influenced by the absence/presence of ligands, most of them being gluthatione-S-conjugated-specific (Table S1). It corresponds to a total of 33 different amino acids (15% of the total sequence), eight of them being identified from both CGAs and SCAs analyses (Table 1). Among these 33 residues, 11 of them (32%) are directly located to the two binding sites of hGSTA1, with 6 which belong to the G site, i.e., Tyr9, Arg15, Arg45, Gln54, Val55, Phe220, and 5 which belong to the H site, i.e., Phe10, Gly14, Ser18, His159, and Phe222 (Figure S8). Furthermore, a collective motion involving residues Arg15, Gln54, and Val55 of the G site and residue Gly14 of the H site was identified using principal component analysis, revealing a strong coupling between these residues. Particularly, residue Arg15, which is found here to be involved in both local conformational changes of the main chain and of the side chains of hGSTA1, was demonstrated to have crucial catalytic activity both theoretically [35] and experimentally [36,37]. Finally, residues Phe220 (G site) and Phe222 (H site) belong to the C-terminal part of hGSTA1 ( α 9 -helix; see Figure S8) and it has been demonstrated that this secondary structure contributes remarkably to the catalytic and noncatalytic ligand-binding functions of GSTs [32,33].
At large distance from the ligand-binding sites of hGSTA1, 12 residues (from Leu102 to Leu163; see Table 1) were identified as sensitive to the ligand disturbance. For example, His143 is involved in the main-chain and side-chain conformational changes of hGSTA1 and is located around 30 Å away from the G and H sites Figure S8). Moreover, GST sequence analysis indicates that some residues form an highly conserved local sequence GXXh(T/S)XXDh (h: hydrophobic), constituted by the α 6 -helix and its preceding loop [38,39,40]. This motif belongs to a substructure named N-capping box and hydrophobic staple motif of GST and has been shown to be critical for the protein folding and stability [41]. In the present work, six residues were identified from the α 6 -helix, particularly Arg155, Asp157 (highly conserved), and Ile158 (hydrophobic) which belongs to the corresponding motif GNKLSRADI. According to experimental structures, Ile158 can form hydrophobic interactions with the α 1 -helix [41], which is an important structural element supporting the active binding site of GSTs.
Finally, it has been reported that the sequence alignment of all known GST structures (more than 100) shows that only 6–7 residues, i.e., less than 5% of the entire polypeptide chain, are strictly conserved [42]. For instance, Pro56 of the GST Alpha class, which belongs to the G site, is conserved through GST classes Mu, Pi, Sigma, Phi, Tau, Theta, Zeta, Omega, and Beta. In the present work, four amino acids, i.e., Arg13, Arg20, Val55, and Asp157, were detected and are highly conserved among GST classes. Particularly, Arg20 is strictly conserved through GST classes Alpha, Mu, Pi, Sigma, Tau, Zeta, and Omega; Arg13 is strictly conserved through GST classes Alpha, Mu, and Pi [43].

5. Conclusions

In the present work, we performed all-atom classical MD simulations in explicit solvent of human GSTA1 enzyme in the three different following forms of the protein: (i) the APO form, when no ligand is bound to hGSTA1, (ii) the GSH form, when the gluthatione ligand is bound to the G site of hGSTA1, and (iii) the GS-R form, when the gluthatione-S-conjugate is bound to the G and H sites of hGSTA1. From MD runs, we performed a free-energy landscape analysis of internal coordinates along the amino-acid sequence of the protein. The analysis was conducted using coarse-grained angles ( θ , γ ) of the main-chain (CGAs) and side-chain angles χ (SCAs), as local probe to track conformational changes. The comparison between each form of hGSTA1 reveals 12 CGAs and 19 SCAs influenced by the ligand binding into the G and H sites. It corresponds to a total of 33 residues of hGSTA1 which are involved in the protein–ligand binding process. Among the 33 residues identified, 11 of them belong to the two binding sites of hGSTA-1 identified experimentally from XRD structures, which confirms that the method developed and applied here is very robust. Finally, the dynamics of coarse-grained and side-chain angles were studied using principal component analysis. It shows an asymmetrical behavior between the two monomers of hGSTA1, particularly from CGAs. Moreover, the analysis of the first collective motions reveals a strong dynamical coupling between residues Arg15-Gln54-Val55 of the G site and Gly14 of the H site. These residues are coupled in the same binding site (intrasite) but also between the two binding sites of each monomer of hGSTA1 (intersites), which is an important result of the present work. Finally, residue Glu17 shows important coupling with residues Arg155 and Leu163, depending on the binding form of hGSTA1 (APO and GS-R, respectively). This free-energy landscape methodology, already applied successfully to chaperone proteins [28] and now to protein–ligand binding of human GSTA1 enzyme, is very powerful to identify network of residues and their dynamical coupling involved in the communication between domains or binding sites of biological systems. An important outcome of the present approach is its ability to decipher long-range effects, i.e., influence of residues far from the binding site on the ligand–protein association. This might guide engineered mutagenesis to tailor specific ligand–protein interactions.

Supplementary Materials

The following are available online at https://0-www-mdpi-com.brum.beds.ac.uk/article/10.3390/app12168196/s1, Section S1: details about MD protocol, structural stability of hGSTA1 dimer and monomers, ligand association/dissociation, and principal component analysis applied to internal angles coordinates. Figure S1: Identification of residues which belong to the G and H site of hGSTA1 from PDB structures. Figure S2: RMSD of hGSTA1 structures in the APO, GSH, and GS-R forms computed from MD trajectories. Figure S3: Distance between ligands and binding site G of hGSTA1 computed from MD trajectories. Figure S4: Dissimilarity index along the amino-acid sequence for side-chain angles χ . Figure S5: 2D free-energy surfaces V ( θ , γ ) for all coarse-grained angles identified to be influenced by ligand binding in hGSTA1. Figure S6: 1D free-energy profiles V ( χ ) for all side-chain dihedral angles identified to be influenced by ligand binding in hGSTA1. Figure S7: Contribution of collective modes extracted from PCA to the total fluctuations observed in MD. Figure S8: Cartoon structure of hGSTA1, with the network of residues relevant for ligand binding highlighted. Table S1: Summary of CGAs and SCAs involved in the ligand binding to hGSTA1 and extracted from similarity of FESs and FEPs. References [44,45,46,47,48,49,50,51,52,53,54,55,56,57] are cited in the supplementary materials.

Author Contributions

Conceptualization, A.N. and P.S.; methodology, A.N.; validation, A.N. and N.P.; formal analysis, P.G., N.P., and A.N.; software P.D.; data curation, P.G., N.P., and A.N.; writing—original draft preparation, A.N.; writing—review and editing, P.G., P.D., F.N., and P.S.; supervision, P.S.; project administration, P.S.; funding acquisition, P.S. All authors have read and agreed to the published version of the manuscript.

Funding

This work is supported by the EIPHI Graduate School (contrat ANR-17-EUR-0002) and the Conseil Régional de Bourgogne Franche-Comté.

Institutional Review Board Statement

Not applicable.

Informed Consent Statement

Not applicable.

Data Availability Statement

The data presented in this study are available in the article and supplementary materials.

Acknowledgments

The simulations were performed using HPC resources from DSI-CCuB (Université de Bourgogne).

Conflicts of Interest

The authors declare no conflict of interest.

References

  1. Du, X.; Li, Y.; Xia, Y.L.; Ai, S.M.; Liang, J.; Sang, P.; Ji, X.L.; Liu, S.Q. Insights into Protein–Ligand Interactions: Mechanisms, Models, and Methods. Int. J. Mol. Sci. 2016, 17, 144. [Google Scholar] [CrossRef] [PubMed]
  2. Li, L.; Koh, C.C.; Reker, D.; Brown, J.B.; Wang, H.; Lee, N.K.; Liow, H.h.; Dai, H.; Fan, H.M.; Chen, L.; et al. Predicting protein-ligand interactions based on bow-pharmacological space and Bayesian additive regression trees. Sci. Rep. 2019, 9, 7703. [Google Scholar] [CrossRef] [PubMed]
  3. Silva, J.L.; Vieira, T.C.R.G.; Gomes, M.P.B.; Bom, A.P.A.; Lima, L.M.T.R.; Freitas, M.S.; Ishimaru, D.; Cordeiro, Y.; Foguel, D. Ligand Binding and Hydration in Protein Misfolding: Insights from Studies of Prion and p53 Tumor Suppressor Proteins. Acc. Chem. Res. 2010, 43, 271–279. [Google Scholar] [CrossRef] [PubMed]
  4. Payandeh, J.; Volgraf, M. Ligand binding at the protein–lipid interface: Strategic considerations for drug design. Nat. Rev. Drug Discov. 2021, 20, 710–722. [Google Scholar] [CrossRef]
  5. Chakraborti, S.; Hatti, K.; Srinivasan, N. All That Glitters Is Not Gold’: High-Resolution Crystal Structures of Ligand-Protein Complexes Need Not Always Represent Confident Binding Poses. Int. J. Mol. Sci. 2021, 22, 6830. [Google Scholar] [CrossRef]
  6. Mannervik, B. The isoenzymes of glutathione transferase. Adv. Enzymol. Relat. Areas Mol. Biol. 1985, 57, 357–417. [Google Scholar] [CrossRef]
  7. Armstrong, R.N. Structure, Catalytic Mechanism, and Evolution of the Glutathione Transferases. Chem. Res. Toxicol. 1997, 10, 2–18. [Google Scholar] [CrossRef]
  8. Hayes, J.D.; Flanagan, J.U.; Jowsey, I.R. Glutathione transferases. Annu. Rev. Pharmacol. Toxicol. 2005, 45, 51–88. [Google Scholar] [CrossRef]
  9. Booth, J.; Boyland, E.; Sims, P. An enzyme from rat liver catalysing conjugations with glutathione. Biochem. J. 1961, 79, 516–524. [Google Scholar] [CrossRef]
  10. Combes, B.; Stakelum, G.S. A liver enzyme that conjugates sulfobromophthalein sodium with glutathione. J. Clin. Investig. 1961, 40, 981–988. [Google Scholar] [CrossRef]
  11. Axarli, I.; Rigden, D.; Labrou, N. Characterization of the ligandin site of maize glutathione S-transferase I. Biochem. J. 2004, 382, 885–893. [Google Scholar] [CrossRef] [PubMed]
  12. Oakley, A. Glutathione transferases: A structural perspective. Drug. Metab. Rev. 2011, 43, 138–151. [Google Scholar] [CrossRef]
  13. Mannervik, B.; Awasthi, Y.C.; Board, P.G.; Hayes, J.D.; Di Ilio, C.; Ketterer, B.; Listowsky, I.; Morgenstern, R.; Muramatsu, M.; Pearson, W.R. Nomenclature for human glutathione transferases. Biochem. J. 1992, 282, 305–306. [Google Scholar] [CrossRef] [PubMed]
  14. Dirr, H.; Reinemer, P.; Huber, R. X-ray crystal structures of cytosolic glutathione S-transferases. Eur. J. Biochem. 1994, 220, 645–661. [Google Scholar] [CrossRef] [PubMed]
  15. Lien, S.; Gustafsson, A.; Andersson, A.K.; Mannervik, B. Human Glutathione Transferase A1-1 Demonstrates Both Half-of-the-sites and All-of-the-sites Reactivity. J. Biol. Chem. 2001, 276, 35599–35605. [Google Scholar] [CrossRef]
  16. Bocedi, A.; Fabrini, R.; Bello, M.L.; Caccuri, A.M.; Federici, G.; Mannervik, B.; Cornish-Bowden, A.; Ricci, G. Evolution of Negative Cooperativity in Glutathione Transferase Enabled Preservation of Enzyme Function. J. Biol. Chem. 2016, 291, 26739–26749. [Google Scholar] [CrossRef]
  17. Fabrini, R.; De Luca, A.; Stella, L.; Mei, G.; Orioni, B.; Ciccone, S.; Federici, G.; Lo Bello, M.; Ricci, G. Monomer-Dimer Equilibrium in Glutathione Transferases: A Critical Re-Examination. Biochemistry 2009, 48, 10473–10482. [Google Scholar] [CrossRef]
  18. Frova, C. Glutathione transferases in the genomics era: New insights and perspectives. Biomol. Eng. 2006, 23, 149–169. [Google Scholar] [CrossRef]
  19. Board, P.G.; Menon, D. Glutathione transferases, regulators of cellular metabolism and physiology. Biochim. Biophys. Acta 2013, 1830, 3267–3288. [Google Scholar] [CrossRef]
  20. Atkinson, H.J.; Babbitt, P.C. An Atlas of the Thioredoxin Fold Class Reveals the Complexity of Function-Enabling Adaptations. PLoS Comput. Biol. 2009, 5, e1000541. [Google Scholar] [CrossRef]
  21. Deponte, M. Glutathione catalysis and the reaction mechanisms of glutathione-dependent enzymes. Biochim. Biophys. Acta 2013, 1830, 3217–3266. [Google Scholar] [CrossRef] [PubMed]
  22. Mannervik, B.; Danielson, U.H. Glutathione transferases–Structure and catalytic activity. CRC Crit. Rev. Biochem. 1988, 23, 283–337. [Google Scholar] [CrossRef] [PubMed]
  23. Cummins, I.; Dixon, D.P.; Freitag-Pohl, S.; Skipsey, M.; Edwards, R. Multiple roles for plant glutathione transferases in xenobiotic detoxification. Drug. Metab. Rev. 2011, 43, 266–280. [Google Scholar] [CrossRef] [PubMed]
  24. Wilce, M.C.; Parker, M.W. Structure and function of glutathione S-transferases. Biochim. Biophys. Acta 1994, 1205, 1–18. [Google Scholar] [CrossRef]
  25. Nicolaï, A.; Delarue, P.; Senet, P. Intrinsic Localized Modes in Proteins. Sci. Rep. 2015, 5, 18128. [Google Scholar] [CrossRef]
  26. Grassein, P.; Delarue, P.; Nicolaï, A.; Neiers, F.; Scheraga, H.A.; Maisuradze, G.G.; Senet, P. Curvature and Torsion of Protein Main Chain as Local Order Parameters of Protein Unfolding. J. Phys. Chem. B 2020, 124, 4391–4398. [Google Scholar] [CrossRef]
  27. Maisuradze, G.G.; Senet, P.; Czaplewski, C.; Liwo, A.; Scheraga, H.A. Investigation of protein folding by coarse-grained molecular dynamics with the UNRES force field. J. Phys. Chem. A 2010, 114, 4471–4485. [Google Scholar] [CrossRef]
  28. Nicolaï, A.; Delarue, P.; Senet, P. Decipher the Mechanisms of Protein Conformational Changes Induced by Nucleotide Binding through Free-Energy Landscape Analysis: ATP Binding to Hsp70. PLoS Comput. Biol. 2013, 9, e1003379. [Google Scholar] [CrossRef]
  29. Senet, P.; Maisuradze, G.G.; Foulie, C.; Delarue, P.; Scheraga, H.A. How main-chains of proteins explore the free-energy landscape in native states. Proc. Natl. Acad. Sci. USA 2008, 105, 19708–19713. [Google Scholar] [CrossRef]
  30. Cote, Y.; Senet, P.; Delarue, P.; Maisuradze, G.G.; Scheraga, H.A. Anomalous diffusion and dynamical correlation between the side chains and the main chain of proteins in their native state. Proc. Natl. Acad. Sci. USA 2012, 109, 10346–10351. [Google Scholar] [CrossRef]
  31. Guzzo, A.; Delarue, P.; Rojas, A.; Nicolaï, A.; Maisuradze, G.G.; Senet, P. Missense Mutations Modify the Conformational Ensemble of the alpha-Synuclein Monomer Which Exhibits a Two-Phase Characteristic. Front. Mol. Biosci. 2021, 8, 786123. [Google Scholar] [CrossRef] [PubMed]
  32. Wu, B.; Dong, D. Human cytosolic glutathione transferases: Structure, function, and drug discovery. Trends Pharmacol. Sci. 2012, 33, 656–668. [Google Scholar] [CrossRef] [PubMed]
  33. Honaker, M.T.; Acchione, M.; Zhang, W.; Mannervik, B.; Atkins, W.M. Enzymatic detoxication, conformational selection, and the role of molten globule active sites. J. Biol. Chem. 2013, 288, 18599–18611. [Google Scholar] [CrossRef] [PubMed]
  34. Berendsen, H.J.; Hayward, S. Collective protein dynamics in relation to function. Curr. Opin. Struct. Biol. 2000, 10, 165–169. [Google Scholar] [CrossRef]
  35. Dourado, D.F.A.R.; Fernandes, P.A.; Mannervik, B.; Ramos, M.J. Glutathione transferase A1-1: Catalytic importance of arginine 15. J. Phys. Chem. B 2010, 114, 1690–1697. [Google Scholar] [CrossRef]
  36. Björnestedt, R.; Stenberg, G.; Widersten, M.; Board, P.G.; Sinning, I.; Alwyn Jones, T.; Mannervik, B. Functional significance of arginine 15 in the active site of human class alpha glutathione transferase A1-1. J. Mol. Biol. 1995, 247, 765–773. [Google Scholar] [CrossRef]
  37. Gildenhuys, S.; Dobreva, M.; Kinsley, N.; Sayed, Y.; Burke, J.; Pelly, S.; Gordon, G.P.; Sayed, M.; Sewell, T.; Dirr, H.W. Arginine 15 stabilizes an S(N)Ar reaction transition state and the binding of anionic ligands at the active site of human glutathione transferase A1-1. Biophys. Chem. 2010, 146, 118–125. [Google Scholar] [CrossRef]
  38. Aceto, A.; Dragani, B.; Melino, S.; Allocati, N.; Masulli, M.; Di Ilio, C.; Petruzzelli, R. Identification of an N-capping box that affects the alpha 6-helix propensity in glutathione S-transferase superfamily proteins: A role for an invariant aspartic residue. Biochem. J. 1997, 322 Pt 1, 229–234. [Google Scholar] [CrossRef]
  39. Dragani, B.; Stenberg, G.; Melino, S.; Petruzzelli, R.; Mannervik, B.; Aceto, A. The conserved N-capping box in the hydrophobic core of glutathione S-transferase P1-1 is essential for refolding. Identification of a buried and conserved hydrogen bond important for protein stability. J. Biol. Chem. 1997, 272, 25518–25523. [Google Scholar] [CrossRef]
  40. Stenberg, G.; Dragani, B.; Cocco, R.; Mannervik, B.; Aceto, A. A Conserved “Hydrophobic Staple Motif” Plays a Crucial Role in the Refolding of Human Glutathione Transferase P1-1. J. Biol. Chem. 2000, 275, 10421–10428. [Google Scholar] [CrossRef]
  41. Cocco, R.; Stenberg, G.; Dragani, B.; Principe, D.R.; Paludi, D.; Mannervik, B.; Aceto, A. The Folding and Stability of Human Alpha Class Glutathione Transferase A1-1 Depend on Distinct Roles of a Conserved N-capping Box and Hydrophobic Staple Motif. J. Biol. Chem. 2001, 276, 32177–32183. [Google Scholar] [CrossRef] [PubMed]
  42. Atkinson, H.J.; Babbitt, P.C. Glutathione Transferases Are Structural and Functional Outliers in the Thioredoxin Fold. Biochemistry 2009, 48, 11108–11116. [Google Scholar] [CrossRef] [PubMed]
  43. Stenberg, G.; Board, P.G.; Carlberg, I.; Mannervik, B. Effects of directed mutagenesis on conserved arginine residues in a human Class Alpha glutathione transferase. Biochem. J. 1991, 274 Pt 2, 549–555. [Google Scholar] [CrossRef]
  44. Grahn, E.; Novotny, M.; Jakobsson, E.; Gustafsson, A.; Grehn, L.; Olin, B.; Madsen, D.; Wahlberg, M.; Mannervik, B.; Kleywegt, G.J. New crystal structures of human glutathione transferase A1-1 shed light on glutathione binding and the conformation of the C-terminal helix. Acta Cryst. D 2006, 62, 197–207. [Google Scholar] [CrossRef]
  45. Abraham, M.J.; van der Spoel, D.; Lindahl, E.; Hess, B. ; The GROMACS Development Team. GROMACS User Manual Version 5.1.5; GROMACS: Groningen, The Netherlands, 2017. [Google Scholar]
  46. Best, R.B.; Hummer, G. Optimized Molecular Dynamics Force Fields Applied to the Helix-Coil Transition of Polypeptides. J. Phys. Chem. B 2009, 113, 9004–9015. [Google Scholar] [CrossRef] [PubMed]
  47. Lindorff-Larsen, K.; Piana, S.; Palmo, K.; Maragakis, P.; Klepeis, J.L.; Dror, R.O.; Shaw, D.E. Improved side-chain torsion potentials for the Amber ff99SB protein force field. Proteins 2010, 78, 1950–1958. [Google Scholar] [CrossRef]
  48. Best, R.B.; de Sancho, D.; Mittal, J. Residue-Specific a-Helix Propensities from Molecular Simulation. Biophys. J. 2012, 102, 1462–1467. [Google Scholar] [CrossRef]
  49. Jorgensen, W.L.; Chandrasekhar, J.; Madura, J.D.; Impey, R.W.; Klein, M.L. Comparison of simple potential functions for simulating liquid water. J. Chem. Phys. 1983, 79, 926–935. [Google Scholar] [CrossRef]
  50. Wang, J.; Wang, W.; Kollman, P.A.; Case, D.A. Automatic atom type and bond type perception in molecular mechanical calculations. J. Mol. Graph. Model 2006, 25, 247–260. [Google Scholar] [CrossRef]
  51. Wang, J.; Wolf, R.M.; Caldwell, J.W.; Kollman, P.A.; Case, D.A. Development and testing of a general amber force field. J. Comput. Chem. 2004, 25, 1157–1174. [Google Scholar] [CrossRef]
  52. Sousa da Silva, A.W.; Vranken, W.F. ACPYPE—AnteChamber PYthon Parser interfacE. BMC Res. Notes 2012, 5, 367. [Google Scholar] [CrossRef] [PubMed]
  53. Hess, B.; Bekker, H.; Berendsen, H.J.C.; Fraaije, J.G.E.M. LINCS: A linear constraint solver for molecular simulations. J. Comput. Chem. 1997, 18, 1463–1472. [Google Scholar] [CrossRef]
  54. Bussi, G.; Donadio, D.; Parrinello, M. Canonical sampling through velocity rescaling. J. Chem. Phys. 2007, 126, 014101. [Google Scholar] [CrossRef]
  55. Parrinello, M.; Rahman, A. Polymorphic transitions in single crystals: A new molecular dynamics method. J. Appl. Phys. 1981, 52, 7182–7190. [Google Scholar] [CrossRef]
  56. Darden, T.; York, D.M.; Pedersen, N.L. Particle mesh Ewald: An N.log(N) method for Ewald sums in large systems. J. Chem. Phys. 1993, 98, 10089. [Google Scholar] [CrossRef]
  57. Altis, A.; Nguyen, P.H.; Hegger, R.; Stock, G. Dihedral angle principal component analysis of molecular dynamics simulations. J. Chem. Phys. 2007, 126, 244111. [Google Scholar] [CrossRef]
Figure 1. (A) Cartoon representation of human GSTA1 monomer structures. Left panel: subdomains (I) and (II) are indicated in magenta and red, respectively. Right panel: the color code is the following: N-term (blue) to C-term (red). Secondary structures labels are also indicated. (B) Ligand binding G (top panel) and H (bottom panel) sites of human GSTA1. Ligands are shown in green spheres, and residues belonging to the binding sites are shown in yellow and purple sticks, respectively. The color code is the following: hGSTA1 monomer A in red, hGSTA1 monomer B in blue. (C) Catalytic cycle of GSH conjugation to electrophilic substrate. Three forms of hGSTA1 during the conjugation reaction cycle are highlighted: APO (no-compound-bound), GSH (glutathione-bound), and GS-R (gluthatione-S-conjugated substrate). The R form (substrate-bound) is not considered in the present work. The color code is the same as in panel (B).
Applsci 12 08196 g001
Figure 2. (A) Cartoon representation of CGAs ( θ , γ ) and SCAs ( χ k ) used as local probes to track local conformational changes in hGSTA1 from MD. C α atoms are shown with black spheres. The main chain and side chains of each residue are shown in sticks. (B) Time series of CGAs θ (top panel), γ (middle panel), and SCA χ 1 (bottom panel) for residue 84, as an example, recorded during run 1 of hGSTA1 in its APO form. (C) Effective free-energy surface V ( θ , γ ) 84 computed from time series shown in panel (B). Effective free-energy profiles of each internal coordinate θ 84 and γ 84 are also presented. (D) Effective free-energy profile V ( χ 1 ) 84 computed from time series shown in panel B.
Applsci 12 08196 g002
Figure 3. (A) Thermal B-factors of hGSTA1 computed from MD in its three different forms: APO (top), GSH (middle), and GS-R (bottom) panel. Yellow and purple circles correspond to residue that belongs to the G and H site, respectively. Gray rectangles indicate residues in α helix, and black circles at the top of each plot represent residues in β -sheets. The Pearson correlation between monomers A and B, ρ A | B , is also indicated for each form. (B) Cartoon representation of hGSTA1 structures colored according to their B-factors in its three different forms: APO (top), GSH (middle), and GS-R (bottom) panel. Ligand is shown in transparent spheres, and residues which belong to the G and H sites of each monomer are shown in stick. Secondary structures of interest (see text) are also indicated: α 2 helix; the loop between α 4 α 5 helices, i.e., L 4 , 5 ; the loop between α 8 α 9 helices, i.e., L 8 , 9 and the C-terminal region ( α 9 helix). The color code used is rainbow, from blue to red color corresponding to 0 and 5 nm 2 , respectively. (C) Difference of B-factors between two different forms of hGSTA1. (Top) panel: APO vs. GSH, (middle) panel: GSH vs. GS-R, and (bottom) panel: GS-R vs. APO.
Applsci 12 08196 g003
Figure 4. (A) Dissimilarity index 1 H along the amino-acid sequence computed from FESs of CGAs ( θ , γ ) . The color code is the following: low dissimilarity: blue, moderate dissimilarity: green, large dissimilarity: red (see Materials and Methods, Section 2.2). Yellow and purple circles correspond to residue that belongs to the G and H site, respectively. Gray rectangles indicate residues in α helix, and black circles at the top of each plot represent residues in β -sheets. (B) Dissimilarity index 1 H along the amino-acid sequence computed from FEPs of SCAs χ 1 . The color code is the same as in panel A. (C) Location of CGAs and SCAs detected from free-energy landscape analysis in the hGSTA1 structure. The color code is the following: N-term (blue) to C-term (red). (D) Effective 2D FESs V ( θ , γ ) 15 in the APO, GSH, and GS-R forms of hGSTA1. Effective 1D FEPs of each internal coordinate θ 15 and γ 15 are also presented. (E) Effective FEPs V ( χ 3 ) 15 in the APO, GSH, and GS-R forms of hGSTA1. Diamonds indicate the global minimum in each form.
Applsci 12 08196 g004
Figure 5. (A) 2D FEL computed from PCA applied on CGAs for hGSTA1 in its APO (left panel), GSH (center panel), and GS-R (right panel) forms. Contours (black lines) are drawn every k B T. The color scale for the free-energy is in k B T unit. (B) Influences Δ i k as a function of CGAs i for collective modes k = 1 , 2 computed from PCA. Left panels concern the APO form, middle panels the GSH form, and right panels the GS-R form. Values in inset represent the percentage of contribution for the two monomers A and B of hGSTA1. (C) 2D FEL computed from PCA applied on SCAs for hGSTA1 in its APO (left panel), GSH (center panel), and GS-R (right panel) forms. (D) Influences Δ i k as a function of SCAs i for collective modes k = 1 , 2 computed from PCA.
Applsci 12 08196 g005
Table 1. Summary of amino acids involved in the ligand binding to hGSTA1 and extracted from similarity of FESs of CGAs and FEP of SCAs. Amino acids, which were detected from both analyses, are underlined. Amino acids, which are highly conserved among GSTs, are denoted in bold. Secondary structure location of amino acids are indicated in parentheses.
LocationList of Amino Acids
G siteTyr9 ( β 1 ), Arg15 (L β 1 , α 1 ), Arg45 ( α 2 ), Gln54, Val55 (L α 2 , β 3 ), Phe220 ( α 9 )
H sitePhe10, Gly14 (L β 1 , α 1 ), Ser18 ( α 1 ), His159 ( α 6 ), Phe222 ( α 9 )
OthersAsn11, Ala12, Arg13 (L β 1 , α 1 ), Met16, Glu17, Thr19, Arg20 ( α 1 ), Leu50, Met51, Phe52, Gln53 (L α 2 , β 3 ), Leu102 ( α 4 ), Phe136, Ser142, His143, Gly144, Gln145 ( α 5 ), Arg155, Asp157, Ile158, Leu160, Leu163 ( α 6 )
Publisher’s Note: MDPI stays neutral with regard to jurisdictional claims in published maps and institutional affiliations.

