
Constructing a Gaming Model for Professional Tennis Players Using the C5.0 Algorithm


Department of Recreational & Graduate Institute of Recreational Sport Management, National Taiwan University of Sport, Taichung City 404, Taiwan
*
Author to whom correspondence should be addressed.
Appl. Sci. 2022, 12(16), 8222; https://0-doi-org.brum.beds.ac.uk/10.3390/app12168222
Submission received: 30 June 2022
/
Revised: 14 August 2022
/
Accepted: 15 August 2022
/
Published: 17 August 2022
(This article belongs to the Special Issue Advances in Sports Performance Analysis)
Abstract
:Professional tennis players have their own habits of tactics and play. However, players’ shortcomings can be corrected by constantly practicing professional techniques and by tactical analysis. Therefore, this study aimed to develop a two-stage, expert decision-making system for tennis matches. The first stage consisted in dividing the court area and defining the technical classification of the net. Tennis coaches were invited to assess tennis players’ skills on the competition court, dividing it into 48 areas on both sides of the court centerline and identifying the skills used by the players. In the second stage, a classification model was developed, and the score, hitting habits, and tennis skills of the players, Roger Federer and Rafael Nadal, over 10 matches, played from 2007 to 2019, were analyzed and classified using notational analysis and the C5.0 decision tree algorithm. The results show that the two players’ highest scored techniques were the forehand stroke in the backcourt and the backhand stroke in the half court. Thus, using this expert decision-making system, our data can provide other players with imaginary training objects from two of the top players in the world to be used during training and can allow the accumulation of experience for players through continuous simulation and training analysis.
1. Introduction
Most coaches categorize tennis players into four different playing styles: aggressive baseliner, serve-and-volleyer, counterpuncher, and all-court player [1,2]. The use of basic moves is indispensable to accomplish good performance in in this sport. In addition, perfect basic moves need to be matched with playing tactics for a chance to win the game. In a tennis match, there are five main types of hitting techniques used by players: forehand, backhand, volley, serve, and smash. During the game, aside from possessing good skills, physical strength, tactics, psychological resources, and strategies, players must have excellent ball-control ability to cope with various types of games. To achieve the best results, these strategies require continuous simulation, training, and the accumulation of experience. Jannah et al. [3] proposed that the most advantageous striking styles can be exerted only after one’s personal striking characteristics are duly considered and evaluated. According to Martínez, in tennis games, techniques must be combined with strategic tactics to be effectively used on the court [4].
Having a playing style characterized by both attacks and defense is a factor that affects world tennis rankings in the opinion of Huang and Hsieh [5]. This includes performance in eight skill areas: the dominance ratio, ace rate, double-fault rate, first-serve rate, winning on the first-serve rate, winning on the second-serve rate, the receiving-point win-rate, and the receiving break-point [6]. Reid et al. [7] found that the key factors affecting the outcome of a game include mastering the serve in games by increasing the scoring rate through serving, being aggressive and stable for confrontation at the baseline, and reducing the number of unforced faults and high-intensity receives.
In the 21st century, tennis has taken the form of “dominant” tennis. Nowadays, the aggressive baseline player dominates; the key to winning a game is to combine a smart style with strength and speed [8,9]. For example, Rafael Nadal is an aggressive baseliner. He shreds the opponent’s defense and breaks the opponent’s serve by relying on a strong bottom line to smash the ball and win. Caroline Wozniacki is a counterpuncher, a defensive player, who can move quickly on the court and has a very low return-error rate. She keeps her shots deep, has good lobs, and places balls effectively during the game. She then patiently waits for her opponent to make a mistake and delivers the key blow, thereby scoring. Pete Sampras is a serve-and-volleyer player. His weapon is to serve the net; his serve speed is fast, and the landing position is very tricky; hence, it is not easy for the opponent to receive the ball. Roger Federer is a full-court player with 27 styles of play. He is a jack-of-all-trades who can hit every shot in the book—consistent groundies, sound volleys, beautiful drop-shots, and dependable lobs [1,2]. Therefore, by analyzing several videos, we have examined the use of tactics, playing habits, strengths, and weaknesses of the professional male players Roger Federer and Rafael Nadal. Thereafter, a decision tree algorithm was used to determine the positions, techniques, and placements used by the two players in the matches. Three variables for the two players were used to construct an artificial-intelligence tennis-game model, which can be extended to any other tennis players to construct their own game models and, by that, adjust their autonomous training and game strategies.
In this study, a C5.0 artificial intelligence decision tree algorithm classification for tennis matches is proposed, which provides a classification for both players’ hitting techniques and ball-landing points, analyzing the techniques and tactics which thus offer them the potential for the timely adjustment of their playing styles so as to enhance their sports performance during their matches. In the future, we may provide live, online games and adjust the play and tactics in time, thus hoping to improve players’ sports performance.
2. Literature Review
2.1. Notational Analysis
This literature review consists of two sub-sections: Section 2.1 covers “notational analysis,” and Section 2.2 covers the “applications of decision trees in motion analysis.” Applying notational analysis to videos of tennis matches, Martínez-Gallego et al. [10] set cameras above the tennis court to track and record the movement characteristics, analysis, time, and speed of the two players on the court. Analysis of the videos found that losers ran shorter distances, moved faster, and spent more time in the defensive zone and less time in the offensive zone. O’Donoghue and Ingram [11] proposed notational analysis to analyze the Grand Slam tournaments between 1997 and 1999. The results show that both the sex of the player and the surface of the court have a significant influence on the nature of singles tennis matches at Grand Slam tournaments. Sánchez-Pay et al. [12] used notational analysis to analyze the technical differences of 580 sets in 248 matches played between 2017 and 2018 in Grand Slam tournaments. Players who had more ace points won on the first serve; winning shots and net points won more matches in the Australian Open, Wimbledon, and the United States Open than in the Roland-Garros (French) Open (p < 0.05). However, in the Roland-Garros Open, players won more receiving points (43.56% of the points played) with more chances to break the opponents’ service game. Torres-Luque et al. [13] invited eight young, nationally ranked tennis players to record their total real-time game-rest time, number of rallies, number of strokes for rally, and durations of rally through videos recorded while they practiced on clay courts. The results of the study showed that the average heart rate was around 135 lat·min−1, blood lactate levels were 1.54 mmol·l−1, and the subjective perception of exertion was around 12. Hizan et al. [14] used notational analysis to develop a coding system and examined the singles matches of both men and women at the 2008 Australian Open. First, they encoded the ball’s landing point, then the serve’s landing position, and the return ball’s position. The first and second serve, the landing position of the serve, and the hitting and landing positions of the receiving balls could all be accurately and effectively recorded. The coding system provided strategic and tactical analysis for adjusting the return and serve in tennis matches. Whiteside et al. [15] used 66 recorded videos with 28,582 shots and manual notation to develop an automated stroke-classification system. The recognition accuracy rate of the three overhead, forehand, and backhand hitting techniques was as high as 97.4%. Automated classification was provided to quantify the number of strokes and distinguish stroke-types among elite tennis players.
Liao and Li [16] used a 2014 Incheon Asian Games video to analyze the game between the badminton women’s singles finalists, Tai Tzu-Ying and Li Xuerui. The court was divided into 16 placement areas for recording and analysis. The percentages of the number of times and uses of different techniques from both sides (such as serving, receiving, actively making return strikes with placements, and variable placements) were calculated. Fuchs et al. [17] observed videos to analyze the players’ scoring techniques. They counted each variable’s gains, losses, and total scores separately so as to compute the scoring rate, usage rate, winning rate, and weighted scoring rate of each variable of three-stage billiard techniques. Folgado et al. [18] and McGuckian et al. [19] used GPS with notational analysis to record tactical and physical indicators to analyze the performance of soccer players in team possession, passing, and shooting. Herold et al. [20] used machine learning with notational analysis to help coaches analyze the attack efficiency and use of tactics by professional male soccer players. Capobianco et al. [21] used notational analysis and big data analysis to establish an expert, real-time, decision-making system to improve the sports performance of individual or team athletes. Novak et al. [22] assessed athlete performance with the notational analysis of 30 professional matches in the 2019 season of the League of Legends esports in North America and Europe. The results of the study showed that the analysis rating of the most experienced athlete was in good agreement with the match history. Fitzpatrick et al. [23] applied notational analysis to 211 men’s and 209 women’s Wimbledon singles matches between 2015 and 2017. The results of the study found that 1 shot (aces and missed serve-returns) was the most common length of a rally, with 0 shots (double-faults) being the least common, thus highlighting the importance of serving and returning strategies at Wimbledon, placing the focus on serving and returning during training on grass.
2.2. Applications of Decision Trees in Motion Analysis
In order to enhance the image of the city and boost the local economy, Mumcu and Mahoney [24] used a decision tree to construct a decision-making model of alternatives. The factors in the evaluation of the alternatives included, among others, the cost of bidding, the probability of being awarded, the cost of hosting, the probability of hosting successfully, the financial benefit expected by an excellent event, and the financial benefit expected by a mediocre event, thus spurring cities around the world to fight for the right to host sports events and providing the reference basis for decision-making by local sports committees.
Wang et al. [25] used the C4.5 decision tree algorithm to ensure fairer and more objective granting of scholarships in higher education, based on students’ in-class academic performance, extra-curricular activities, and various competition results. Pai et al. [26] used C4.5 decision tree analysis to study six key factors affecting the results of National Basketball Association (NBA) games: field-goal percentage, three-point field-goal percentage, free-throw attempts, turnovers, defensive rebounds, and steals. Kapadia et al. [27] used 10 years of data published by the Indian Premier League (IPL), applying the C4.5 decision tree, Naïve Bayes, random forest, and k-nearest neighbors (KNN) algorithm to deal with the problem of predicting cricket-match results based on the historical match data of the IPL. The results found that the prediction accuracy of KNN was better than that of the decision tree, Naïve Bayes, and random forest. Pifer et al. [28] employed the C5.0 decision tree to analyze the players who entered the major leagues and minor leagues each year and to assess the relevant data on their salaries in their first six seasons to decide signing contracts.
Kostuk and Willoughby [29] used decision trees to analyze the choice of scoring or not scoring in the late stages of curling competitions. Based on observations of world-class curling competitions, it appeared that North American curling players never chose to score at the end of the game, while European players did. The results showed that not scoring in the last stage of the game is the better choice.
Chu and Wang [30] used a decision tree to classify US Major League Baseball (MLB) teams into “no playoffs” or “playoffs” groups. Through research and analysis, it was found that a 0.537 winning percentage in the regular season may well be the threshold for advancing to the postseason. Simsek et al. [31] used a decision tree classification model to analyze the MLB’s free agents between 2013 and 2017. The results evidenced that, for players offered a new contract, “age”, “wins above replacement”, and “the team on which a player last played” were the most significant factors in determining whether a player signed a new contract or not. Li and Chang [32] analyzed a baseball database using the chi-squared test to decide the significant factors in a pre-processing step of pruning insignificant factors before constructing a decision tree. The results showed that the p-value of the chi-squared test provided the advantages of a lower storage cost, a faster prediction time, and a higher degree of accuracy for data classification than did the decision tree including all the original factors.
Liu et al. [33] used body-sensor networks to collect table-tennis stroke-recognition motion data and used principal component analysis (PCA) to analyze sports skills. The results of the PCA showed a classification accuracy of 97.41%. Sha et al. [34] proposed the placement of sensors on the wrists of six table-tennis players, with each playing 100 returns and serves, and then the researchers used a decision tree to identify the classification of hits and misses using the differences in motion between the two. The results showed that the classification accuracy of the decision tree was as high as 99%, and the rate of accuracy in the identification of hits and misses was 95%. Wang et al. [35] used the depth-sensing technology of Microsoft Kinect to obtain human-skeleton data from tennis players. Next, they used the KNN algorithm to define dimension weights for action classification. The research results showed that the accuracies of the KNN algorithm, that of the decision tree algorithm, and that of the convolutional neural network (CNN) algorithm were 92.4%, 92.81%, and 89.97%, respectively. To develop a teaching system with correct tennis posture through accurate classification, Javed et al. [36] classified videos of shots into long shots, medium shots, close-up shots, and off-field shots, and they proposed a decision tree architecture for the shot-classification of outdoor-sports videos. Using the sports videos on YouTube for automatic classification, the results suggested that the classification accuracy improved by an average of 6.9%. Gong and Wang [37] proposed the use of an audio-stream-analysis, multi-label-classification algorithm, which was applied to the decision tree classification algorithm for classification. Using the continuous-time hidden Markov model (CHMM), the audio employed multiple labels for the branch-pruning and classification of the tree. They then used 72 shots and 56 tennis highlights as the verification material for the algorithm. The detection rate of the bottom-line hit event reached 92% and 88%, which are relatively high, while the detection efficiency of the ace-ball event and the tennis event, 84% and 80%, respectively, were not very good.
Based on the abovementioned decision tree studies, it can be determined that, by using decision trees, collected data can be sequentially arranged into graphs via tree diagrams so that the results presented from different nodes can be clearly seen. Thereafter, the most advantageous option can be determined.
3. Materials and Algorithm
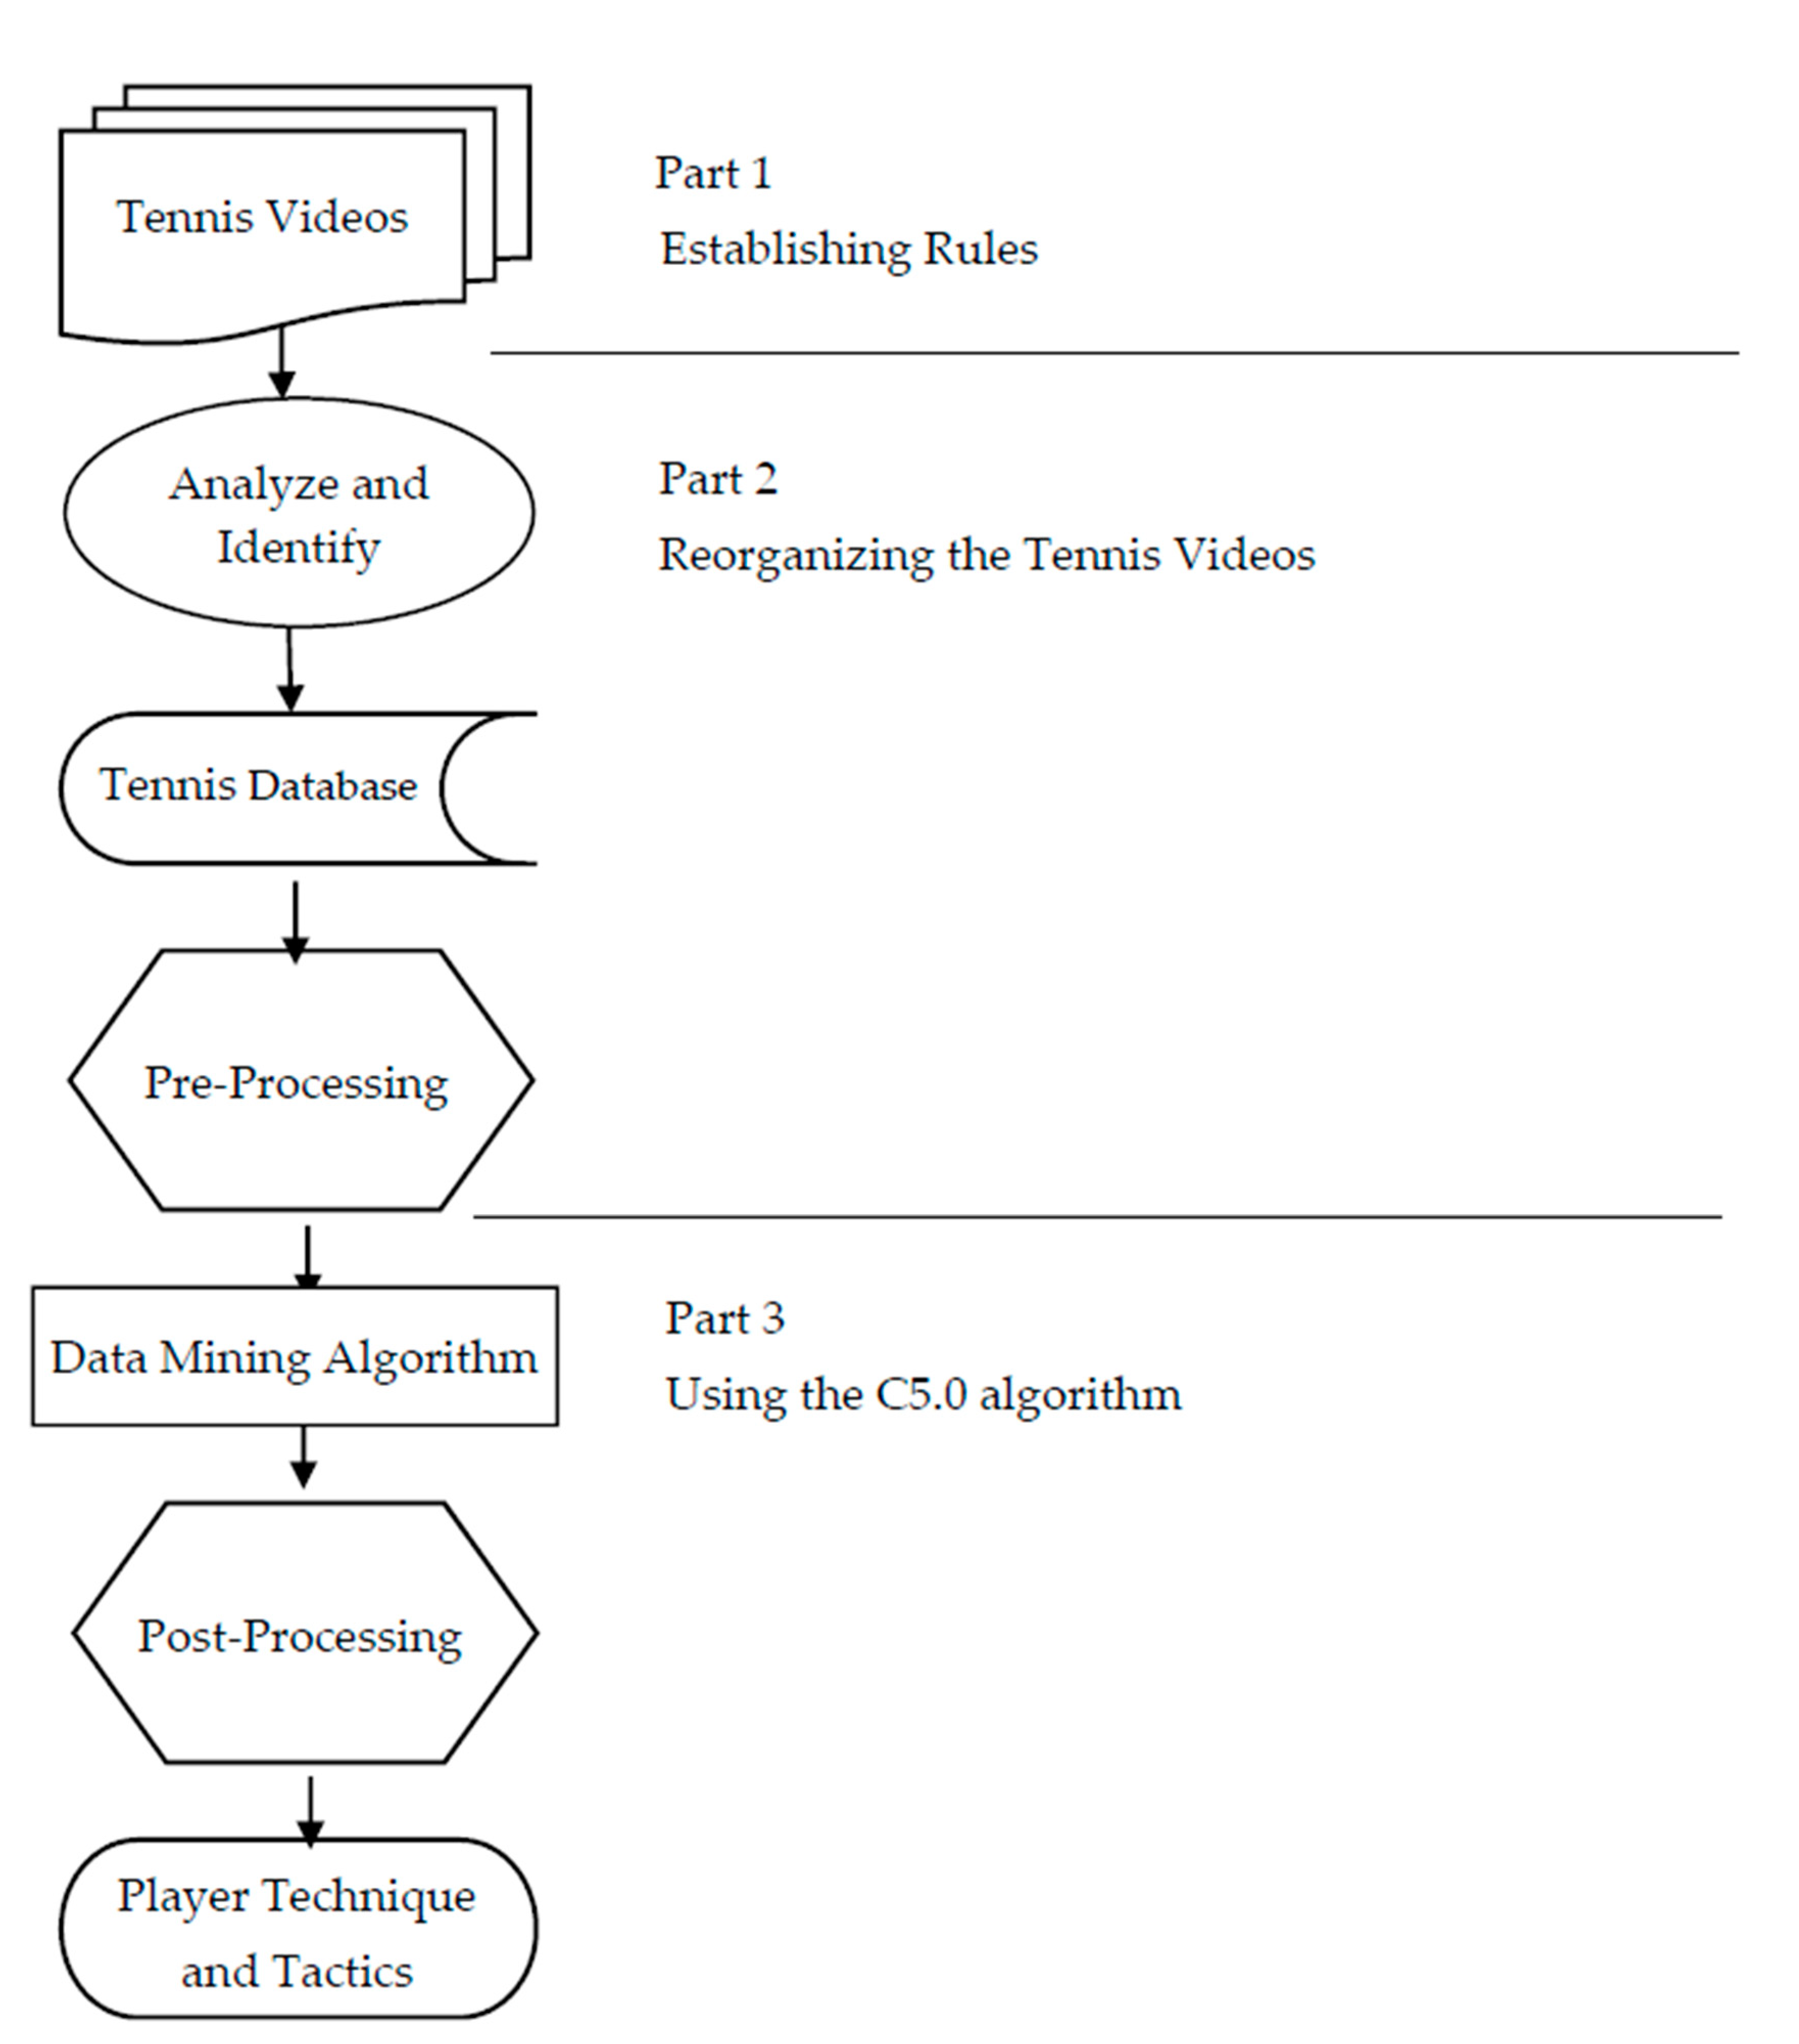
The tennis-game model-flow, from video collection to usable decision, is shown in Figure 1. According to Figure 1, the first part consists of applying pre-established selection rules in the integration of primitive video data to decide whether that video data belongs. The next part is to reorganize the video data by discarding unnecessary or redundant video information, establishing video contents and record-keeping formats, and ensuring the integrity and consistency of the data so as to construct a video-data platform. The third part is to organize the video-data part, in which the information on where the tennis ball falls and where the player stands is grouped into related subjects, and data-mining-processing methods are used to determine video-data models and to further define the relationships within the various tennis-game-model datasets for reference in storage and query computation. The resulting three-part tennis-game model can become a decision-making support system for players’ technique and tactics.
Part 1: Establishing Rules
Definition 1.
Defining the classifications of tennis techniques and players’ performance.
The common techniques used in tennis are divided into 13 categories: forehand, backhand, forehand volley, backhand volley, forehand half-volley, backhand half-volley, forehand spin, backhand spin, first serve, second serve, smash, unsuccessful shots, and other. The algorithm code for each technique is listed in Table 1 [38].
Definition 2.
Defining the players’ volley and the placements of strokes and serves.
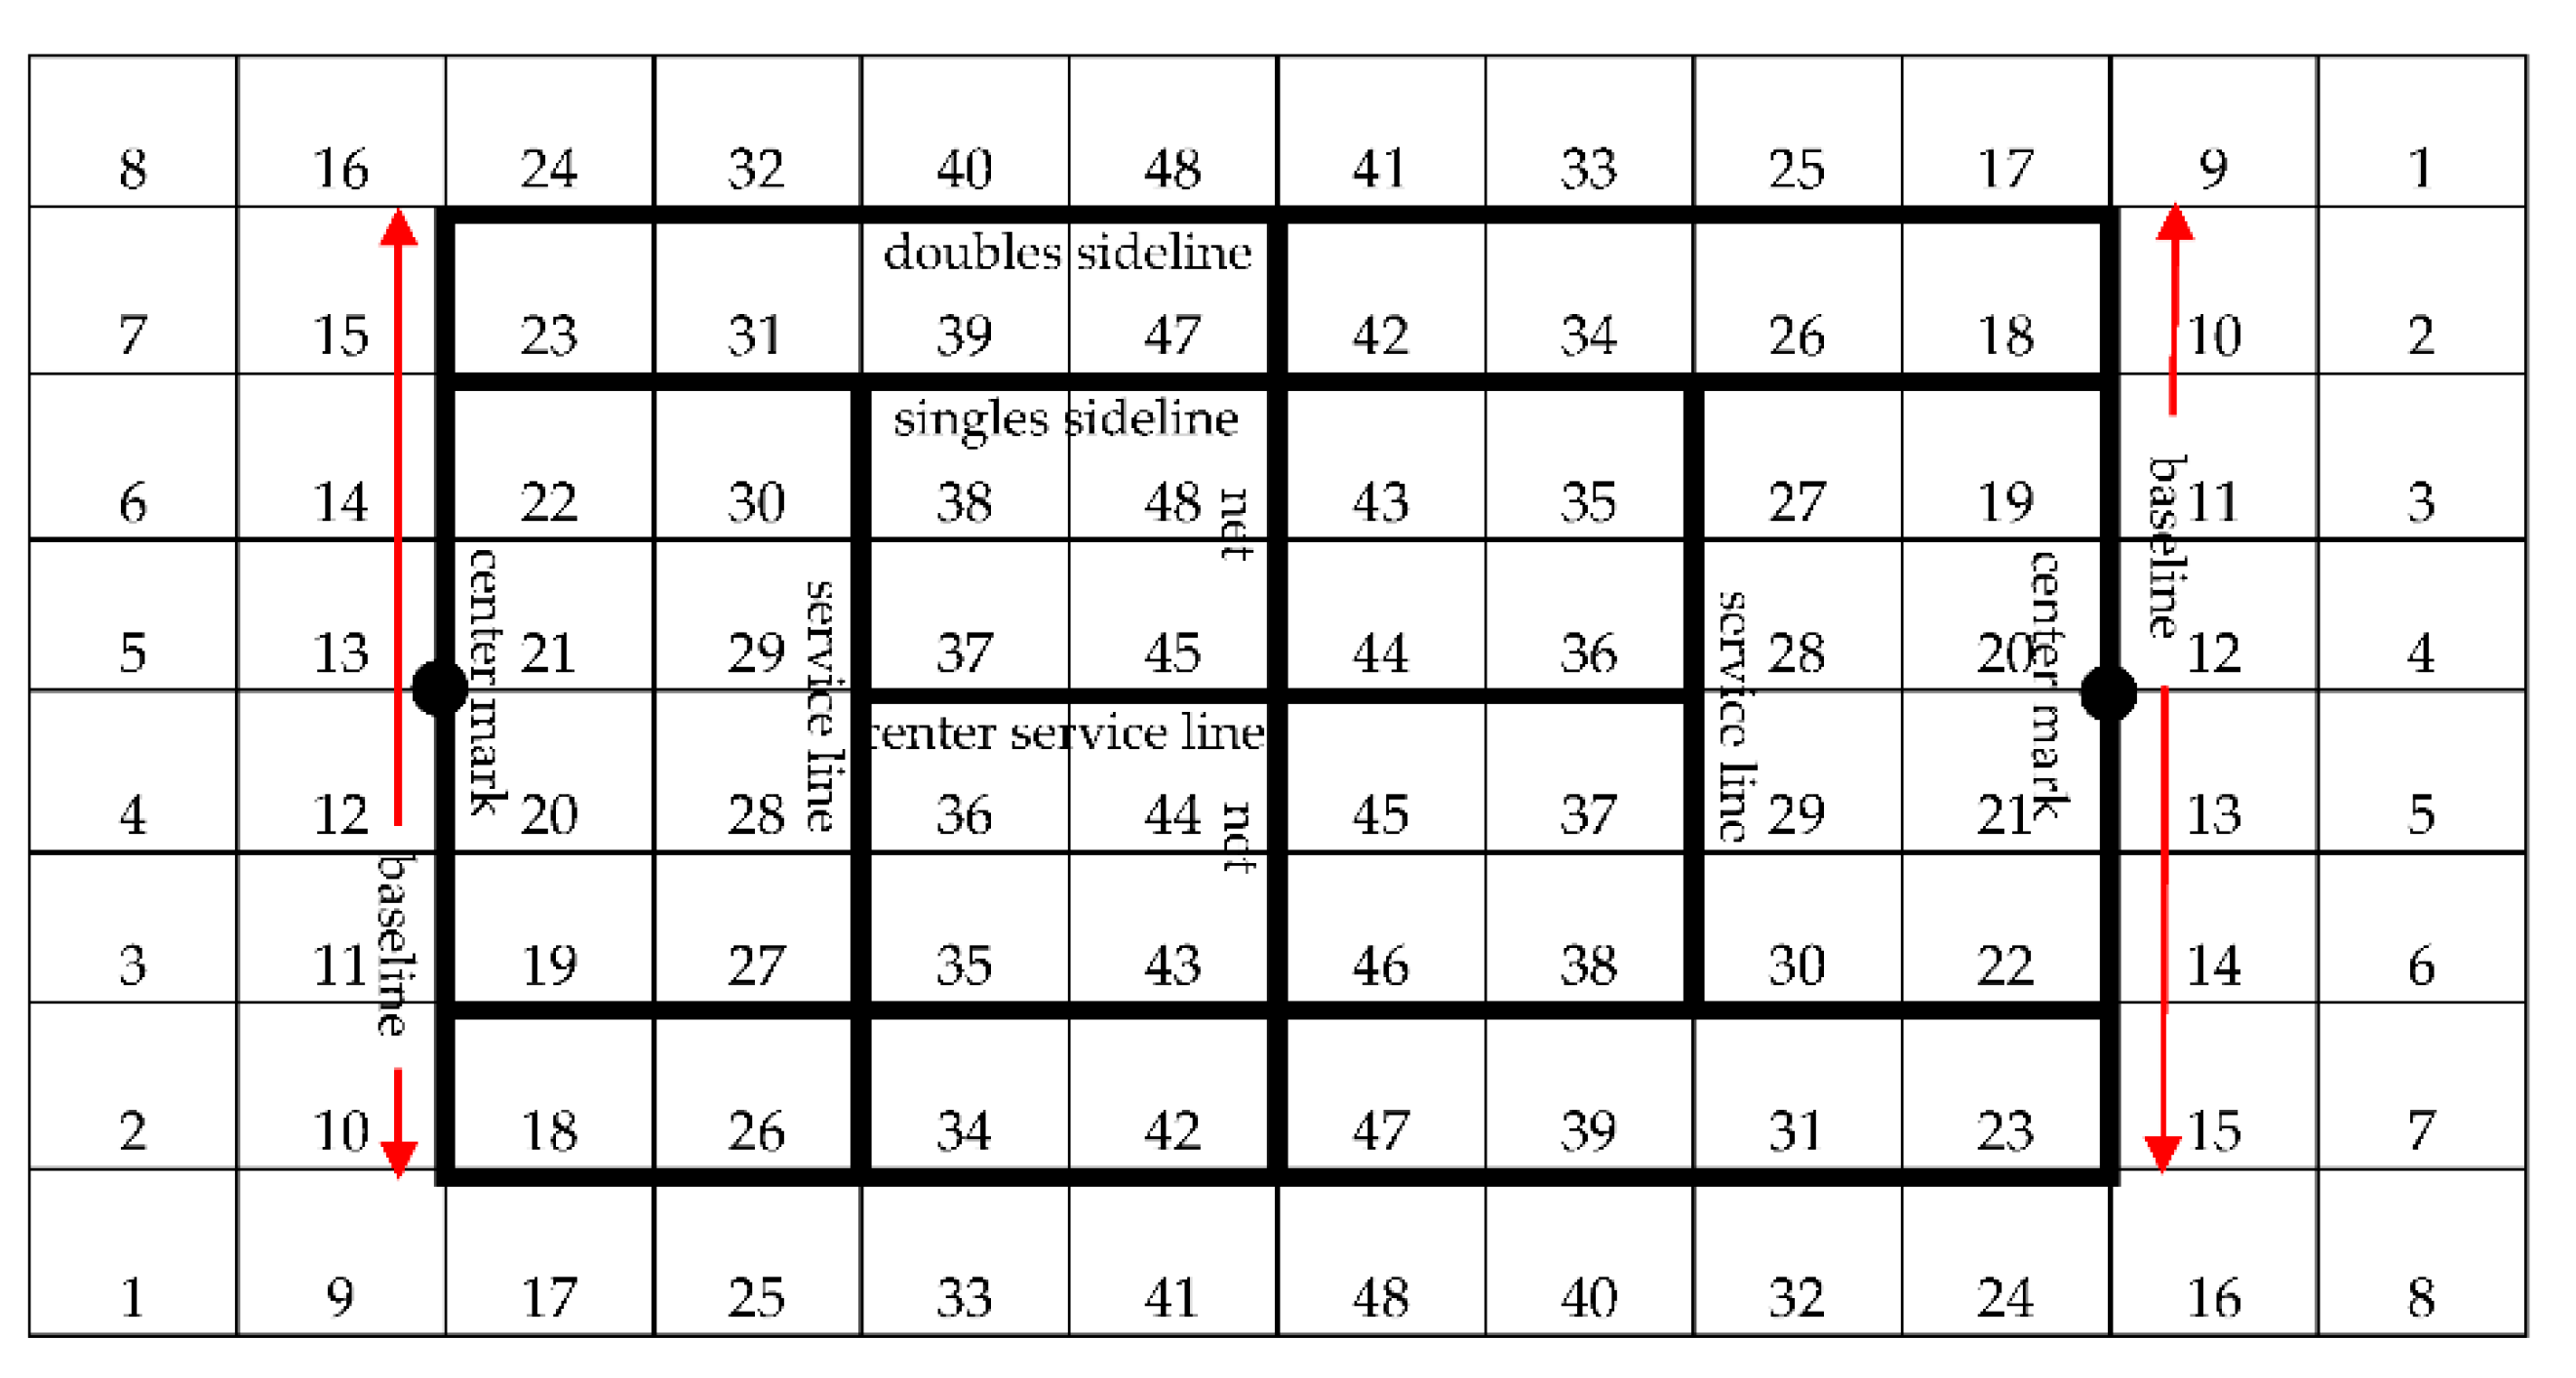
Modifying the court-numbering of serve-drop and receive-return-drop originally compiled by Liao and Lee [16], we divided the tennis courts into 48 positioning areas as shown in Figure 2. As shown, the codes for the player positions for striking and receiving range from 1 to 48. The returner’s impact location can be classified into 6 areas, coded from A to F, as shown in Figure 3 [39].
Definition 3.
Defining the source of the video and the period of the game.
This study developed an expert, decision-making system for tennis games. First, with notational analysis, 48 areas were delimited on each side of the centerline of the court, and 10 matches between the 2 professional tennis players, Federer and Nadal, played between 2007 and 2019 were analyzed.
Part 2: Reorganizing Tennis Video
Based on the decision tree framework [36,37], the image recognition system can identify the location from which the tennis player is serving, where the tennis ball lands, and where the opponent is standing when they return. However, it is not possible to identify the tennis techniques used by both players. Therefore, this study uses notational analysis to identify and record the standing positions of the tennis players, the drops of the tennis balls, and the tennis techniques used by each player at that given time.
To test the reliability of the labelling analysis method, a game was randomly selected and watched so as to be annotated. Thereafter, the mutual agreement (MA) and reliability (R) method proposed by Holsti [40] for reliability testing was used, as shown in Equations (1) and (2). IF R (reliability) is >0.8, then the fully reorganized coding can be started. Lombard et al. [41] proposed that R > 0.9 represents a good level of agreement under the Holsti method.
where M is the number of full agreements, x1 is the number of agreements of reorganize coder 1, x2 is the number of agreements of reorganize coder 2, and n is the number of participating coders. In order to achieve a more precise classification, this study used an agreement level of R > 0.95.
Part 3: Using the Data-Mining-Processing Method
The C5.0 algorithm adds the most important “boosting” contribution to the whole process [42,43,44]. Therefore, this study proposes to use the C5.0 algorithm to analyze Federer and Nadal’s matches from 2007 to 2019, including tennis technique analysis, position analysis, and placement positions. The algorithm is divided into three steps, which are described as follows:
Step 1: Data setting: divide the original data into two groups, with one part being training data and the other part being test data.
The 2007 video of Federer and Nadal’s match was used as training data. First, three tennis experts were asked to conduct a comparison and identification using marker analysis, and then a reliability analysis was conducted using Equations (1) and (2), which were greater than 0.95. The results were then compared with those obtained by the C5.0 algorithm. To increase the accuracy of the algorithm, we could only proceed to Step 2 following the receipt of equal comparison results between the two approaches.
Step 2. Decision tree generation: use training data to build a decision tree, and at each internal node, use attribute-selection indicators to evaluate which attribute to choose as the basis for branching, which is also known as a “splitting node”.
This study used the information-theory C5.0 algorithm to determine the optimal branching variables and segmentation thresholds based on the rate of decrease of information entropy and then proceeded as follows:
For a given segment of training data (S), the term n refers to the number of different class levels, and refers to the proportion of values falling into the level i cases. Equation (3) displays the definition of entropy, which can be specified as:
If a certain attribute variable S has n classifications, the conditional information entropy after the introduction of the attribute variable S is defined as shown in Equation (4):
The information gain (infoGain) for a feature S is calculated as the differences between the entropy in the segment before the split (S1) and the partitions resulting from the split (S2) as shown in Equation (5):
infoGain(S) = info(S1) − info(S2)
Step 3. Pruning: use test data for decision tree pruning. Repeat Steps 1–3 until all new nodes are leaf nodes.
4. Results
This study used the C5.0 decision tree algorithm and notational analysis to construct a gaming model utilizing three variables (position, technique, and location) in the tennis matches between the players Federer and Nadal. The goal was to identify the combination with the highest scoring-rate. The three parts of the model analysis were as follows:
This study analyzed 10 games between 2 professional male tennis players, Federer and Nadal, played between 2007 and 2019, defining the 13 categories of tennis techniques (Table 1) and the players’ volleys and locations of strokes and serves (Figure 1, Figure 2 and Figure 3) [39].
The authors invited 3 tennis players with more than 10 years’ experience to annotate and record the players using the methods outlined in Part 1 while watching a video with 100 shots to check the classification accuracy of the results of the C5.0 algorithm. Therefore, we calculated the process using the Equations (6) and (7):
Average MA = (0.98 + 0.94 + 0.95)/3 = 0.957
R = (3 × 0.957)/[1 + (3 − 1) × 0.957] = 0.977
This 0.977 (97.7%) accuracy is higher than that of any other method, that is, the 92.81% accuracy of KNN by Wang et al. [34], the 89.97% of CNN, the 92% of Gong and Wang [36], and the 90% of Lombard et al. [40].
This shows that the agreement between the 3 coders met the standard, and that the 10 games can be fully coded. In Table 2, the “Experts” column reports the results of the assessment that the 3 experts performed on 10 videos of Federer and Nadal’s matches played between 2007 and 2019. The experts jointly decided where the players served, where they received the ball, and how they used tennis techniques. These results can provide the basis for the accuracy comparison of various algorithms. The 2 players shot 13,230 times.
To analyze the 10 videos of the games, the annotation and classification calculation processes were as follows:
- All records were set as a node.
- According to Part 3, Steps 1 and 2, the videos of the games were compared. Then, based on video analysis, appropriate, automatic dividing points were applied for the variables in each division method, such as tennis techniques, players’ position, returner’s impact location, landing location, and relative player locations.
- The analysis continued until every strike satisfied the node classification.
Table 2 reports the results of the C5.0 algorithm on the statistics of the techniques used by Federer and Nadal following the analysis of the 10 videos, preceded by the assessment of the experts’ statistics using Qiu’s method [39]. The three techniques that were most commonly used by the two players were forehand, backhand, and first serve.
Therefore, this database can be used for making comparisons between various artificial-intelligence algorithms in the future. Based on the experts’ analyses, Federer had 6789 strokes, and Nadal had 6441, for a combined total of 13,230 for both players. The algorithm proposed by Qiu [39] identifies the classification results as follows: Federer had 6207 hits with an average accuracy of 91.56%, Nadal had 6040 hits with an average accuracy of 89.22%, and the two players had a total of 12,247 ball hits. For the C5.0 algorithm, Table 2 shows the following classification results: Federer had 6547 strokes with an average accuracy of 94.61%, Nadal had 6256 strokes with an average accuracy of 95.75%, with the two players hitting a total of 12,803 balls. Overall, Nadal struck more balls, with a higher percentage of forehand wins and first-serve points than Federer. Federer had a higher percentage of backhand wins than Nadal. Table 2 also reports the classification accuracy of Federer’s and Nadal’s forehand and backhand techniques as achieved by each of the 3 methods. With regard to the forehand, the C5.0 algorithm had a classification accuracy of 95.03% for Federer, 5.84% higher than that of Qiu’s method, which was 89.19%. As for Nadal’s forehand technique, C5.0 was as high in accuracy as 99.96%. The classification accuracy was 6.72% higher than that of Qiu’s method, which was 93.24%. Regarding the backhand, the C5.0 algorithm had a classification accuracy of 98.83% for Federer, which was 7.71% higher than the 91.12% accuracy of Qiu’s method. For Nadal’s backhand, the C5.0 classification accuracy was as high as 91.24%, that is, 0.75% higher than that of Qiu’s method, which was 90.49%. Thus, the classification accuracy of the C5.0 algorithm was higher overall than that of Qiu’s method. The same results were found in other tennis-technique classification sections.
In terms of the classification accuracy of Federer and Nadal’s performances, in the first-serve part, the C5.0 algorithm had a classification accuracy of 98.36% for Federer, which was 1.36% higher than that of Qiu’s method (96.73%). For Nadal’s first-serve part, C5.0 had a classification accuracy of 99.10%, which was 0.74% higher than that of Qiu’s method (98.36%). In the second-serve part, the C5.0 algorithm had a classification accuracy of 89.03% for Federer, that is, 1.69% higher than that of Qiu’s method (87.34%). In the second-serve part for Nadal, C5.0 was as high as 99.42% in classification accuracy, that is, 1.44% higher than that of Qiu’s method (97.98%). In the second-serve section, the classification accuracies of both C5.0 and Qiu’s method were below 90%, and it is worth exploring in depth the reasons underlying this low level of accuracy. Similar problems emerged for the classification accuracy of Nadal’s tennis techniques, both the C5.0 and Qiu’s method classification accuracy in the backhand-half-volley part being below 70%, thus a not high accuracy, as the reader can also see from the video Redefine classification.
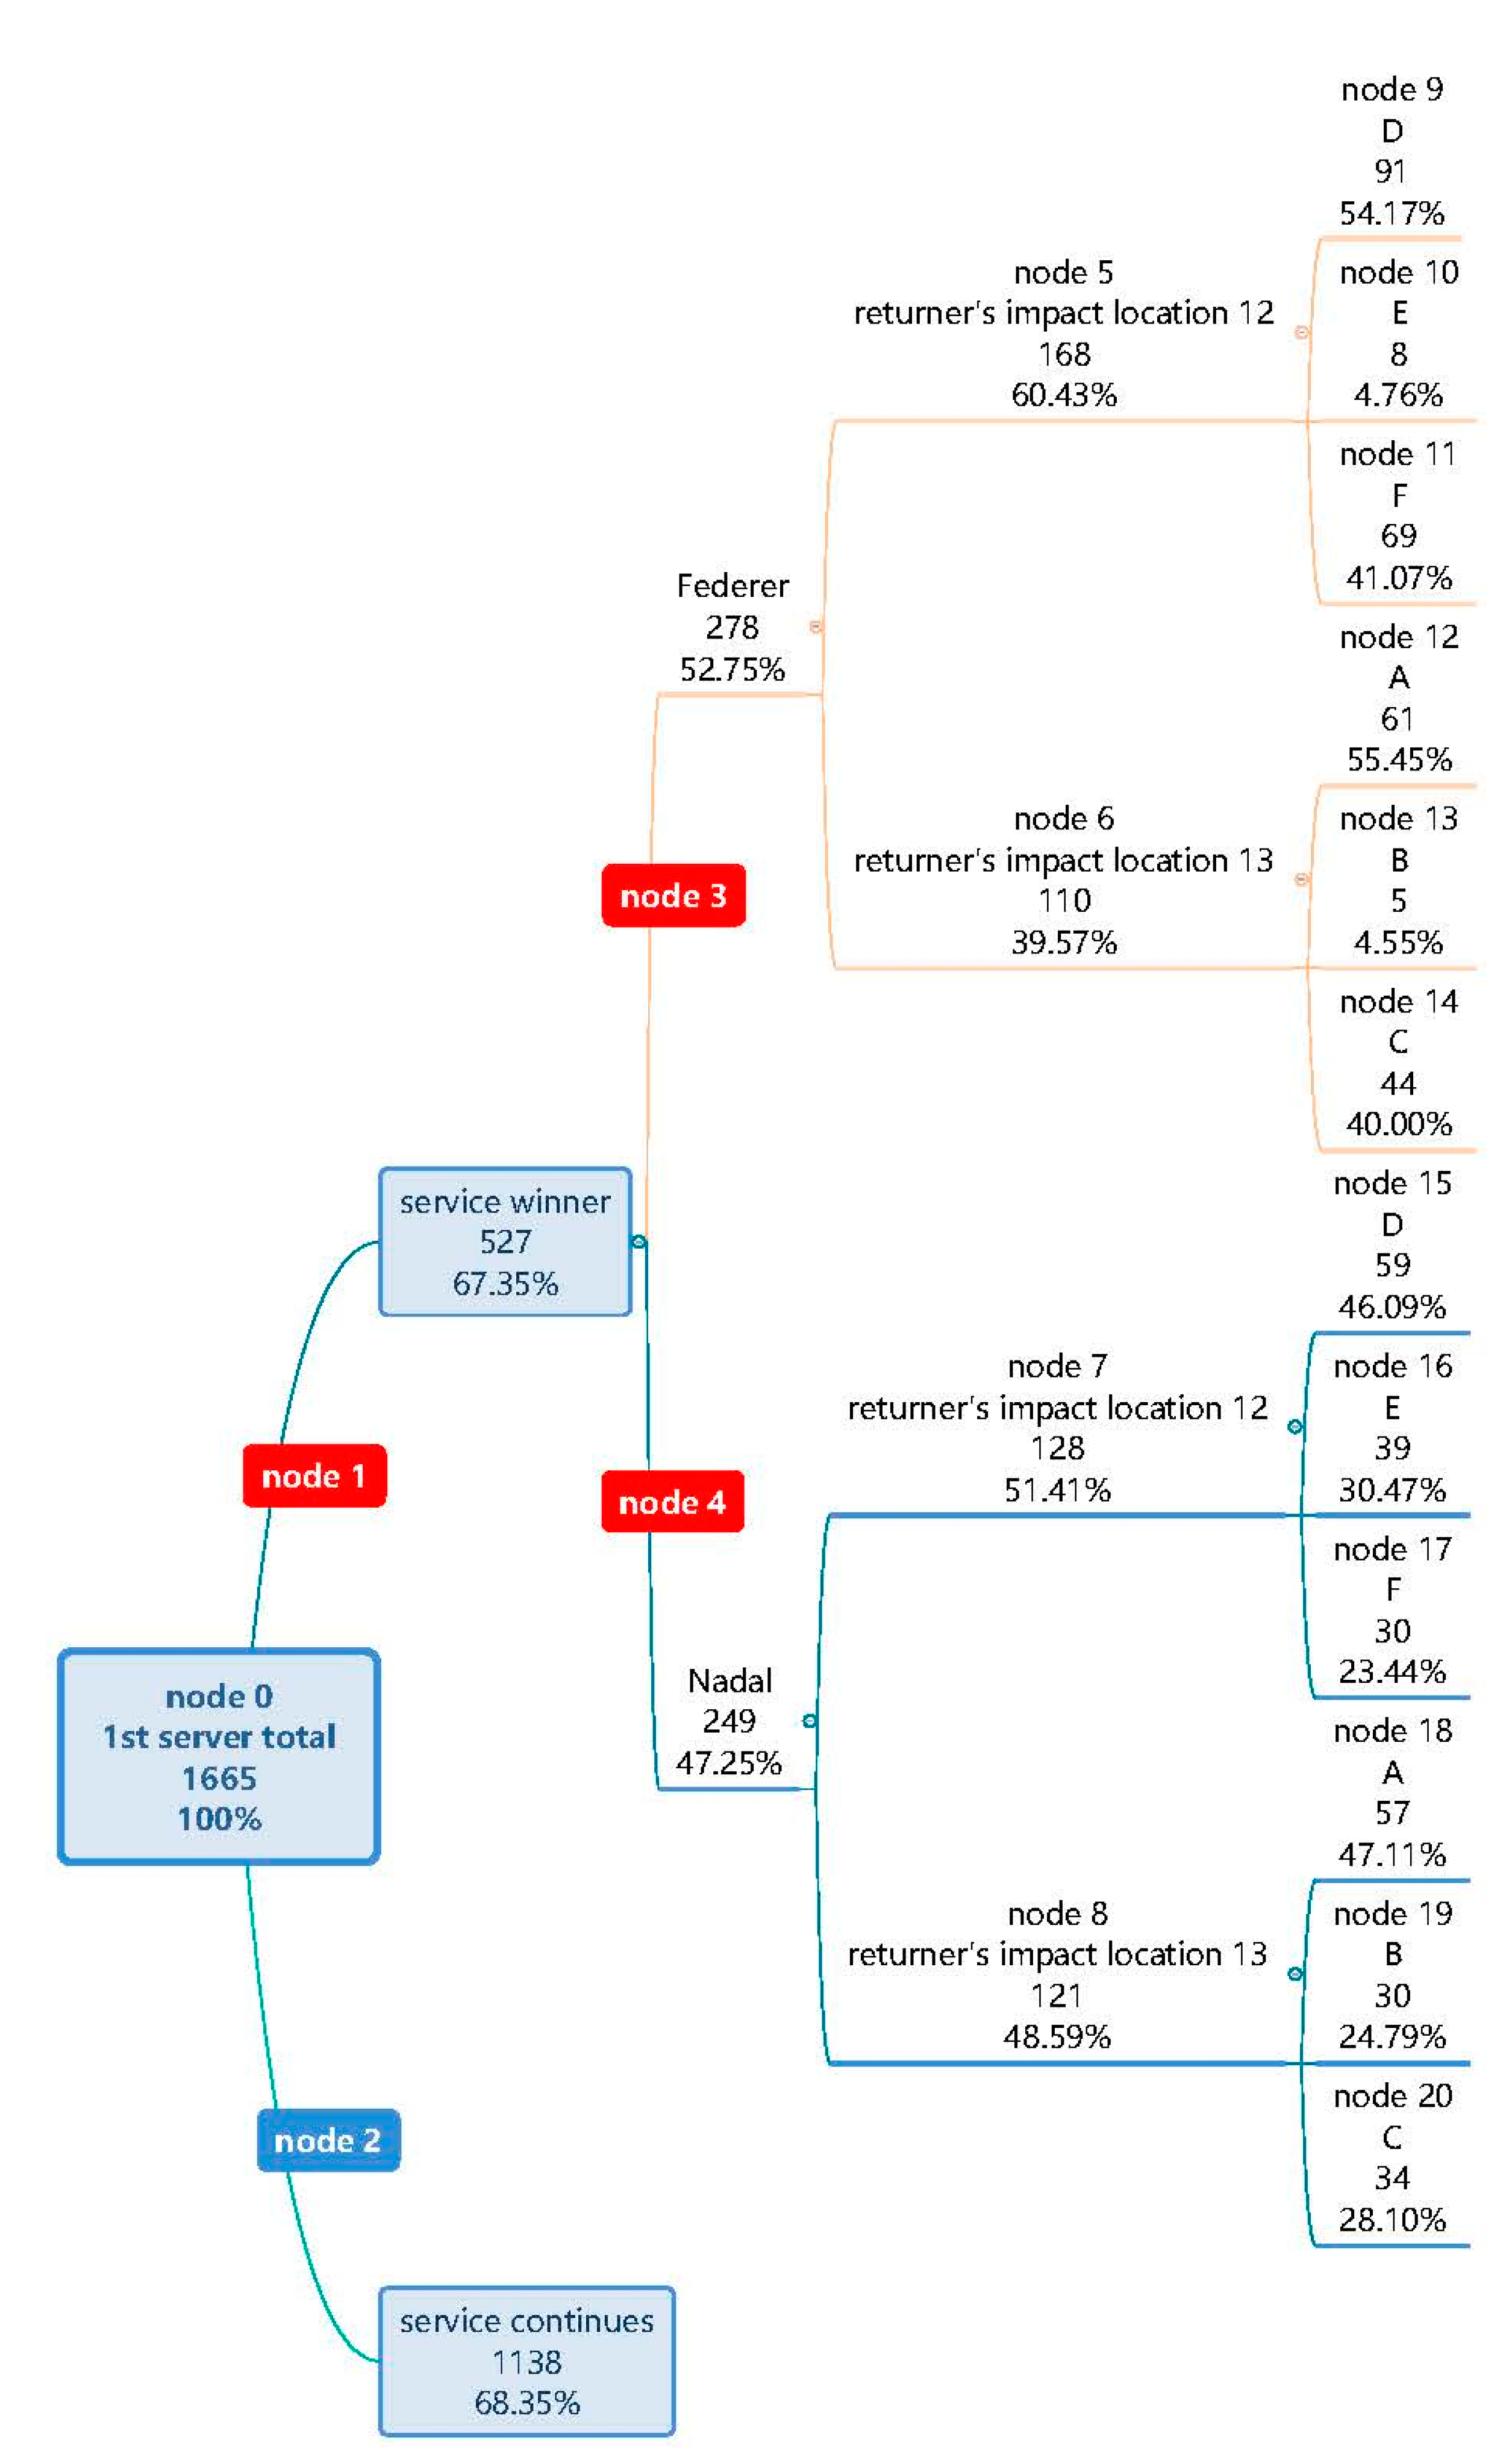
With regard to the first-serve classification, for both Federer and Nadal, Table 2 shows that the classification accuracy was 96%. In particular, the C5.0 algorithm was as high as 98% in accuracy. Subsequently, the striking habits, along with their advantages and disadvantages, of both Federer and Nadal were examined. Using the first-server rate as an example, the dependent variable was the winning or losing of each point, and the independent variables were the location and the technique. The classification results of the decision tree are shown in Figure 4.
Figure 4 displays an analysis of Federer and Nadal’s serve-scoring situation. Federer’s serve (52.75%) was better than Nadal’s (47.25%). When Federer served at location 12, the landing point was mainly D (node 9 = 54.17%); when Federer served at location 12, the A landing point predominated (node 12 = 55.45%). When Nadal served from location 12, D was dominant (node = 46.09%); when he served from location 13, A was dominant (47.11%). Both serves were aimed at the forehand. Although Nadal’s serve was used mainly to attack Federer’s backhand, the landing points were evenly distributed in six areas, while Federer’s serve was mostly distributed in the landing points A, C, D, and F, that is, the inner and outer corners of both sides. This showed that Nadal’s serve could be scored through more variation.
Table 2 organizes the technical classification of the scores of the 2 players. It can be seen that: (1) as for the scoring methods of the two players’ forehand draw, Federer’s scoring rate was 36.25%, Nadal’s scoring rate was 43.00%, and both players tended to attack the opponent’s forehand in the backcourt. Mainly, when entering the midcourt, they tended to play the opponent’s backhand; (2) with the backhand, the forehand scoring rate for Federer was 32.29% against Nadal due to the difference in their dominant hands. For Nadal, it was a backhand against Federer, and after entering the midcourt, both sides used a straight line as the main route, that is, attacking the opponent’s backhand with a winning rate of 29.12%. (3) In the first-serve scoring rate, Federer scored 11.93% and Nadal scored 14.13%. Nadal scored slightly better than Federer.
5. Conclusions
This study used notational analysis and the C5.0 algorithm to classify the point wins and losses of 2 experienced tennis players and developed a gaming model for tennis players. Further, players’ habitual scoring positions, striking techniques, and placements were obtained. These were used to understand the key winning factors for the two tennis players. From the gaming model, it can be observed that: (1) to avoid a winning shot from the opponent, various data-analysis models must be created in order to understand the habits and styles in which the opponent is proficient and to provide solutions. Through the notational analysis in this study, the placements were annotated. Thereafter, using a decision tree algorithm, the two players’ striking positions, techniques, and placements were integrated to develop a gaming model, which can aid players in practicing and preparing before a game so as to break through limits, correct weaknesses, fortify strengths, and avoid losing points. (2) The game model can be applied to analyze the advantages and disadvantages of every tennis player on account of the advantages and disadvantages of the opponent’s habits and techniques.
For future research directions, (1) the tennis players’ performance can be subdivided into four different tennis-court types, such as clay courts, grass courts, and hard courts; (2) the classification accuracy can be compared with other research methods; (3) however, for the 13 techniques used by tennis players, classification accuracy is not very high in some instances, such as the forehand-half-volley and the backhand-half-volley, in which the recognition accuracy was only 66.7% (Table 2). In the future, the technology proposed by Wang et al. [25] can be used to further develop accurate automatic image-comparison discriminations and classifications; and (4) it can also lend itself to sports lotteries to provide sports-lottery companies with a model for calculating odds.
Author Contributions
Conceptualization, methodology and software, C.-W.C.; validation, formal analysis, and writing—original draft, Y.-R.Q. All authors have read and agreed to the published version of the manuscript.
Funding
This research was funded by the MOE Teaching Practice Research Program, grant number PBM1100878.
Institutional Review Board Statement
Not applicable.
Informed Consent Statement
Not applicable.
Data Availability Statement
Not applicable.
Acknowledgments
The authors would like to thank the editor and the reviewers for their helpful comments.
Conflicts of Interest
The authors declare no conflict of interest.
References
- Roetert, E.P.; Kovacs, M. Tennis Anatomy, 2nd ed.; Human Kinetics: Champaign, IL, USA, 2020. [Google Scholar]
- Micki, S. The Four Styles of Tennis Play and Strategies to Beat Them. Available online: https://howtheyplay.com/individual-sports/Tennis-Playing-Styles-and-Strategies-to-Beat-Them (accessed on 4 August 2022).
- Jannah, M.; Hidayatullah, M.F.; Syaifullah, R. Anthropometric and biomotor factors that determine the ability of field tennis service. J. Phys. Educ. Sport 2021, 11, 167–174. [Google Scholar] [CrossRef]
- Martínez, R. Tactical analysis in tennis: From its origins to the present. ITF Coach. Sport Sci. Rev. 2018, 26, 30–32. [Google Scholar] [CrossRef]
- Huang, C.Y.; Hsieh, L.C. The differential performance of tennis professionals of different levels in serve and return games. J. NCHU Phys. Educ. Res. 2017, 20, 169–180. [Google Scholar]
- ATP Stats. Performance Zone. Available online: https://www.atptour.com/en/stats/performance-zone (accessed on 4 August 2022).
- Reid, M.; McMurtrie, D.; Crespo, M. The relationship between match statistics and top 100 ranking in professional men’s tennis. Int. J. Perform. Anal. 2010, 10, 131–138. [Google Scholar] [CrossRef]
- Jiang, W.; He, G. Study on the effect of shoulder training on the mechanics of tennis serve speed through video analysis. Mol. Cell. Biomech. 2021, 18, 221–229. [Google Scholar] [CrossRef]
- van Daalen, M. Teaching Tennis Volume 3: The Development of Champions; Author Solutions Inc.: Bloomington, IN, USA, 2019. [Google Scholar]
- Martínez-Gallego, R.; Guzmán, J.F.; James, N.; Pers, J.; Ramón-Llin, J.; Vuckovic, G. Movement characteristics of elite tennis players on hard courts with respect to the direction of ground strokes. J. Sports Sci. Med. 2013, 12, 275–281. [Google Scholar]
- O’Donoghue, P.; Ingram, B. A notational analysis of elite tennis strategy. J. Sports Sci. 2001, 19, 107–115. [Google Scholar] [CrossRef] [PubMed]
- Sánchez-Pay, A.; Ortega-Soto, J.A.; Sánchez-Alcaraz, B.J. Notational analysis in female Grand Slam tennis competitions. Kinesiology 2021, 53, 154–161. [Google Scholar] [CrossRef]
- Torres-Luque, G.; Ramirez, A.; Cabello-Manrique, D.; Nikolaidis, T.P.; Alvero-Cruz, J.R. Match analysis of elite players during paddle tennis competition. Int. J. Perform. Anal. 2015, 15, 1135–1144. [Google Scholar] [CrossRef]
- Hizan, H.; Whipp, P.R.; Reid, M. Validation of match notation (a coding system) in tennis. J. Quant. Anal. Sports 2010, 6. [Google Scholar] [CrossRef]
- Whiteside, D.; Cant, O.; Connolly, M.; Reid, M. Monitoring hitting load in tennis using inertial sensors and machine Learning. Int. J. Sports Physiol. Perform. 2017, 12, 1212–1217. [Google Scholar] [CrossRef]
- Liao, W.Z.; Lee, K.U. Analysis of serving and receiving techniques for world-class badminton women’s single player Tzu-ying Dai. J. Both Sides Between Taiwan Strait Phys. Educ. Sports 2016, 10, 75–84. [Google Scholar]
- Fuchs, M.; Liu, R.; Malagoli, L.I.; Munivrana, G.; Straub, G.; Tamaki, S.; Yoshida, K.; Hui Zhang, H.; Lames, M. Table tennis match analysis: A review. J. Sports Sci. 2018, 36, 2653–2662. [Google Scholar] [CrossRef]
- Folgado, H.; Bravo, J.; Bravo, P.; Sampaio, J. Towards the use of multidimensional performance indicators in football small-sided games: The effects of pitch orientation. J. Sports Sci. 2019, 37, 1064–1071. [Google Scholar] [CrossRef] [PubMed]
- McGuckian, T.B.; Cole, M.H.; Chalkley, D.; Jordet, G.; Pepping, G.J. Constraints on visual exploration of youth football players during 11v11 match-play: The influence of playing role, pitch position and phase of play. J. Sports Sci. 2020, 38, 658–668. [Google Scholar] [CrossRef] [PubMed]
- Herold, M.; Goes, F.; Nopp, S.; Bauer, P.; Thompson, C.; Meyer, T. Machine learning in men’s professional football: Current applications and future directions for improving attacking play. Int. J. Sports Sci. Coach. 2019, 14, 798–817. [Google Scholar] [CrossRef]
- Capobianco, G.; Giacomo, U.D.; Mercaldo, F.; Santone, A. A formal methodology for notational analysis and real-time decision support in sport environment. In Proceedings 2018 IEEE International Conference on Big Data (Big Data), Seattle, WA, USA, 10–13 December 2018; pp. 5305–5307. [Google Scholar] [CrossRef]
- Novak, A.R.; Bennett, K.J.M.; Pluss, M.A.; Fransen, J. Performance analysis in esports: Part 1—The validity and reliability of match statistics and notational analysis in League of Legends. SportRxiv 2019. [Google Scholar] [CrossRef]
- Fitzpatrick, A.; Stone, J.A.; Choppin, S.; Kelley, J. Investigating the most important aspect of elite grass court tennis: Short points. Int. J. Sports Sci. Coach. 2021, 16, 1178–1186. [Google Scholar] [CrossRef]
- Mumcu, C.; Mahoney, K. Use of decision tree model in sport management. Case Stud. Sport Manag. 2018, 7, 1–3. [Google Scholar] [CrossRef]
- Wang, X.; Zhou, C.; Xu, X. Application of C4.5 decision tree for scholarship evaluations. Procedia Comput. Sci. 2019, 151, 179–184. [Google Scholar] [CrossRef]
- Pai, P.F.; ChangLiao, L.H.; Lin, K.P. Analyzing basketball games by a support vector machines with decision tree model. Neural. Comput. Appl. 2016, 28, 4159–4167. [Google Scholar] [CrossRef]
- Kapadia, K.; Abdel-Jaber, H.; Thabtah, F.; Hadi, W. Sport analytics for cricket game results using machine learning: An experimental study. Appl. Comput. Inform. 2022, 18, 256–266. [Google Scholar] [CrossRef]
- Pifer, N.D.; McLeod, C.M.; Travis, W.J.; Castleberry, C.R. Who should sign a professional baseball contract? Quantifying the financial opportunity costs of major league draftees. J. Sports Econ. 2020, 21, 746–780. [Google Scholar] [CrossRef]
- Kostuk, K.J.; Willoughby, K.A. A Decision Support System for Scheduling the Canadian Football League. Interfaces 2012, 42, 286–295. [Google Scholar] [CrossRef]
- Chu, D.P.; Wang, C.W. Empirical study on relationship between sports analytics and success in regular season and postseason in major league baseball. J. Sports Anal. 2019, 5, 205–222. [Google Scholar] [CrossRef]
- Simsek, S.; Albizri, A.; Johnson, M.; Custis, T.; Weikert, S. Predictive data analytics for contract renewals: A decision support tool for managerial decision-making. J. Enterp. Inf. Manag. 2021, 34, 718–732. [Google Scholar] [CrossRef]
- Lee, C.E.; Chang, Y.I. Applying the chi-square test to improve the performance of the decision tree for classification by taking baseball database as an example. J. Comput. 2018, 29, 1–15. [Google Scholar]
- Liu, R.; Wang, Z.; Shi, X.; Zhao, H.; Qiu, S.; Li, J.; Yang, N. Table tennis stroke recognition based on body sensor network. In Proceedings of the Internet and Distributed Computing Systems, 12th International Conference, IDCS 2019, Naples, Italy, 10–12 October 2019; Montella, R., Ciaramella, A., Fortino, G., Guerrieri, A., Liotta, A., Eds.; Springer: Cham, Switzerland, 2019; Volume 11874. [Google Scholar]
- Sha, X.; Wei, G.; Zhang, X.; Ren, X.; Wang, S.; He, Z.; Zhao, Y. Accurate recognition of player identity and stroke performance in table tennis using a smart wristband. IEEE Sens. J. 2021, 21, 10923–10932. [Google Scholar] [CrossRef]
- Wang, X.; Huang, Y.; Zhong, J.; Zhu, Y.; Tang, Q.; Wang, M.; Li, S. Tennis posture classification and recognition based on an improved KNN. In Proceedings of the SPIE, 12th International Conference on Graphics and Image Processing (ICGIP 2020), Xi’an, China, 27 January 2021. [Google Scholar] [CrossRef]
- Javed, A.; Malik, K.M.; Irtaza, A.; Malik, H. A decision tree framework for shot classification of field sports videos. J. Supercomput. 2020, 76, 7242–7267. [Google Scholar] [CrossRef]
- Gong, X.; Wang, F. Classification of tennis video types based on machine learning technology. Wirel. Commun. Mob. Comput. 2021, 2021, 2055703. [Google Scholar] [CrossRef]
- USTA. Tennis Terms & Words to Know. Available online: https://www.usta.com/en/home/improve/tips-and-instruction/national/tennis-terms-definitions.html (accessed on 4 August 2022).
- Qiu, Y.R. Construct a Model of Tennis Players’ Competition. Master’s Thesis, National Taiwan University of Sport, Taichung, Taiwan, 2020. [Google Scholar]
- Holsti, O.R. Content Analysis for the Social Sciences and Humanities; Addison-Wesley: Reading, MA, USA, 1969. [Google Scholar]
- Lombard, M.; Snyder-Duch, J.; Bracken, C.C. Content analysis in mass communication: Assessment and reporting of intercoder reliability. Hum. Commun. Res. 2002, 28, 587–604. [Google Scholar] [CrossRef]
- Quinlan, J.R. Data Mining Tools See5 and C5.0. Available online: https://www.rulequest.com/see5-info.html (accessed on 4 August 2022).
- Freund, Y.; Schapire, R.E. A decision-theoretic generalization of on-line learning and an application to boosting. JCSS 1997, 55, 119–139. [Google Scholar] [CrossRef]
- Yobero, C. Determining Creditworthiness for Loan Applications Using C5.0 Decision Trees. Available online: https://rpubs.com/cyobero/C50 (accessed on 4 August 2022).
Figure 1.
Flow diagram representing the technical and tactical decision-making process.

Figure 2.
Player’s position codes.

Figure 3.
The returner’s impact location.

Figure 4.
Classification results for first serves obtained by decision tree analysis.


Table 1.
Tennis techniques and players’ performance algorithm codes.
| Tennis Techniques and Players’ Performance | Code |
|---|---|
| Forehand | a |
| Backhand | b |
| Forehand volley | c |
| Backhand volley | d |
| Forehand half-volley | e |
| Backhand half-volley | f |
| Forehand spin | g |
| Backhand spin | h |
| First serve | i |
| Second serve | j |
| Smash | k |
| Unsuccessful shots | l |
| Other | m |
Table 2.
Classification of techniques used by Federer and Nadal.
| Code | Federer | Nadal | ||||||||
|---|---|---|---|---|---|---|---|---|---|---|
| Experts | Qiu’s Method | C5.0 | Experts | Qiu’s Method | C5.0 | |||||
| Times | Times | Accuracy | Times | Accuracy | Times | Times | Accuracy | Times | Accuracy | |
| a | 2497 | 2227 | 89.19% | 2373 | 95.03% | 2691 | 2509 | 93.24% | 2690 | 99.96% |
| b | 2139 | 1949 | 91.12% | 2114 | 98.83% | 1997 | 1807 | 90.49% | 1822 | 91.24% |
| c | 98 | 89 | 90.82% | 93 | 94.90% | 23 | 22 | 95.65% | 23 | 100% |
| d | 124 | 120 | 96.77% | 125 | 99.19% | 33 | 32 | 96.97% | 33 | 100% |
| e | 9 | 7 | 77.78% | 6 | 66.67% | 2 | 1 | 50.00% | 2 | 100% |
| f | 14 | 11 | 78.57% | 13 | 92.86% | 3 | 2 | 66.67% | 4 | 66.67% |
| g | 89 | 85 | 95.51% | 88 | 98.88% | 45 | 47 | 95.56% | 45 | 100% |
| h | 492 | 479 | 97.36% | 473 | 96.14% | 372 | 365 | 98.12% | 374 | 99.46% |
| i | 794 | 768 | 96.73% | 781 | 98.36% | 892 | 875 | 98.09% | 884 | 99.10% |
| j | 474 | 414 | 87.34% | 422 | 89.03% | 346 | 339 | 97.98% | 344 | 99.42% |
| k | 34 | 35 | 97.06% | 34 | 100% | 17 | 19 | 88.24% | 17 | 100% |
| l | 25 | 23 | 92.00% | 25 | 100% | 18 | 20 | 88.89% | 16 | 88.89% |
| m | 0 | 0 | 100% | 0 | 100% | 2 | 2 | 100% | 2 | 100% |
| Summary | 6789 | 6207 | 91.56% | 6547 | 94.61% | 6441 | 6040 | 89.22% | 6256 | 95.75% |
Publisher’s Note: MDPI stays neutral with regard to jurisdictional claims in published maps and institutional affiliations. |
© 2022 by the authors. Licensee MDPI, Basel, Switzerland. This article is an open access article distributed under the terms and conditions of the Creative Commons Attribution (CC BY) license (https://creativecommons.org/licenses/by/4.0/).
Share and Cite
MDPI and ACS Style
Chang, C.-W.; Qiu, Y.-R. Constructing a Gaming Model for Professional Tennis Players Using the C5.0 Algorithm. Appl. Sci. 2022, 12, 8222. https://0-doi-org.brum.beds.ac.uk/10.3390/app12168222
AMA Style
Chang C-W, Qiu Y-R. Constructing a Gaming Model for Professional Tennis Players Using the C5.0 Algorithm. Applied Sciences. 2022; 12(16):8222. https://0-doi-org.brum.beds.ac.uk/10.3390/app12168222
Chicago/Turabian StyleChang, Che-Wei, and Yu-Ran Qiu. 2022. "Constructing a Gaming Model for Professional Tennis Players Using the C5.0 Algorithm" Applied Sciences 12, no. 16: 8222. https://0-doi-org.brum.beds.ac.uk/10.3390/app12168222
Note that from the first issue of 2016, this journal uses article numbers instead of page numbers. See further details here.