
Design of an Affordable Cross-Platform Monitoring Application Based on a Website Creation Tool and Its Implementation on a CNC Lathe Machine

Abstract
:1. Introduction
2. Materials and Methods
2.1. Design Requirements
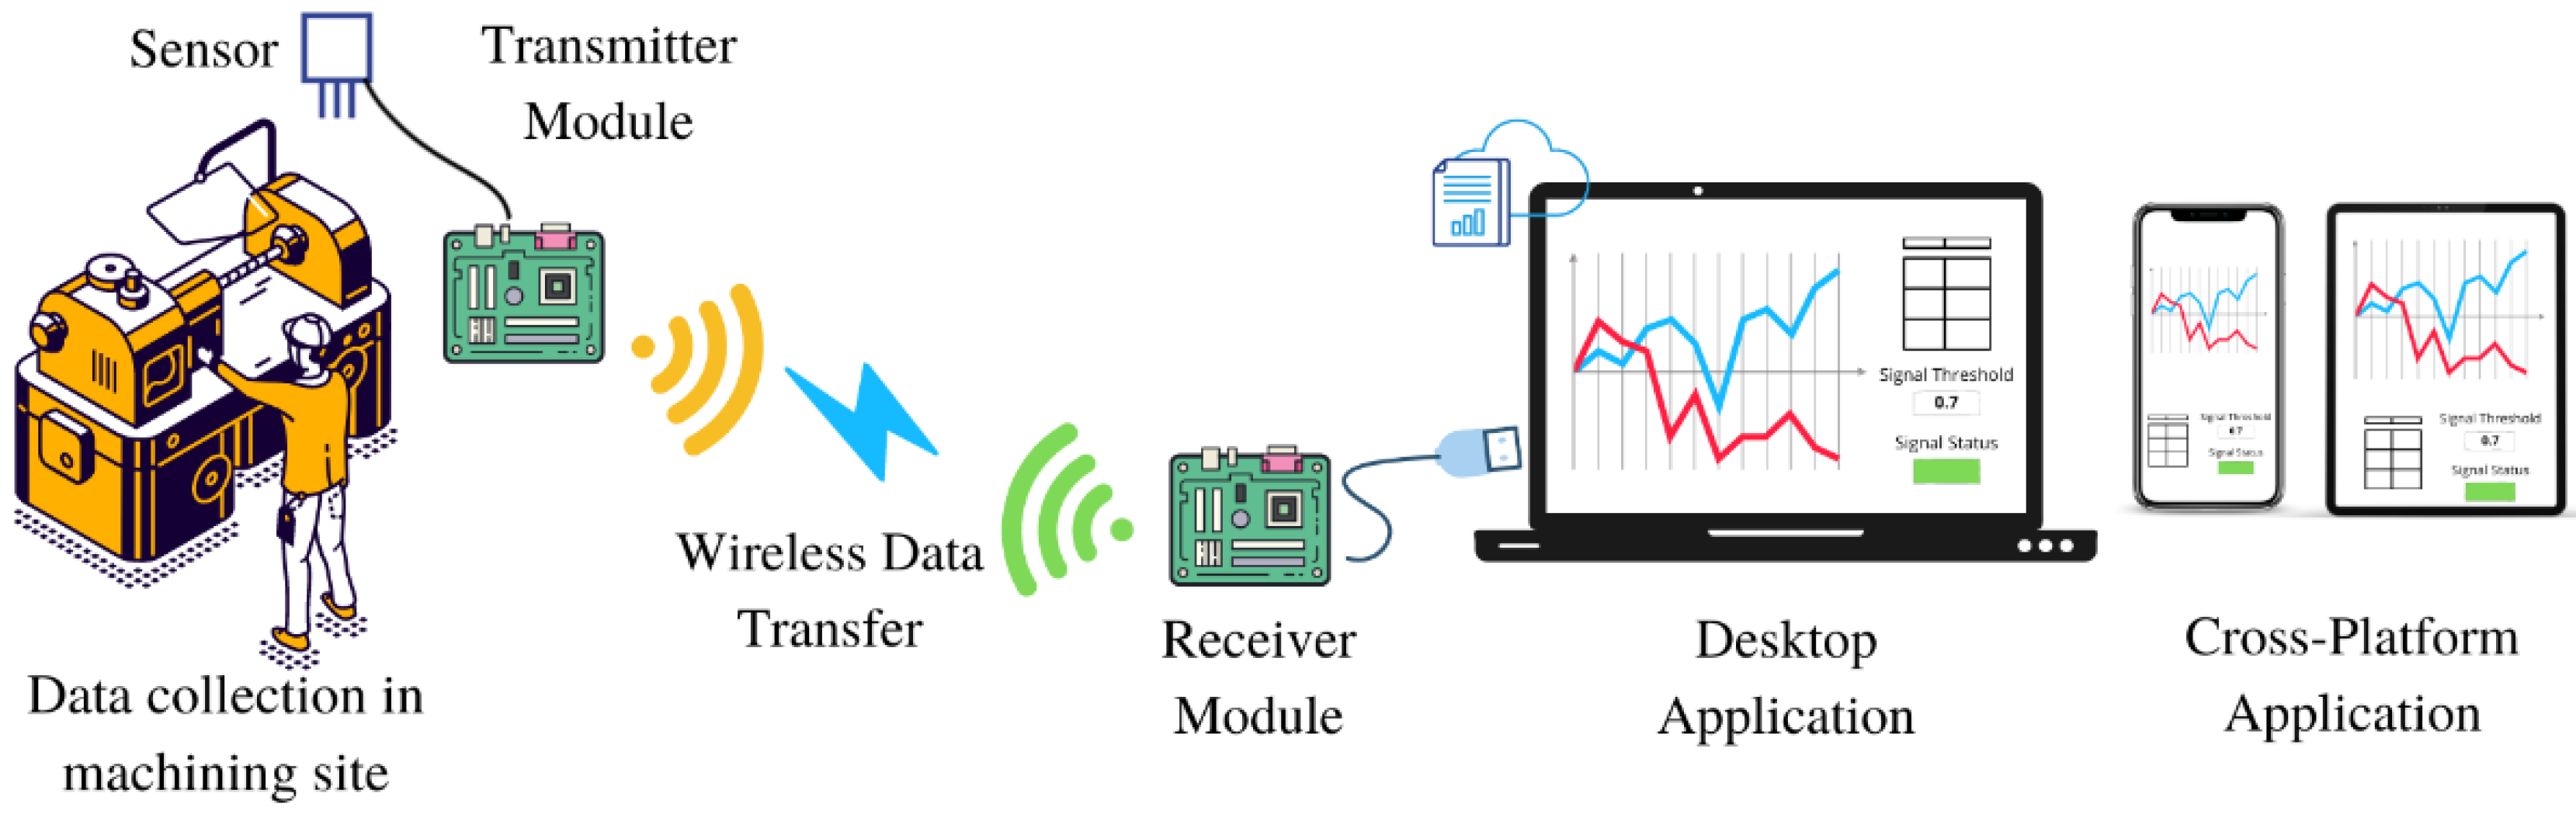
- The application requires data from the data collection system/sensor reading;
- A user interface must be created to act as the main data visualization system display;
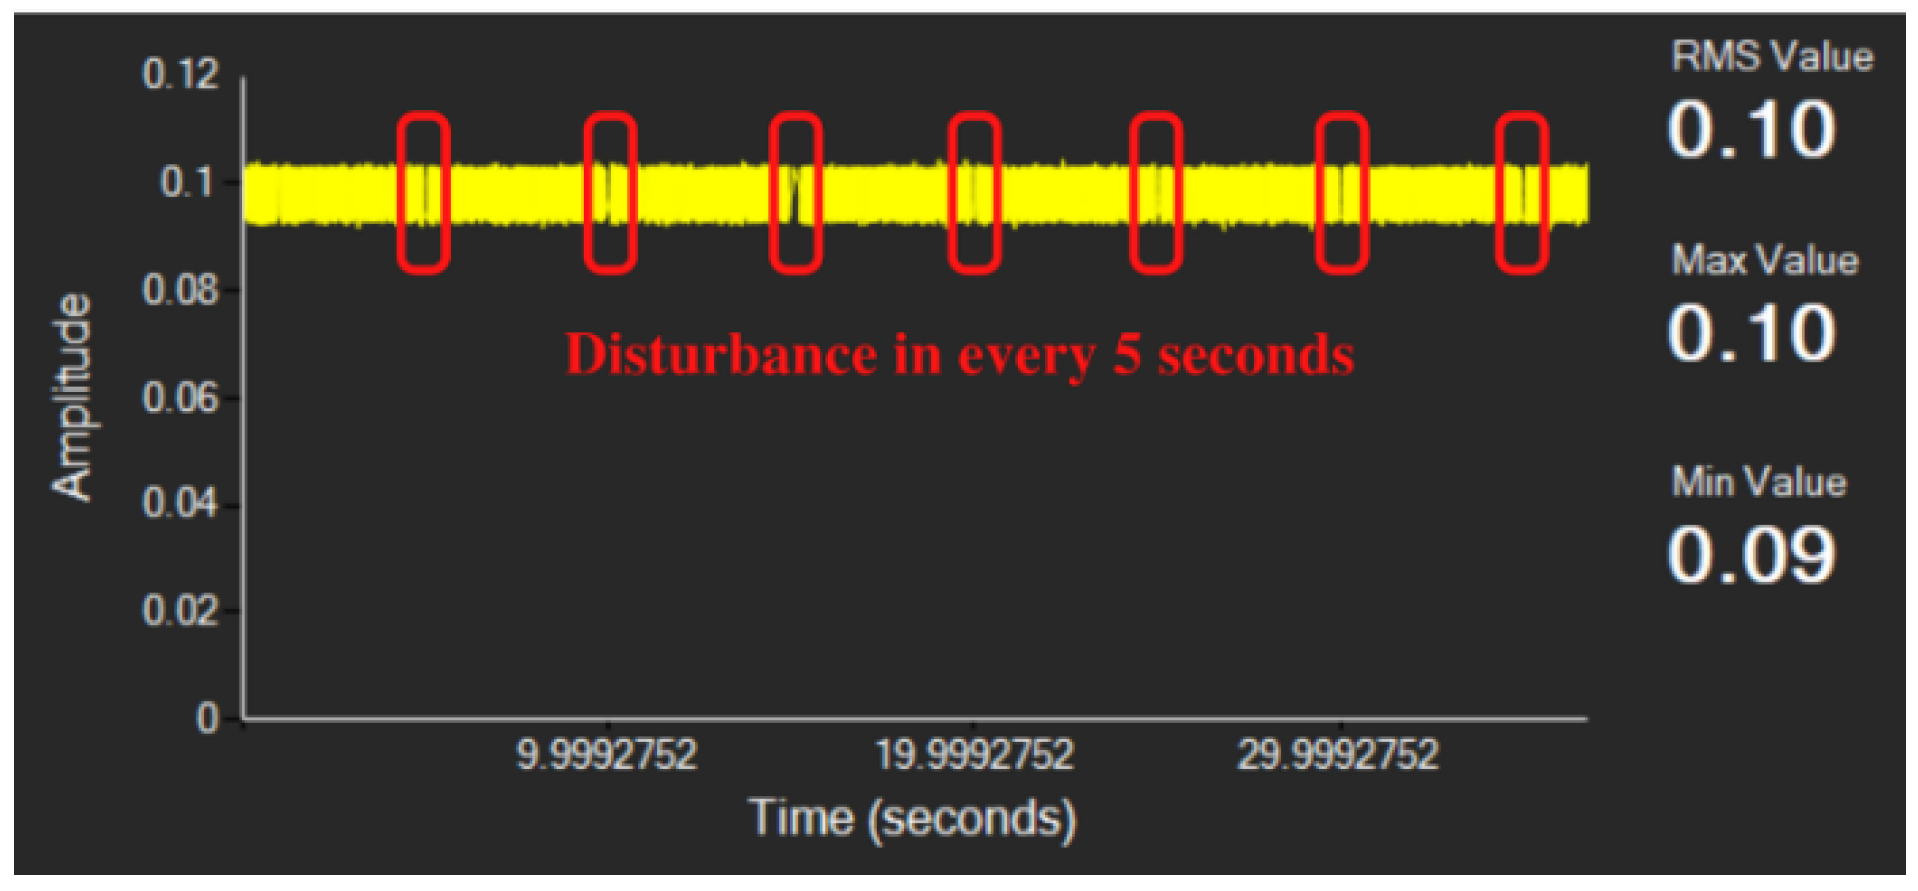
- Data processing on the main UI must be performed in several ways to enable additional data analysis in cross-platform applications. This depends on the behavior of the data to be studied based on physical phenomena;
- The main UI must store the collected and displayed data in the cloud; and
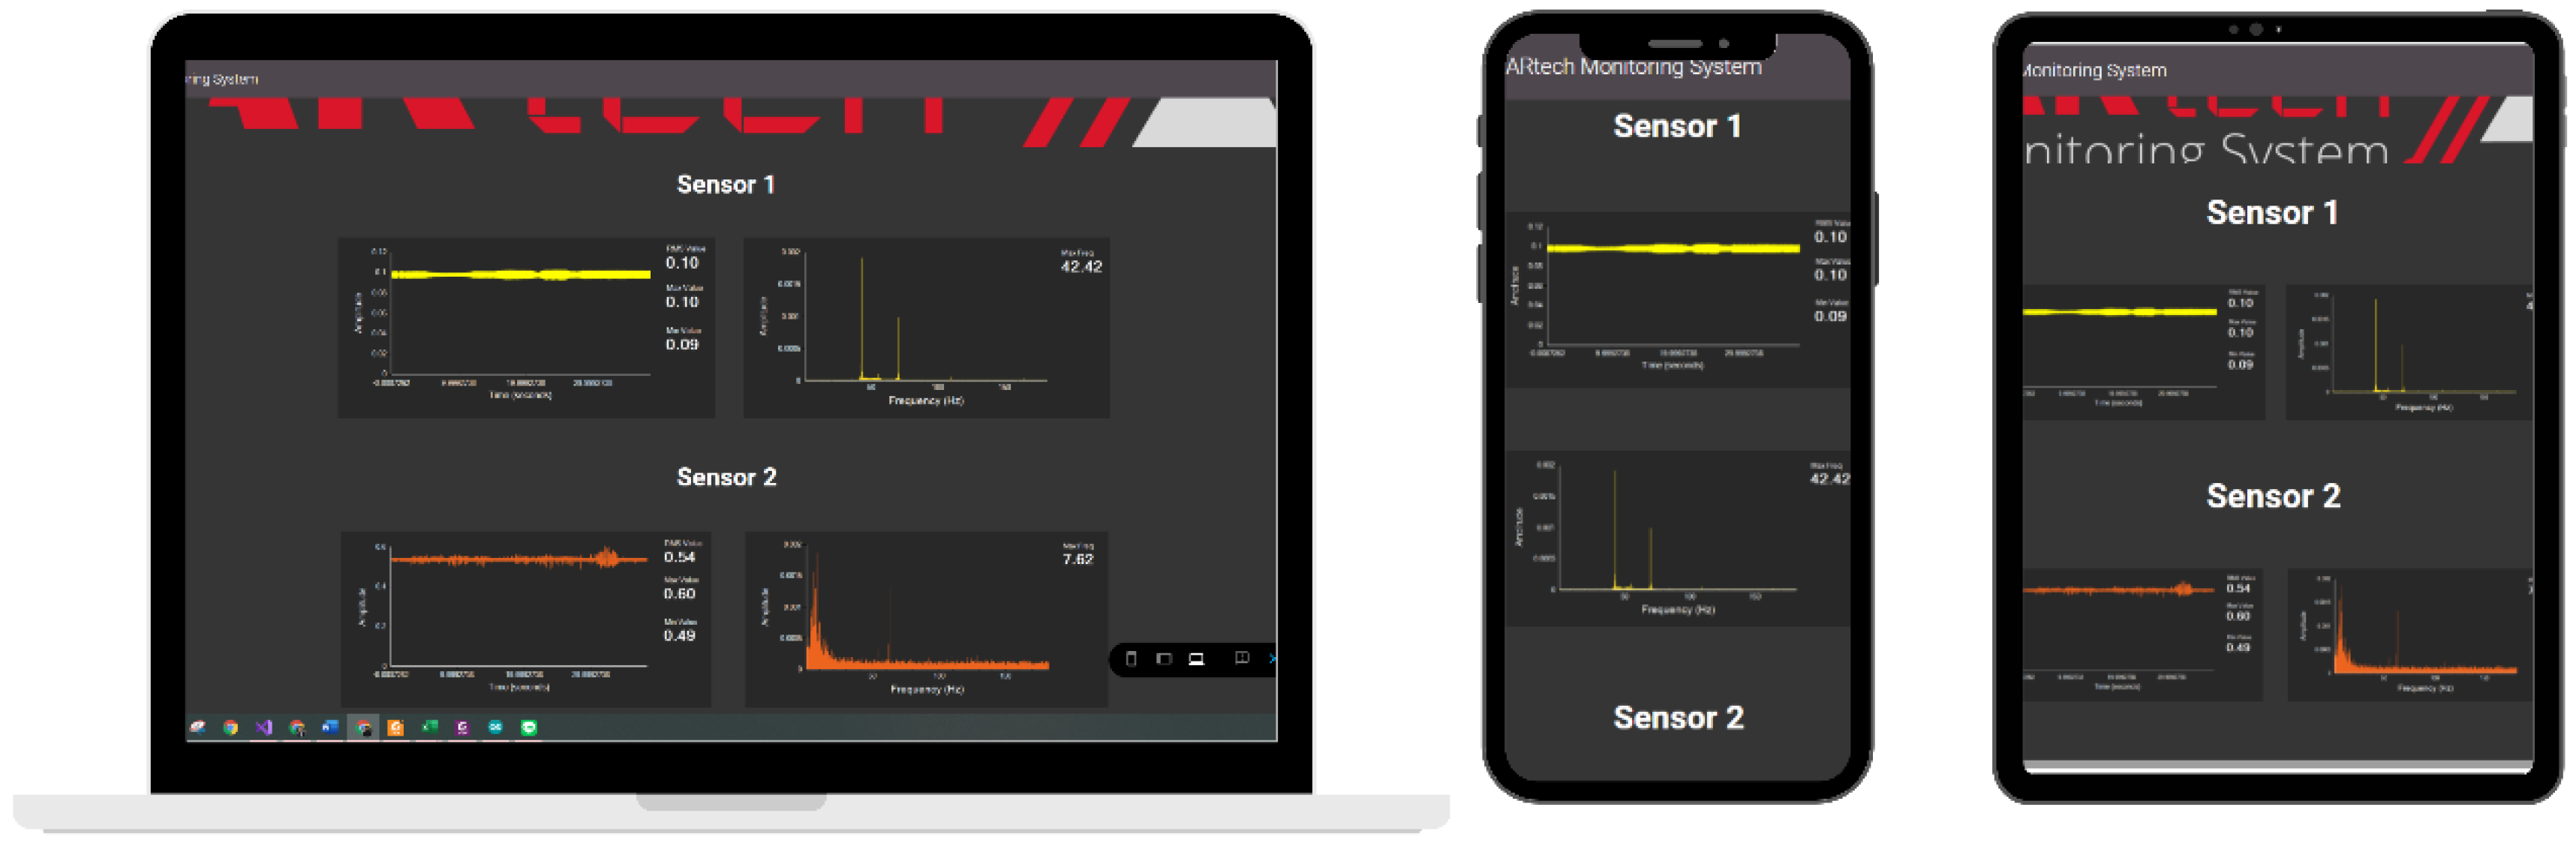
- The application must be applicable across platforms and operating systems.
2.2. Hardware
2.2.1. Arduino DUE
2.2.2. Wireless Communication
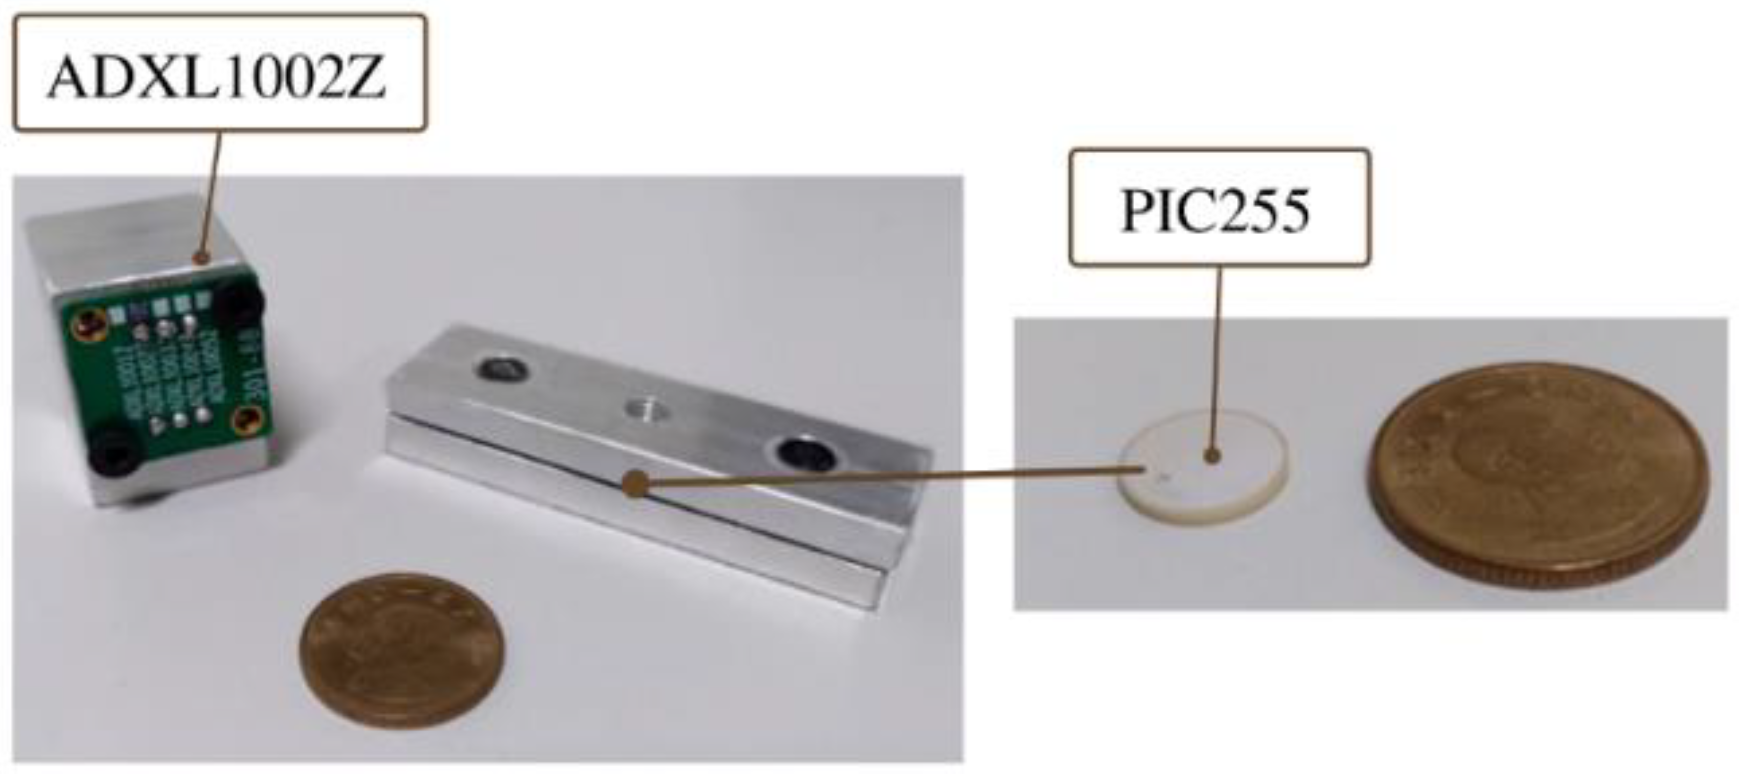
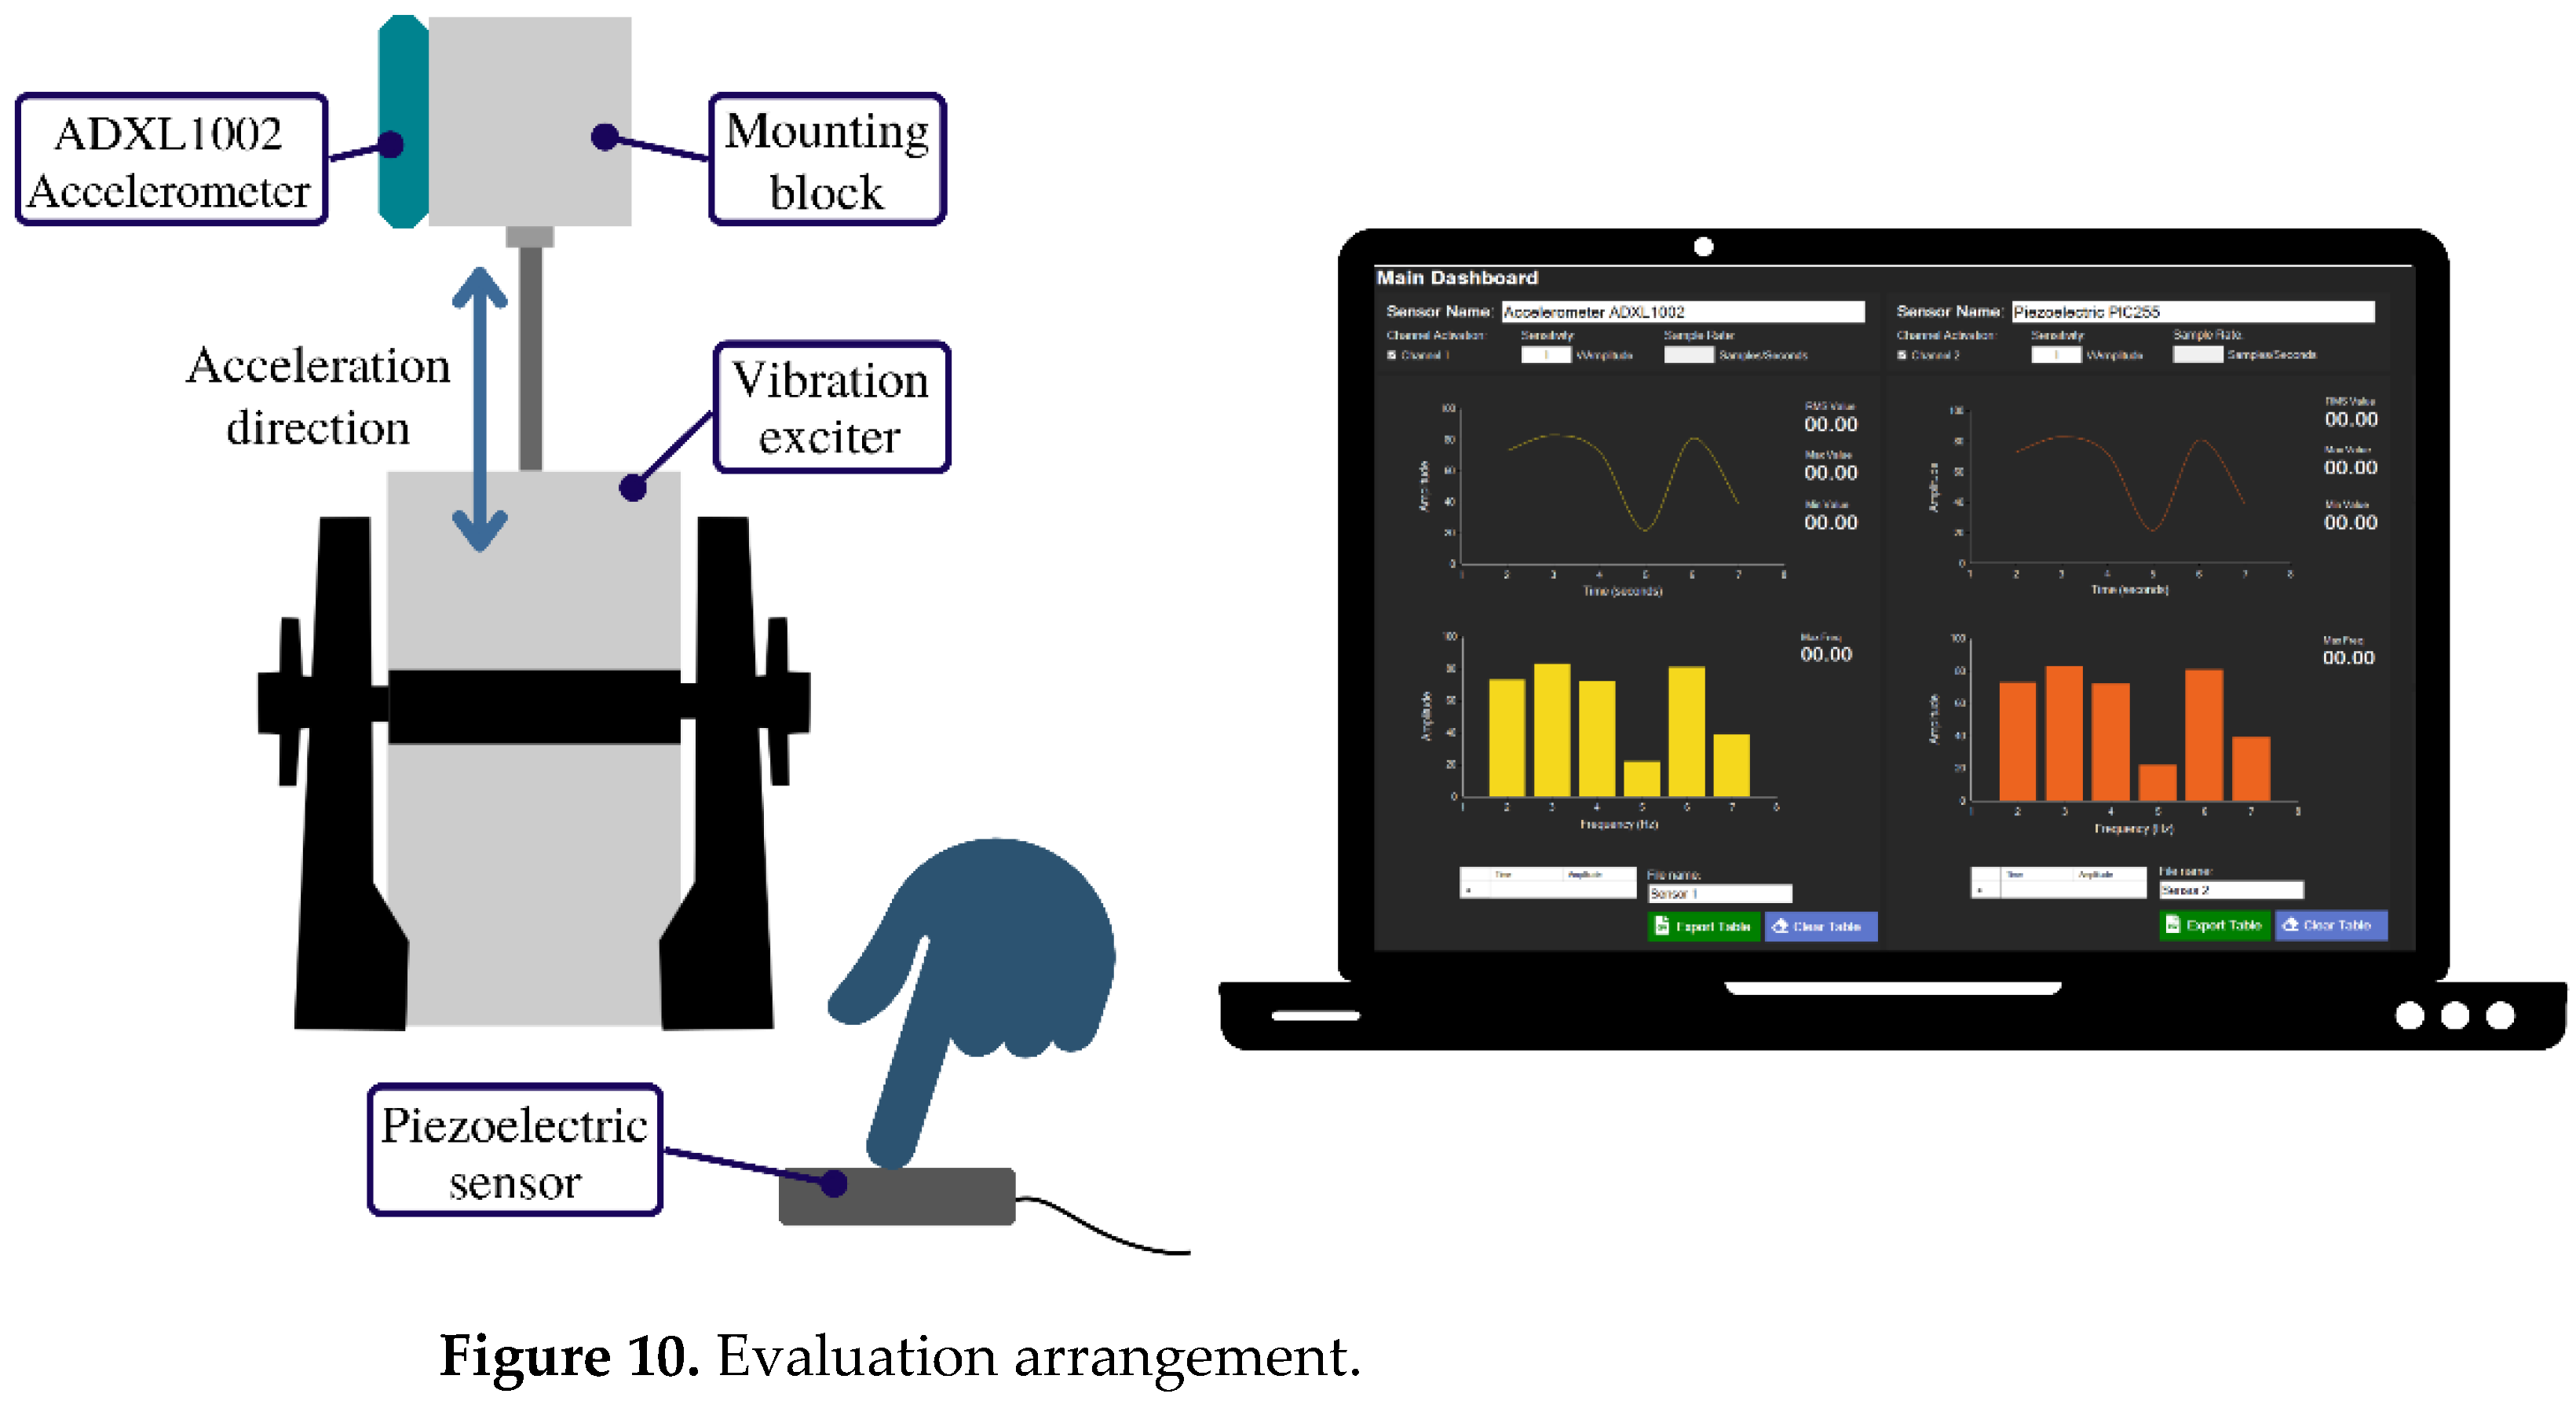
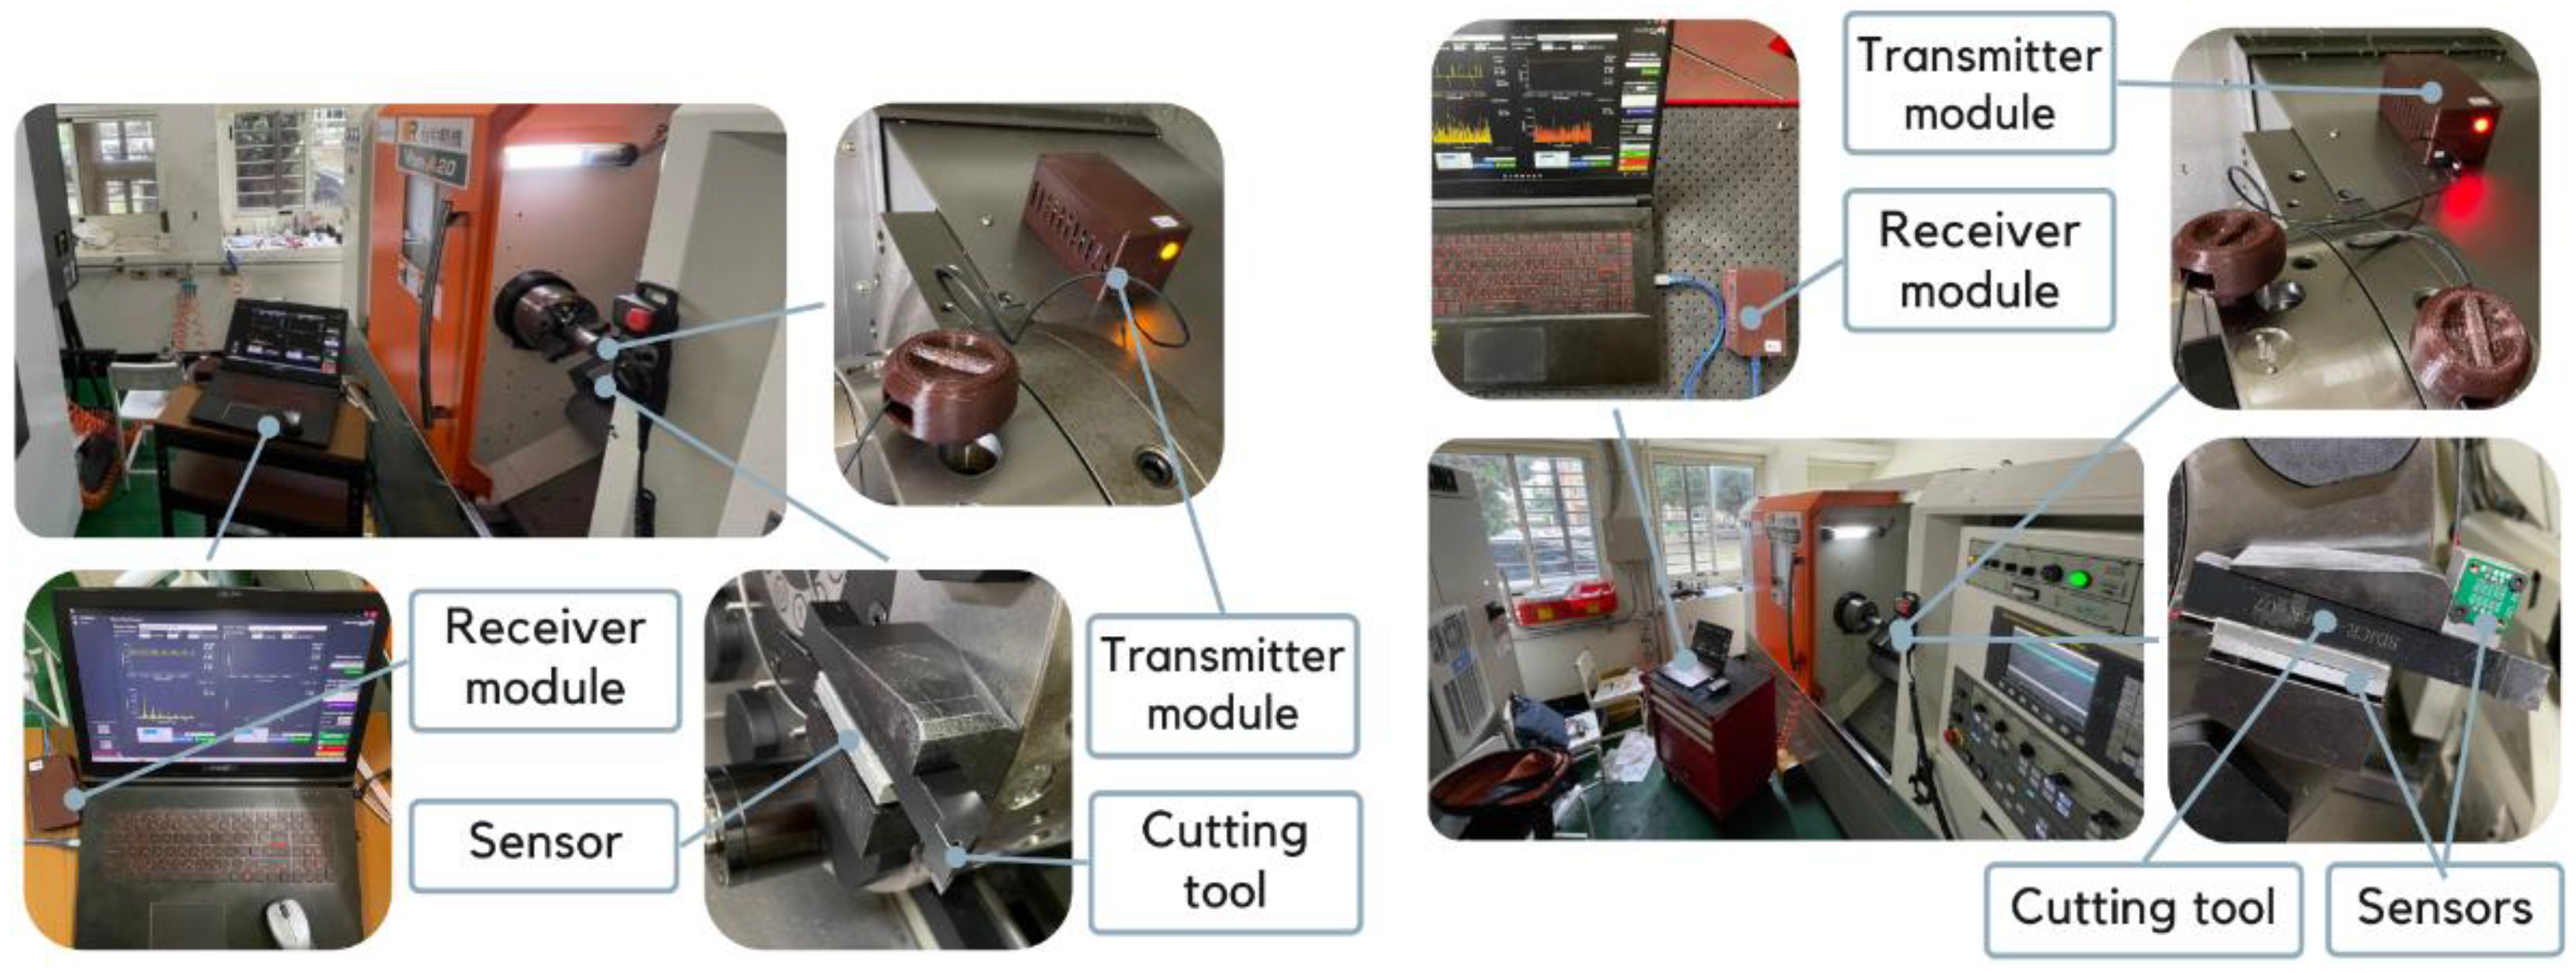
2.2.3. Sensors
2.3. Cross-Platform Application System Architecture
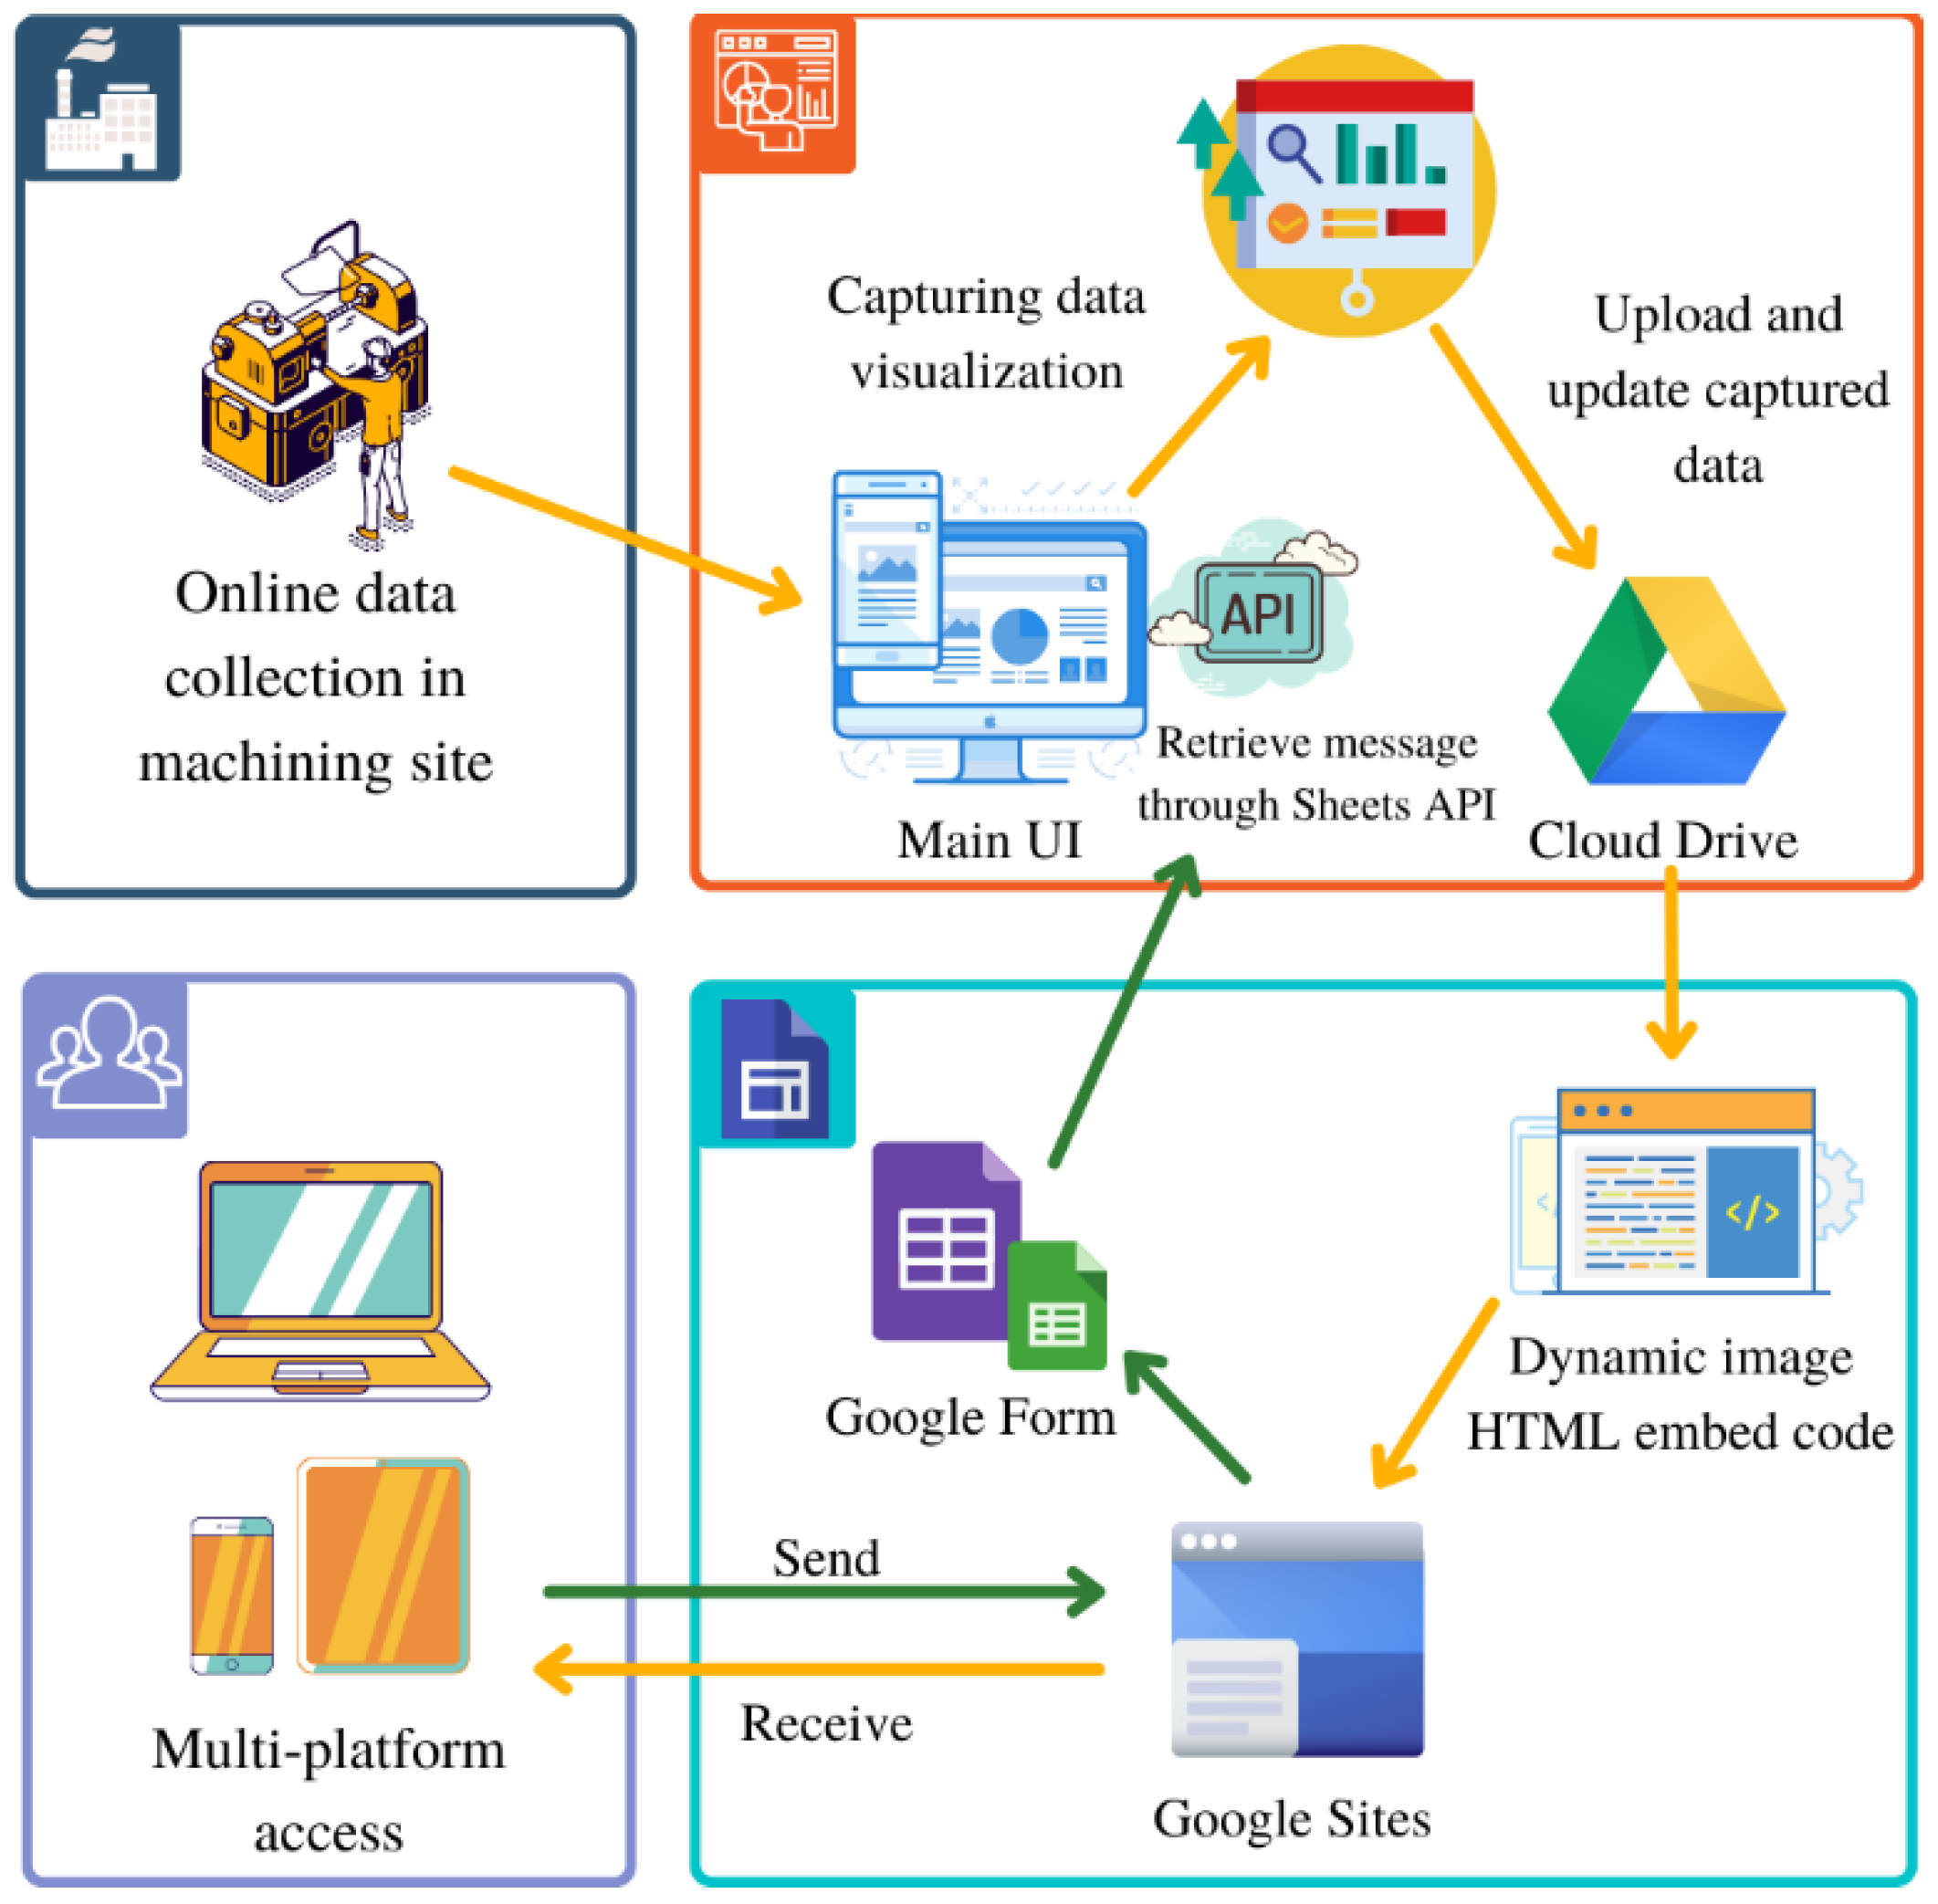
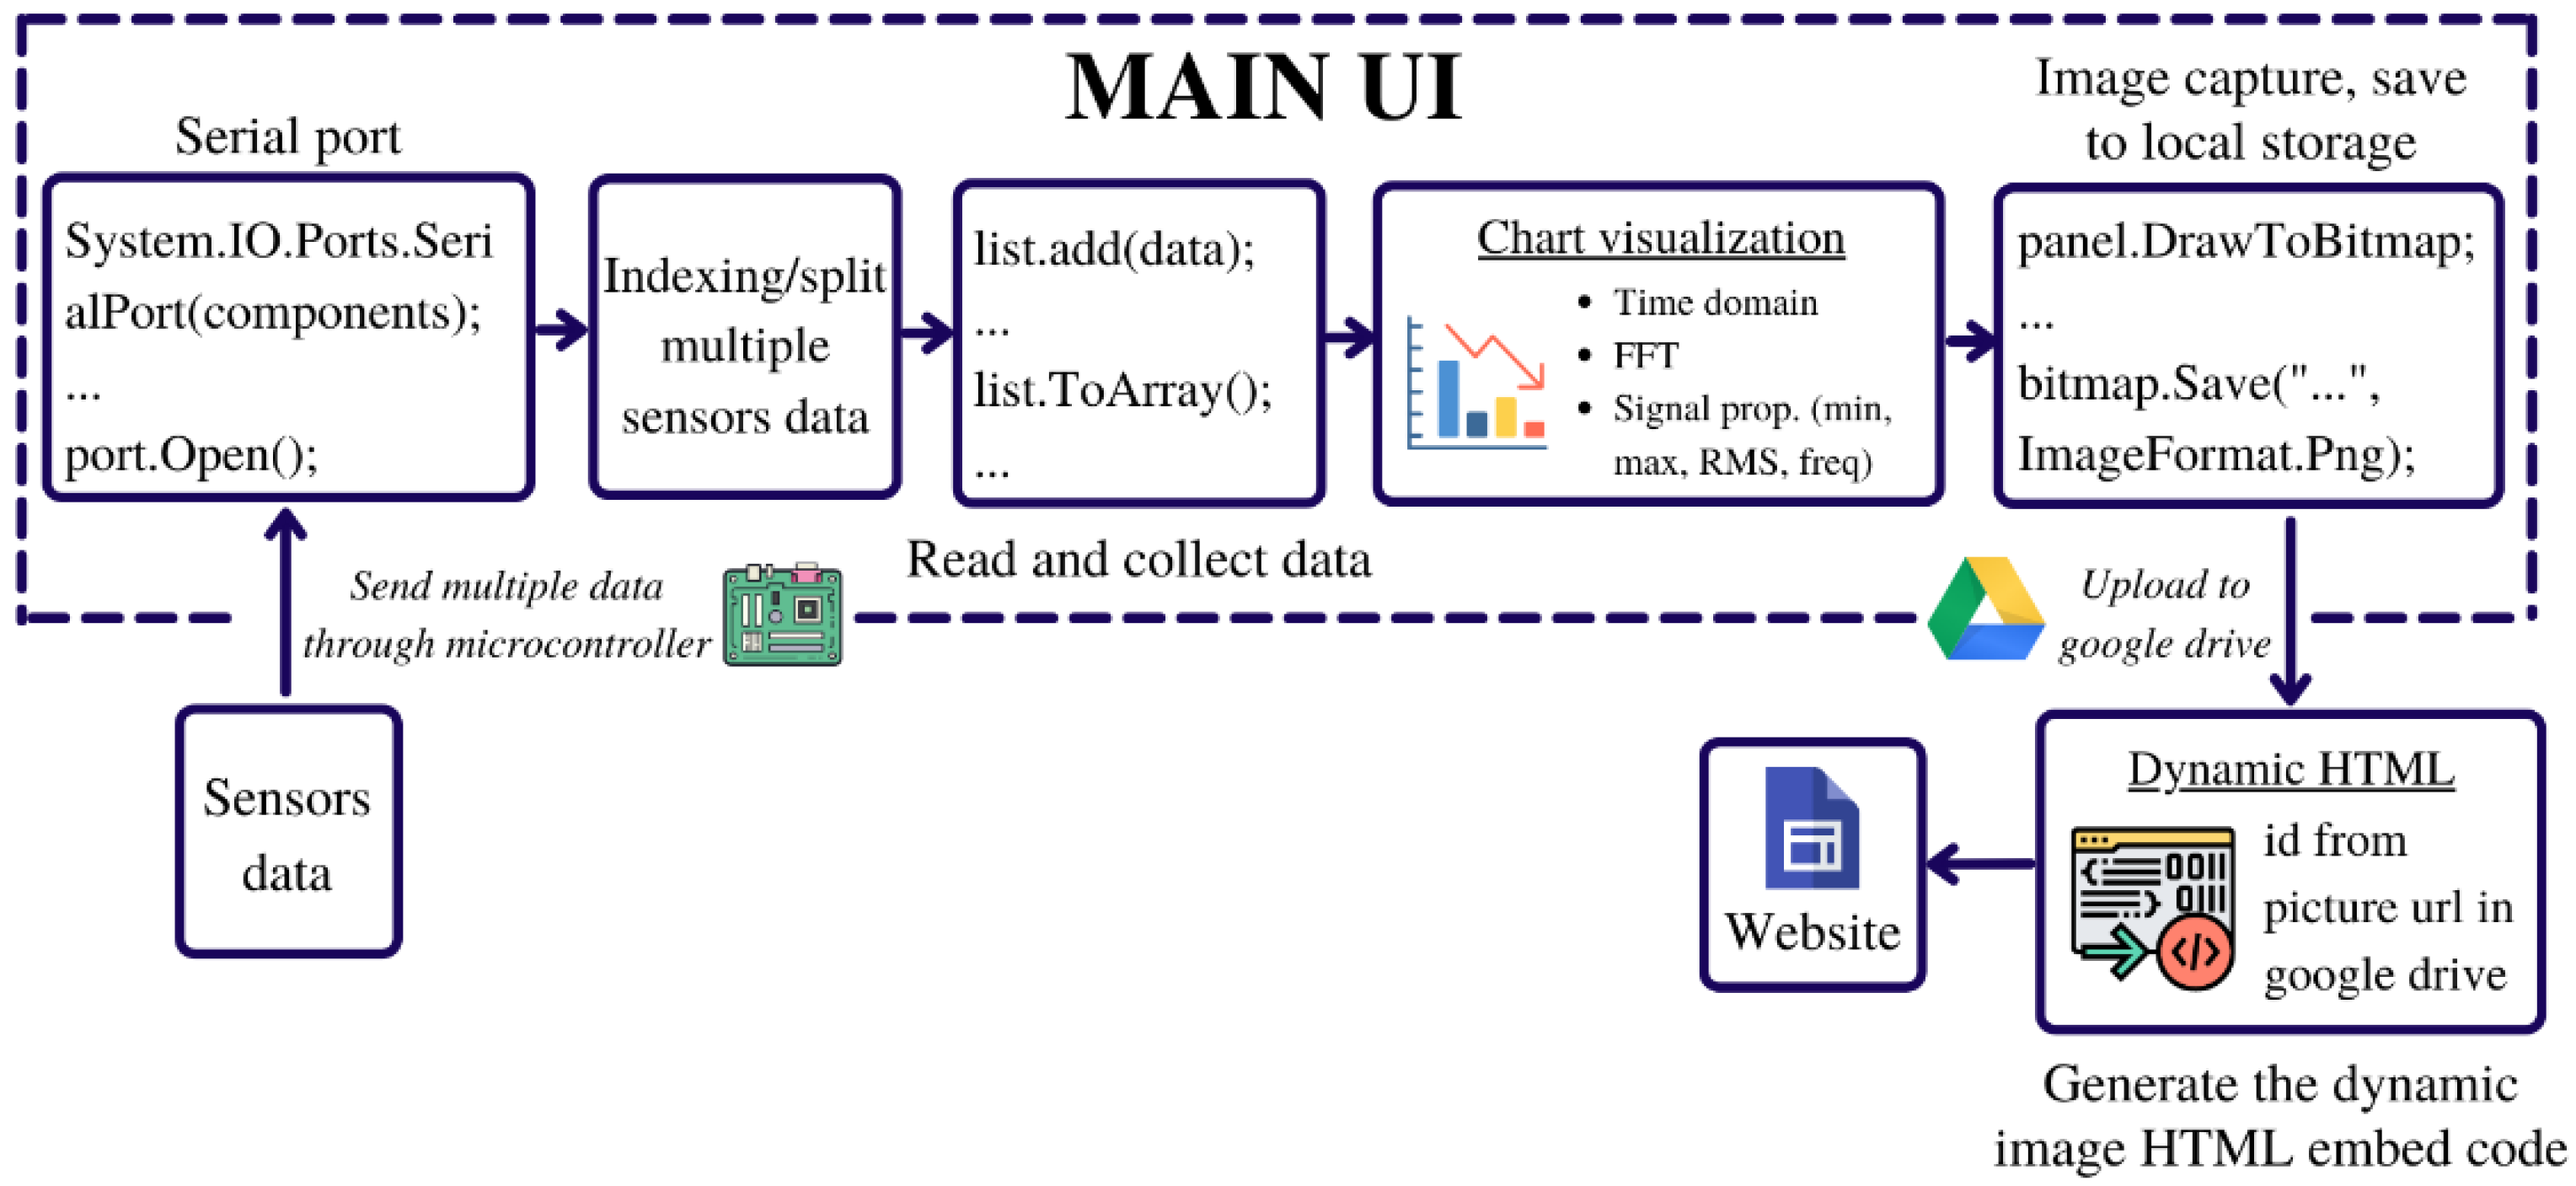
- The Windows Forms app with C# programming language is the primary tool implemented in this system. It was used to build the main UI that displayed the results of the sensor data readings in real time;
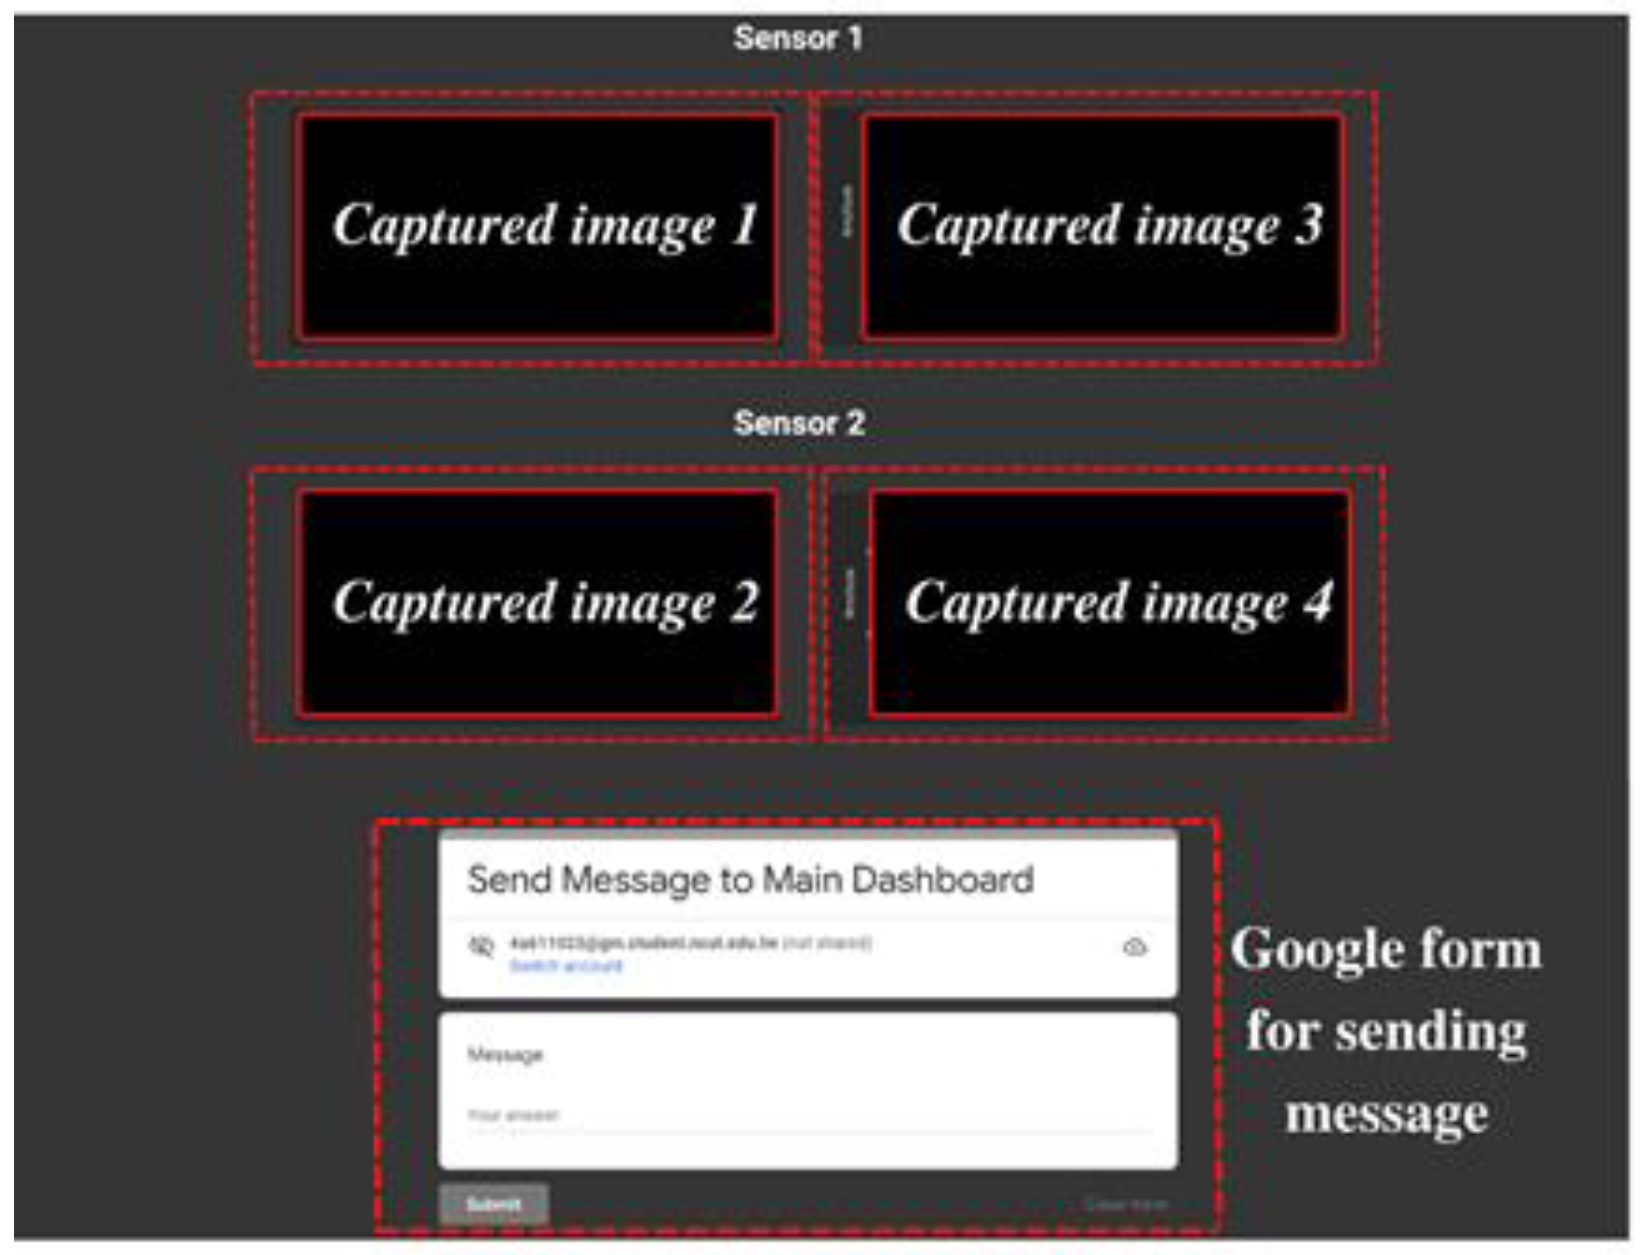
- The Google Drive application synchronizes periodically captured image storage from the main UI;
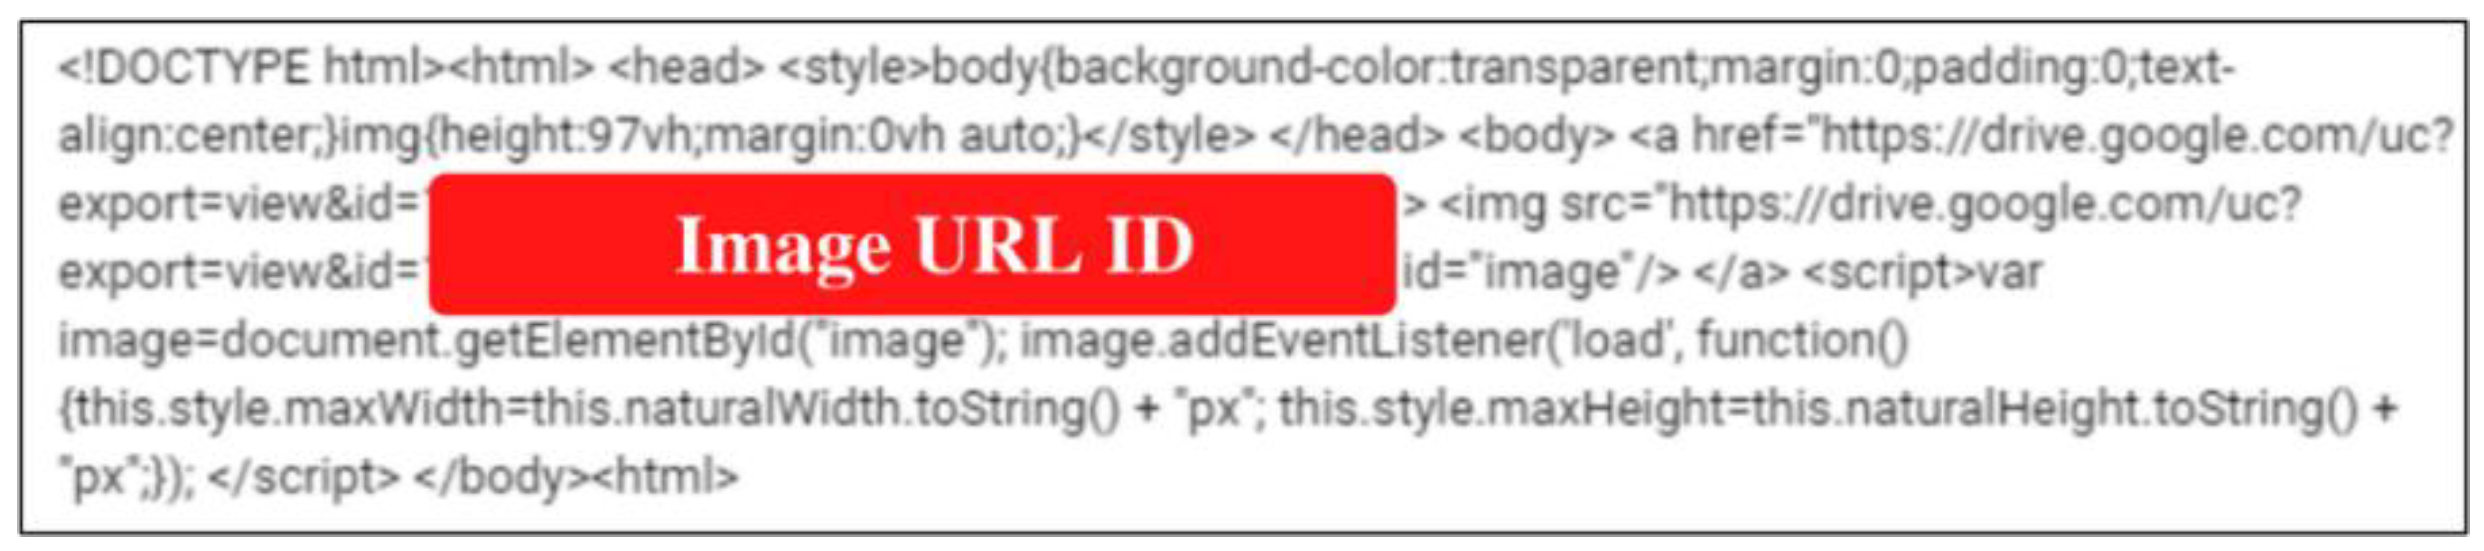
- Google Sites is a website creation tool that is used as a data viewer for images stored on Google Drive;
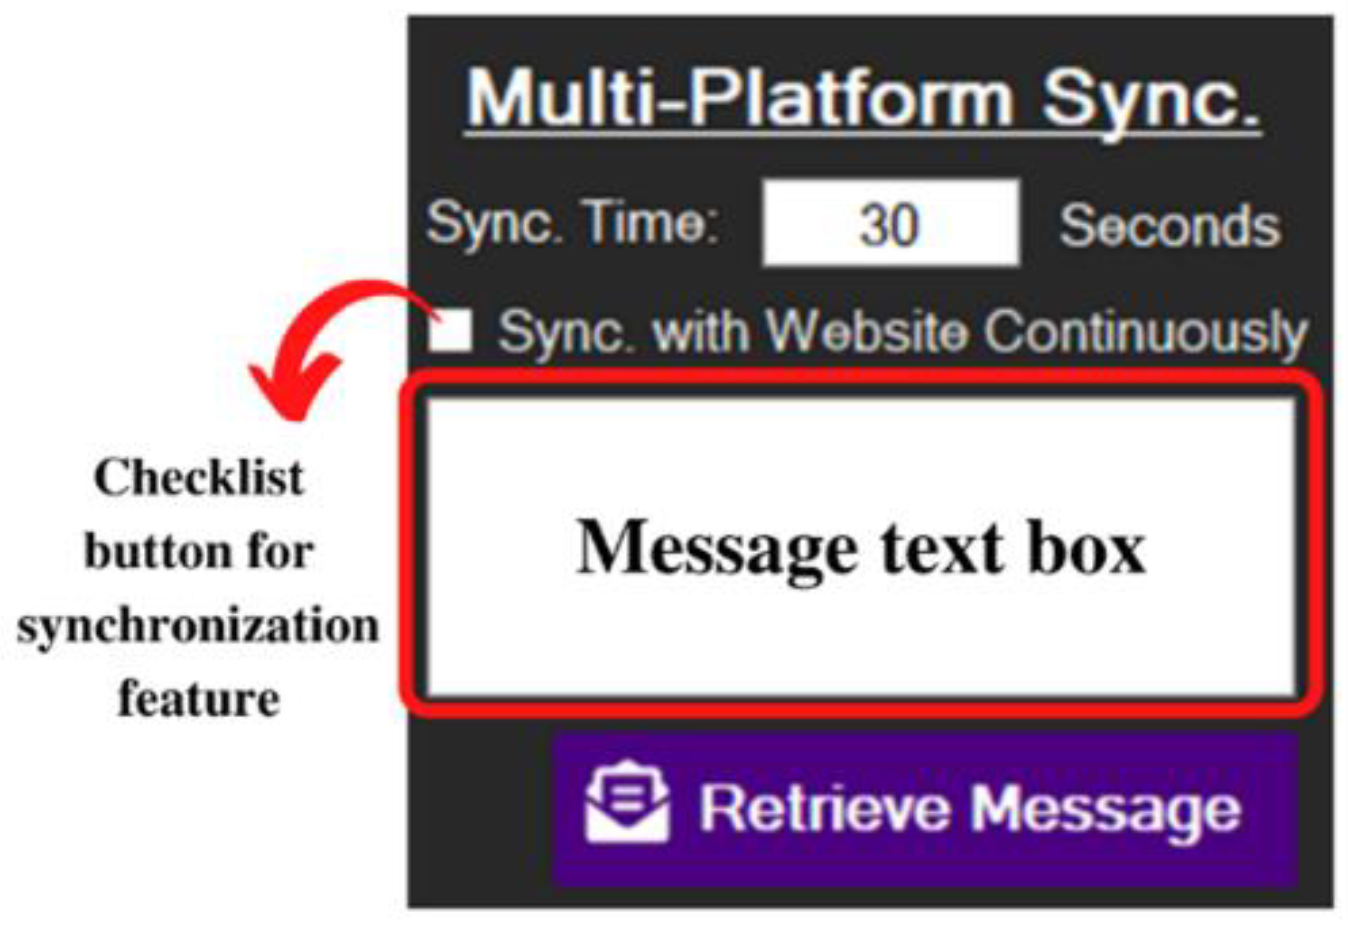
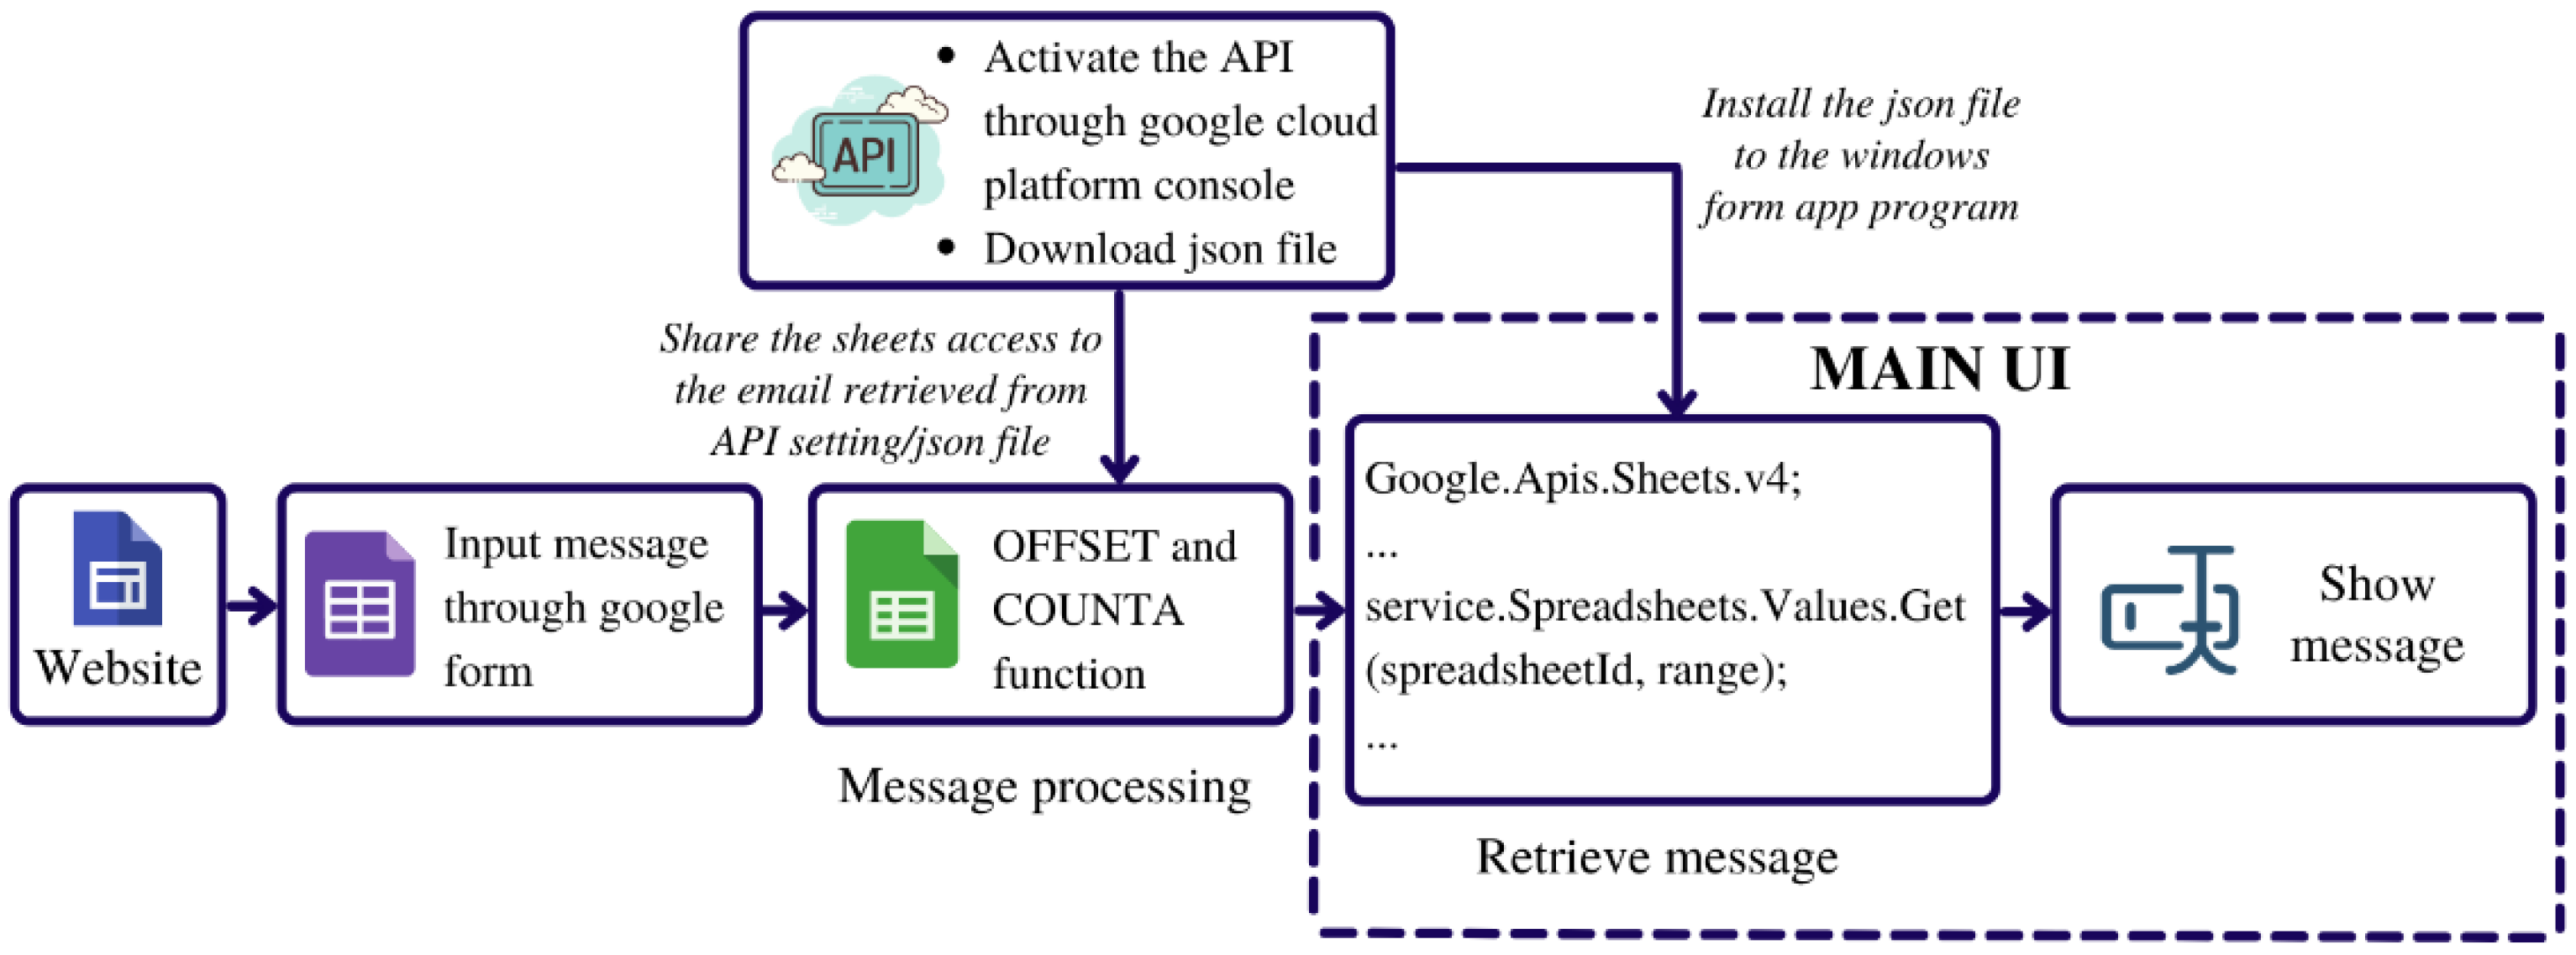
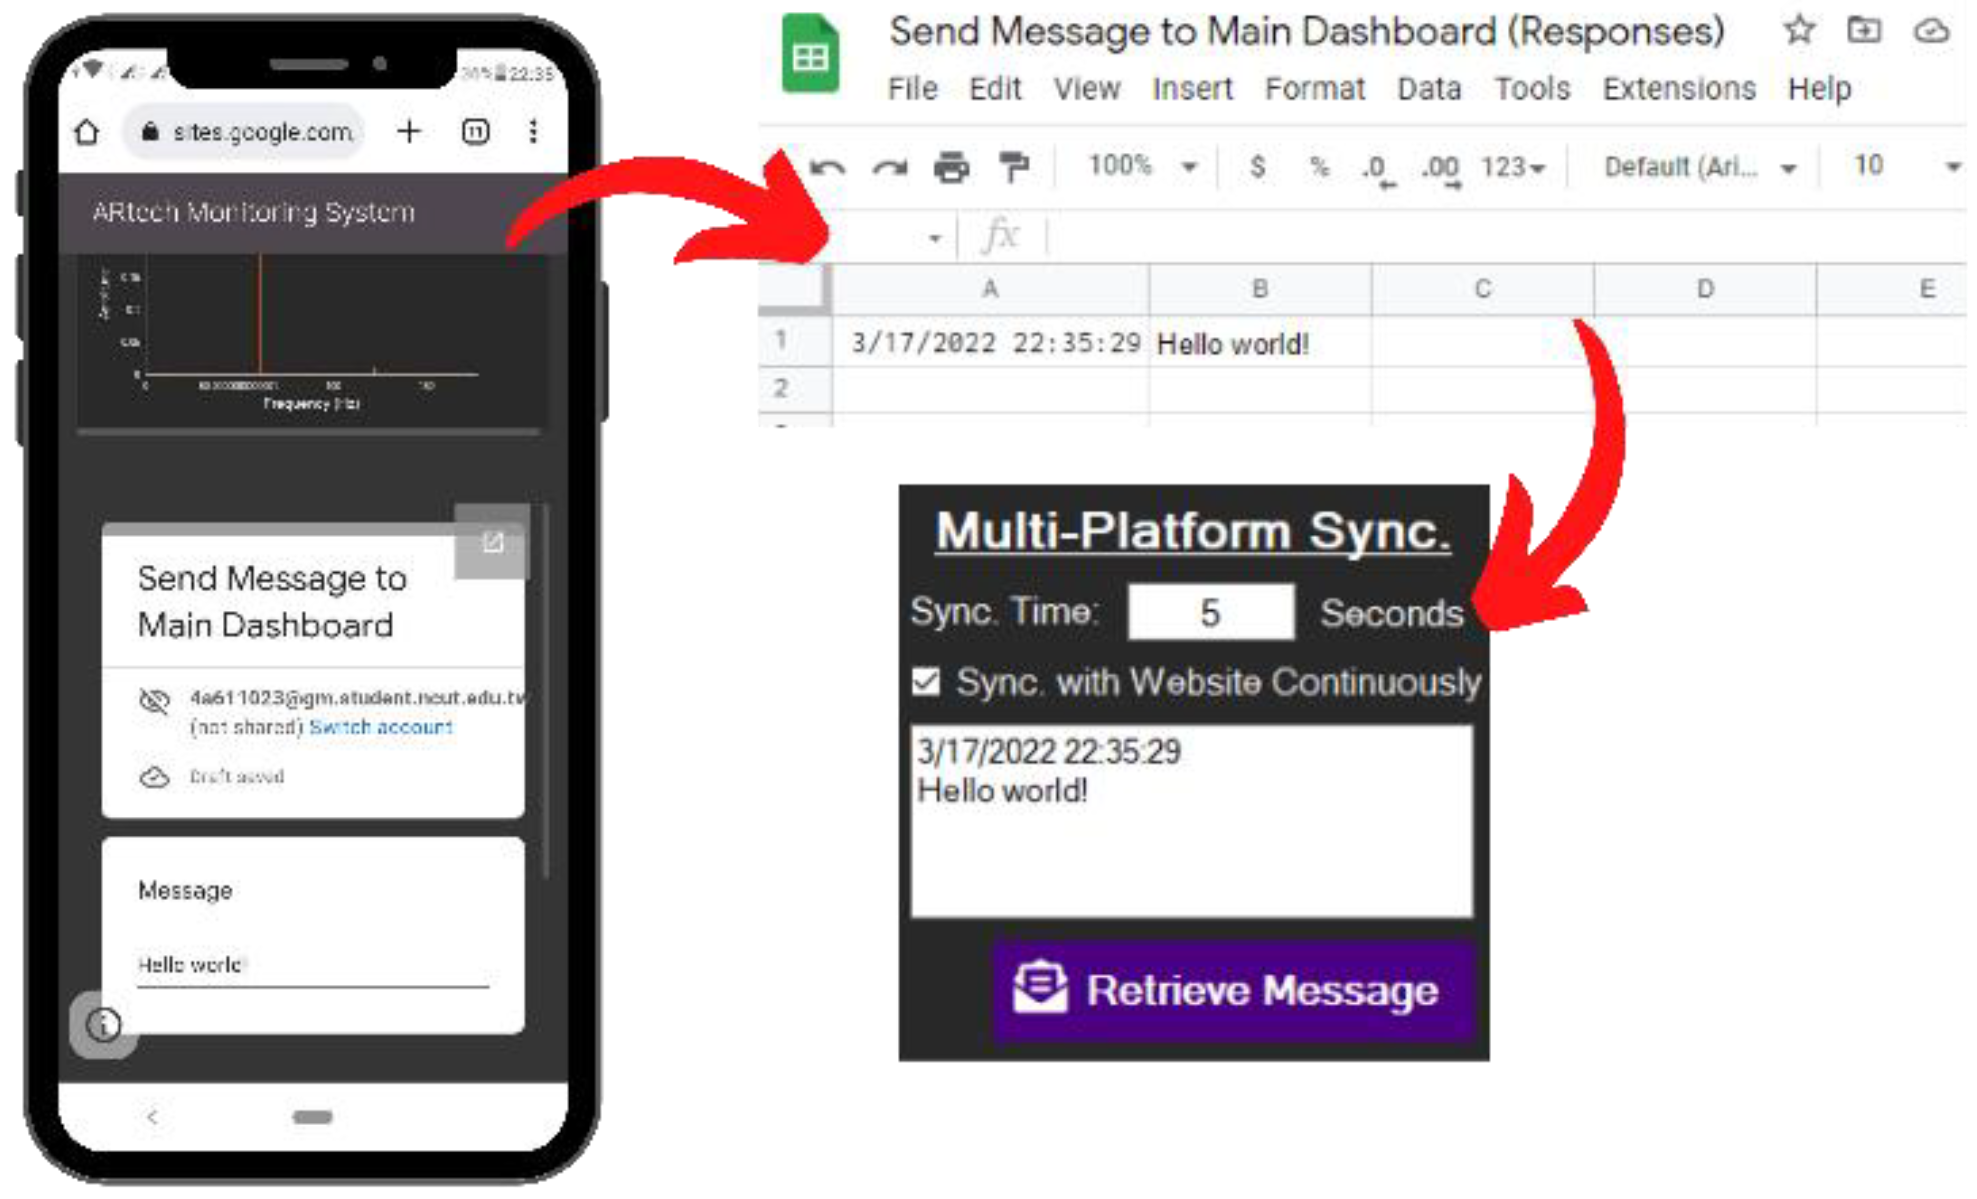
- Google Forms is used for the messenger feature;
- Google Sheets is responsible for processing messages sent on the main UI;
- The Google Sheets API is used for interconnection between Google Sheets and the main UI.
3. Design Results
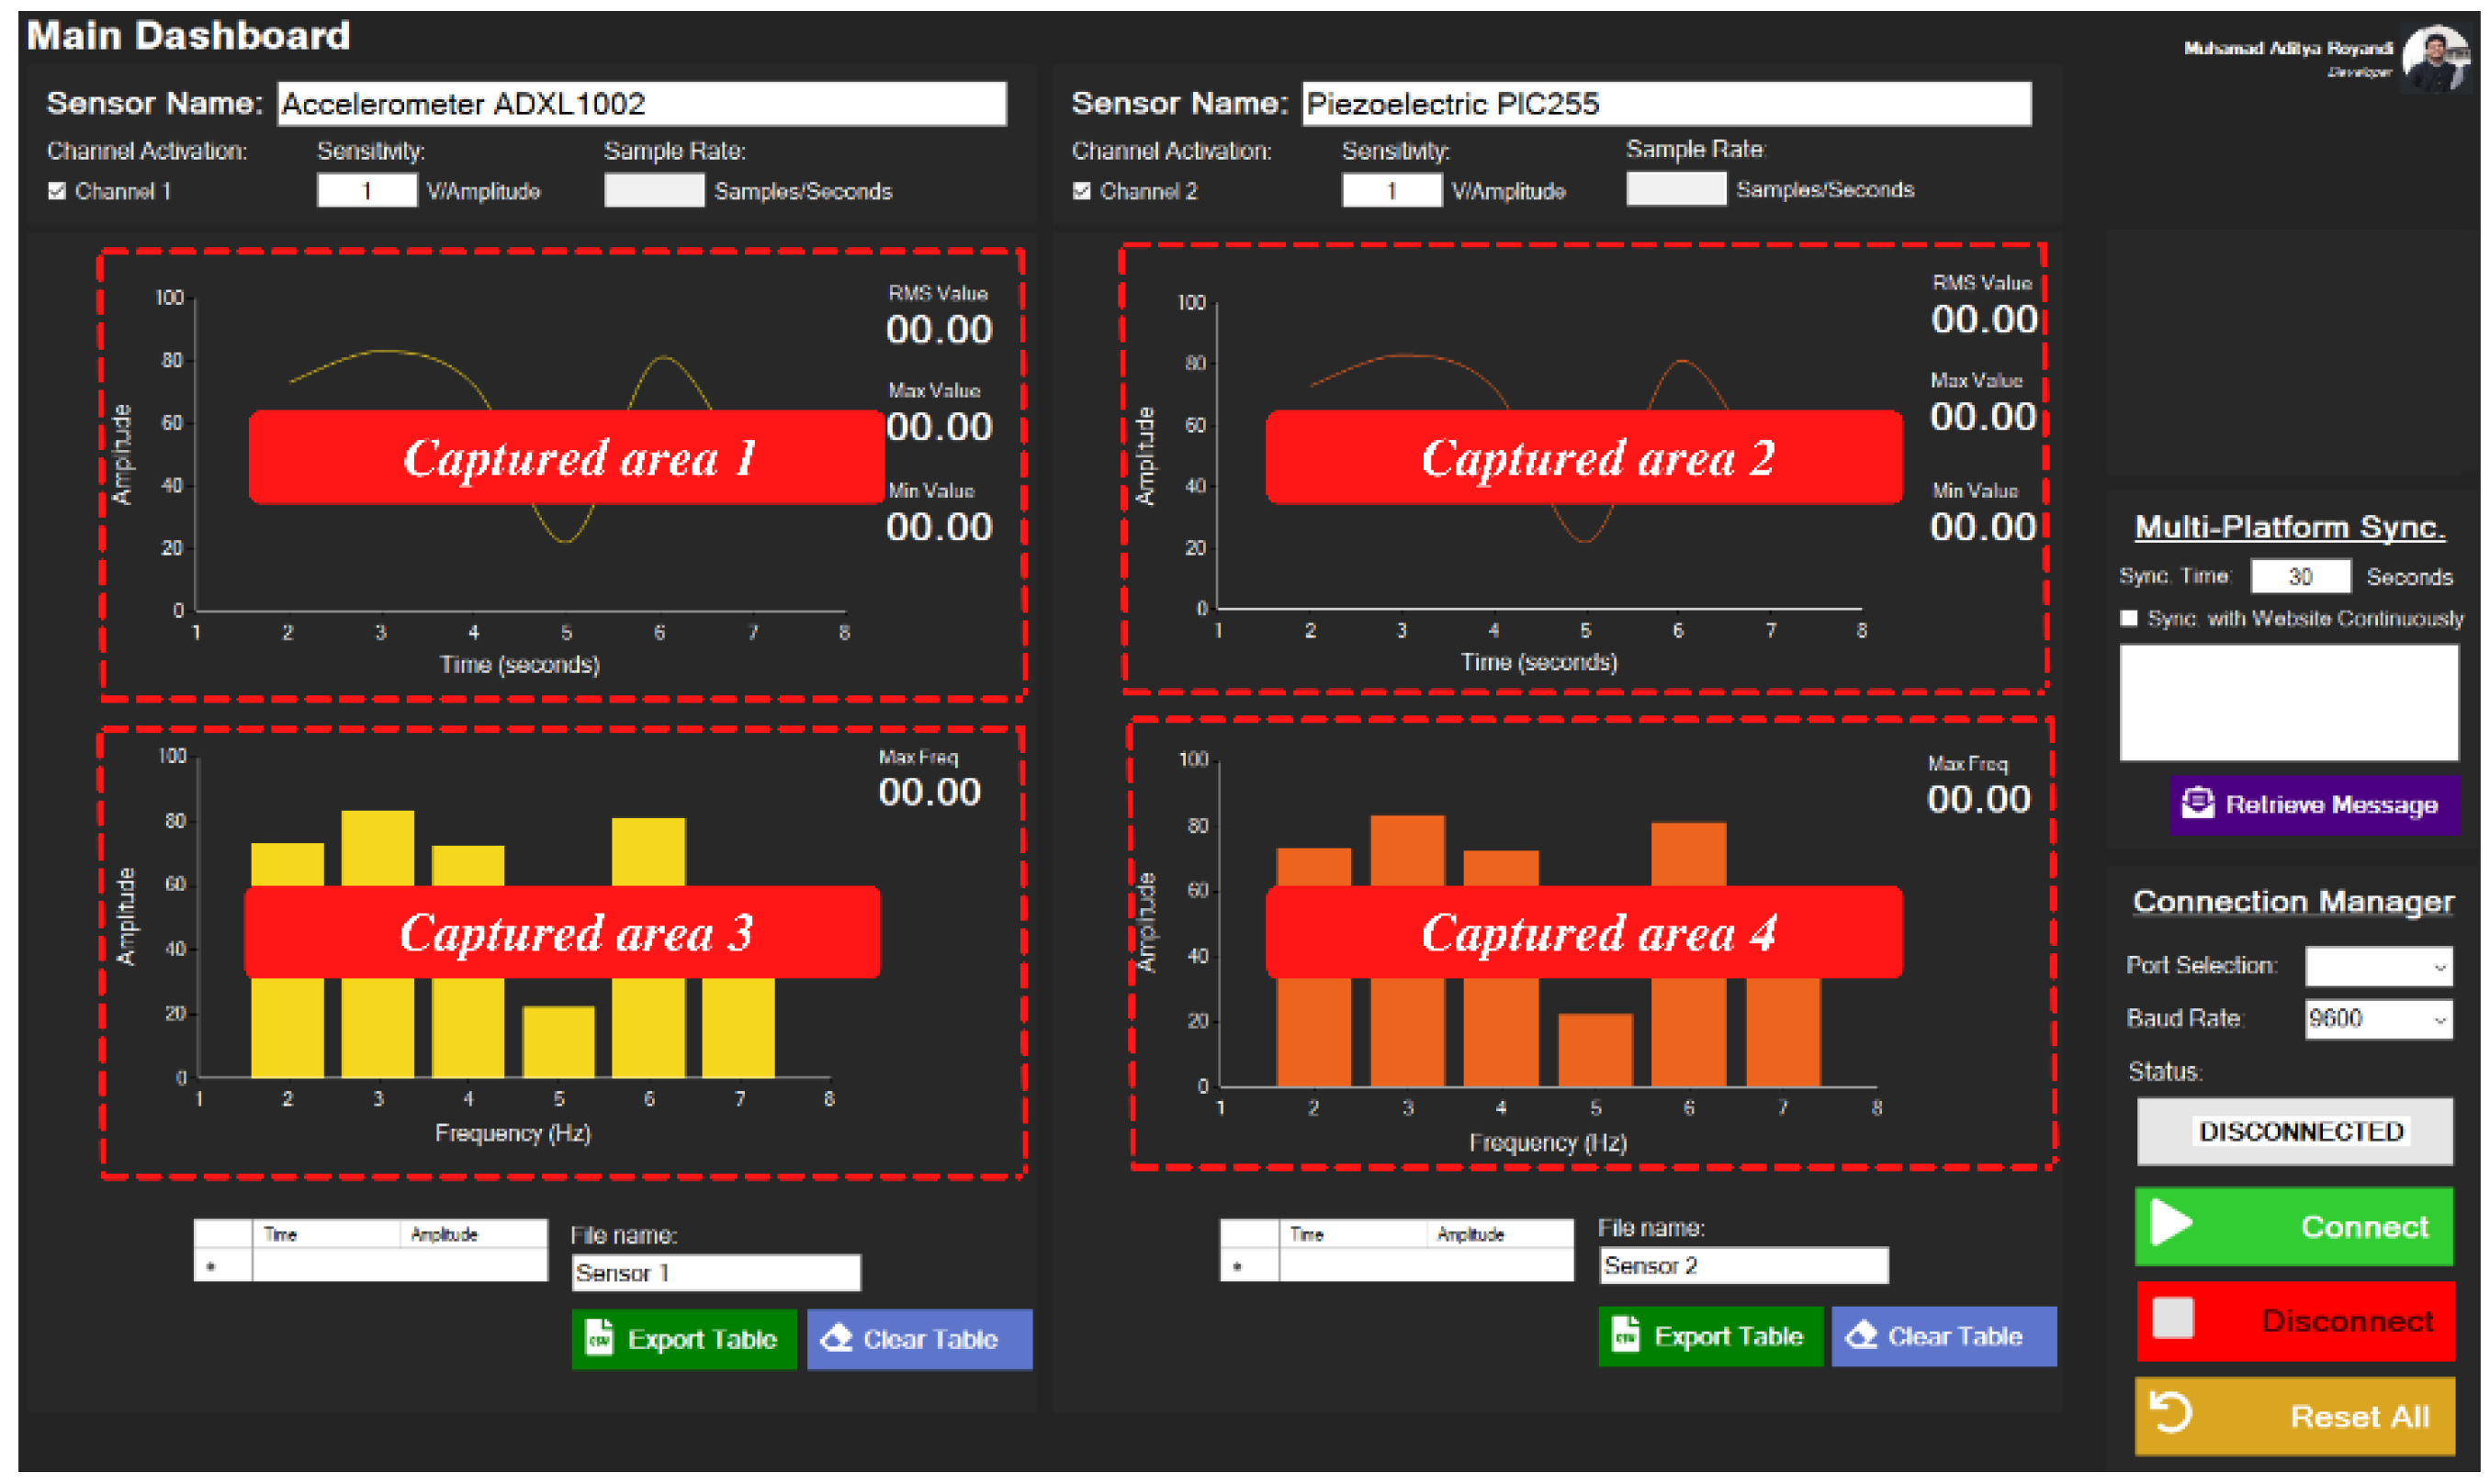
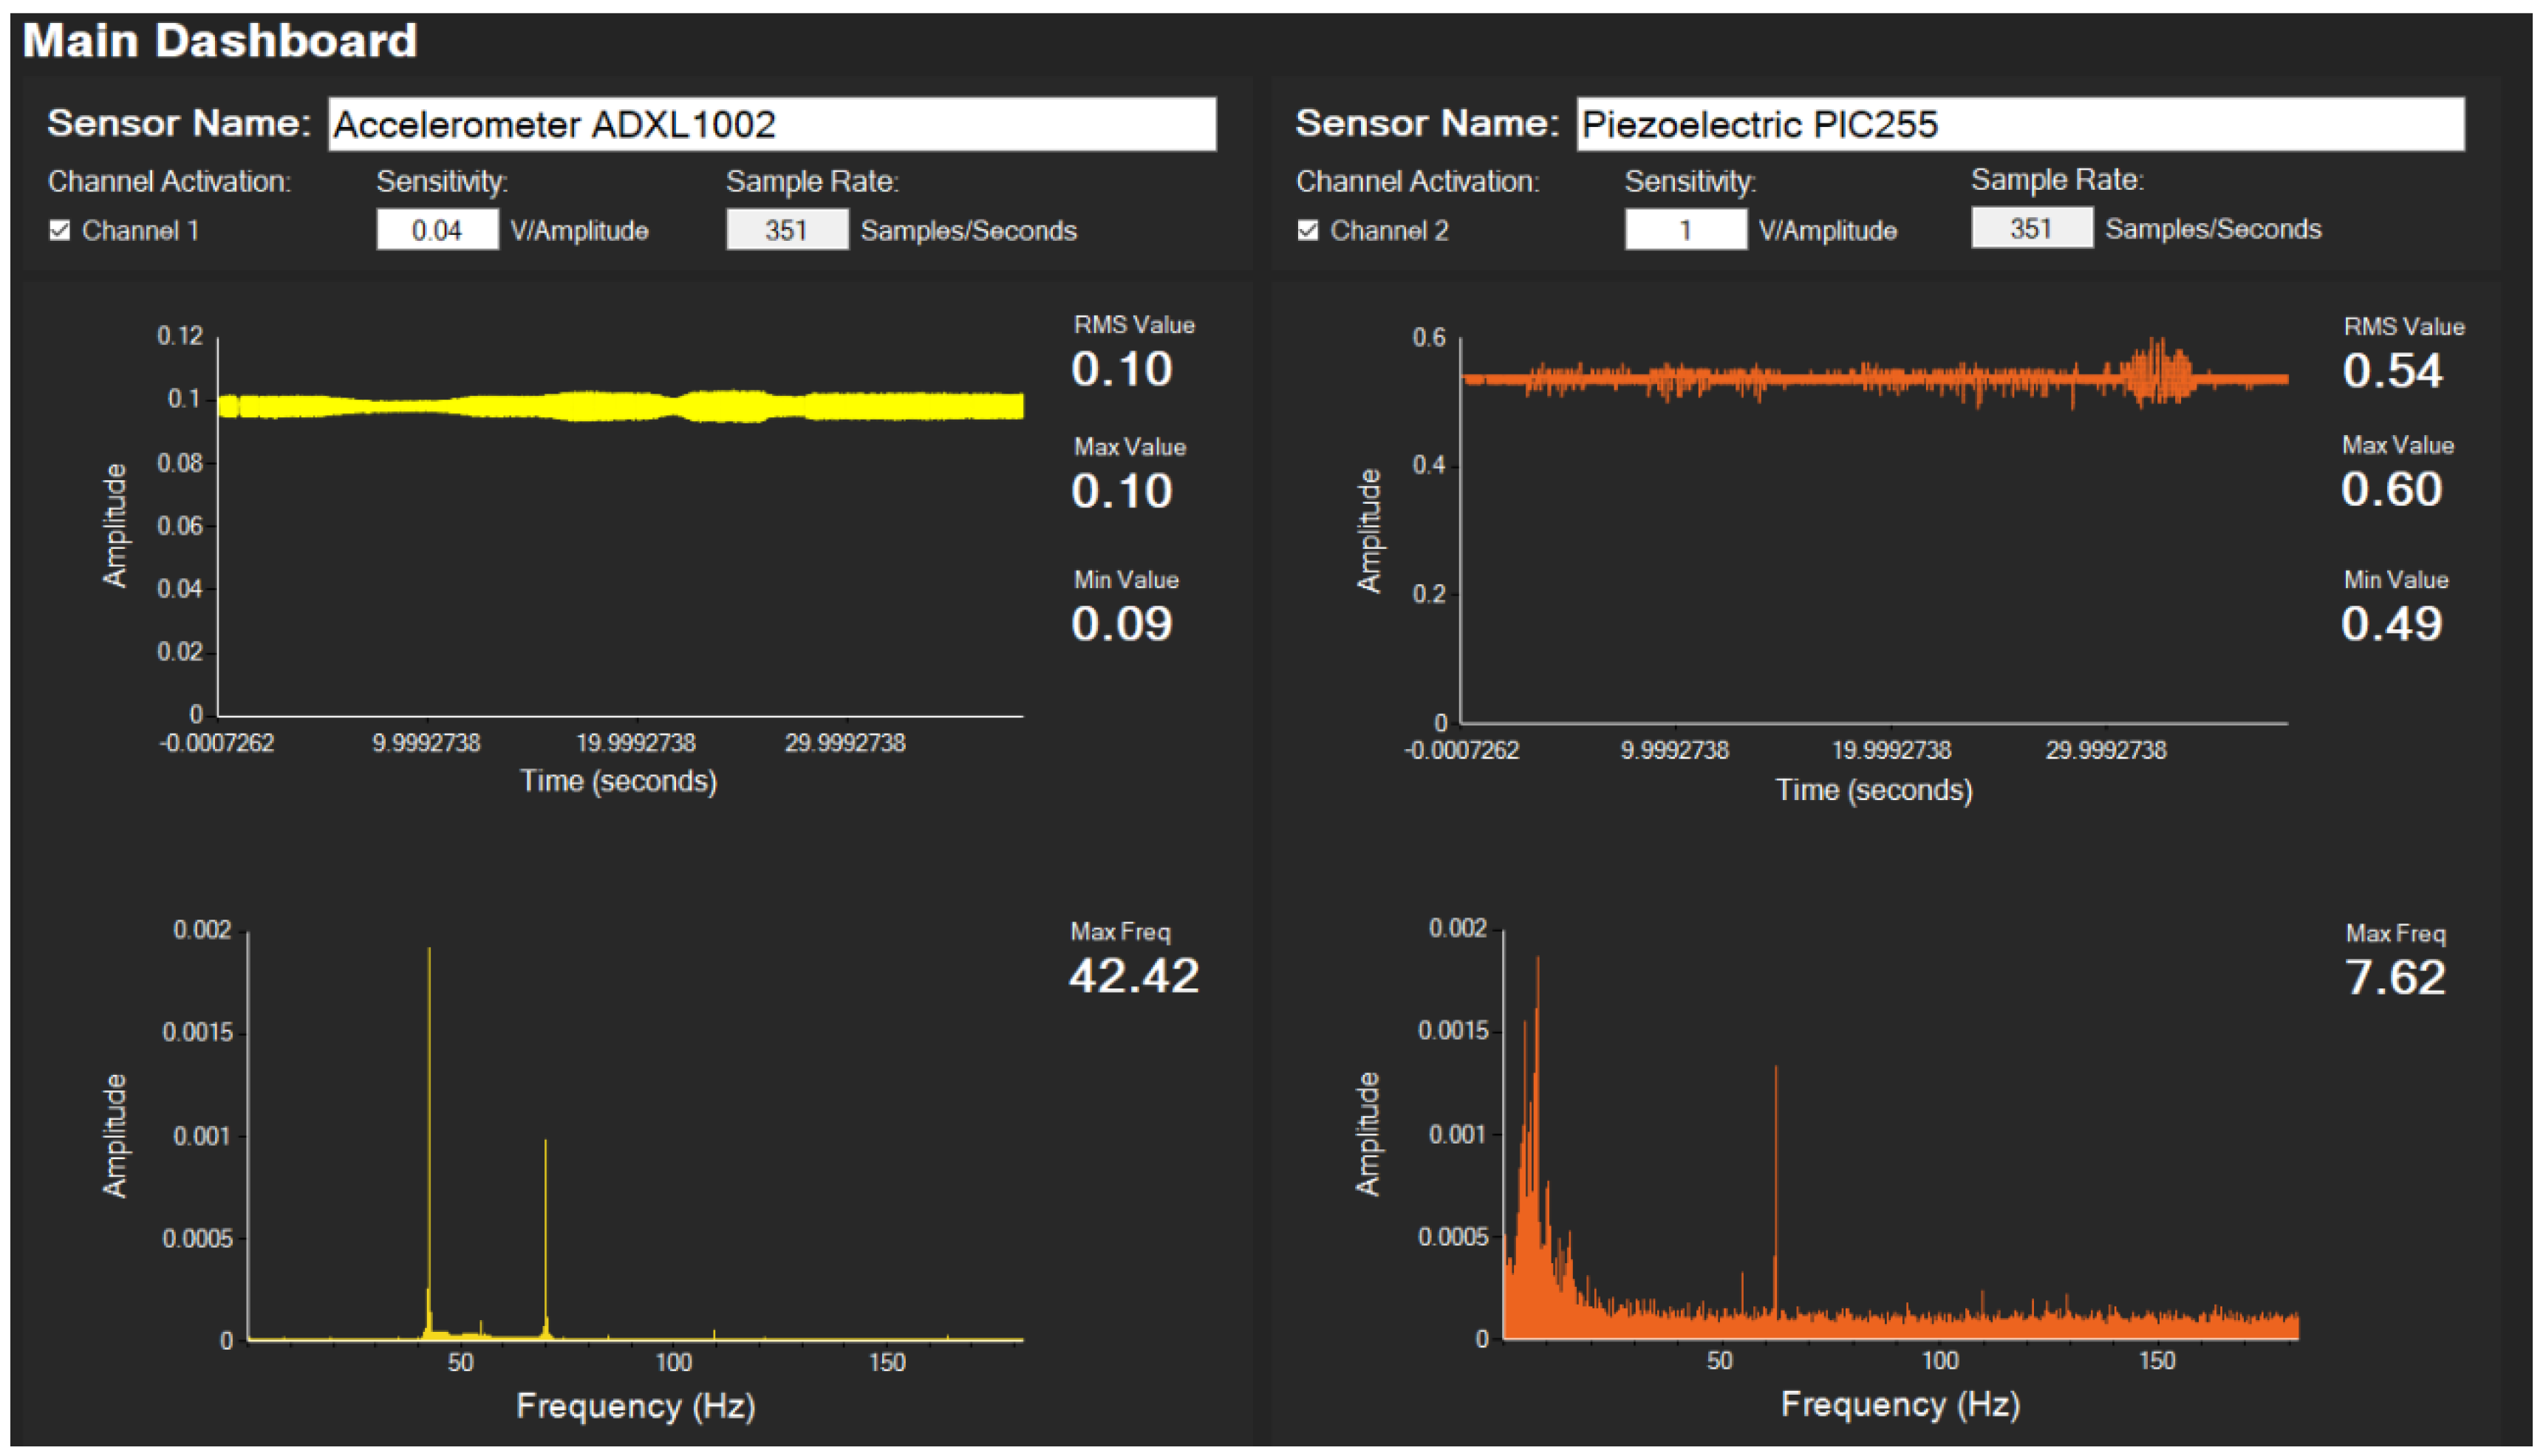
3.1. Main UI Design
3.2. Website Creation
4. Discussion of CPMA Application
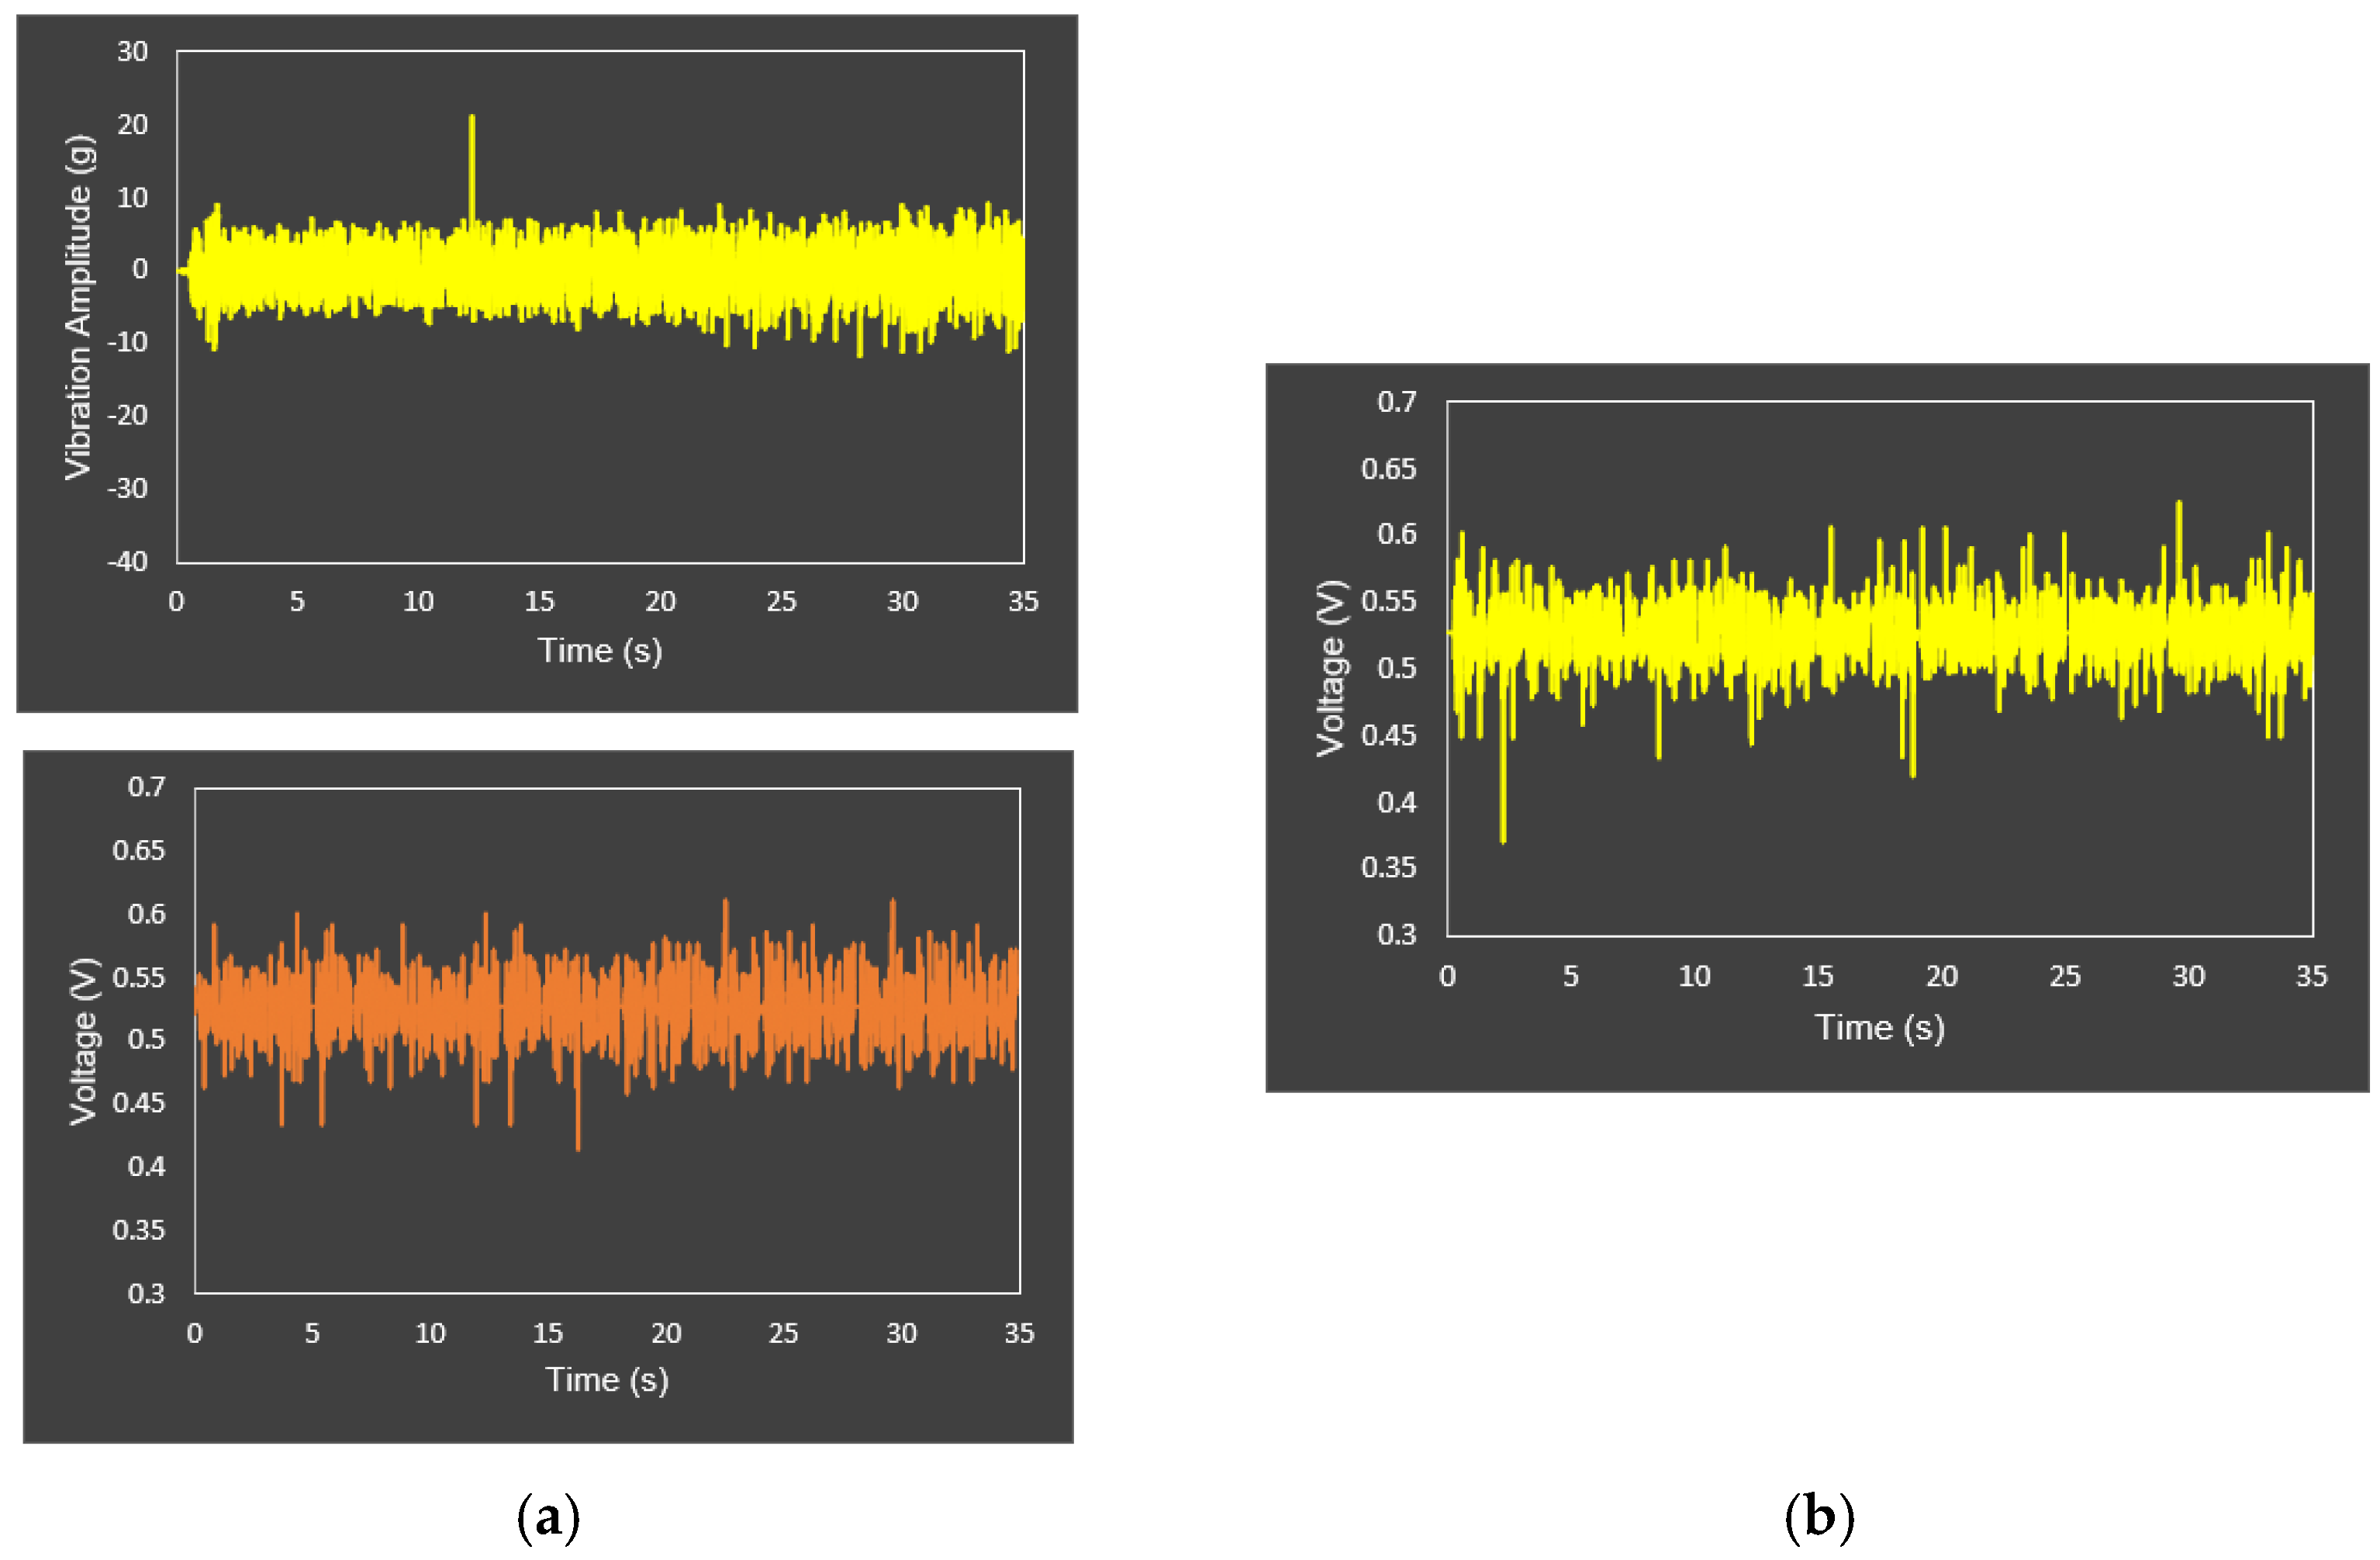
4.1. Data Collection Visualization in CPMA
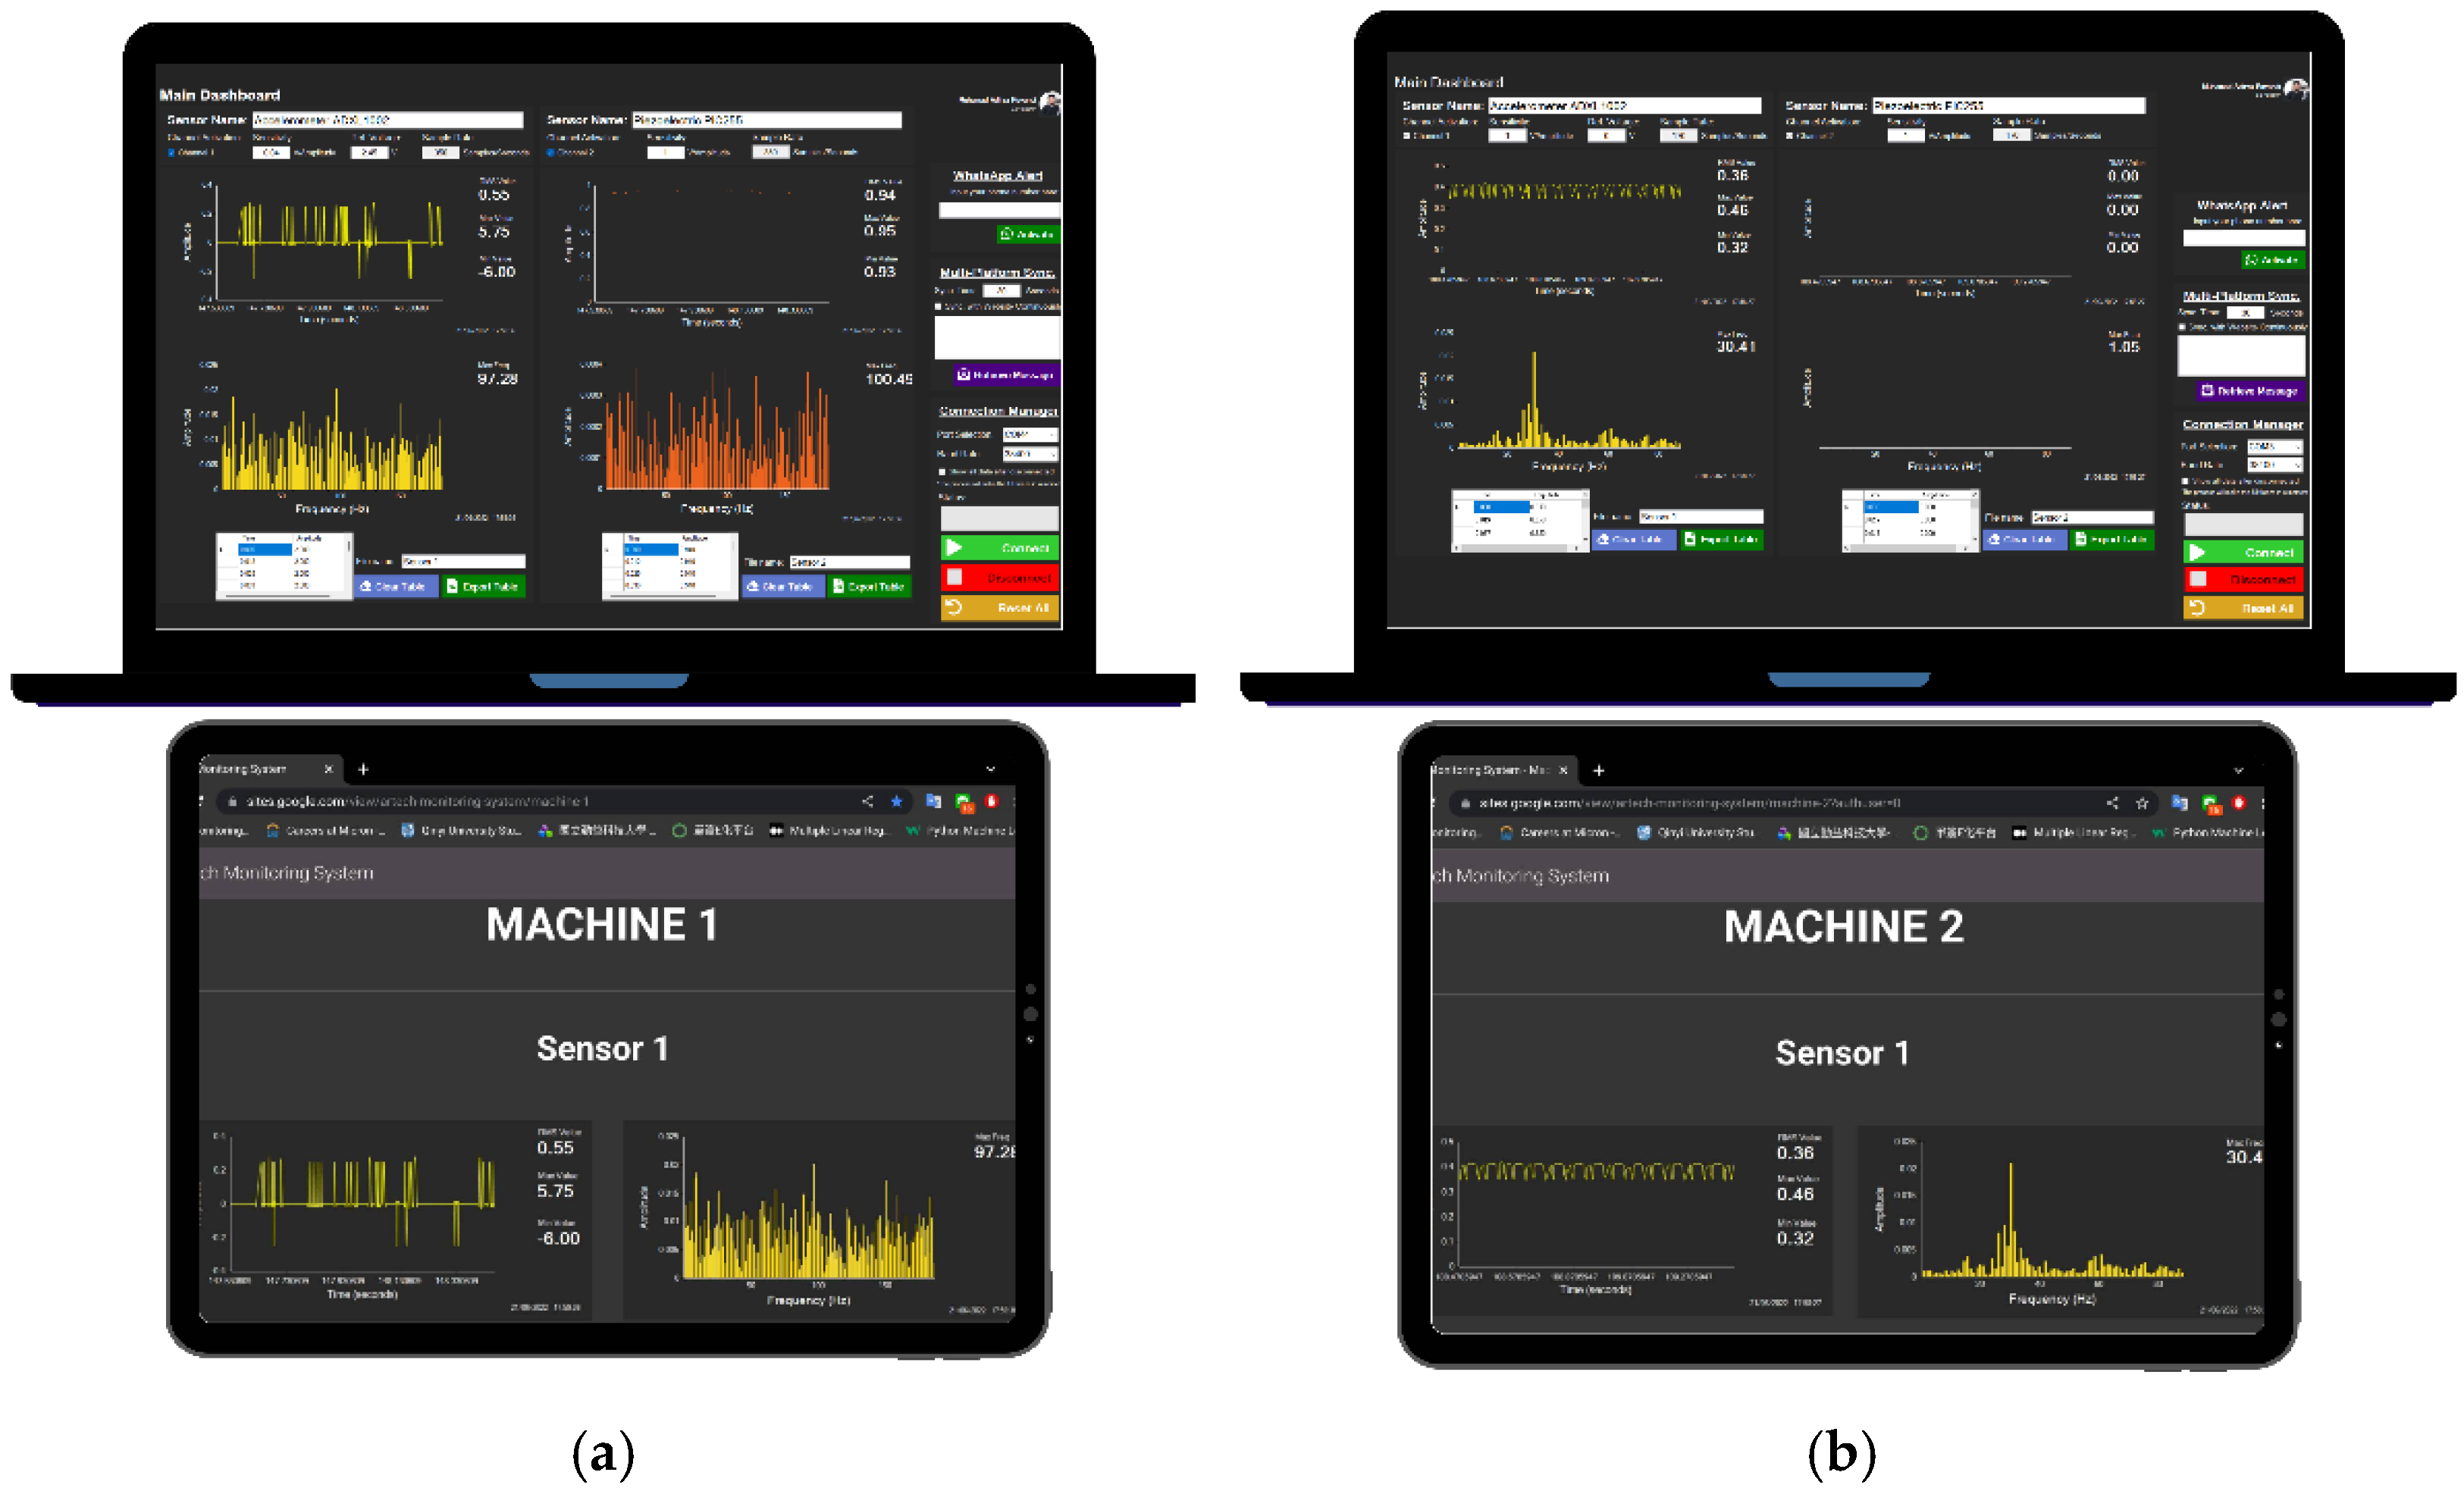
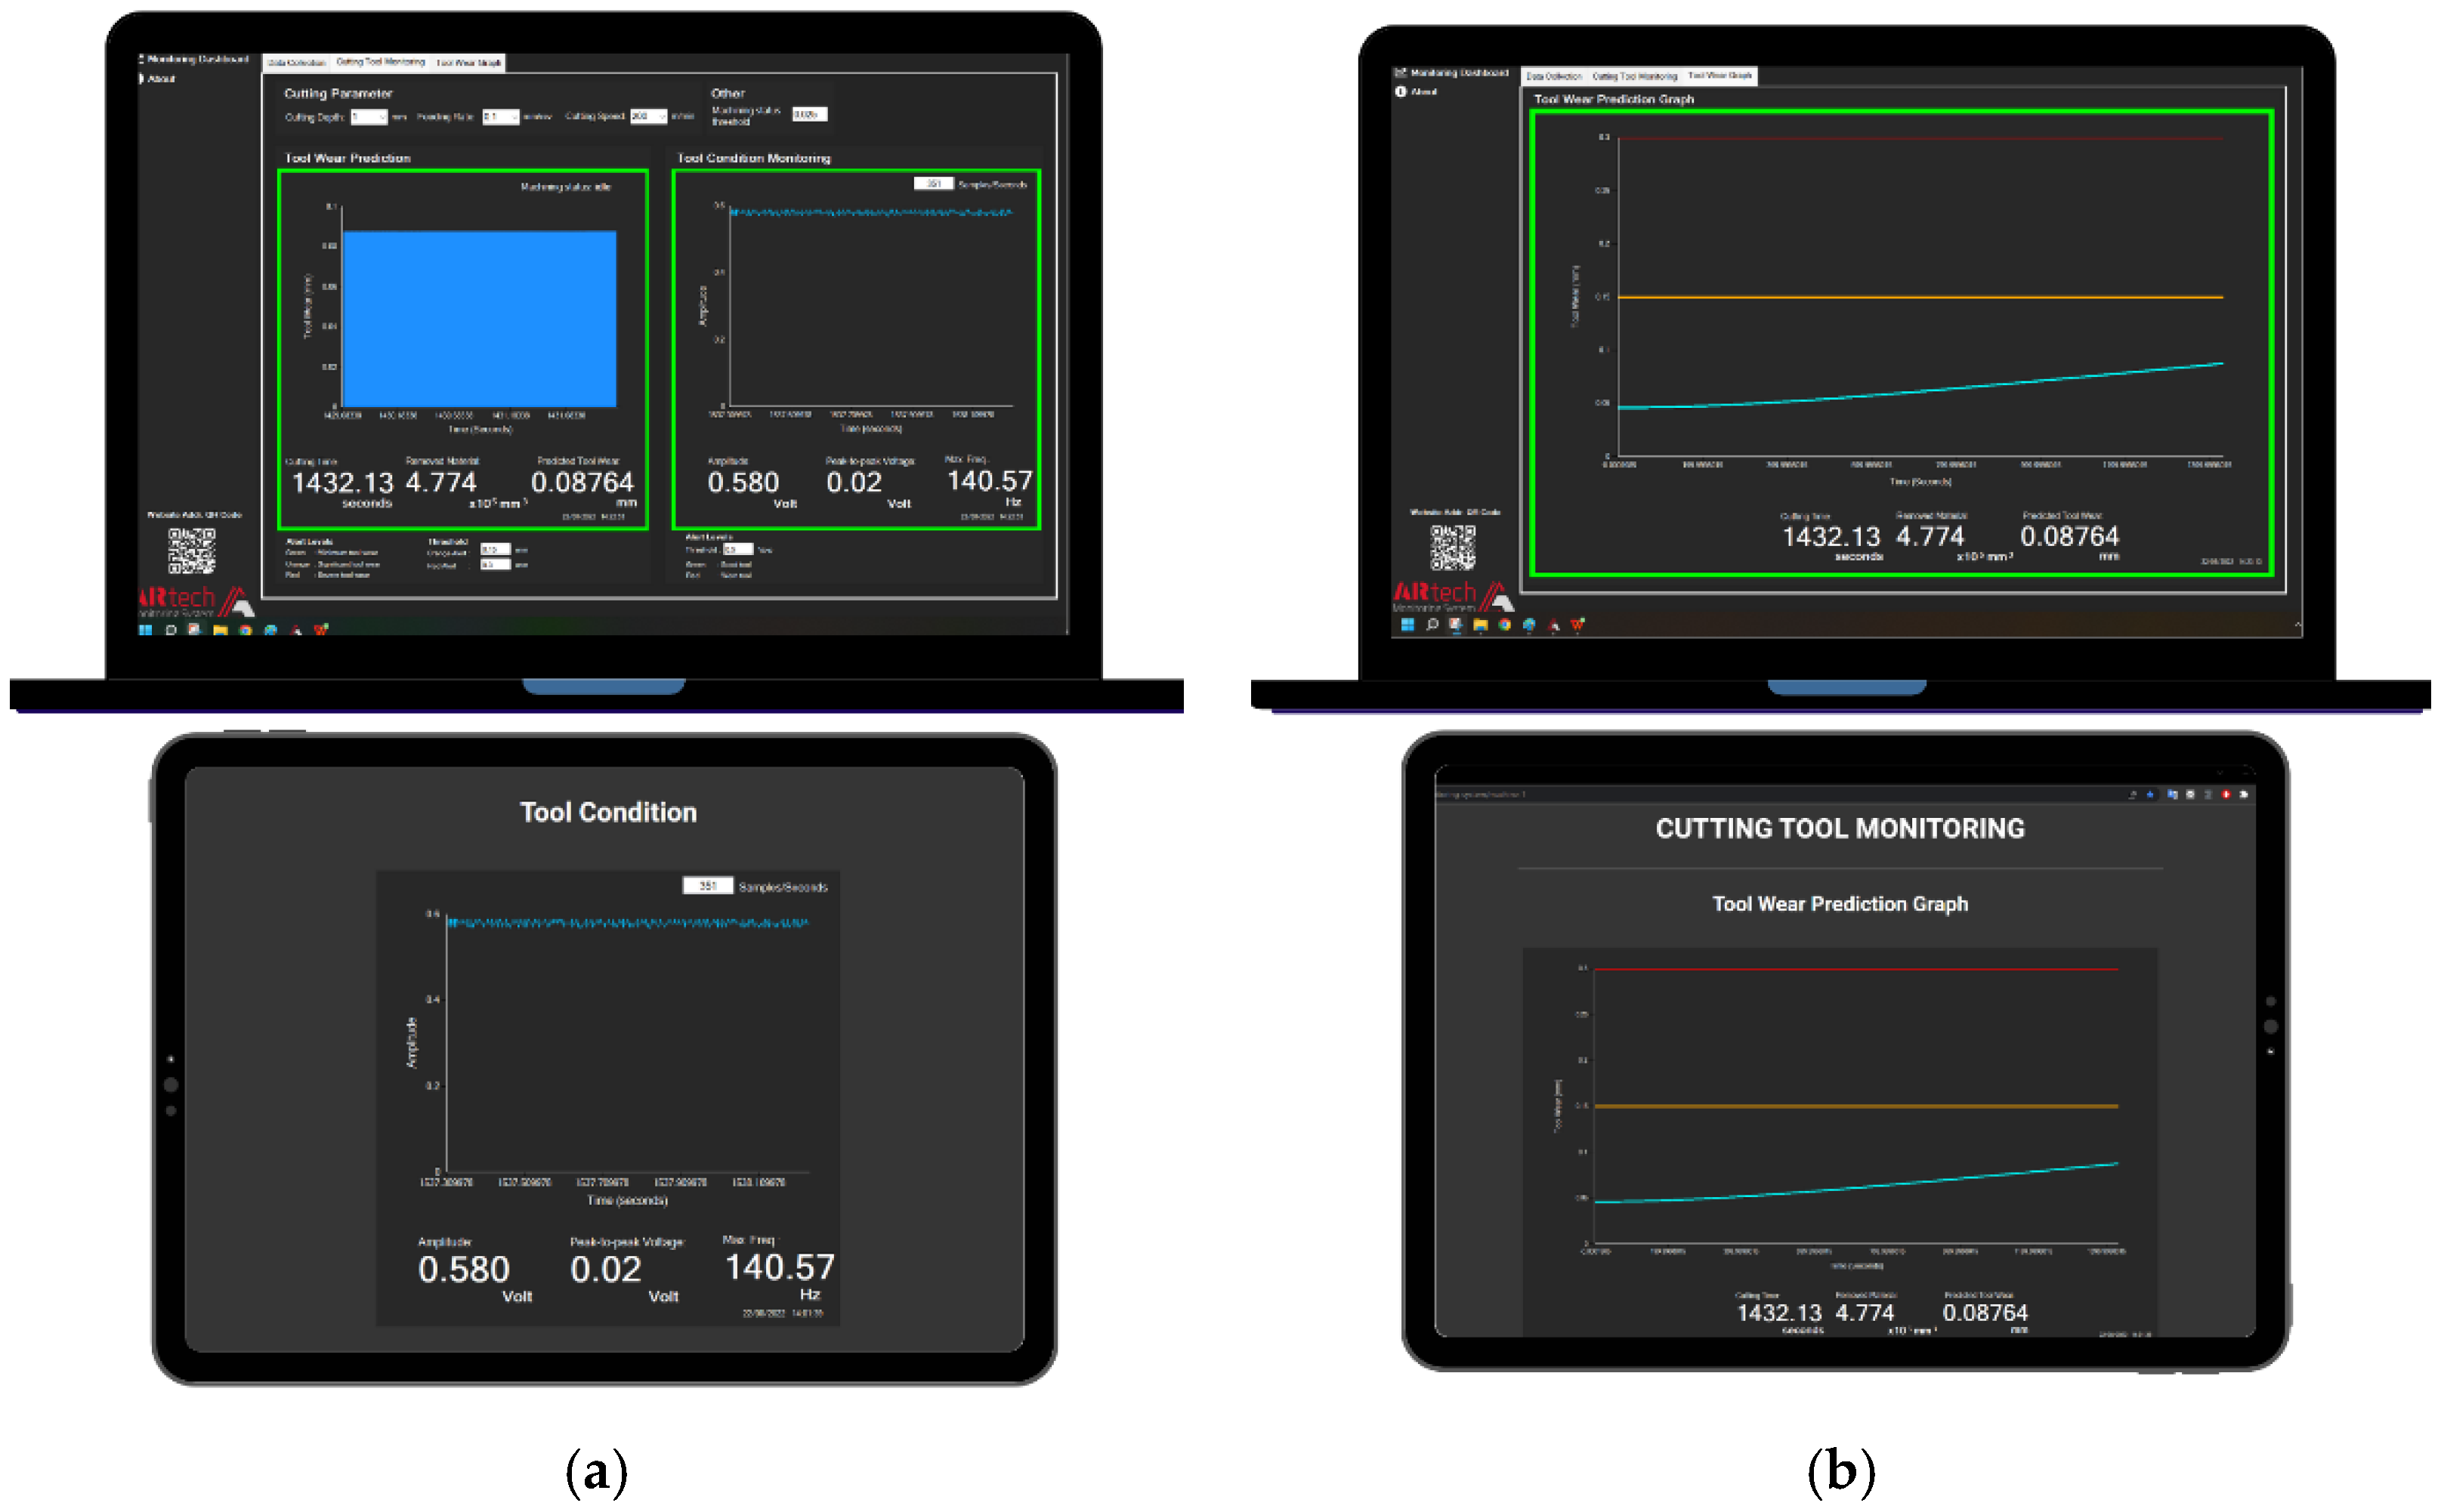
4.2. Multi-Machine Monitoring Result Visualization in CPMA
4.3. Data Prediction Result Visualization in CPMA
4.4. CPMA Comparison Analysis
5. Conclusions
Author Contributions
Funding
Institutional Review Board Statement
Informed Consent Statement
Conflicts of Interest
References
- Ruiz, G.H.; Mazzotti, C.G.; Kovács, G. Design of a Machine Tool Monitoring System. IFAC Proc. Vol. 1992, 25, 61–67. [Google Scholar] [CrossRef]
- Harris, C.M.; Piersol, A.G. (Eds.) Chapter 16. Condition Monitoring of Machinery. In Harris’ Shock and Vibration Handbook; McGraw-Hill Handbooks; McGraw-Hill: New York, NY, USA, 2002; ISBN 978-0-07-137081-3. [Google Scholar]
- Kovac, P.; Maňková, I.; Gostimirović, M.; Sekulić, M.; Savkovic, B. A Review of Machining Monitoring Systems. J. Prod. Eng. 2011, 14, 1–6. [Google Scholar]
- Mori, M.; Fujishima, M.; Komatsu, M.; Zhao, B.; Liu, Y. Development of Remote Monitoring and Maintenance System for Machine Tools. CIRP Ann. 2008, 57, 433–436. [Google Scholar] [CrossRef]
- Al-Saedi, I.R.; Mohammed, F.M.; Obayes, S.S. CNC Machine Based on Embedded Wireless and Internet of Things for Workshop Development. Int. J. Comput. Digit. Syst. 2017, 6, 205–212. [Google Scholar] [CrossRef]
- Tedeschi, S.; Rodrigues, D.; Emmanouilidis, C.; Erkoyuncu, J.; Roy, R.; Starr, A. A Cost Estimation Approach for IoT Modular Architectures Implementation in Legacy Systems. Procedia Manuf. 2018, 19, 103–110. [Google Scholar] [CrossRef]
- Lu, P.-W.; Sun, C.-C.; Hsu, C.-M.; Lin, H.-E. An Optical Based Non-Contact Five-Axis Machine Tool Calibration IOT System. In Proceedings of the 2018 IEEE International Conference on Consumer Electronics-Taiwan (ICCE-TW), Taichung, Taiwan, 19–21 May 2018; pp. 1–2. [Google Scholar]
- Murty, A.S.R.; Teja, K.; Naveen, S. Lathe Performance Monitoring Using Iot. Int. J. Mech. Eng. Technol. 2018, 9, 494–501. [Google Scholar]
- Mori, M.; Fujishima, M. Remote Monitoring and Maintenance System for CNC Machine Tools. Procedia CIRP 2013, 12, 7–12. [Google Scholar] [CrossRef]
- Tedeschi, S.; Mehnen, J.; Tapoglou, N.; Roy, R. Secure IoT Devices for the Maintenance of Machine Tools. Procedia CIRP 2017, 59, 150–155. [Google Scholar] [CrossRef]
- Kim, H.; Jung, W.-K.; Choi, I.-G.; Ahn, S.-H. A Low-Cost Vision-Based Monitoring of Computer Numerical Control (CNC) Machine Tools for Small and Medium-Sized Enterprises (SMEs). Sensors 2019, 19, 4506. [Google Scholar] [CrossRef]
- Zhong, R.Y.; Wang, L.; Xu, X. An IoT-Enabled Real-Time Machine Status Monitoring Approach for Cloud Manufacturing. Procedia CIRP 2017, 63, 709–714. [Google Scholar] [CrossRef]
- Namirimu, V. User Requirements for Internet Of Things (IoT) Applications: An Observational Study; Blekinge Institute of Technology: Karlskrona, Sweden, 2016. [Google Scholar]
- Li, J.; Cao, S. A Low-Cost Wireless Water Quality Auto-Monitoring System. Int. J. Online Biomed. Eng. IJOE 2015, 11, 37–41. [Google Scholar] [CrossRef]
- Luque, P.; Mántaras, D.A.; Rodríguez, A.; Malón, H.; Castejón, L.; Jalón, J.G.; López, J.L.; Martín, Á. Low-Cost Monitoring System of Sensors for Evaluating Dynamic Solicitations of Semitrailer Structure. J. Sens. 2016, 2016, 1740854. [Google Scholar] [CrossRef] [Green Version]
- Deshmukh, A.D.; Shinde, U.B. A Low Cost Environment Monitoring System Using Raspberry Pi and Arduino with Zigbee. In Proceedings of the 2016 International Conference on Inventive Computation Technologies (ICICT), Coimbatore, India, 26–27 August 2016; Volume 3, pp. 1–6. [Google Scholar]
- Arumuga Perumal, V.S.; Baskaran, K.; Rai, S.K. Implementation of Effective and Low-Cost Building Monitoring System(Bms) Using Raspberry Pi. Energy Procedia 2017, 143, 179–185. [Google Scholar] [CrossRef]
- Ahmed, V.; Ladhake, S.A. Novel Ultra Low Cost Remote Monitoring System for Home Automation Using Cell Phone. In Proceedings of the 2011 International Conference on Computational Intelligence and Communication Networks, Gwalior, India, 7–9 October 2011; pp. 569–573. [Google Scholar]
- Bastidas Pacheco, C.J.; Horsburgh, J.S.; Tracy, R.J. A Low-Cost, Open Source Monitoring System for Collecting High Temporal Resolution Water Use Data on Magnetically Driven Residential Water Meters. Sensors 2020, 20, 3655. [Google Scholar] [CrossRef] [PubMed]
- Komarizadehasl, S.; Mobaraki, B.; Ma, H.; Lozano-Galant, J.-A.; Turmo, J. Development of a Low-Cost System for the Accurate Measurement of Structural Vibrations. Sensors 2021, 21, 6191. [Google Scholar] [CrossRef]
- McFarlane, D.; Ratchev, S.; Thorne, A.; Parlikad, A.K.; de Silva, L.; Schönfuß, B.; Hawkridge, G.; Terrazas, G.; Tlegenov, Y. Digital Manufacturing on a Shoestring: Low Cost Digital Solutions for SMEs. In Service Oriented, Holonic and Multi-agent Manufacturing Systems for Industry of the Future; Borangiu, T., Trentesaux, D., Leitão, P., Giret Boggino, A., Botti, V., Eds.; Studies in Computational Intelligence; Springer International Publishing: Cham, Switzerland, 2020; Volume 853, pp. 40–51. ISBN 978-3-030-27476-4. [Google Scholar]
- Xing, K.; Liu, X.; Liu, Z.; Mayer, J.R.R.; Achiche, S. Low-Cost Precision Monitoring System of Machine Tools for SMEs. Procedia CIRP 2021, 96, 347–352. [Google Scholar] [CrossRef]
- Liu, C.; Xu, X.; Peng, Q.; Zhou, Z. MTConnect-Based Cyber-Physical Machine Tool: A Case Study. Procedia CIRP 2018, 72, 492–497. [Google Scholar] [CrossRef]
- Thanawattano, C.; Pongthornseri, R.; Dumnin, S. Wearable Wireless ECG Sensor with Cross-Platform Real-Time Monitoring. In Proceedings of the 2012 IEEE-EMBS Conference on Biomedical Engineering and Sciences, Langkawi, Malaysia, 17–19 December 2012; pp. 284–287. [Google Scholar]
- Gîştescu, A.-E.; Proca, T.; Miluţ, C.-M.; Iftene, A. MedPlus—A Cross-Platform Application That Allows Remote Patient Monitoring. Procedia Comput. Sci. 2021, 192, 3751–3760. [Google Scholar] [CrossRef]
- Lu, Z.; Guo, W.; Zhao, S.; Zhang, C.; Wang, Y.; Jia, Y. A Cross-Platform Web3D Monitoring System of the Three-Machine Equipment in a Fully Mechanized Coalface Based on the Skeleton Model and Sensor Data. J. Sens. 2020, 2020, e3147352. [Google Scholar] [CrossRef]
- Murman, E. Casetrack—A Cross-Platform App for Individualized Health Monitoring. Bachelor’s Thesis, Uppsala Universitet, Uppsala, Sweden, 2021. [Google Scholar]
- Cielecki, T. Environmental Sensor Monitoring Tablet Application Designed Using Cross-Platform Design Patterns and Frameworks. Master’s Thesis, Technical University of Denmark, Lyngby, Denmark, 2015. [Google Scholar]
- Reynell, E.R. The Design, Development and Evaluation of Cross-Platform Mobile Applications and Services Supporting Social Accountability Monitoring. Master’s Thesis, Rhodes University, Grahamstown, South Africa, 2016. [Google Scholar]
- What Is NET MAUI?—NET MAUI. Available online: https://docs.microsoft.com/en-us/dotnet/maui/what-is-maui (accessed on 4 February 2022).
- Rieger, C.; Majchrzak, T.A. Weighted Evaluation Framework for Cross-Platform App Development Approaches. In Proceedings of the SIGSAND, Gdansk, Poland, 29 September 2016. [Google Scholar]
- Al-Naggar, Y.M.; Jamil, N.; Hassan, M.F.; Yusoff, A.R. Condition Monitoring Based on IoT for Predictive Maintenance of CNC Machines. Procedia CIRP 2021, 102, 314–318. [Google Scholar] [CrossRef]
- Narayanan, A.; Kanyuck, A.; Gupta, S.; Rachuri, S. Machine Condition Detection for Milling Operations Using Low Cost Ambient Sensors. In Proceedings of the 2016 Manufacturing Science and Engineering Conference, Blacksburg, VA, USA, 27 June 2016; ASME: New York, NY, USA, 2016. [Google Scholar]
- Jian, B.-L.; Hsieh, C.-T.; Guo, Y.-S. Intelligent Integrated Monitoring System for Lathe Equipment. J. Low Freq. Noise Vib. Act. Control 2021, 40, 978–992. [Google Scholar] [CrossRef]
- Zhang, X.Y.; Lu, X.; Wang, S.; Wang, W.; Li, W.D. A Multi-Sensor Based Online Tool Condition Monitoring System for Milling Process. Procedia CIRP 2018, 72, 1136–1141. [Google Scholar] [CrossRef]
- Bansal, P.; Vedaraj, I.S.R. Monitoring and Analysis of Vibration Signal in Machine Tool Structures. Int. J. Eng. Dev. Res. 2014, 2, 2310–2317. [Google Scholar]
- Goyal, D.; Pabla, B. Development of Non-Contact Structural Health Monitoring System for Machine Tools. J. Appl. Res. Technol. 2016, 14, 245–258. [Google Scholar] [CrossRef]
- González, D.M.O.; Ferreira, J.C.E. MEMS Accelerometer-Based System for Inexpensive Online CNC Milling Process Chatter Detection. In Proceedings of the 2016 IEEE International Conference on Automation Science and Engineering (CASE), Fort Worth, TX, USA, 21–25 August 2016; pp. 978–983. [Google Scholar]
- Barański, R.; Galewski, M.; Nitkiewicz, S. The Study of Arduino Uno Feasibility for DAQ Purposes. Diagnostyka 2019, 20, 33–48. [Google Scholar] [CrossRef]
- Dynamic Image by URL—New Google Sites. Available online: https://www.steegle.com/google-sites/how-to/insert-custom-code/dynamic-image-by-url (accessed on 1 January 2022).
- Google Sites: Create & Host Business Websites|Google Workspace. Available online: https://workspace.google.com/products/sites/ (accessed on 5 September 2022).
- Shih, W.-C.; Furqanuddin, F.; Lee, P.-L.; Hung, J.-P. Monitoring of Preload Variation of Linear Guide Positioning Stage Using Artificial Neural Network. Appl. Sci. 2021, 11, 7902. [Google Scholar] [CrossRef]
- Lin, Y.-C.; Wu, K.-D.; Shih, W.-C.; Hsu, P.-K.; Hung, J.-P. Prediction of Surface Roughness Based on Cutting Parameters and Machining Vibration in End Milling Using Regression Method and Artificial Neural Network. Appl. Sci. 2020, 10, 3941. [Google Scholar] [CrossRef]
- Royandi, M.A.; Hung, J.-P. Design of an Affordable IoT-Based Monitoring System for Versatile Application in Machine Tool. In Proceedings of the 2021 17th International Conference on Quality in Research (QIR): International Symposium on Electrical and Computer Engineering, Virtual, 13–15 October 2021; pp. 76–80. [Google Scholar]
- Data Sources. Available online: https://grafana.com/docs/grafana/latest/datasources/ (accessed on 5 September 2022).
- Corral, R. Analysis of Cloud Service Monitoring with Grafana. Available online: http://keepler.io/2019/11/analysis-of-cloud-service-monitoring-with-grafana/ (accessed on 5 September 2022).
- Nurgaliev, I.; Karavakis, E.; Aimar, A. Kibana, Grafana and Zeppelin on Monitoring Data; Springer: Berlin/Heidelberg, Germany, 2016. [Google Scholar]
- Consider Grafana vs. Prometheus for Your Time-Series Tools. Available online: https://www.techtarget.com/searchitoperations/tip/Consider-Grafana-vs-Prometheus-for-your-time-series-tools (accessed on 5 September 2022).
- Compare Grafana vs. ITRS Geneos. Available online: https://www.peerspot.com/product_comparisons/29442-31862 (accessed on 10 September 2022).
- Grafana Reviews. Competitors and Pricing. Available online: https://www.peerspot.com/products/grafana-reviews (accessed on 5 September 2022).


| Compared Aspects | Technology | |
|---|---|---|
| CPMA | Existing Application | |
| Data source | Image-upload-based data captured from main UI (uploaded to Google Drive) | A set of data collected from the main data acquisition system and stored on supported data sources (MySQL, InfluxDB, MSSQL, etc.) [45] |
| Visualization flexibility | Visualization depends on the main UI development | Visualization is arranged directly in the application |
| Data visualization type | Time-series and frequency domain, which can be achieved in the development of the main UI | Time-series-based [46,47,48] |
| Dashboard design | Design depends on the main UI development and is limited by the availability of website creation tool | Panels are limited to those made available by the app and its community [48] |
| Reliability/scalability | Arrangement can be achieved easily and rapidly with a website creation tool. The settings are simple (only need to set the image URL). Stable and reliable (the latency depends on Internet connectivity). | Arrangement can set according to the specific skill required to operate the app (settings are powerful and exceedingly complex); it would be helpful if the data source can be simplified while remaining stable and reliable [49] |
| Learning curve (tutorial needed) |
|
|
| Development time | Allocated time includes development of the main UI and its data acquisition system in the same software | Allocated time includes the development of the main data acquisition system, which can be stored on supported data sources (MySQL, InfluxDB, MSSQL, etc.). |
| Cost (excluding data acquisition device) | Free | Free (upgraded feature is available with an additional subscription) |
Publisher’s Note: MDPI stays neutral with regard to jurisdictional claims in published maps and institutional affiliations. |
© 2022 by the authors. Licensee MDPI, Basel, Switzerland. This article is an open access article distributed under the terms and conditions of the Creative Commons Attribution (CC BY) license (https://creativecommons.org/licenses/by/4.0/).
Share and Cite
Royandi, M.A.; Hung, J.-P. Design of an Affordable Cross-Platform Monitoring Application Based on a Website Creation Tool and Its Implementation on a CNC Lathe Machine. Appl. Sci. 2022, 12, 9259. https://0-doi-org.brum.beds.ac.uk/10.3390/app12189259
Royandi MA, Hung J-P. Design of an Affordable Cross-Platform Monitoring Application Based on a Website Creation Tool and Its Implementation on a CNC Lathe Machine. Applied Sciences. 2022; 12(18):9259. https://0-doi-org.brum.beds.ac.uk/10.3390/app12189259
Chicago/Turabian StyleRoyandi, Muhamad Aditya, and Jui-Pin Hung. 2022. "Design of an Affordable Cross-Platform Monitoring Application Based on a Website Creation Tool and Its Implementation on a CNC Lathe Machine" Applied Sciences 12, no. 18: 9259. https://0-doi-org.brum.beds.ac.uk/10.3390/app12189259