
Network Slicing Resource Allocation Based on LSTM-D3QN with Dual Connectivity in Heterogeneous Cellular Networks

1
College of Electronic and Information Engineering, Shandong University of Science and Technology, Qingdao 266590, China
2
Shanghai Institute of Microsystem and Information Technology, Chinese Academy of Sciences, Shanghai 200050, China
*
Authors to whom correspondence should be addressed.
Appl. Sci. 2022, 12(18), 9315; https://0-doi-org.brum.beds.ac.uk/10.3390/app12189315
Submission received: 13 August 2022
/
Revised: 12 September 2022
/
Accepted: 14 September 2022
/
Published: 16 September 2022
(This article belongs to the Special Issue Advances in Architecture, Protocols and Challenges in Internet of Things)
Abstract
:With the explosive growth of network traffic and the diversification of service demands, network slicing (NS) and dual connectivity (DC) are considered as promising technologies in wireless networks. In this paper, we propose a novel algorithm that solves the resource allocation problem of NS in heterogeneous networks with the assistance of DC, while satisfying the characteristic requirements of eMBB and URLLC services. Firstly, we model the scenario and formulate the optimization problem, which is proved as an NP-Hard problem. Secondly, due to the nonconvex and combinatorial nature, the dueling double deep Q-network with long short-term memory (LSTM-D3QN) is proposed to solve this problem, aiming to improve the overall network utility, while ensuring the quality of experience (QoE). Then, we analyze the complexity of the algorithm. Finally, the simulation results show that the proposed algorithm can maximize the total utility of the system, while guaranteeing the user QoE. Compared with LSTM-A2C and DQN, the proposed algorithm improves the long-term network utility by 2.6% and 7.2%, respectively. In addition, compared with the algorithm without DC under the conditions of no priority, eMBB priority and URLLC priority, the proposed algorithm improves the network utility by 4.2%, 2.1% and 4.1%, respectively.
1. Introduction
Rapidly growing user equipment (UE) and traffic demands place greater requirements on spectrum resources, and the number of connected devices is expected to reach 27 billion by 2024 [1]. An effective solution is to deploy small base stations (SBSs) with smaller coverage and transmit power to increase network capacity, while preventing macro base stations (MBSs) from being overloaded [2]. On the other hand, with the development of internet of things (IoT), the rise of more heterogeneous services makes the resource allocation and scheduling of next-generation 5G/6G networks face greater challenges, such as remote operation, VR video, internet of vehicles (IoV), intelligent factories, smart energy and IoT with thousands of connected devices [3,4]. Existing single network architectures are often unable to meet this level of heterogeneity. Network slicing (NS) is one of the key technologies in 5G architecture, which can divide a physical network into multiple logical networks (i.e., slices) with different network characteristics, through software-defined networking (SDN) and network function virtualization (NFV) technologies. The 5G network architecture is designed to support the following three basic service categories: massive machine type communication (mMTC), enhanced mobile broadband (eMBB), ultra-reliable and low latency communication (URLLC); each service has a different set of network metrics requirements. In short, network slicing plays an important role in meeting the QoE requirements of different applications in wireless networks [5,6,7]. At the same time, in order to solve the problems of scarcity of network resources and low utilization of resources, dual connectivity (DC) technology was proposed in Release 12 of the 3GPP. Specifically, through carrier aggregation technology, UE can connect two different network interfaces to obtain more network resources. It not only improves the utilization of network resources, but also improves the network system throughput [8,9]. Combining these two technologies can improve the utility of the network system, where the utility usually includes QoE, system throughput, spectral efficiency (SE), energy efficiency (EE), etc. In most of the literature, network utility is usually used as the total optimization objective. In this paper, network utility is the weighted sum of network throughput and QoE, minus the weighting of additional energy consumption caused by dual-connected users. Among these optimization metrics, QoE is always constrained by the delay and rate when users receive data packets. However, in 5G/6G systems, it is not only QoE that is greatly enhanced. Due to the role of the DC, the association handover mechanism, mobility management and power allocation strategy will be greatly changed.
There have been many studies published on the application of NS and DC in recent years. However, most studies only consider network slicing or DC, and do not consider combining network slicing and DC to provide users with better services. In terms of algorithms for solving the resource allocation problems, deep reinforcement learning (DRL) has great advantages in solving large-scale complex problems [10]. Taking the above factors into consideration, in this paper, the optimization problem of DC-assisted slice resource allocation in the downlink of heterogeneous networks is studied, and an optimization algorithm based on DRL is proposed to obtain a satisfactory resource allocation strategy. In summary, the main contributions of this paper are as follows:
- Firstly, a heterogeneous network scenario, containing two typical network slices, is considered. In this scenario, DC is used to solve the problem of low QoE for users due to less network resources in SBSs. Then, an optimization problem with the total system utility weighted by system throughput, QoEs and additional system energy is proposed and we prove that the problem is an NP-Hard problem.
- Secondly, considering the nonconvexity and combinatorial nature of the optimization problem, we propose a D3QN-based slicing resource allocation algorithm and design state, action and reward for the algorithm. In order to enhance the algorithm’s performance in dynamic scenarios, LSTM-D3QN is proposed by replacing the fully connected layer of input states in the D3QN with LSTM network.
- Thirdly, we compare the proposed algorithm with other DRL algorithms and verify the effectiveness and convergence of our proposed algorithm. An extensive comparison of the utility of the system and the QoE of the users with and without the assistance of the DC technique verifies that the users and the network system, with the assistance of DC, have higher QoE and throughput in most cases. Then, we compare the impact of different numbers of users in the environment on different optimization objectives to obtain the number of users that our network system can accommodate, without reducing the QoE of users. Finally, we simulate and analyze the effect of different parameters on the performance of the algorithm.
The remainder of the paper is organized as follows. Section 2 discusses the related literature. The system scenario is modeled and the optimization problem is formulated in Section 3. The foundation of D3QN and the proposed algorithm of the network slicing resource allocation based on LSTM-D3QN are presented in Section 4. The simulation parameters and results are discussed in Section 5. Contributions are discussed in Section 6. This work is concluded in Section 7.
2. Related Work
2.1. Network Slicing
For the research of network slicing, DRL has played an important role in solving slicing resource allocation. The authors in [11] used the DRL-based algorithm, supported by the generative adversarial network (GAN), to solve the problem of resource allocation in three service scenarios, and made the training of the algorithm more stable through a reward clipping mechanism. Li et al. [12] established a network slicing scenario of user mobility and proposed an advantage actor-critic (A2C) learning algorithm based on LSTM to solve the environment perception problem caused by user mobility. A dynamic running slice framework was designed in [13] to address the different QoE requirements of IoV, and a two-layer constrained reinforcement learning (RL) algorithm was proposed to solve the complex coupling constraints of the problem. Due to the mobility in the vehicle network and the complexity of the network, Cui et al. [14] proposed a deep deterministic policy gradient algorithm based on long short-term memory (LSTM-DDPG) to ensure the stable performance of slices. To jointly manage network slicing and routing, reference [15] proposed a multi-task DRL-based graph convolutional network (GCN). In the field of network resource allocation, game theory is also a very effective method [16,17]. In [18], the problem of resource allocation and pricing for network slicing was studied, and interactions between access or backhaul service providers and their UE were captured by a multi-leader multi-follower Stackelberg game approach. For the problem of multi-tenancy in network slicing, reference [19] used game theory to solve the problem of resource allocation of network slices under the shared constraint proportional allocation mechanism, and analyzed the efficiency and fairness of the allocation. Reference [20] described the strategic decision-making process made by tenants as a game, and proposed a heuristic algorithm so that the game could reach a unique Nash equilibrium (NE). To avoid the negative impact of network congestion on slicing, a distributed slicing strategy based on alliance games and matching theory is proposed in [21], which improves QoS and throughput and reduces energy consumption and latency.
2.2. Dual Connectivity
For the study of DC applications, although there is no study that combines the DC and network slicing technology, some literatures have used DC technology to meet different service requirements [22,23,24,25]. In [22], a user-centric resource scheduling management mechanism with different quality of service (QoS) requirements for DC heterogeneous networks was investigated, and a general framework was proposed to maximize system energy efficiency. In order to meet the ultra-reliable and low-latency requirements of URLLC services, the author in [23] introduces DC and proposes a new admission mechanism to control the number of active users in dual-connection mode. In order to provide users with seamless video streaming services, a video quality-aware traffic offloading system is proposed in [24], and the authors use fountain codes to achieve DC enhancement. He et al. [25] proposed a raptor code-based dual connectivity (RCDC) scheme to solve the out-of-order packet arrival problem and reduce delivery delay. DC also plays an important role in mobility management and network handover [26,27,28]. In order to solve the problem of the seamless connection of aircrafts, the authors introduced the DC technique in [26] and used a two-dimensional genetic algorithm to obtain the optimal switching scheme. Qi et al. [27] have investigated a DC-assisted active mobility management scheme to provide mobile users with real-time services more effectively, with minimum data rate requirements. Since DC has a lower amount of handover interruption, the authors propose a DC-assisted mobility management algorithm in [28] to efficiently perform handover between 4G and 5G radio access technology (RAT). In other aspects, the authors in [29] considered a two-tier over-the-air heterogeneous network with decoupled access and investigated the DC characteristics of users at the edge of the network. Li et al. [30] introduced a dual-connectivity-assisted offloading scheme for edge computing, and used a deep learning-based intelligent offloading scheme to fully utilize the computing power at the edge. In wireless network systems using dual connectivity, interference tends to be more complex. To solve the channel interference problem within the system, a nonlinear self-interference canceller using neural networks was designed and a low-complexity training scheme was proposed in [31].
3. System Model and Problem Formulation
3.1. System Model
We consider a two layer downlink heterogeneous network scenario, which includes an MBS and SBSs. The SBSs have low transmit power and cover a small area. The index set of the base station (BS) is , wherein the index of denotes MBS. We assume that MBS and SBS work in different frequency bands, so the cross-layer interference between them can be avoided. Since each SBS has a small coverage area and low transmit power, they can use spectrum resources with acceptable interference levels. Therefore, the downlink signal-to-noise ratio models of the SBS and the MBS are different in the following scenario. Each BS has a bandwidth resource of and each SBS has an equal amount of bandwidth resources. The BS is distributed with slices of types of services, the index of the slice is and the bandwidth resources of the BS are shared by the slices. The users are randomly distributed in the coverage of the MBS. The set is . The number of users in each service is . Users distributed in the coverage of the SBS can obtain a data stream from the SBS and can also obtain a data stream from the MBS at the same time. As shown in Figure 1, we used Visio to draw our proposed research scenario. Table 1 summarizes the main notations of this study.
In this heterogeneous network system, in order to prevent MBS from overloading, we propose an association mechanism based on the dual connectivity. Users within the coverage area of the SBS will first connect to the SBS which they belong, and use the SBS as the primary BS. During the resource allocation process, the second connection will be used when the resources of the SBS are insufficient in a time slot. Therefore, the user who opens the second link will receive resources from the SBS and the MBS in the next time slot. In addition, users who are only within the coverage of the MBS can only be connected to the MBS.
When the user is connected to the MBS, the signal-to-noise ratio (SNR) of the user connected to the MBS is
and when a user is connected to SBS, the downlink signal-to-interference-noise ratio (SINR) can be denoted as
where and are the transmit power of the MBS and the SBS, respectively. and are the channel gains from the MBS and the SBS to the user , respectively. is the average background noise power. The interference between SBSs is included in the Equation (2).
According to Shannon theory, the downlink transmission rate connected to the MBS and the SBS can be respectively defined as
thus, we have the total transmission rate of the th user, that is,
where the binary variable is the indicator that user is connected to BS . If user is connected to BS , is equal to 1, otherwise it is 0. is the bandwidth resource obtained by user of service from the BS .
We use the transmission success rate of data packets [11] to represent the QoE of users served by the slice and it can be given by
where is defined as the total number of data packets transmitted by the BS to user . The binary variable denotes whether the packets are successfully transmitted. For each service, the only when the rate limit and the delay limit are met at the same time, otherwise it is equal to 0. The rate limit and delay limit here are set according to the service level agreement (SLA) of the 5G network slicing technology.
Since the more users use dual connectivity, the heavier the burden on the system, we set the cost consumed by dual-connected users, where is an indicator for dual-connected users and is the fixed cost consumed per user using DC. We define as the additional consumption of dual-connected users in the system and it can be expressed by
3.2. Problem Formulation
Since the throughput of the network system and the QoE of the user are very representative optimization indicators in the communication network scenario, they are used as forward optimization indicators in the optimization problem. Because we want to obtain the impact of the number of dual-connection users on throughput and QoE, the additional energy consumption of the system, represented by the number of dual-connection users, is taken into account. In order to meet the QoE of SBS users with insufficient bandwidth and to improve the total throughput of the system, and at the same time reduce the extra system energy consumption caused by dual connections as much as possible, we define a network slicing resource allocation problem based on DC. The optimization objective of the problem is to maximize the total utility of the system. The utility is defined as
where , and are the importance coefficients for adjusting system throughput, QoE and extra energy consumption, respectively. A maximum of two BSs connected to each user is indicated in constraint C2. The constraint C4 denotes that the sum of bandwidth owned by each slice in the BS does not exceed . The constraint C5 represents that the user can successfully receive packets when both the rate and delay are satisfied. denotes the rate limit of service and is the delay limit of service .
3.3. Proof of the NP-Hard Problem
In our heterogeneous network resource allocation scenario, due to the existence of DC, each BS in our environment is not an independent individual. The bandwidth allocation strategy selected by one BS is usually closely related to the strategy selected by other BSs. To prove that our optimization problem is an NP-Hard problem, we map the optimization problem to the traveling salesman problem (TSP) for illustration. Assuming that there are cities in a TSP problem, and the cost from city to city is , the goal of this problem is how to find a route that minimizes the total cost when passing through all cities. The TSP problem can be modeled as
where the binary variable represents whether the traveler departs from to . Constraint C2 means that each city is passed only once. If one considers the simplified form of the optimization problem in this paper, that is, one only considers throughput as an optimization objective in the scenario, then the optimization objective of this simplified problem can be expressed as
We map the TSP to our optimization objective, the traveling salesman in the TSP corresponds to the BS in our environment, and the city available for the traveling salesman to choose corresponds to the bandwidth allocation action of the BS. The total cost corresponds to the system throughput . In TSP, if we want to know whether a trip with the lowest total cost exists, we have to check all possible travel arrangements in the worst case. Likewise, in our model, given an arbitrary bandwidth allocation strategy, the throughput can be calculated. However, to find the optimal decision among many actions, this theoretically requires testing all actions. Since the objective function can obviously be completed in polynomial time, and TSP is an NP-Hard problem, the optimization objective is also an NP-Hard problem. Furthermore, because of , it can be concluded that the objective function is also an NP-Hard problem. Traditional methods to solve such problems are very challenging. To overcome this challenge, in this paper, we provide a DRL-based framework to solve this optimization problem, which will be described in detail in the next section.
4. Proposed Algorithm
4.1. Foundation of Dueling Double Deep Q-Network
Beforehand, we briefly introduce a deep Q network (DQN). It has great advantages in solving high-dimensional computing problems and decision-making problems. It is worth noting that DQN has an evaluation Q-network and target Q-network. The target Q value of the target Q-network is
Furthermore, the updated formula of Q value in DQN can be denoted by
where is the discount factor, is the value of the greedy strategy; is the network parameters of the public part of the network. However, DQN also has some shortcomings, such as overestimation problems when learning the Q value and it can only learn the Q value of taking a certain action in a certain state. Therefore, we introduce D3QN composed of Double DQN and Dueling DQN.
The main difference from DQN is that Double DQN divides into two steps when calculating TD target. First, the action corresponding to the maximum Q value is obtained by evaluating the network. It can be given as
afterward, the action obtained from the above equation is inputted into the target Q network, and the Q value is calculated as follows
Therefore, the updated formula for the Q value can be reformulated as
The advantage of Dueling DQN over DQN is that it can learn the value function of each state, without considering what action to take in that state. The network output of the original DQN algorithm is divided into the following two parts: the value function and the advantage function, which are mathematically expressed as
where denotes the advantage function parameter, and denotes the action value function parameter. However, the value and the obtained from Q in the above formula are not unique. In order to solve this problem, the advantage function is decentralized. Therefore, the Q value can be denoted by
Moreover, the target Q value of D3QN combining Double DQN and Dueling DQN can be given by
Finally, we can formulate the update of the Q value in D3QN as
On the other hand, LSTM has been widely used in reinforcement learning in recent years. Due to the fact that LSTM solves the gradient disappearance and gradient explosion problems during the training of long sequences, it can have better performance in long sequences. User requirements in our research scenario are sometimes variable. Moreover, the selection of the resource allocation action of the current time slot and the opening of the dual connection are related to the resource allocation of the previous time slot and the demand of the current time slot. The memory function of LSTM can effectively capture changes in service demand, so we introduce LSTM into D3QN to solve the proposed resource allocation problem in this paper.
4.2. Network Slicing Resource Allocation Algorithm Based on LSTM-D3QN with DC
In this subsection, we introduce the LSTM-D3QN slicing resource allocation algorithm. In D3QN, to find the Q value, we need to input the state to the fully connected layer, which is processed by two fully connected layers to form the feature tensor. With the introduction of the LSTM neural network, we only need to input the state into one layer of LSTM network to form the feature tensor, and then input the feature tensor to the fully connected layer of the value function and the fully connected layer of the dominance function in the dueling network to obtain the state value and the dominance value. It can be considered that the state of the input has changed from to . Thus, the current Q-value updated formula is expressed as
Thus, our final Q-value updated formula can be denoted as
We define a tuple , where represents the state, represents the action taken by the algorithm, and is defined as the reward obtained by the agent interacting with the environment after taking action . In a certain time slot, the agent observes a certain state , and takes action . After executing this action, the environment state transitions to .
Since the number of successful packet transmissions reflects the QoE, as well as the throughput in general, we define the state as
where represents the average value of the number of transmitted packets and represents standard deviation of packet transmission.
We define the action as the size of the bandwidth that each BS allocates to each service, denoted as
With regard to the reward, we set the standard of throughput and QoE for eMBB and URLLC services as 450 Mb/s, 0.97 and 0.94, respectively. Since we aim to improve the throughput and QoE of the services, the reward is given based on satisfying the three metrics.
After initializing the parameters of the LSTM-D3QN algorithm, we need to randomly select an action , and the BS obtains a resource allocation scheme according to action . Then, the agent calculates the of the two services as the observation value and inputs it into the Q network to form the initial state according to Equation (22).
In each iteration, the BS selects an action to obtain the corresponding bandwidth resource size of each service. After the user receives the bandwidth resource, if the bandwidth obtained by the user in this time slot is not enough to handle the task, the user will open a second connection at this time. Then, it can calculate each rate, QoE of services, extra energy consumption and the total utility of the system according to the Equations (5)–(8). Finally, the agent calculates the of the two services again as the next state , and input () into LSTM-D3QN for training.
For the update of network parameters, the agent interacts with the environment to obtain information and stores the information in the memory pool as transfer samples. When the number of samples in the memory pool is large enough, a certain amount of data is randomly selected from the sample pool for training. Then, LSTM-D3QN uses the evaluation Q network to calculate the state value and advantage value to obtain the current Q value and uses the target Q network to obtain the target Q value. Meanwhile, according to the ϵ-greedy strategy, the action that maximizes the current Q value in a certain state is selected. After a certain number of iterations, the parameters of the target Q network are updated by copying the current Q network parameters to the target Q network.
After a predetermined number of iterations, LSTM-D3QN is able to obtain the best action based on the best policy for a given state. Therefore, the optimal resource allocation scheme can be obtained. In order to facilitate readers to understand our process more clearly, the algorithm flowchart is shown in Figure 2. In addition, the pseudocode of the proposed algorithm is shown in Algorithm 1.
| Algorithm 1 The network slicing resource allocation based on LSTM-D3QN with DC. |
| 1: Initialize the environment parameters, reply memory D, the current network parameters , target action-value function parameters , ; C, . |
| 2: Choose random action to allocation bandwidth for users |
| 3: Dual Connectivity: |
| 4: Users the bandwidth resources |
| 5: The bandwidth resources are not enough |
| 6: The user opens dual connectivity |
| 7: The are calculated, and used as the current state of the last iteration; |
| 8: Repeat |
| 9: For iteration = 1, T do |
| 10: Choose an action according to the policy of LSTM-D3QN |
| 11: For slot = 1, I do |
| 12: Execution scheduling |
| 13: Execution dual connectivity |
| 14: End for |
| 15: The throughput is calculated according to Equation (5) |
| 16: The QoE is calculated by Equation (6) |
| 17: Calculate the utility based on Equation (7) |
| 18: Calculate the reward |
| 19: The are calculated, and used as the state of this iteration |
| 20: The agent input into the LSTM-D3QN |
| 21: The agent store transition in D |
| 22: The agent sample random minibatch of transitions from D; |
| 23: Define |
| 24: The agent performs gradient descent to update the network parameters |
| 25: Every C steps reset |
| 26: End for |
| 27: Until the predefined maximum number of iterations has been completed. |
4.3. Time Complexity Analysis
The time complexity of the training phase needs to consider the time complexity of training the Q network and the number of times of training the Q network. In the process of training the Q network, the connection weights between every two adjacent layers of neurons need to be updated. We set the number of layers of the Q network to be , the number of neurons in the th layer to be , and the number of iterations in each training to be , then the time complexity of training a Q network once can be calculated as
We denote the total number of iterations in the algorithm as , and the number of steps in each iteration as , then the number of times to train the Q network is , so the time complexity of the proposed algorithm training phase can be calculated as
The time complexity of the online training phase of the deep reinforcement learning algorithm is high, but after the Q network is trained, the Q network does not need to be updated in the running phase, and the time complexity is low, which can meet the requirements of online decision-making time under real-time network conditions. Since the algorithms we compared in the simulation are all deep reinforcement learning algorithms and are set the same parameters, they are roughly the same in terms of algorithm complexity.
5. Simulation Results and Discussion
5.1. Simulation Parameters
In this section, we conduct an extensive evaluation of the proposed algorithm and the role of DC in resource allocation. In the simulation scenario, with a MBS as the center, three SBSs are distributed around, and the positions of the MBS and the SBS are fixed. Assuming that the MBS is located at the origin of the Cartesian coordinate system, the three SBSs are located at (80, 0), (−80, 80) and (−80, 80) coordinates, respectively. The weights of the optimization target throughput, QoE of both services and extra system energy consumption are set as , = [3, 3], , respectively. The role of the weights here is to make the optimization indicators of different units and orders of magnitude reach the same order of magnitude, so as to facilitate the plotting of the utility function. We adjust the weights to make the utility curve more discriminative, without changing the overall trend. Other parameters in the environment are shown in Table 2. The parameters of LSTM-D3QN are shown in Table 3.
5.2. Simulation Results and Discuss
In this part, we first show the simulation results of the proposed algorithm based on LSTM-D3QN, compared with the algorithms based on DQN and LSTM-A2C. In [12], the resource allocation algorithm based on LSTM-A2C is used for network slicing scenarios and DQN is compared. In particular, the same learning ratios are set for LSTM-D3QN, LSTM-A2C and DQN. Then, we simulate the impact of resource allocation with and without DC assistance on the optimization metrics from three aspects. Finally, we tested the impact of different numbers of users on the optimization targets of the system. The performance simulation results and analysis are as follows.
5.2.1. Simulation Results and Analysis of Different Algorithms
Figure 3 illustrates the change in the system utility for a certain number of iterations. It can be observed that DQN cannot converge to the optimal utility after 8000 iterations, while both our proposed LSTM-D3QN algorithm and the state-of-the-art LSTM-A2C algorithm can converge to a higher system utility and stabilize at around 7.8 after convergence. Nevertheless, our proposed algorithm is nearly 1500 iterations faster in convergence compared to LSTM-A2C. Figure 4 shows the variation in the number of dual-connected users with the number of iterations. It can be observed that as the number of iterations increases, our proposed LSTM-D3QN and LSTM-A2C can both converge to 30 users.
From Figure 5, we can observe that the throughput has many abnormally high points that are much larger than the convergence value. This situation is due to the fact that the BS allocates the vast majority of bandwidth to one type of slice when dividing the bandwidth, resulting in a very low QoE of another service, even its QoE is equal to 0. Since we give a high weight to the QoE, the overall utility is very low, even though the throughput is abnormally high. It can also be observed that our algorithm has very few outliers and shows better stability in bandwidth allocation.
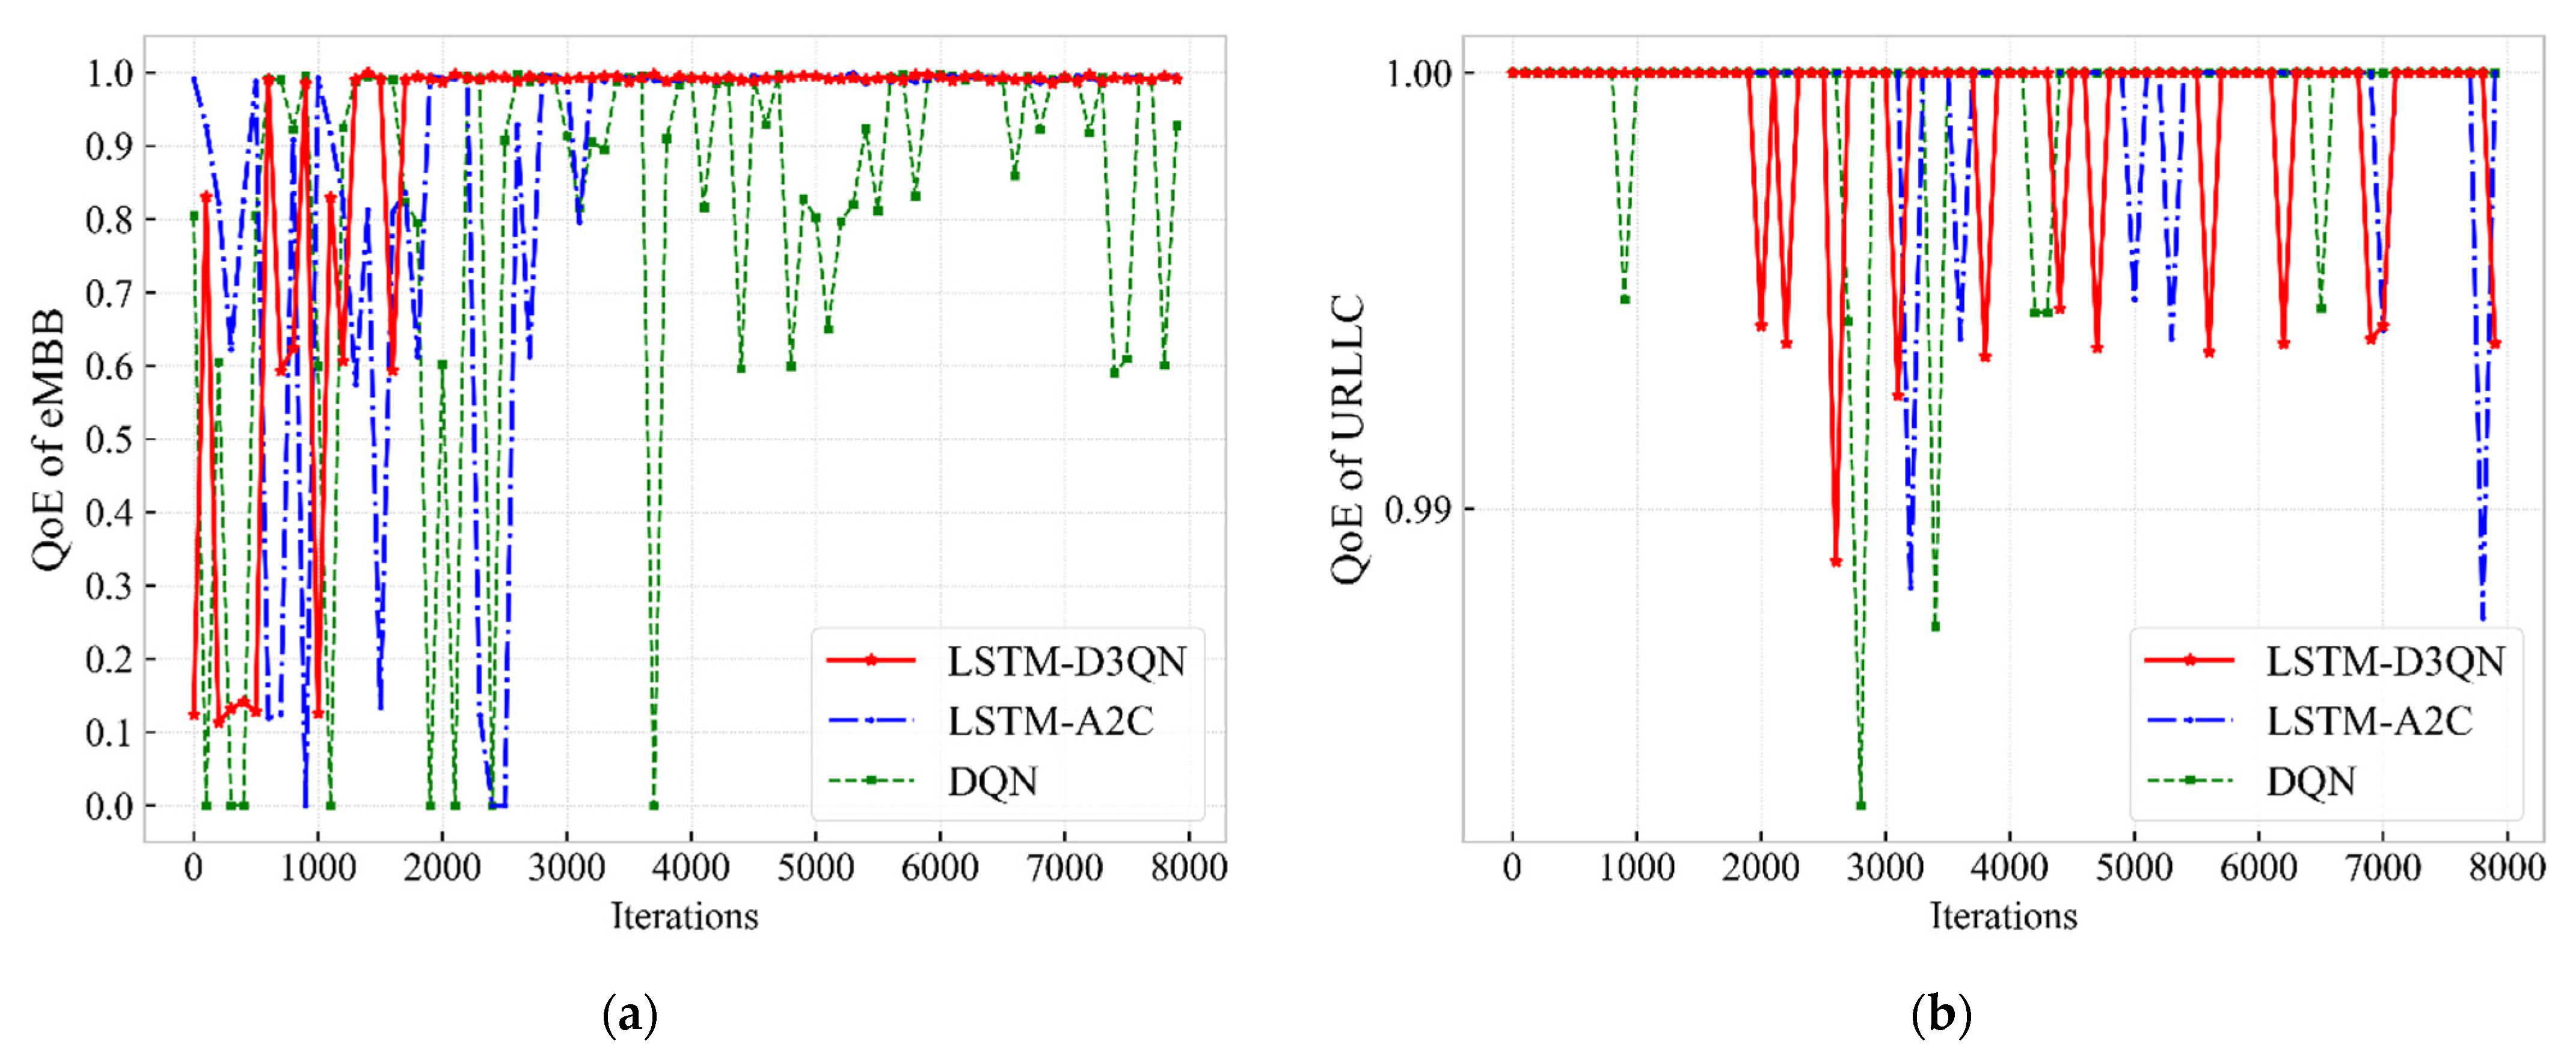
Figure 6 shows the QoE for eMBB and URLLC services. For QoE of eMBB, it can be observed that both our proposed algorithm and the LSTM-A2C algorithm can converge to about 0.99, while the DQN can only oscillate between 0.6 and 1.0. From the perspective of QoE of URLLC, all three algorithms can reach above 0.99 after training, but we can observe that it stabilizes at 1.0 in the early stage and it drops to about 0.99 in the later stage, because our algorithm sacrifices some QoE of the URLLC service and allocates more bandwidth to the eMBB service to obtain more throughput. From the algorithm point of view, even with DQN, the QoE of URLLC can still reach above 0.99 in the later stage, which fully demonstrates the great improvement brought by the DC to the URLLC service. It is worth mentioning that the eMBB service buffer we set can usually be completed in one time slot, which requires the agent to allocate enough bandwidth to eMBB in one time slot to meet the high rate requirements. On the contrary, the buffer of the URLLC service is large and needs to be transmitted in a limited time slot. However, due to the role of the DC, the probability that the URLLC service can be completed within a limited time is greatly increased. Therefore, in our simulation scenario, it is more difficult to meet the requirements of the eMBB service than the URLLC service. This is why DQN can meet the QoE of URLLC in the later stage, but it is difficult to meet the QoE of eMBB. Overall, looking at the overall utility of the system, the throughput and QoE of the eMBB service increase with the number of dual-connected users, showing the impact of our introduction of DC on the slice resource allocation.
5.2.2. Simulation Results and Analysis with or without DC Assistance under Different Priorities
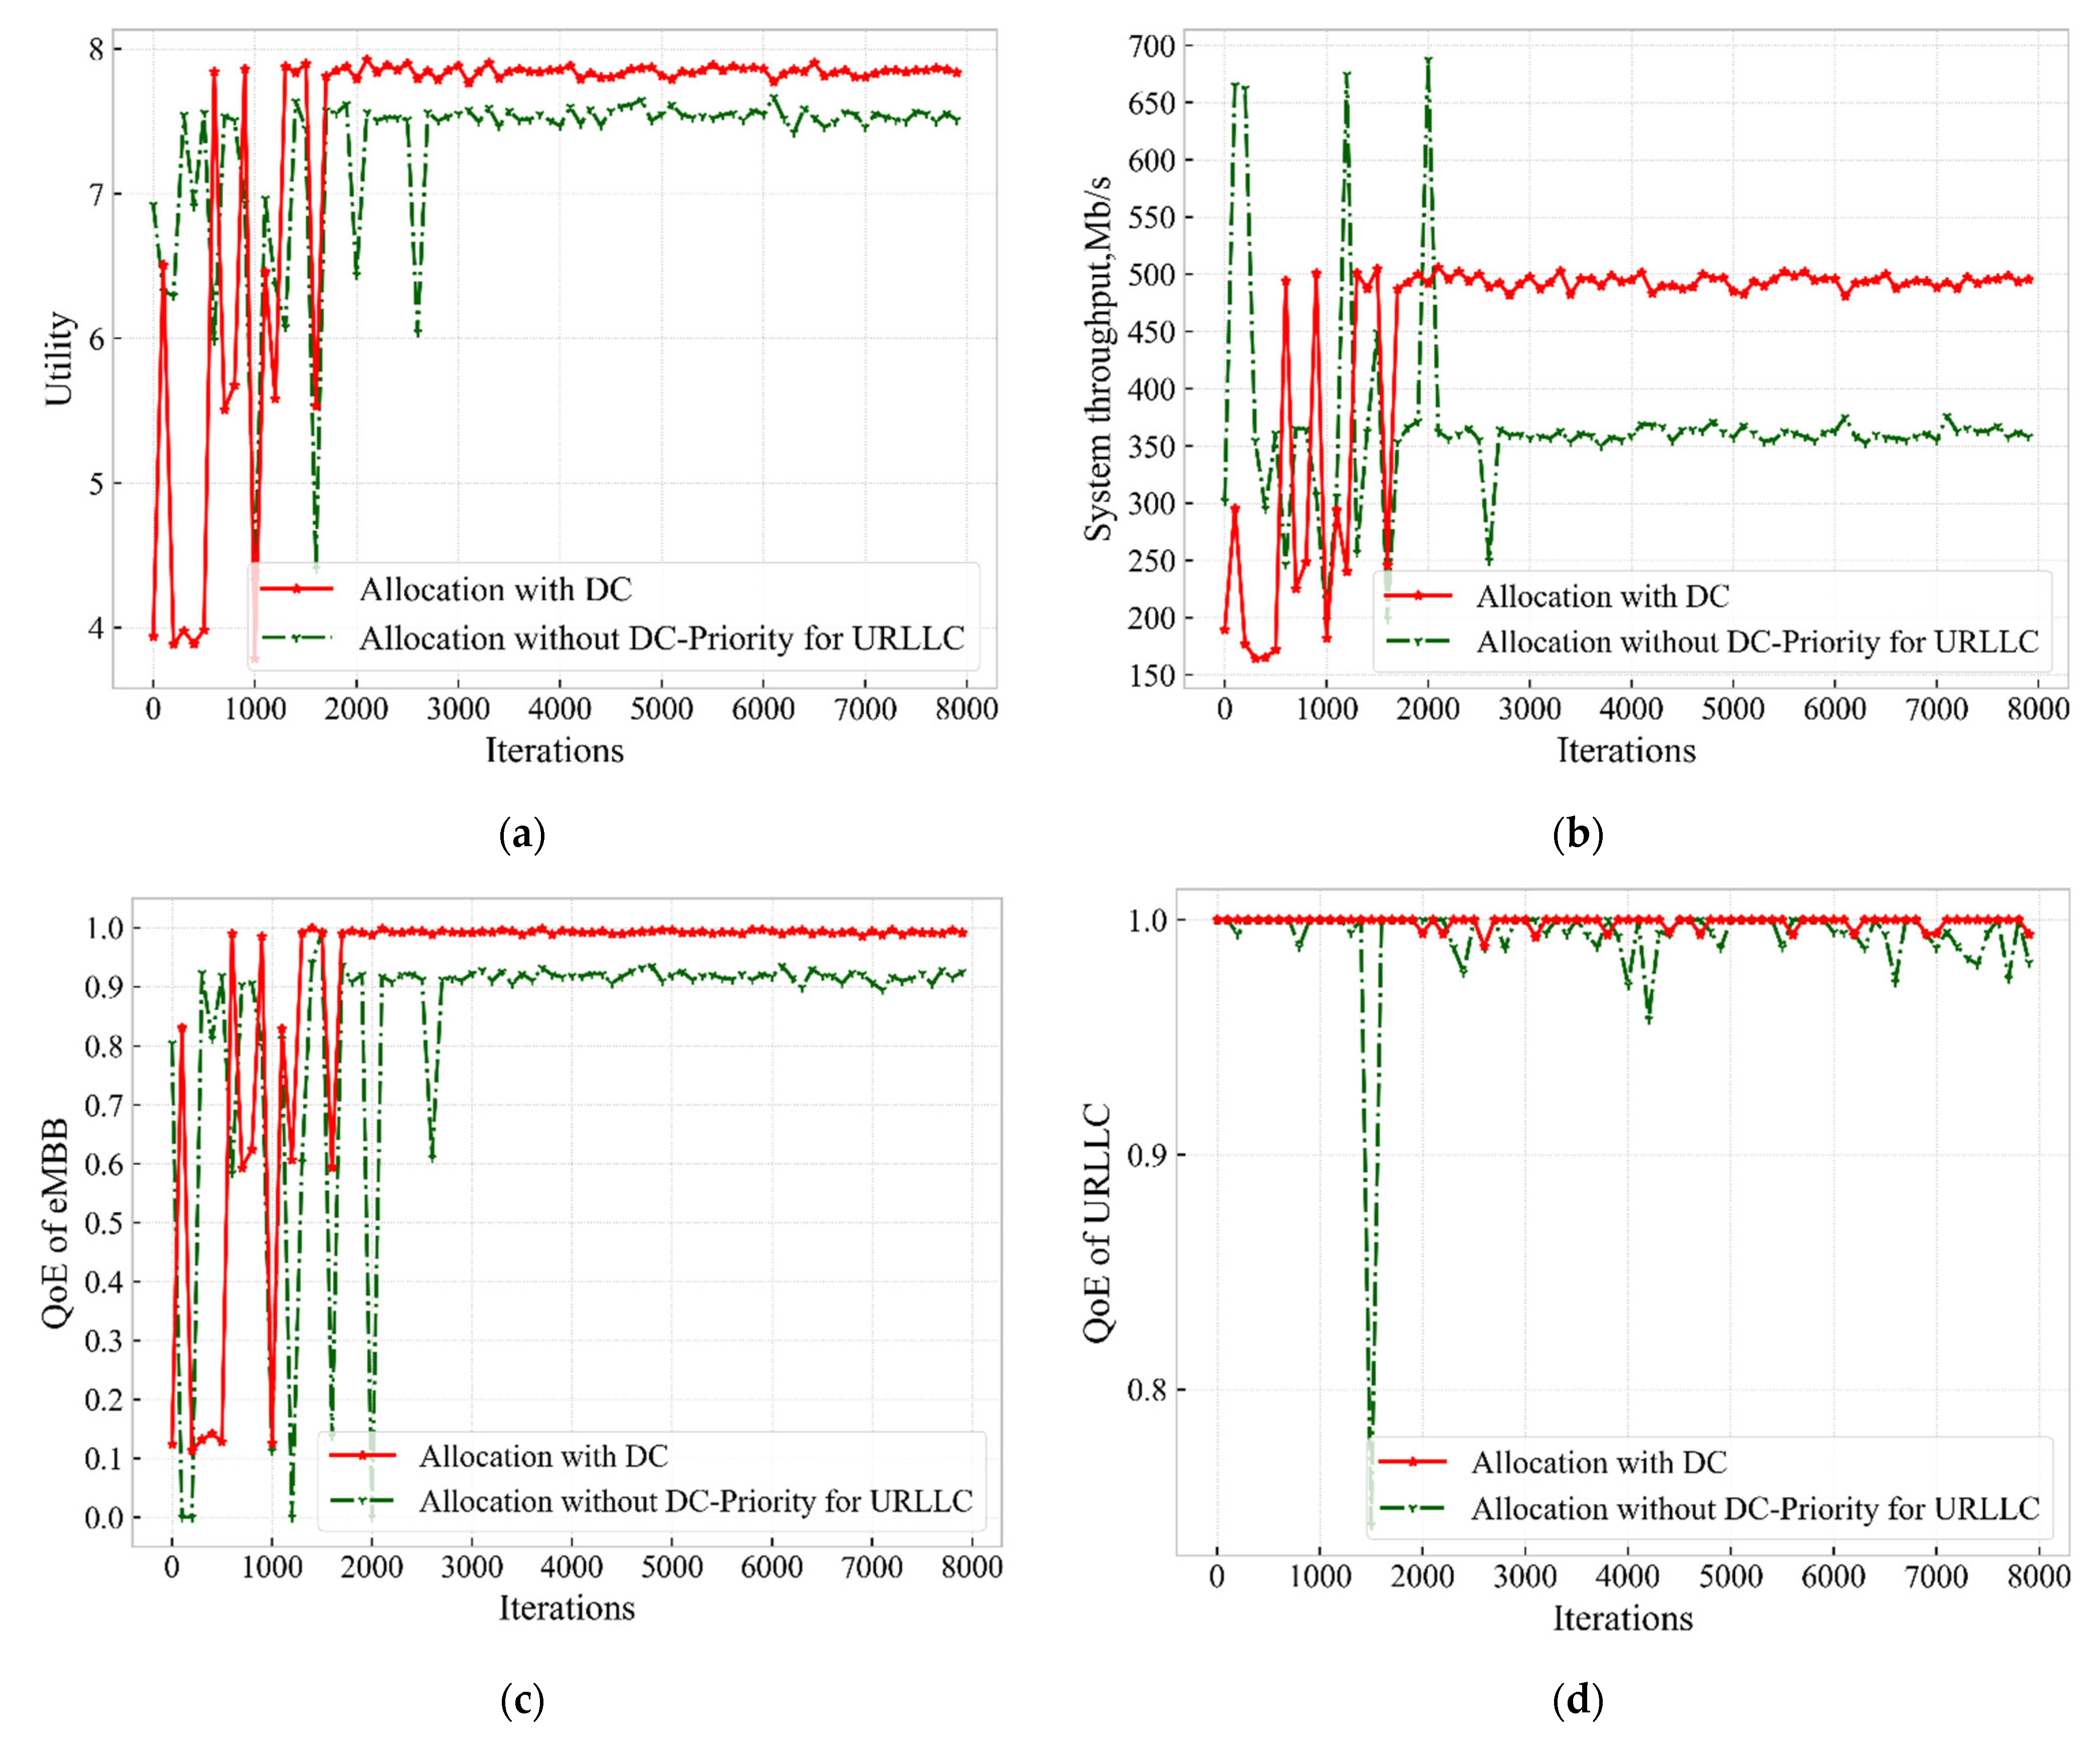
Figure 7 shows the comparison of various optimization objectives with and without DC assistance without service priority. From Figure 7a, it can be observed that there are still some points without DC assistance that can reach system utility under DC assistance after convergence. In fact, there is no additional system power consumption without DC assist. Therefore, the utility gap between both situations will be more pronounced if the system energy consumption is not considered. From Figure 7b, we can find that the peak throughput of the system without DC assistance is still about 40 Mb/s less than that with DC assistance after convergence. Figure 7c,d show that the QoEs of both eMBB and URLLC can reach 1.0, but the QoE curve is very unstable, and the QoE fluctuation of the URLLC service is larger than that of eMBB, which is even lower than 0.7. Overall, the value of each optimization objective with DC assistance is higher and more stable after convergence than without DC assistance.
Figure 8 depicts the comparison of different optimization goals when the eMBB service priority is higher. Figure 8a shows that some strategies can achieve satisfactory values without DC assistance after convergence, and even the values of some points exceed those with DC assistance. From Figure 8b, it can be observed that when the eMBB service priority is higher without DC assistance, the system throughput is stable at about 450 Mb/s after the curve converges, which is 50 Mb/s lower than that with DC assistance. Figure 8c shows that the QoE of eMBB can also be stabilized to 1.0 when the eMBB service priority is higher without DC assistance. We can find from Figure 8d that when the eMBB service has a higher priority without the assistance of the DC, the QoE of the URLLC service after convergence is not as excellent as in the early iteration stage, because the rewards we set are more inclined to satisfy the QoE of eMBB service. In addition, when there is no DC assistance, only the QoE of the URLLC service can be sacrificed to meet the requirements of eMBB. We can also find that the QoE convergence curve trend of URLLC is very similar to the utility curve without DC assistance. This is because the throughput of the system and the QoE of eMBB are very stable after convergence, so the curve trend of QoE of URLLC determines the trend of the utility curve. Comparing Figure 8a,b, we can conclude that although the utility of the system without DC assistance has individual points that exceed the converged value with DC assistance, this is not the satisfactory result we want, because at this time, the QoE of the URLLC service is far lower than the service requirement. Furthermore, there is no additional system power consumption without DC assist. Therefore, the utility of the system without DC assistance cannot be higher than that of the system with DC assistance, if the system energy consumption is not considered.
Figure 9 depicts the comparison of different optimization goals when the URLLC service has higher priority. Figure 9a shows that the utility of the system with DC assistance is about 0.4 higher than that of the system without DC assistance, which is the same as the previous description. If the additional energy consumption of the system is not considered, the difference will be greater than 0.4. From Figure 9b,c, it can be observed that when there is no DC assistance and the QoE requirement of URLLC service is preferentially met, the throughput of the system is lower than that in Figure 8b, and the QoE of eMBB service is only can reach about 0.9. It can also be observed that the QoE of the eMBB service is closely related to the system throughput. When the QoE of the eMBB service is satisfied, the system throughput is often higher. This is because the eMBB service requires a large bandwidth. When the bandwidth given to the eMBB at one time is plenty, the throughput of the system will also be large. Figure 9d shows that when there is no DC assistance and the QoE requirements of the URLLC service are preferentially met, although the QoE can reach more than 0.95, the QoE of the URLLC service is still more stable with the DC assistance.
5.2.3. Simulation Results and Analysis with Different Numbers of Users
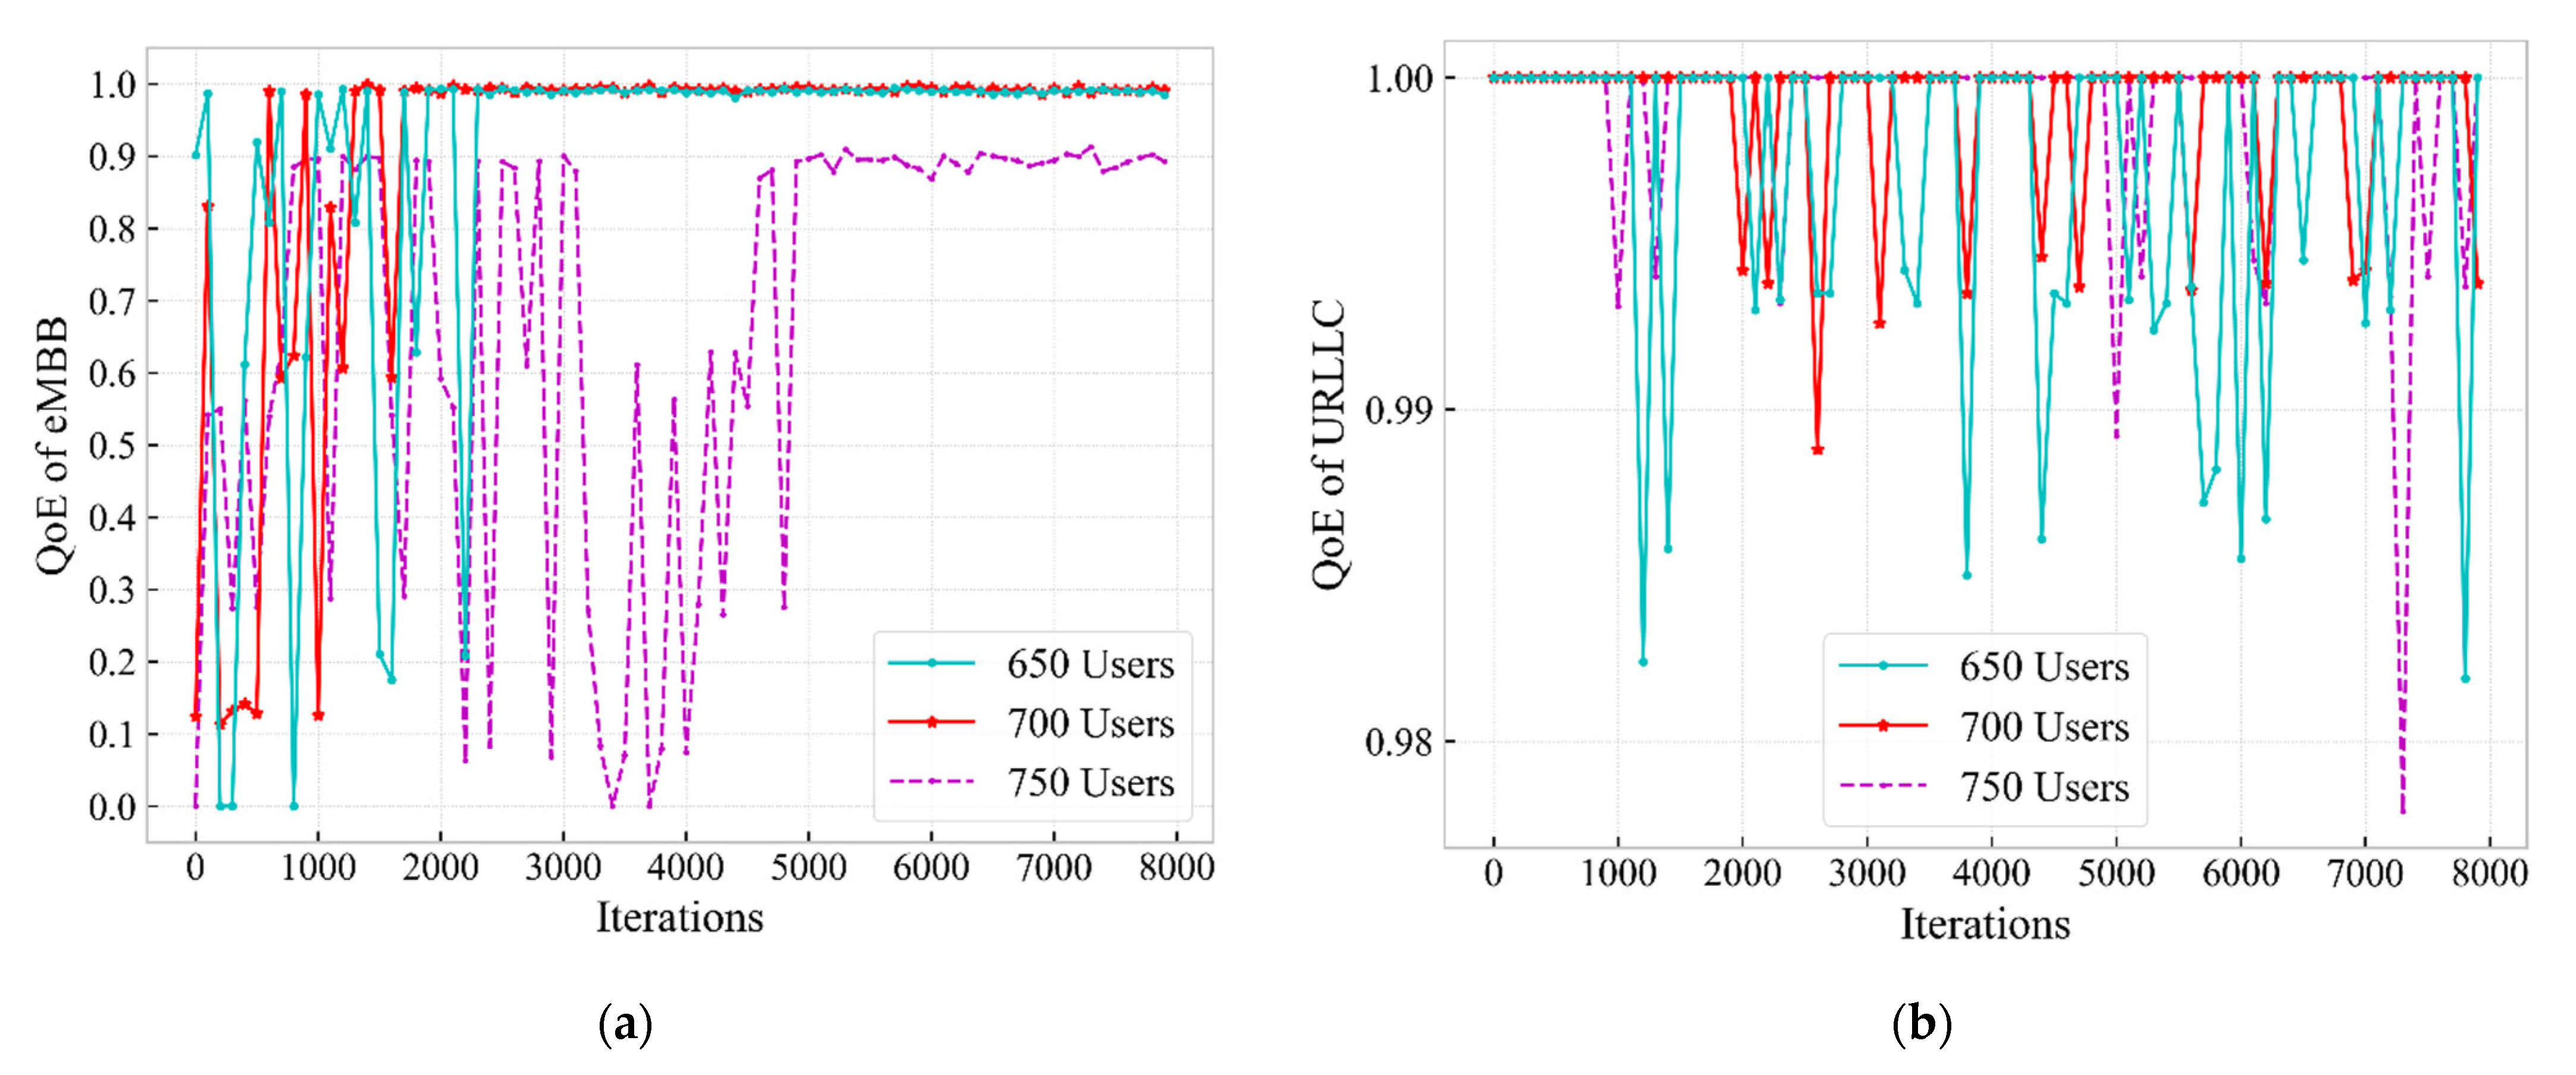
Figure 10, Figure 11, Figure 12 and Figure 13 depict the effects of different numbers of users within the network system on various optimization goals. Figure 10 clearly shows that when the number of users in the system is larger, its utility will be lower. In addition, when the number of users reaches 750, the convergence of the algorithm also becomes not very stable, and it does not really converge until about 5000 iterations. Figure 11 shows that the number of users using DC varies as the number of users in the system increases because the added users include users of both services. In the figure, when the number of users is 700, there are more users using DC than when the number of users is 750. Because our users are randomly distributed, although the number of users is 750, the number of users of the SBS may not be more than the case where the total number of users is 700. The convergence trend of the curve is similar to the utility; when the number of users is 750, there will be an unstable fluctuation after the training convergence. From the perspective of system throughput, when the number of users in the system is 700 and 750, the system throughput is almost equal, but both are smaller than the throughput when the number of users is 650. Figure 13a shows that when the number of users is 650 and 700, the QoE of eMBB service can reach 1.0, but when the total number of users is 750, the QoE of eMBB can only converge to about 0.9. From the QoE of URLLC service, due to the role of DC, even if the total number of users of the system reaches 750, its QoE can reach more than 0.97. As can be observed from Figure 10, Figure 11, Figure 12 and Figure 13, the number of users that the system can accommodate is between 700 and 750 under the condition that the QoE of the users can meet the requirements.
5.2.4. Simulation Results and Analysis with Different Algorithm Parameters
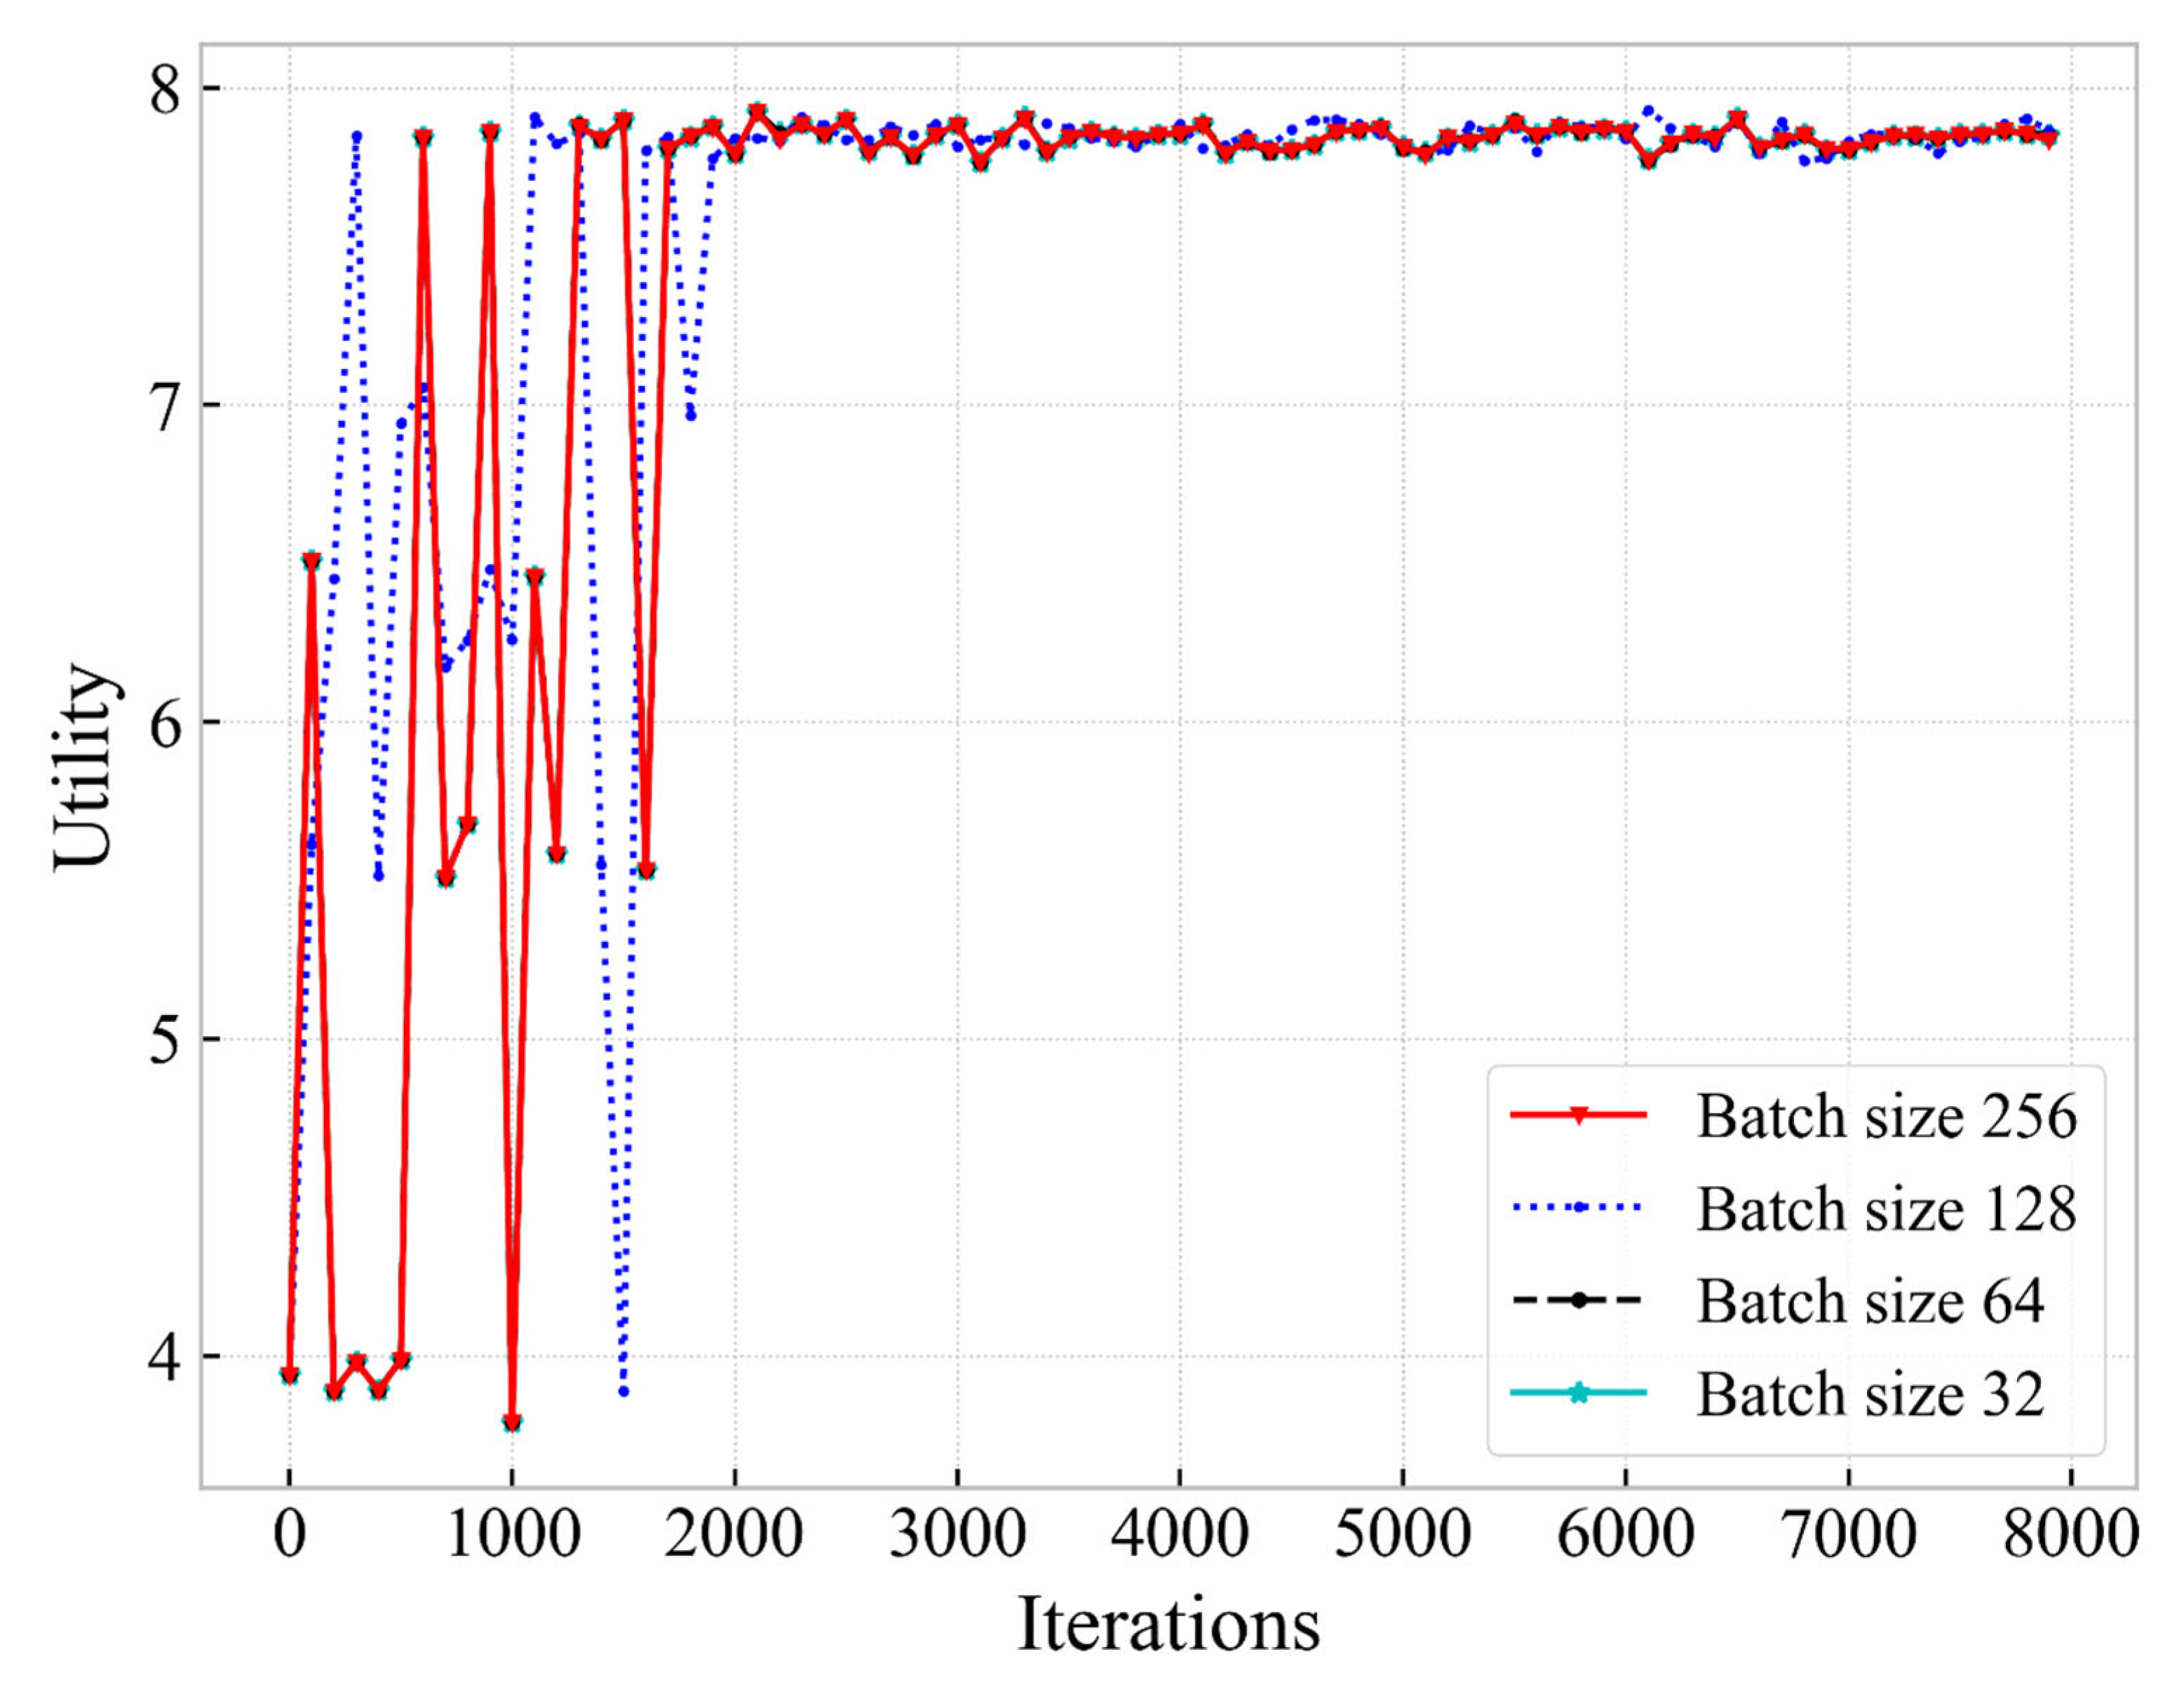
Figure 14 shows the effect of different learning rates on the performance of the algorithm. As can be observed from the figure, under different learning rates, our algorithm can converge to an optimal value. However, when the learning rate is different, the convergence speed of the curve is different. When the learning rate is 0.1, the convergence rate is the slowest, because the optimization gradient is very large in this case, and it is easy to skip the optimal solution. When the learning rate is 0.0001, the convergence speed is also very slow, because the gradient is too small, resulting in a slow optimization speed. When the learning rate is 0.001, the optimization gradient will not be too large, and the learning speed will not be very slow, so it has the fastest convergence rate. As can be observed from Figure 15, different batch sizes have little effect on the performance of our proposed algorithm, and even the optimization curves overlap. This is because more optimal actions appear in our environment due to dual connections, so, in most cases, the same training result will be obtained even if the batch size of each training is different.
6. Contribution Discussion
In Section 3, we propose a heterogeneous network scenario with two services, and introduce the establishment of the system model in detail, including signal-to-noise ratio, downlink transmission rate, user experience quality and additional energy consumption caused by dual connectivity users. We then use these optimization metrics to form our optimization problem, a weighted sum of system throughput and QoE, minus the weighting of additional energy consumption. Finally, we show that the optimization objective is an NP-Hard problem, which leads to the reason why we use deep reinforcement learning methods to solve our optimization problem. This section corresponds to our first part of the contribution.
In the first part of Section 4, we introduce the basic formulations of DQN, Double DQN and Dueling DQN. At the same time, their advantages and disadvantages are introduced, and the role of long short-term memory network is briefly introduced, paving the way for proposing our resource allocation algorithm. In the second part, we introduce how the network slice resource allocation algorithm based on LSTM-D3QN is derived, list the Q-value formula of LSTM-D3QN, and set the state, action and reward for the proposed algorithm. Finally, we introduce the algorithm execution process in detail, and draw a flowchart and pseudocode for our algorithm to facilitate readers’ understanding. This section corresponds to the second part of the contribution.
In the first part of Section 5, we first set the simulation parameters, including the system environment parameters and proposed algorithm parameters. In the second part, we first compare the performance of our proposed algorithm with two representative algorithms, including the baseline algorithm DQN and the algorithm LSTM-A2C in the reference [19]. The simulation results verify that our proposed algorithm outperforms other algorithms in terms of convergence and effectiveness. Then, we simulate the effects on various system optimization metrics with and without DC assistance. This also includes the following three cases: no service priority, eMBB service priority and URLLC service priority. The simulation results show that in either case, the system utility with DC assistance is better than that without DC assistance. For simulation parameters, we simulated the effects of different user numbers on the optimization indicators of the system. The simulation results show that the higher the number of users in the system, the lower the utility, and the approximate number of users that our scenario can accommodate under the condition of guaranteeing QoE is obtained. Finally, we also simulate the effect of different parameters on the algorithm and explain in detail the reasons for the change in performance of the algorithm due to different parameters. This section corresponds to the third part of our contribution.
In summary, the contributions mentioned in our introductory section are presented in detail in the text.
7. Conclusions
In this paper, we propose a slice resource allocation algorithm based on LSTM-D3QN to solve the problem of multi-service resource allocation in heterogeneous network scenarios. In order to meet the service requirements of users in small base stations, we use dual connectivity technology, so that users can obtain bandwidth resources from SBS and MBS at the same time, when the base station bandwidth resources are fixed. To address the non-convexity and dynamic nature of our research problem, an iterative LSTM-D3QN algorithm is proposed. For the proposed algorithm, we first deduce the formulation of D3QN, and then incorporate the LSTM neural network into the algorithm for better performance. Furthermore, we compare the proposed algorithm with other DRL algorithms to verify the excellent performance of our proposed algorithm. Finally, we compare our scheme with the slice resource allocation scheme without DC assistance from multiple perspectives, verifying the role of DC in resource allocation of heterogeneous network slices. The results show that the DC-assisted resource allocation scheme can achieve higher system utility, throughput and QoEs.
Author Contributions
Conceptualization, G.C.; Data curation, X.M.; Formal analysis, G.C. and X.M.; Methodology, Q.Z.; Validation, F.S.; Writing—original draft, G.C.; Writing—review and editing, X.M. All authors have read and agreed to the published version of the manuscript.
Funding
This work was supported by the National Natural Science Foundation of China under Grant No. 61701284, 61871370, the Innovative Research Foundation of Qingdao under Grant No. 19-6-2-1-cg, the Elite Plan Project of Shandong University of Science and Technology under Grant No. skr21-3-B-048, the Application Research Project for Postdoctoral Researchers of Qingdao, the National Key R&D Program of China under Grant No. 2019YFE0120700, 2019YFB1803101, the Hundred Talent Program of Chinese Academy of Sciences under Grant No. E06BRA1001, the Sci. & Tech. Development Fund of Shandong Province of China under Grant No. ZR202102230289, ZR202102250695 and ZR2019LZH001, the Humanities and Social Science Research Project of the Ministry of Education under Grant No. 18YJAZH017, the Taishan Scholar Program of Shandong Province, the Shandong Chongqing Science and technology cooperation project under Grant No. cstc2020jscx lyjsAX0008, the Sci. & Tech. Development Fund of Qingdao under Grant No. 21-1-5-zlyj-1-zc, SDUST Research Fund under Grant No. 2015TDJH102, and the Science and Technology Support Plan of Youth Innovation Team of Shandong higher School under Grant No. 2019KJN024.
Institutional Review Board Statement
Not applicable.
Informed Consent Statement
Not applicable.
Data Availability Statement
Data sharing not applicable.
Acknowledgments
The authors would like to extend their gratitude to the anonymous reviewers and the editors for their valuable and constructive comments, which have greatly improved the quality of this paper.
Conflicts of Interest
The authors declare no conflict of interest.
References
- Wijethilaka, S.; Liyanage, M. Survey on Network Slicing for Internet of Things Realization in 5G Networks. IEEE Commun. Surv. Tutor. 2021, 23, 957–994. [Google Scholar] [CrossRef]
- Zhao, N.; Liang, Y.-C.; Niyato, D.; Pei, Y.; Wu, M.; Jiang, Y. Deep Reinforcement Learning for User Association and Resource Allocation in Heterogeneous Cellular Networks. IEEE Trans. Wirel. Commun. 2019, 18, 5141–5152. [Google Scholar] [CrossRef]
- Oughton, E.J.; Frias, Z.; Gaast, S.V.D.; Berg, R.V.D. Assessing the capacity, coverage and cost of 5G infrastructure strategies: Analysis of the Netherlands. Telemat. Inform. 2019, 37, 50–69. [Google Scholar] [CrossRef]
- Wu, Y.; Dai, H.-N.; Wang, H.; Xiong, Z.; Guo, S. A Survey of Intelligent Network Slicing Management for Industrial IoT: Integrated Approaches for Smart Transportation, Smart Energy, and Smart Factory. IEEE Commun. Surv. Tutor. 2022, 24, 1175–1211. [Google Scholar] [CrossRef]
- Richart, M.; Baliosian, J.; Serrat, J.; Gorricho, J. Resource Slicing in Virtual Wireless Networks: A Survey. IEEE Trans. Netw. Serv. Manag. 2016, 13, 462–476. [Google Scholar] [CrossRef]
- Chahbar, M.; Diaz, G.; Dandoush, A.; Cérin, C.; Ghoumid, K. A Comprehensive Survey on the E2E 5G Network Slicing Model. IEEE Trans. Netw. Serv. Manag. 2021, 18, 49–62. [Google Scholar] [CrossRef]
- Afolabi, I.; Taleb, T.; Samdanis, K.; Ksentini, A.; Flinck, H. Network Slicing and Softwarization: A Survey on Principles, Enabling Technologies, and Solutions. IEEE Commun. Surv. Tutor. 2018, 20, 2429–2453. [Google Scholar] [CrossRef]
- Agiwal, M.; Kwon, H.; Park, S.; Jin, H. A Survey on 4G-5G Dual Connectivity: Road to 5G Implementation. IEEE Access 2021, 9, 16193–16210. [Google Scholar] [CrossRef]
- Rosa, C.; Pedersen, K.; Wang, H.; Michaelsen, P.-H.; Barbera, S.; Malkamäki, E.; Henttonen, T.; Sébire, B. Dual connectivity for LTE small cell evolution: Functionality and performance aspects. IEEE Commun. Mag. 2016, 54, 137–143. [Google Scholar] [CrossRef]
- Du, J.; Jiang, C.; Wang, J.; Ren, Y.; Debbah, M. Machine Learning for 6G Wireless Networks: Carrying Forward Enhanced Bandwidth, Massive Access, and Ultrareliable/Low-Latency Service. IEEE Veh. Technol. Mag. 2020, 15, 122–134. [Google Scholar] [CrossRef]
- Hua, Y.; Li, R.; Zhao, Z.; Chen, X.; Zhang, H. GAN-Powered Deep Distributional Reinforcement Learning for Resource Management in Network Slicing. IEEE J. Sel. Areas Commun. 2019, 38, 334–349. [Google Scholar] [CrossRef]
- Li, R.; Wang, C.; Zhao, Z.; Guo, R.; Zhang, H. The LSTM-Based Advantage Actor-Critic Learning for Resource Management in Network Slicing With User Mobility. IEEE Commun. Lett. 2020, 24, 2005–2009. [Google Scholar] [CrossRef]
- Wu, W.; Chen, N.; Zhou, C.; Li, M.; Shen, X.; Zhuang, W.; Li, X. Dynamic RAN Slicing for Service-Oriented Vehicular Networks via Constrained Learning. IEEE J. Sel. Areas Commun. 2021, 39, 2076–2089. [Google Scholar] [CrossRef]
- Cui, Y.; Huang, X.; He, P.; Wu, D.; Wang, R. QoS Guaranteed Network Slicing Orchestration for Internet of Vehicles. IEEE Internet Things J. 2022. accepted. [Google Scholar] [CrossRef]
- Dong, T.; Zhuang, Z.; Qi, Q.; Wang, J.; Sun, H.; Yu, F.R.; Sun, T.; Zhou, C.; Liao, J. Intelligent Joint Network Slicing and Routing via GCN-Powered Multi-Task Deep Reinforcement Learning. IEEE Trans. Cogn. Commun. Netw. 2022, 8, 1269–1286. [Google Scholar] [CrossRef]
- Mkiramweni, M.E.; Yang, C.; Li, J.; Zhang, W. A Survey of Game Theory in Unmanned Aerial Vehicles Communications. IEEE Commun. Surv. Tutor. 2019, 21, 3386–3416. [Google Scholar] [CrossRef]
- Singh, U.; Ramaswamy, A.; Dua, A.; Kumar, N.; Tanwar, S.; Sharma, G.; Davidson, I.E.; Sharma, R. Coalition Games for Performance Evaluation in 5G and Beyond Networks: A Survey. IEEE Access 2022, 10, 15393–15420. [Google Scholar] [CrossRef]
- Tran, T.D.; Le, L.B. Resource Allocation for Multi-Tenant Network Slicing: A Multi-Leader Multi-Follower Stackelberg Game Approach. IEEE Trans. Veh. Technol. 2020, 69, 8886–8899. [Google Scholar] [CrossRef]
- Caballero, P.; Banchs, A.; Veciana, G.D.; Costa-Pérez, X. Network Slicing Games: Enabling Customization in Multi-Tenant Mobile Networks. IEEE ACM Trans. Netw. 2019, 27, 662–675. [Google Scholar] [CrossRef]
- Lieto, A.; Malanchini, I.; Mandelli, S.; Moro, E.; Capone, A. Strategic Network Slicing Management in Radio Access Networks. IEEE Trans. Mob. Comput. 2022, 21, 1434–1448. [Google Scholar] [CrossRef]
- Dawaliby, S.; Bradai, A.; Pousset, Y. Distributed Network Slicing in Large Scale IoT Based on Coalitional Multi-Game Theory. IEEE Trans. Netw. Serv. Manag. 2019, 16, 1567–1580. [Google Scholar] [CrossRef]
- Cui, H.; You, F. User-Centric Resource Scheduling for Dual-Connectivity Communications. IEEE Commun. Lett. 2021, 25, 3659–3663. [Google Scholar] [CrossRef]
- Mahmood, N.H.; Lopez, M.; Laselva, D.; Pedersen, K.; Berardinelli, G. Reliability Oriented Dual Connectivity for URLLC services in 5G New Radio. In Proceedings of the 15th International Symposium on Wireless Communication Systems (ISWCS), Lisbon, Portugal, 28–31 August 2018; pp. 1–6. [Google Scholar]
- Park, G.S.; Song, H. Video Quality-Aware Traffic Offloading System for Video Streaming Services Over 5G Networks With Dual Connectivity. IEEE Trans. Veh. Technol. 2019, 68, 5928–5943. [Google Scholar] [CrossRef]
- He, M.; Hua, C.; Xu, W.; Gu, P.; Shen, X.S. Delay Optimal Concurrent Transmissions With Raptor Codes in Dual Connectivity Networks. IEEE Trans. Netw. Sci. Eng. 2021, 8, 1478–1491. [Google Scholar] [CrossRef]
- Mondal, S.; Al-Rubaye, S.; Tsourdos, A. Handover Prediction for Aircraft Dual Connectivity Using Model Predictive Control. IEEE Access 2021, 9, 44463–44475. [Google Scholar] [CrossRef]
- Qi, K.; Liu, T.; Yang, C.; Suo, S.; Huang, Y. Dual Connectivity-Aided Proactive Handover and Resource Reservation for Mobile Users. IEEE Access 2021, 9, 36100–36113. [Google Scholar] [CrossRef]
- Mumtaz, T.; Muhammad, S.; Aslam, M.I.; Mohammad, N. Dual Connectivity-Based Mobility Management and Data Split Mechanism in 4G/5G Cellular Networks. IEEE Access 2020, 8, 86495–86509. [Google Scholar] [CrossRef]
- Arif, M.; Wyne, S.; Navaie, K.; Haroon, M.S.; Qureshi, S. Dual Connectivity in Decoupled Aerial HetNets With Reverse Frequency Allocation and Clustered Jamming. IEEE Access 2020, 8, 221454–221467. [Google Scholar] [CrossRef]
- Li, C.; Wang, H.; Song, R. Intelligent Offloading for NOMA-Assisted MEC via Dual Connectivity. IEEE Internet Things J. 2021, 8, 2802–2813. [Google Scholar] [CrossRef]
- Wang, Z.; Ma, M.; Qin, F. Neural-Network-Based Nonlinear Self- Interference Cancelation Scheme for Mobile Stations With Dual-Connectivity. IEEE Access 2021, 9, 53566–53575. [Google Scholar] [CrossRef]
Figure 1.
An illustration of the system model.

Figure 2.
The algorithm flowchart.

Figure 3.
The comparison of system utility for different methods.

Figure 4.
The comparison of the number of dual-connected users for different methods.

Figure 5.
The comparison of system throughput for different methods.

Figure 6.
The comparison of QoEs for different methods. (a) The comparison of QoE of eMBB; (b) the comparison of QoE of URLLC.
Figure 6.
The comparison of QoEs for different methods. (a) The comparison of QoE of eMBB; (b) the comparison of QoE of URLLC.

Figure 7.
The comparison of optimization goals under the LSTM-D3QN algorithm with and without dual connectivity assistance while there is no service priority. (a) The comparison of utility; (b) the comparison of system throughput; (c) the comparison of QoE of eMBB; (d) the comparison of QoE of URLLC.


Figure 8.
The comparison of optimization goals under the LSTM-D3QN algorithm with and without dual connectivity assistance while there is priority for eMBB service. (a) The comparison of utility; (b) the comparison of system throughput; (c) the comparison of QoE of eMBB; (d) the comparison of QoE of URLLC.

Figure 9.
The comparison of optimization goals under the LSTM-D3QN algorithm with and without dual connectivity assistance while there is priority for URLLC service. (a) The comparison of utility; (b) the comparison of system throughput; (c) the comparison of QoE of eMBB; (d) the comparison of QoE of URLLC.

Figure 10.
The comparison of system utility under different numbers of users.

Figure 11.
The comparison of the number of dual-connected users under different numbers of users.

Figure 12.
The comparison of system throughput under different numbers of users.

Figure 13.
The comparison of QoEs under different numbers of users. (a) The comparison of QoE of eMBB; (b) the comparison of QoE of URLLC.
Figure 13.
The comparison of QoEs under different numbers of users. (a) The comparison of QoE of eMBB; (b) the comparison of QoE of URLLC.

Figure 14.
Comparison of algorithm performance with different learning rates.

Figure 15.
Comparison of algorithm performance with different batch sizes.


Table 1.
Notations and descriptions.
| Notations | Description |
|---|---|
| The set of base stations | |
| The index of base stations | |
| Bandwidth resources owned by base station | |
| The number of slices | |
| The index of slice | |
| The set of users | |
| The index of users | |
| The number of users with service | |
| The signal-to-noise ratio of the user connected to the MBS | |
| The signal-to-interference-noise ratio of the user connected to the SBS | |
| Transmit power of the MBS | |
| Transmit power of the SBS | |
| Downlink channel gains from the MBS | |
| Downlink channel gains from the SBS | |
| The average background noise power | |
| Downlink transmission rate of user connected to MBS | |
| Downlink transmission rate of user connected to SBS | |
| Total downlink transmission rate of user | |
| Binary variable used to indicate which BS the user is connected to | |
| Binary variable that indicates whether the packet was successfully transmitted | |
| Total number of data packets transmitted by the BS to user | |
| A binary variable that indicates whether user uses DC | |
| The fixed cost consumed per user using DC | |
| Additional consumption of dual-connected users | |
| Rate limit of service | |
| Delay limit of service | |
| Number of cities | |
| Least costly route solution | |
| The cost of traveling from city to city | |
| Used to indicate whether the traveler departs from to | |
| Total cost when passing through all cities |
Table 2.
Simulation parameters.
| Parameters | Values |
|---|---|
| Bandwidth (MBS/SBS) | 4 MHz, 2 MHz |
| Number of UEs | 700 |
| Type of services | 2 (eMBB and URLLC) |
| Service probability | 1:4 (eMBB : URLLC) |
| Transmitting power | 46 dBm, 30 dBm |
| Radius of cells | 200 m, 50 m |
| −104 dBm | |
| Path loss model (MBS/SBS) | |
| Additional energy consumption | 1 |
| QoE: rate (eMBB, URLLC) | 10 ms, 3 ms |
| QoE: latency (eMBB, URLLC) | 100 Mbps, 10 Mbps |
Table 3.
Parameters of LSTM-D3QN.
| Parameters | Values |
|---|---|
| Total number of iteration T | 8000 |
| Learning rate | 0.001 |
| Discount factor | 0.9 |
| Replay memory D | 100,000 |
| Mini-batch | 256 |
| Target network update frequency C | 50 |
| Activation function | Relu |
Publisher’s Note: MDPI stays neutral with regard to jurisdictional claims in published maps and institutional affiliations. |
© 2022 by the authors. Licensee MDPI, Basel, Switzerland. This article is an open access article distributed under the terms and conditions of the Creative Commons Attribution (CC BY) license (https://creativecommons.org/licenses/by/4.0/).
Share and Cite
MDPI and ACS Style
Chen, G.; Mu, X.; Shen, F.; Zeng, Q. Network Slicing Resource Allocation Based on LSTM-D3QN with Dual Connectivity in Heterogeneous Cellular Networks. Appl. Sci. 2022, 12, 9315. https://0-doi-org.brum.beds.ac.uk/10.3390/app12189315
AMA Style
Chen G, Mu X, Shen F, Zeng Q. Network Slicing Resource Allocation Based on LSTM-D3QN with Dual Connectivity in Heterogeneous Cellular Networks. Applied Sciences. 2022; 12(18):9315. https://0-doi-org.brum.beds.ac.uk/10.3390/app12189315
Chicago/Turabian StyleChen, Geng, Xinzheng Mu, Fei Shen, and Qingtian Zeng. 2022. "Network Slicing Resource Allocation Based on LSTM-D3QN with Dual Connectivity in Heterogeneous Cellular Networks" Applied Sciences 12, no. 18: 9315. https://0-doi-org.brum.beds.ac.uk/10.3390/app12189315
Note that from the first issue of 2016, this journal uses article numbers instead of page numbers. See further details here.