
Performance of Textile Mask Materials in Varied Humidity: Filtration Efficiency, Breathability, and Quality Factor
 , and
, and 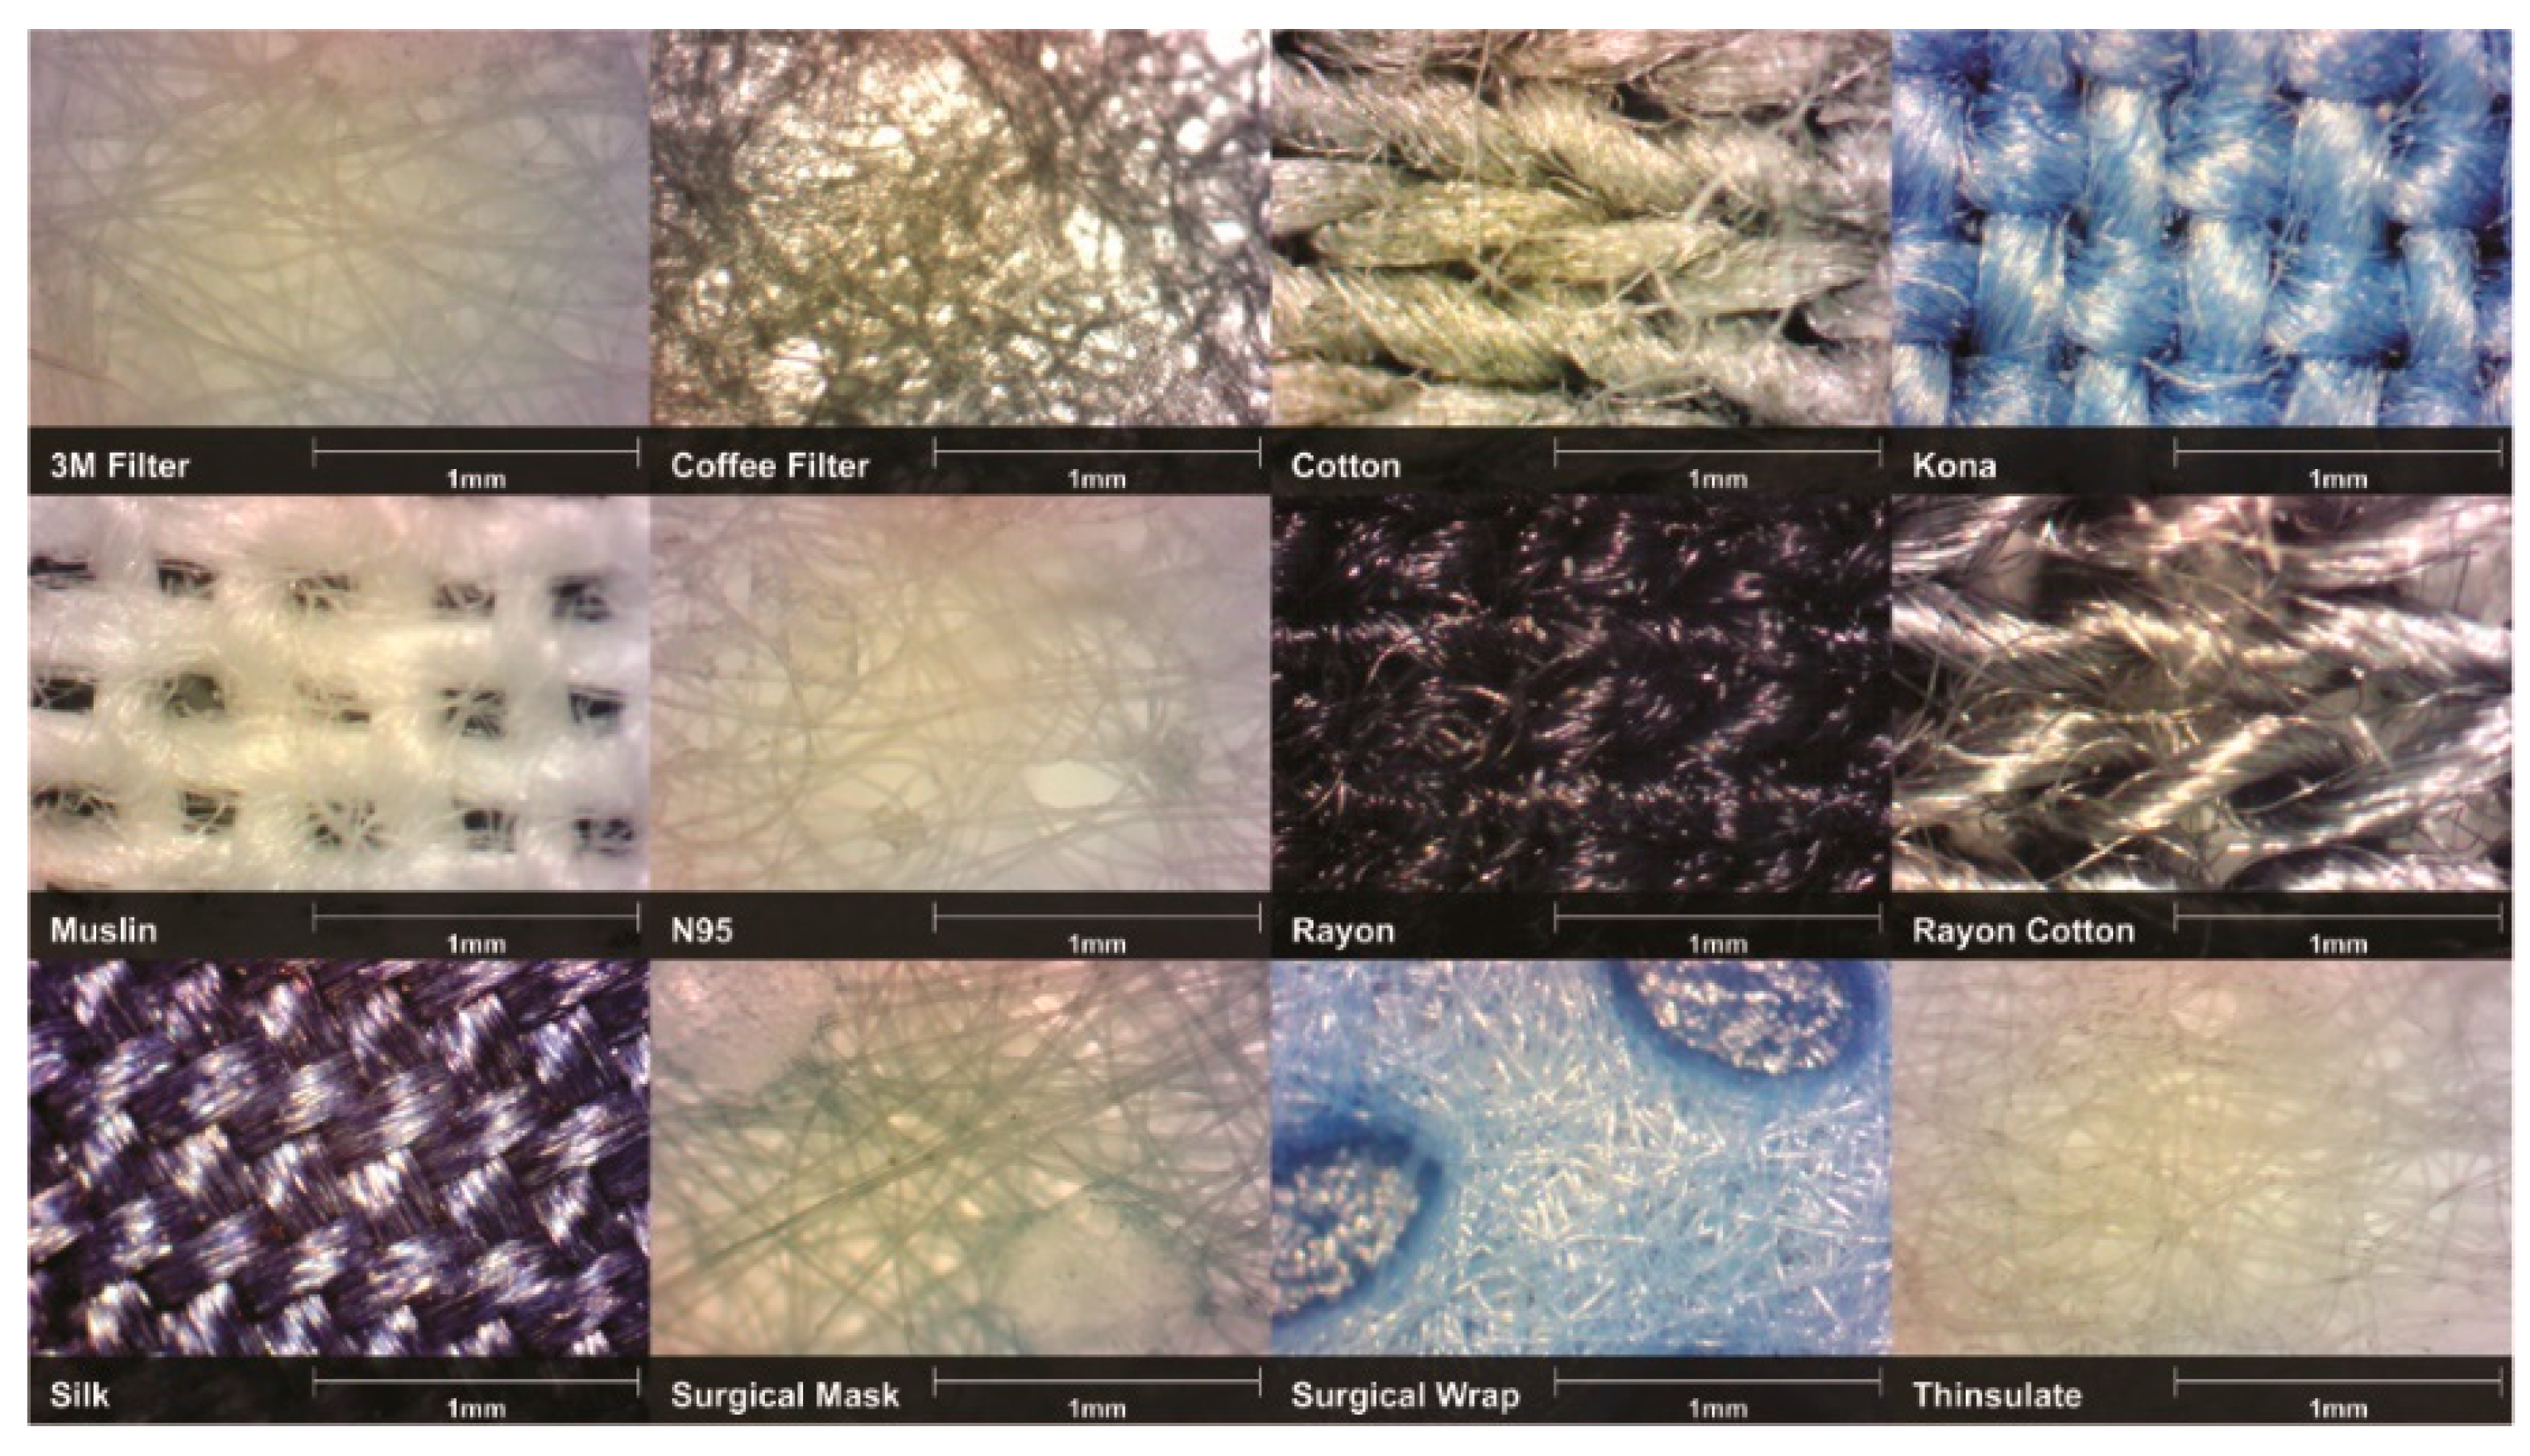
Abstract
:1. Introduction
2. Materials and Methods
2.1. Materials
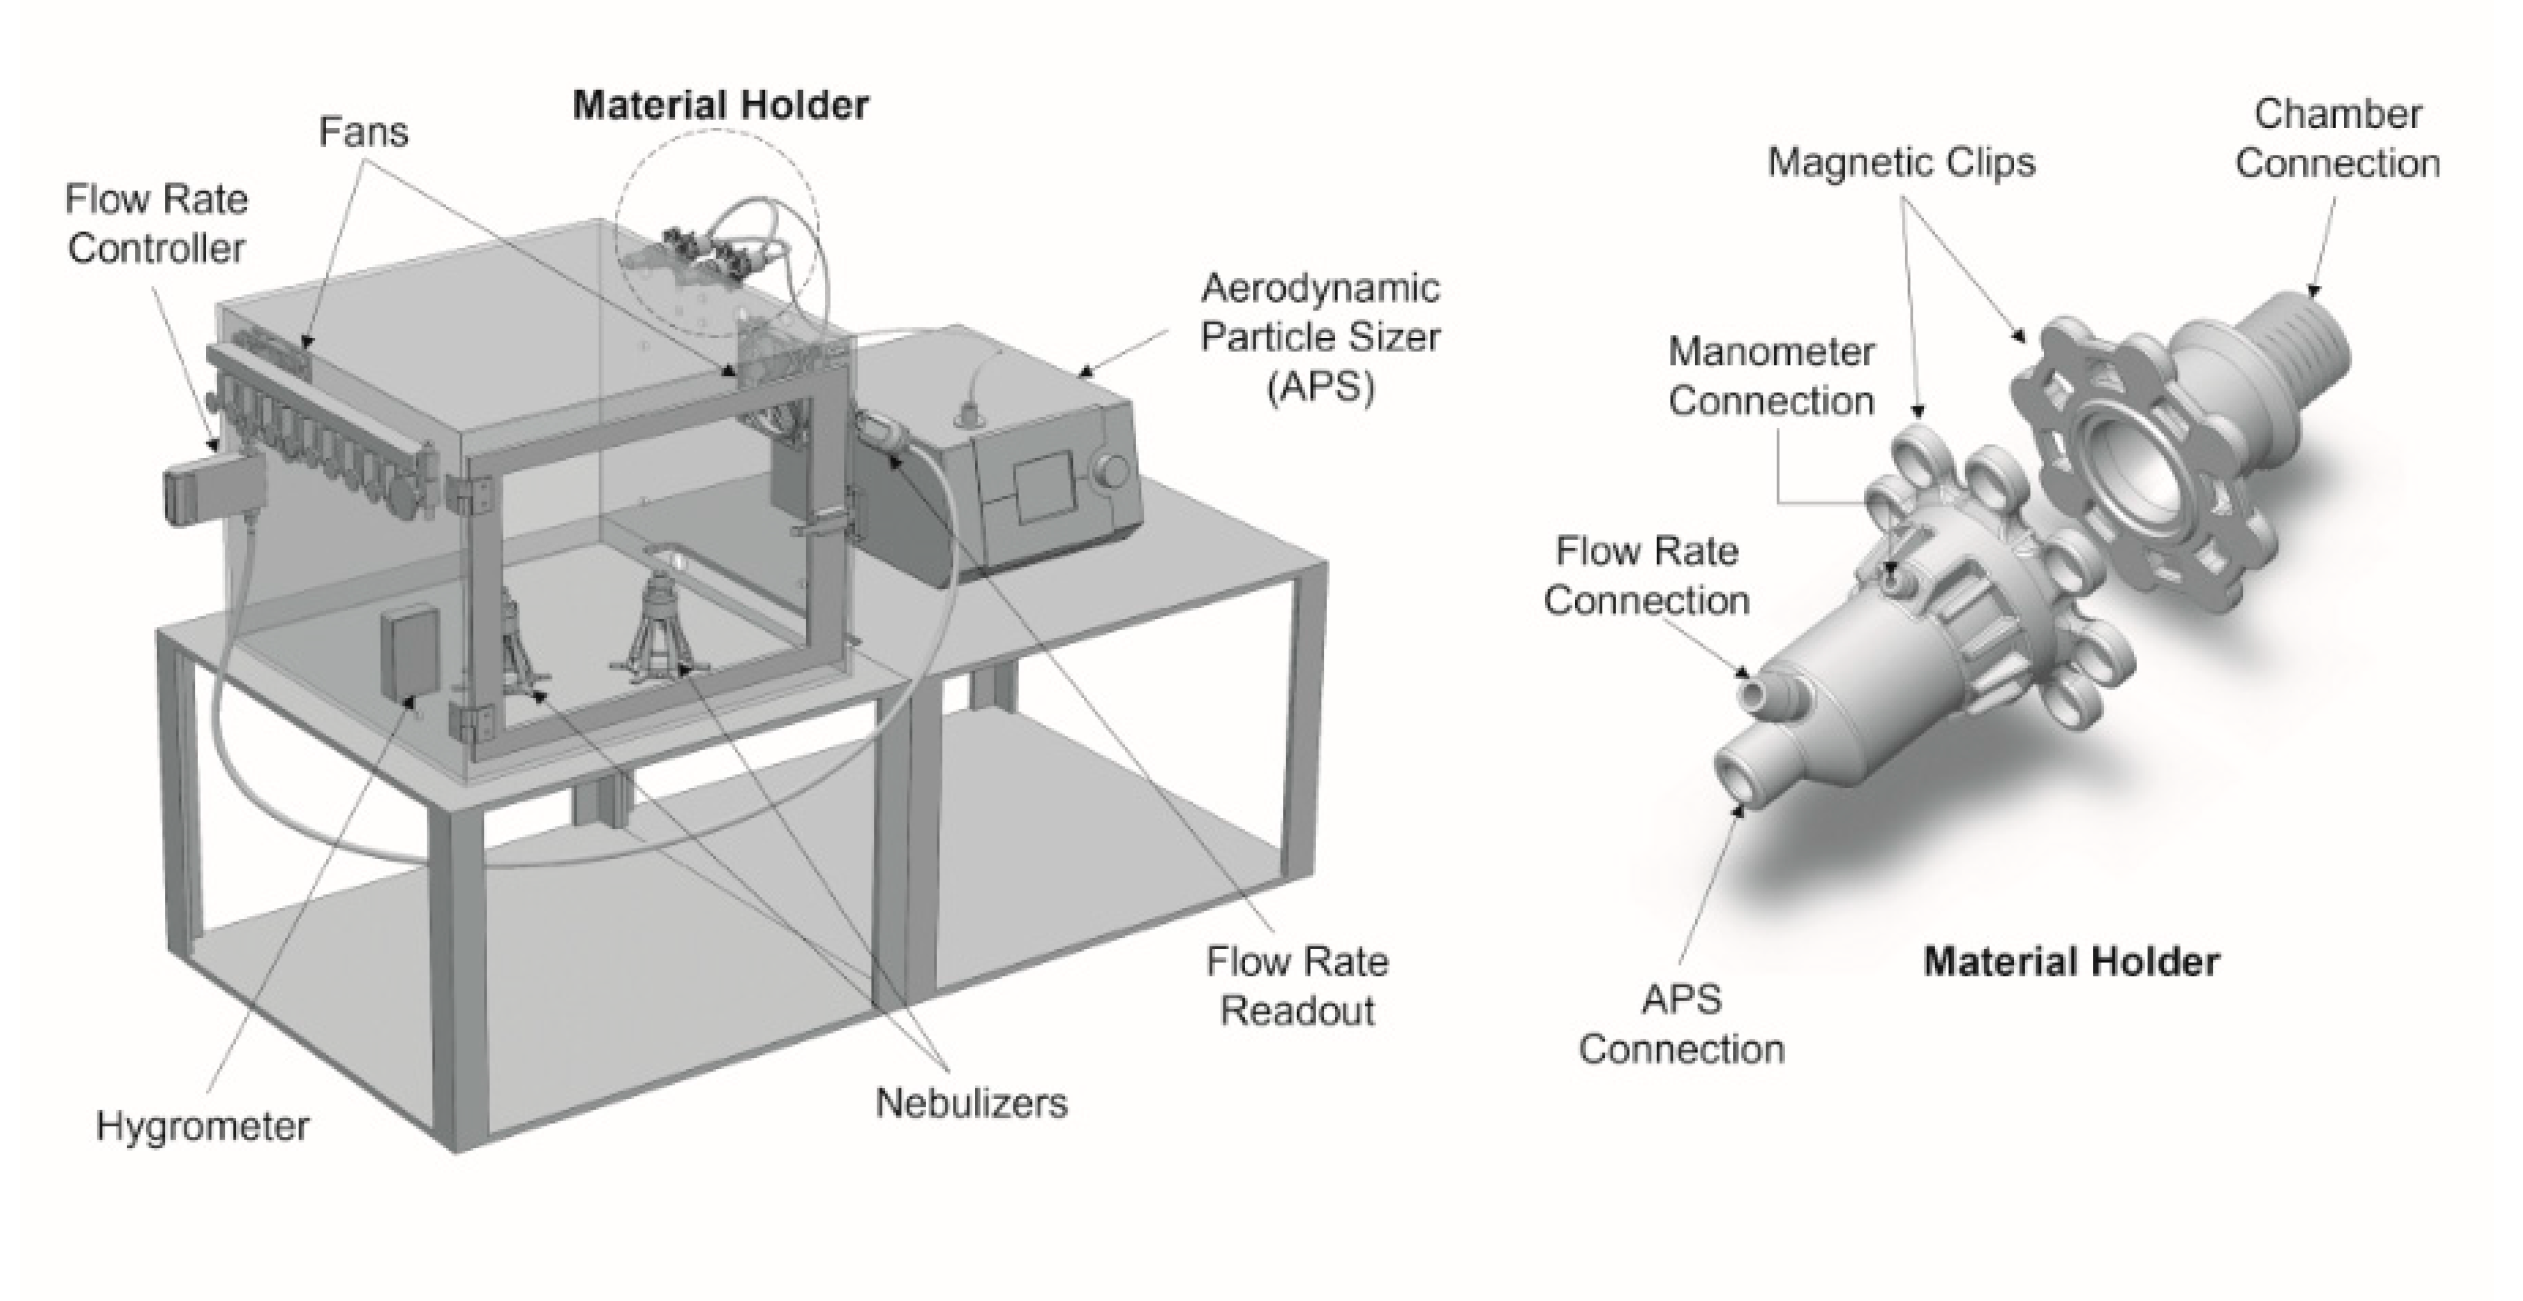
2.2. Aerosol Chamber Setup
2.3. Pressure Drop and Filtration Efficiency Analysis
3. Results and Discussion
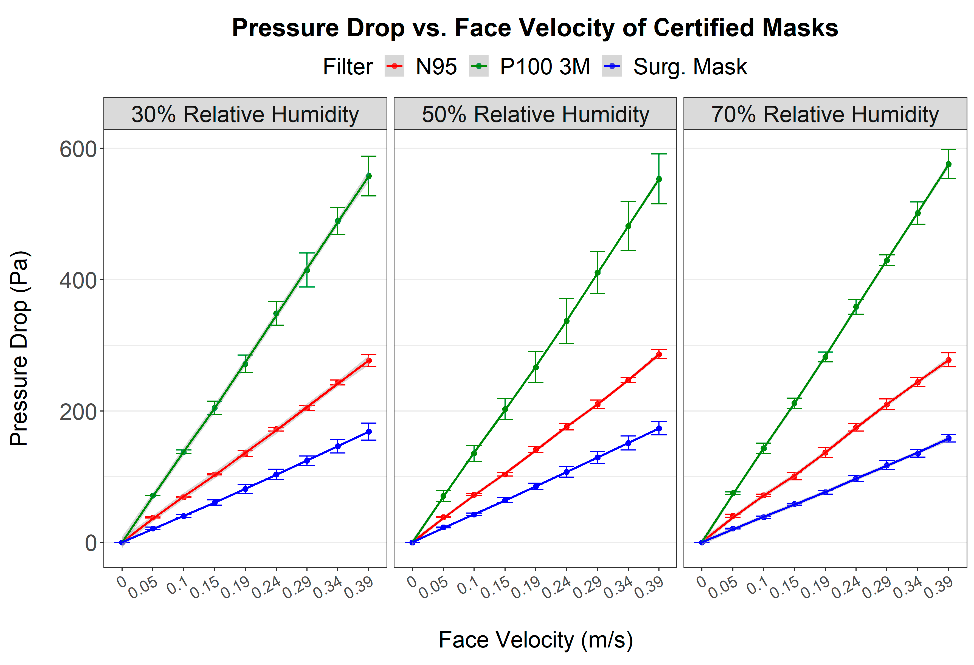
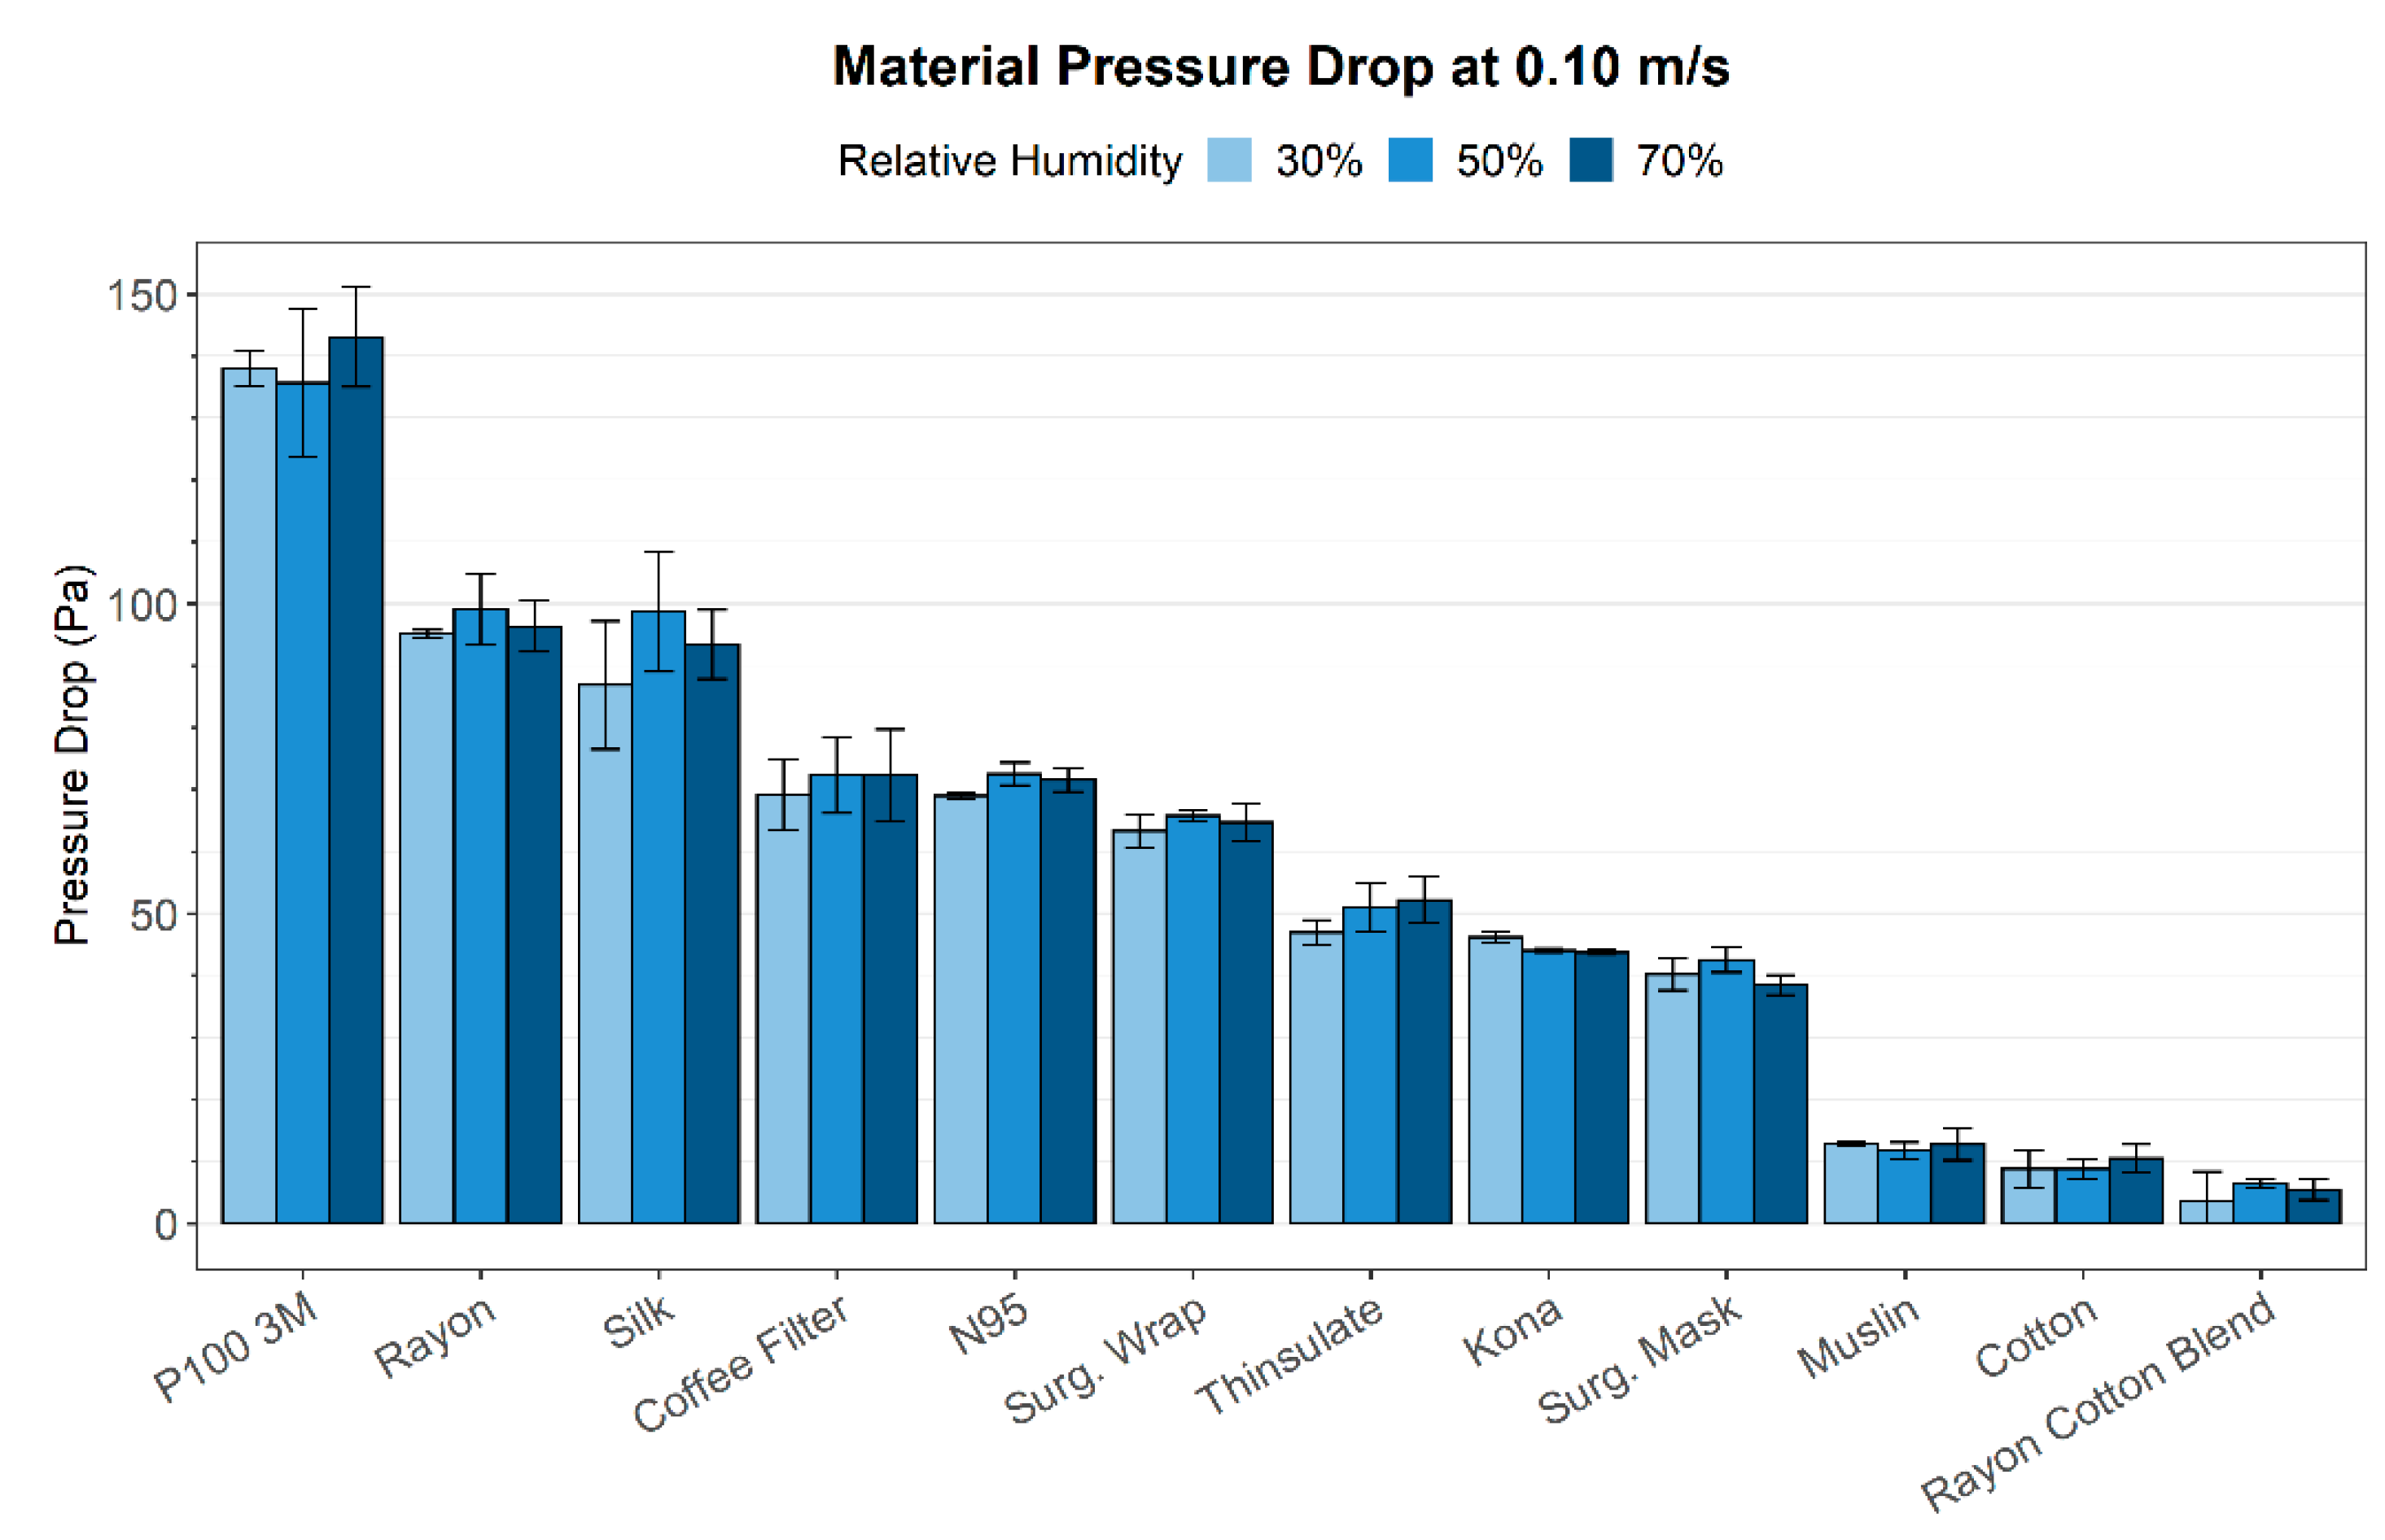
3.1. Pressure Drop
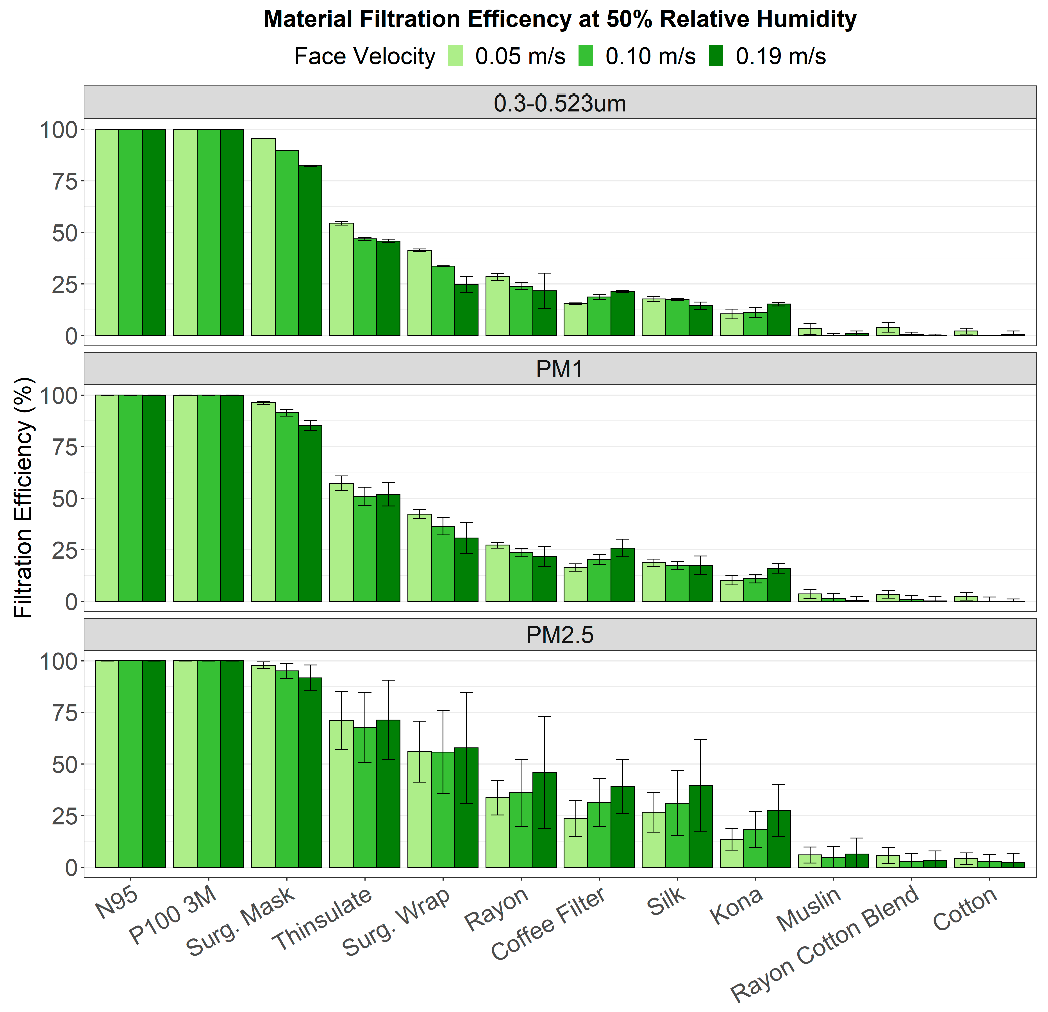
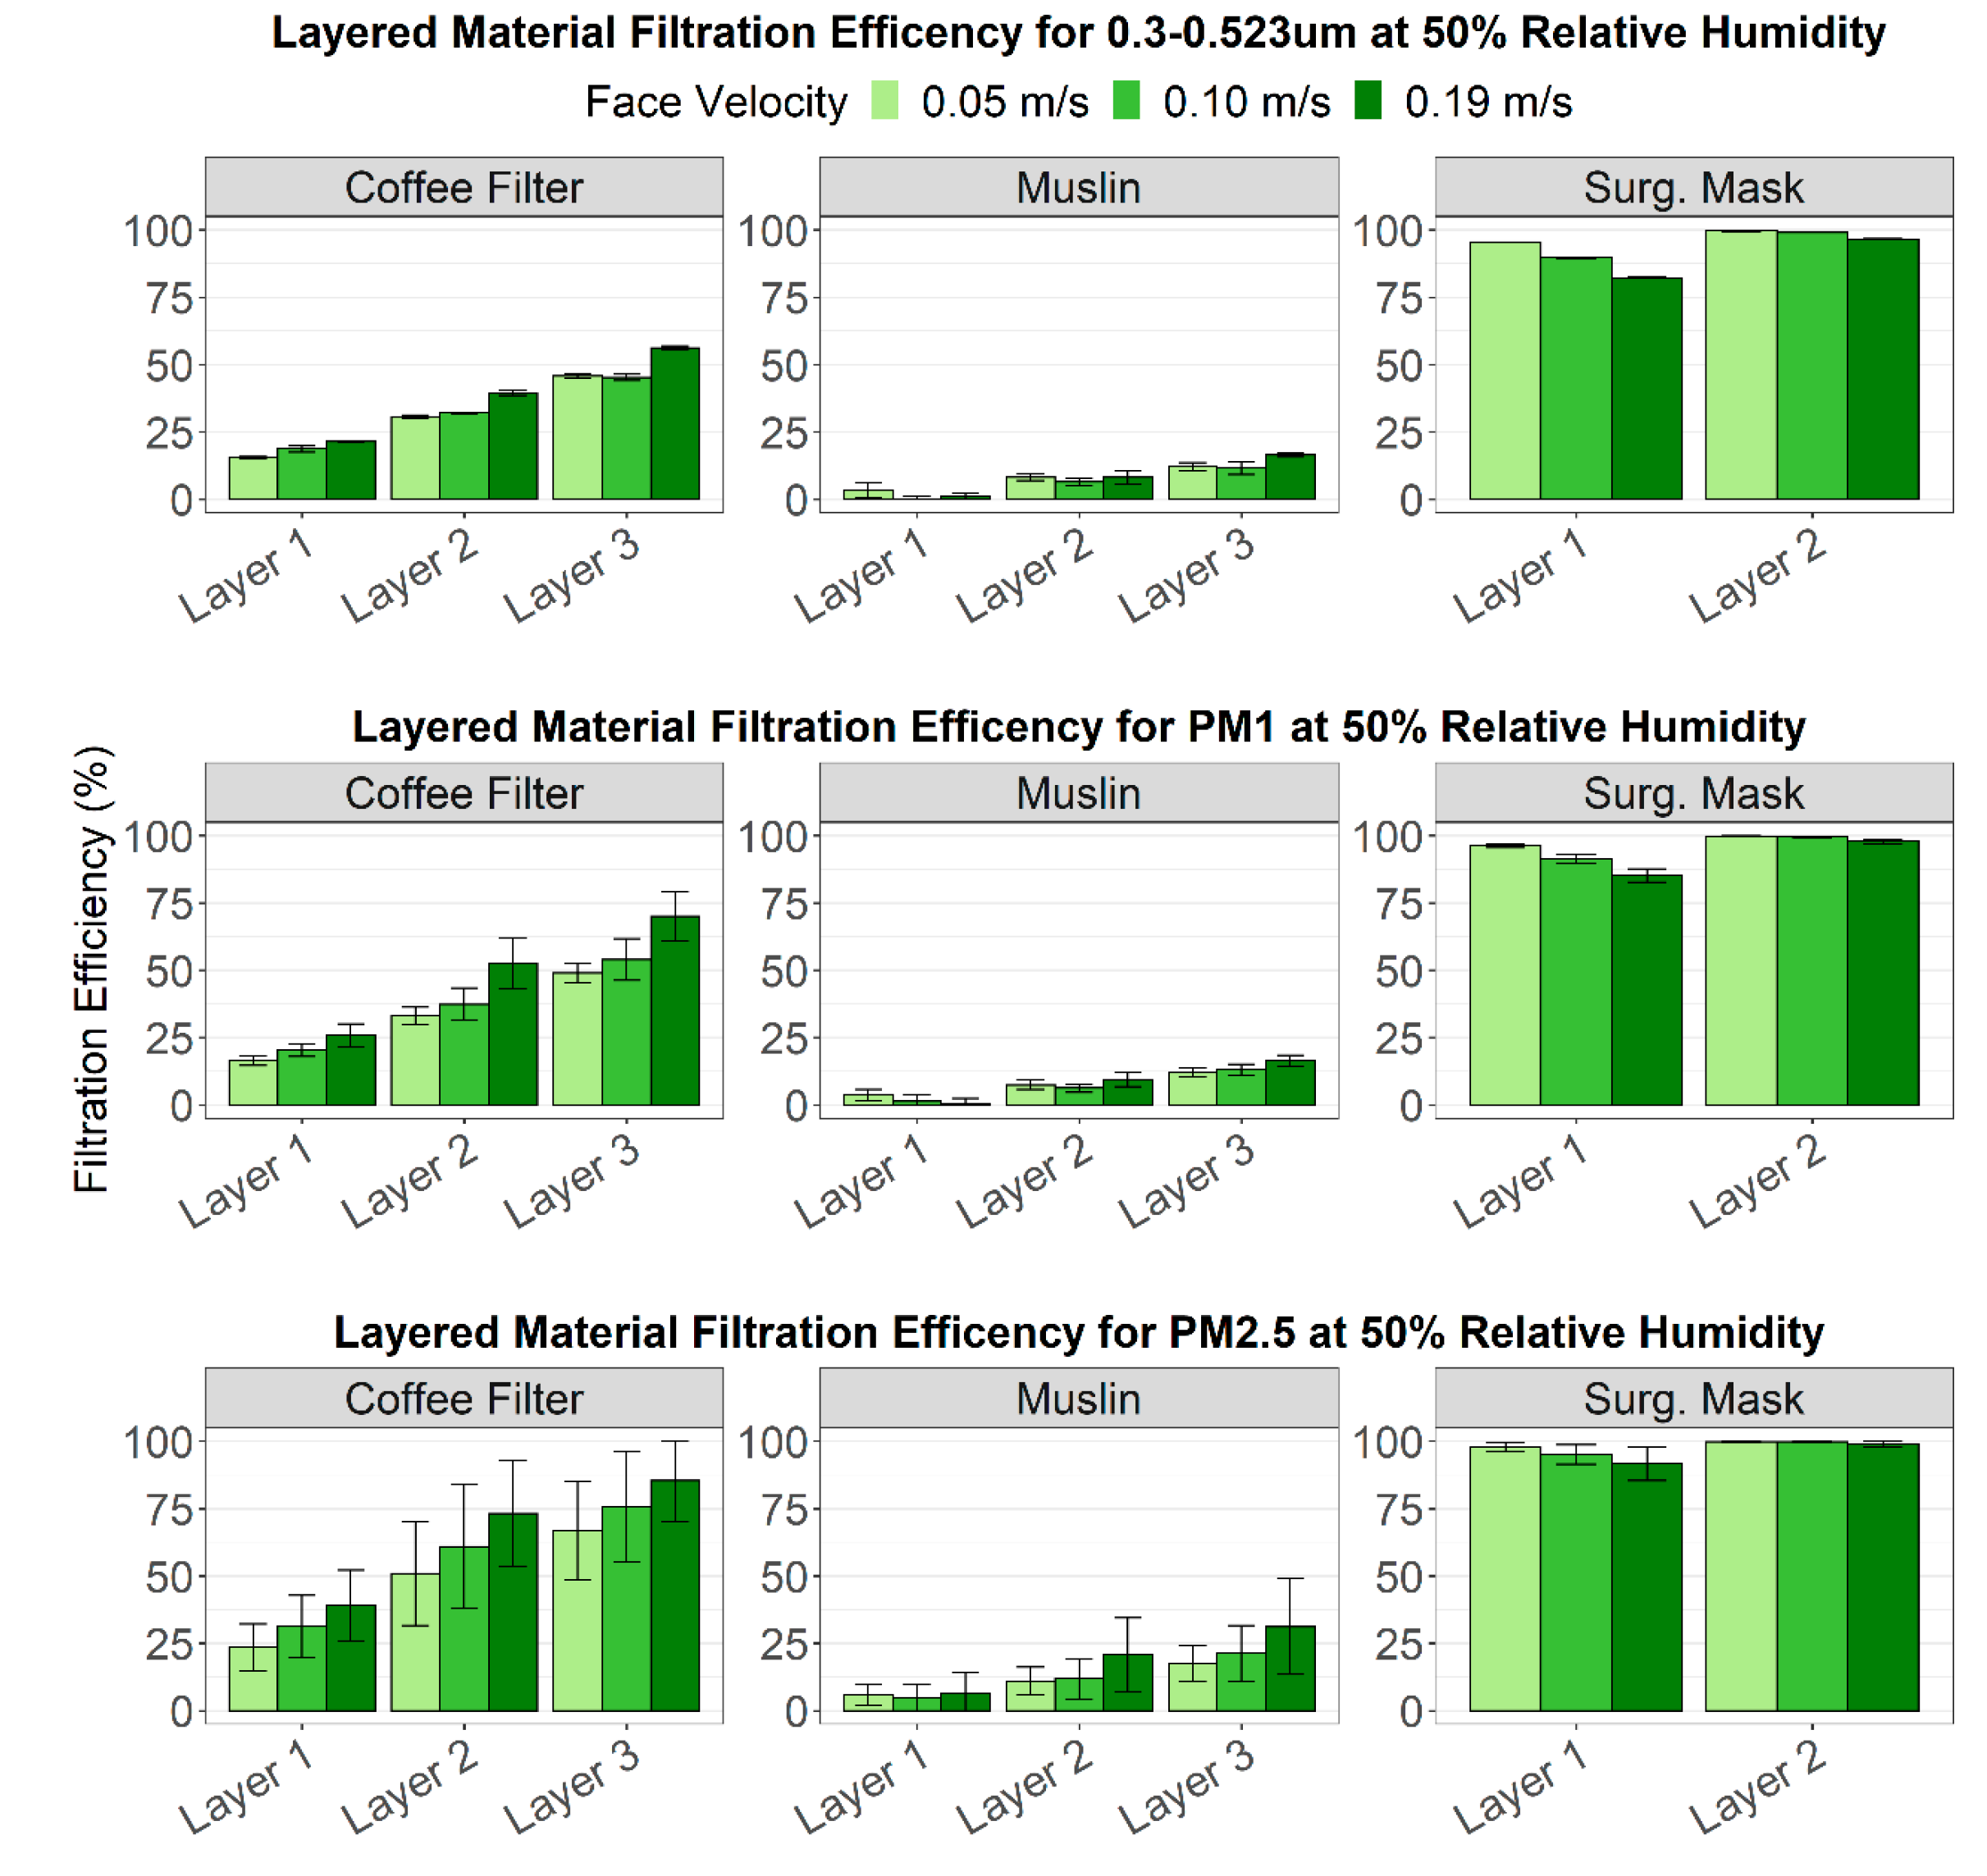
3.2. Filtration Efficiency
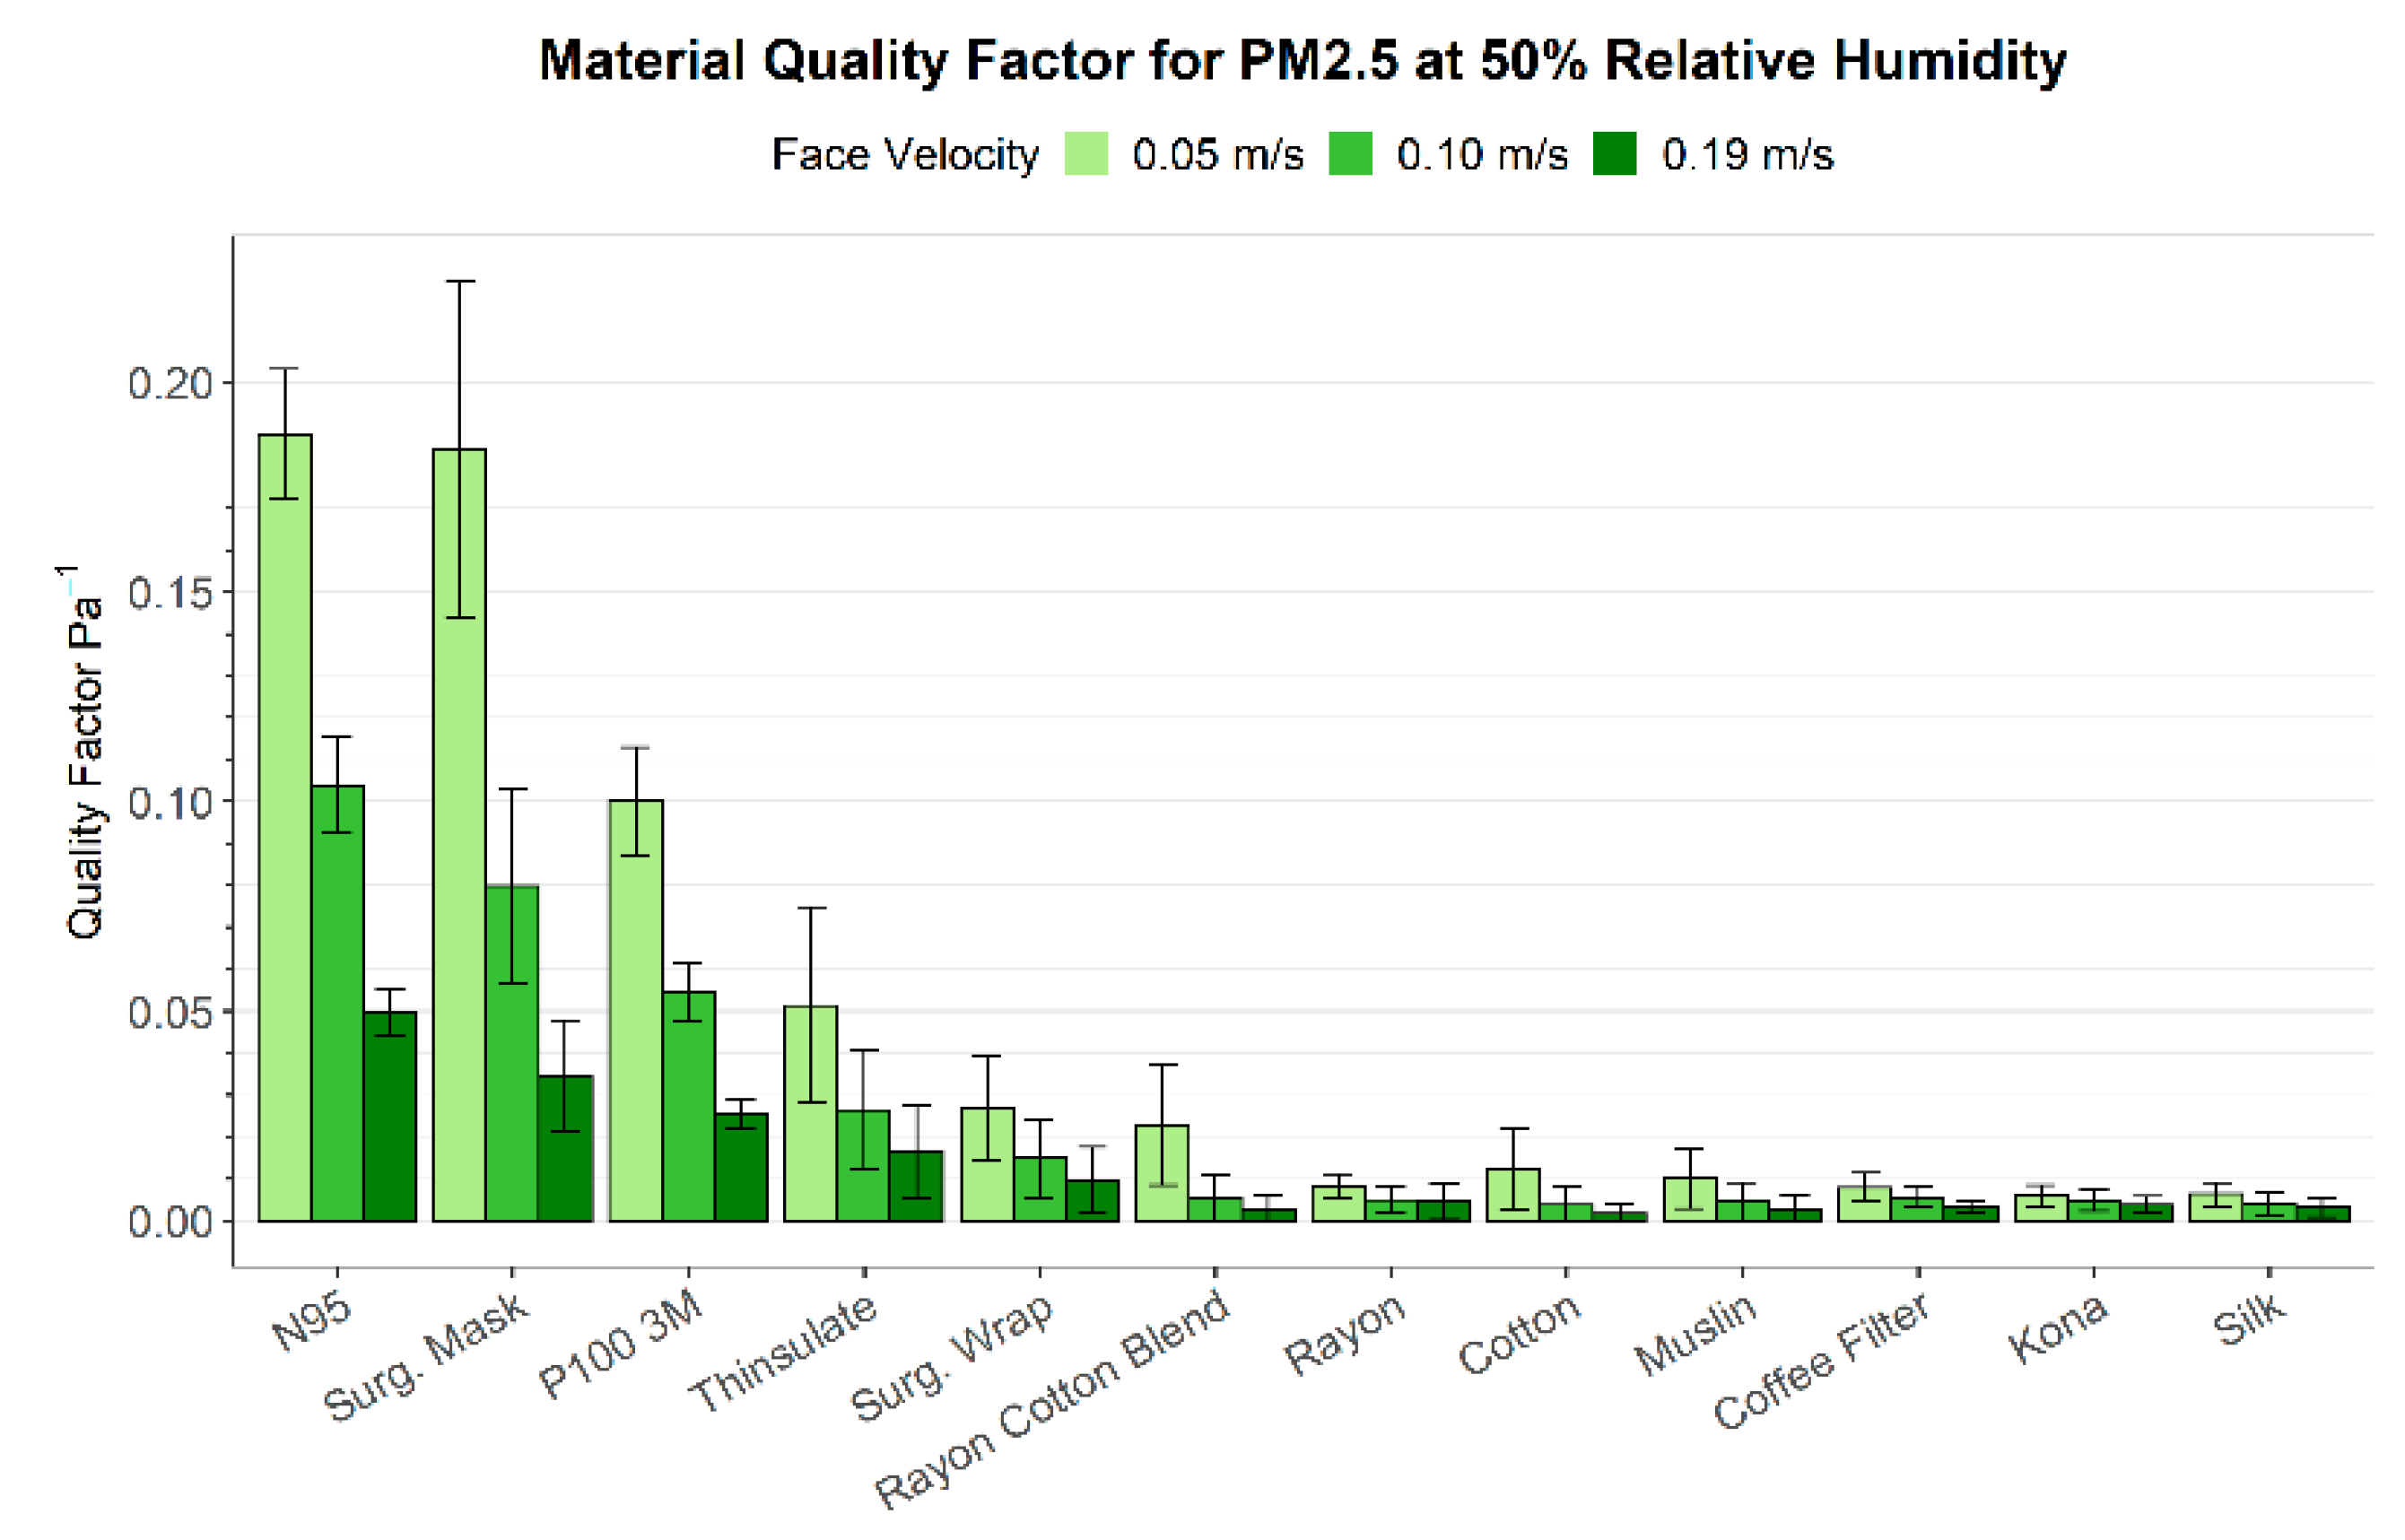
3.3. Quality Factor
4. Conclusions
Supplementary Materials
Author Contributions
Funding
Conflicts of Interest
References
- Monto, A.S. Epidemiology of viral respiratory infections. Am. J. Med. 2002, 112, 4–12. [Google Scholar] [CrossRef]
- Kutter, J.S.; Spronken, M.I.; Fraaij, P.L.; Fouchier, R.A.M.; Herfst, S. Transmission routes of respiratory viruses among humans. Curr. Opin. Virol. 2018, 28, 142–151. [Google Scholar] [CrossRef]
- Yu, I.T.; Li, Y.; Wong, T.W.; Tam, W.; Chan, A.T.; Lee, J.H.; Leung, D.Y.C.; Ho, T. Evidence of Airborne Transmission of the Severe Acute Respiratory Syndrome Virus. N. Engl. J. Med. 2004, 350, 1731–1739. [Google Scholar] [CrossRef]
- Miller, S.L.; Nazaroff, W.W.; Jimenez, J.L.; Boerstra, A.; Buonanno, G.; Dancer, S.J.; Kurnitski, J.; Marr, L.C.; Morawska, L.; Noakes, C. Transmission of SARS-CoV-2 by inhalation of respiratory aerosol in the Skagit Valley Chorale superspreading event. Indoor Air 2021, 31, 314–323. [Google Scholar] [CrossRef]
- Li, Y.; Qian, H.; Hang, J.; Chen, X.; Cheng, P.; Ling, H.; Wang, S.; Liang, P.; Li, J.; Kang, M.; et al. Probable airborne transmission of SARS-CoV-2 in a poorly ventilated restaurant. Build. Environ. 2021, 196, 107788. [Google Scholar] [CrossRef]
- Klejnowski, K.; Krasa, A.; Rogula-Kozłowska, W.; Błaszczak, B. Number Size Distribution of Ambient Particles in a Typical Urban Site, The First Polish Assessment Based on Long-Term (9 Months) Measurements. Sci. World J. 2013, 2013, 539568. [Google Scholar] [CrossRef]
- Morawska, L.; Milton, D.K. It Is Time to Address Airborne Transmission of Coronavirus Disease 2019 (COVID-19). Clin. Infect. Dis. 2020, 71, 2311–2313. [Google Scholar] [CrossRef]
- Lin, K.; Marr, L.C. Humidity-Dependent Decay of Viruses, but Not Bacteria, in Aerosols and Droplets Follows Disinfection Kinetics. Environ. Sci. Technol. 2020, 54, 1024–1032. [Google Scholar] [CrossRef]
- Milton, D.K.; Fabian, M.P.; Cowling, B.J.; Grantham, M.L.; McDevitt, J.J. Influenza Virus Aerosols in Human Exhaled Breath, Particle Size, Culturability, and Effect of Surgical Masks. PLOS Pathog. 2013, 9, e1003205. [Google Scholar] [CrossRef]
- Ehsanifar, M. Airborne aerosols particles and COVID-19 transition. Environ. Res. 2021, 200, 111752. [Google Scholar] [CrossRef]
- Hinds, W.C. Aerosol Technology: Properties, Behavior, and Measurement of Airborne Particles; Wiley: Hoboken, NJ, USA, 1999. [Google Scholar]
- Lindsley, W. Filter Pore Size and Aerosol Sample Collection. In NIOSH Manual of Analytical Methods; NIOSH: Washington, DC, USA, 2016; FP1-14. [Google Scholar]
- Lee, K.-P.; Yip, J.; Kan, C.-W.; Chiou, J.-C.; Yung, K.-F. Reusable Face Masks as Alternative for Disposable Medical Masks: Factors that Affect their Wear-Comfort. Int. J. Environ. Res. Public Health 2020, 17, 6623. [Google Scholar] [CrossRef] [PubMed]
- Kwong, L.H.; Wilson, R.; Kumar, S.; Crider, Y.S.; Reyes Sanchez, Y.; Rempel, D.; Pillarisetti, A. Review of the Breathability and Filtration Efficiency of Common Household Materials for Face Masks. ACS Nano 2021, 15, 5904–5924. [Google Scholar] [CrossRef] [PubMed]
- Jones, R.M.; Rempel, D. Standards for Surgical Respirators and Masks: Relevance for Protecting Healthcare Workers and the Public during Pandemics. Ann. Work. Expo. Health 2021, 65, 495–504. [Google Scholar] [CrossRef]
- Ranney, M.L.; Griffeth, V.; Jha, A.K. Critical Supply Shortages—The Need for Ventilators and Personal Protective Equipment during the COVID-19 Pandemic. N. Engl. J. Med. 2020, 382, e41. [Google Scholar] [CrossRef]
- Wu, H.-L.; Huang, J.; Zhang, C.J.P.; He, Z.; Ming, W.-K. Facemask shortage and the novel coronavirus disease (COVID-19) outbreak: Reflections on public health measures. EClinicalMedicine 2020, 21, 100329. [Google Scholar] [CrossRef] [PubMed]
- Kim, H. Lesson Learned from the Power of Open Data: Resolving the Mask Shortage Problem Caused by COVID-19 in South Korea. Sustainability 2021, 13, 278. [Google Scholar] [CrossRef]
- Kirubarajan, A.; Khan, S.; Got, T.; Yau, M.; Bryan, J.M.; Friedman, S.M. Mask shortage during epidemics and pandemics: A scoping review of interventions to overcome limited supply. BMJ Open 2020, 10, e040547. [Google Scholar] [CrossRef]
- Arumuru, V.; Samantaray, S.S.; Pasa, J. Double masking protection vs. comfort—A quantitative assessment. Phys. Fluids (1994) 2021, 33, 077120. [Google Scholar] [CrossRef]
- Konda, A.; Prakash, A.; Moss, G.A.; Schmoldt, M.; Grant, G.D.; Guha, S. Aerosol Filtration Efficiency of Common Fabrics Used in Respiratory Cloth Masks. ACS Nano 2020, 14, 6339–6347. [Google Scholar] [CrossRef]
- Lustig, S.R.; Biswakarma, J.J.; Rana, D.; Tilford, S.H.; Hu, W.; Su, M.; Rosenblatt, M.S. Effectiveness of Common Fabrics to Block Aqueous Aerosols of Virus-like Nanoparticles. ACS Nano 2020, 14, 7651–7658. [Google Scholar] [CrossRef]
- Radney, J.G.; Weaver, J.L.; Vicenzi, E.P.; Staymates, M.E.; Zangmeister, C.D. Filter Inserts Impact Cloth Mask Performance against Nano- to Micro-Sized Particles. ACS Nano 2021, 15, 12860–12868. [Google Scholar] [CrossRef] [PubMed]
- Zangmeister, C.D.; Radney, J.G.; Vicenzi, E.P.; Weaver, J.L. Filtration Efficiencies of Nanoscale Aerosol by Cloth Mask Materials Used to Slow the Spread of SARS-CoV-2. ACS Nano 2020, 14, 9188–9200. [Google Scholar] [CrossRef] [PubMed]
- Pei, C.; Ou, Q.; Kim, S.C.; Chen, S.-C.; Pui, D.Y.H. Alternative Face Masks Made of Common Materials for General Public: Fractional Filtration Efficiency and Breathability Perspective. Aerosol Air Qual. Res. 2020, 20, 2581–2591. [Google Scholar] [CrossRef]
- Jung, H.; Kim, J.; Lee, S.; Lee, J.; Kim, J.; Tsai, P.; Yoon, C. Comparison of Filtration Efficiency and Pressure Drop in Anti-Yellow Sand Masks, Quarantine Masks, Medical Masks, General Masks, and Handkerchiefs. Aerosol Air Qual. Res. 2014, 14, 991–1002. [Google Scholar] [CrossRef]
- Drewnick, F.; Pikmann, J.; Fachinger, F.; Moormann, L.; Sprang, F.; Borrmann, S. Aerosol filtration efficiency of household materials for homemade face masks: Influence of material properties, particle size, particle electrical charge, face velocity, and leaks. Aerosol Sci. Technol. 2021, 55, 63–79. [Google Scholar] [CrossRef]
- Rengasamy, S.; Eimer, B.; Shaffer, R.E. Simple Respiratory Protection—Evaluation of the Filtration Performance of Cloth Masks and Common Fabric Materials against 20–1000 nm Size Particles. Ann. Occup. Hyg. 2010, 54, 789–798. [Google Scholar]
- Hao, W.; Parasch, A.; Williams, S.; Li, J.; Ma, H.; Burken, J.; Wang, Y. Filtration performances of non-medical materials as candidates for manufacturing facemasks and respirators. Int. J. Hyg. Environ. Health 2020, 229, 113582. [Google Scholar] [CrossRef]
- Teesing, G.R.; van Straten, B.; de Man, P.; Horeman-Franse, T. Is there an adequate alternative to commercially manufactured face masks? A comparison of various materials and forms. J. Hosp. Infect. 2020, 106, 246–253. [Google Scholar] [CrossRef]
- Hao, W.; Xu, G.; Wang, Y. Factors influencing the filtration performance of homemade face masks. J. Occup. Environ. Hyg. 2021, 18, 128–138. [Google Scholar] [CrossRef]
- Wang, D.; You, Y.; Zhou, X.; Zong, Z.; Huang, H.; Zhang, H.; Yong, X.; Cheng, Y.; Yang, L.; Du, L.; et al. Selection of homemade mask materials for preventing transmission of COVID-19, A laboratory study. PLoS ONE 2020, 15, e0240285. [Google Scholar] [CrossRef]
- Davies, A.; Thompson, K.-A.; Giri, K.; Kafatos, G.; Walker, J.; Bennett, A. Testing the Efficacy of Homemade Masks: Would They Protect in an Influenza Pandemic? Disaster Med. Public Health Prep. 2013, 7, 413–418. [Google Scholar] [CrossRef] [PubMed]
- Ma, Q.-X.; Shan, H.; Zhang, H.-L.; Li, G.-M.; Yang, R.-M.; Chen, J.-M. Potential utilities of mask-wearing and instant hand hygiene for fighting SARS-CoV-2. J. Med. Virol. 2020, 92, 1567–1571. [Google Scholar] [CrossRef] [PubMed]
- Zangmeister, C.D.; Radney, J.G.; Staymates, M.E.; Vicenzi, E.P.; Weaver, J.L. Hydration of Hydrophilic Cloth Face Masks Enhances the Filtration of Nanoparticles. ACS Appl. Nano Mater. 2021, 4, 2694–2701. [Google Scholar] [CrossRef]
- Sharma, S.K.; Mishra, M.; Mudgal, S.K. Efficacy of cloth face mask in prevention of novel coronavirus infection transmission: A systematic review and meta-analysis. J. Educ. Health Promot. 2020, 9, 192. [Google Scholar] [CrossRef]
- Neupane, B.B.; Mainali, S.; Sharma, A.; Giri, B. Optical microscopic study of surface morphology and filtering efficiency of face masks. PeerJ 2019, 7, e7142. [Google Scholar] [CrossRef] [PubMed]
- Reutman, S.R.; Reponen, T.; Yermakov, M.A.; Grinshpun, S. Homemade facemasks: Particle filtration, breathability, fit, and other performance characteristics. J. Occup. Environ. Hyg. 2021, 18, 334–344. [Google Scholar] [CrossRef] [PubMed]
- Crilley, L.R.; Angelucci, A.A.; Malile, B.; Young, C.J.; VandenBoer, T.C.; Chen, J.I. Non-woven materials for cloth-based face masks inserts: Relationship between material properties and sub-micron aerosol filtration. Environ. Sci. Nano 2021, 8, 1603–1613. [Google Scholar] [CrossRef]
- Hill, W.C.; Hull, M.S.; MacCuspie, R.I. Testing of commercial masks and respirators and cotton mask insert materials using SARS-CoV-2 virion-sized particulates: Comparison of ideal aerosol filtration efficiency versus fitted filtration efficiency. Nano Lett. 2020, 20, 7642–7647. [Google Scholar] [CrossRef]
- Bhattacharjee, S.; Bahl, P.; De Silva, C.; Doolan, C.; Chughtai, A.A.; Heslop, D.; MacIntyre, C.R. Experimental Evidence for the Optimal Design of a High-Performing Cloth Mask. ACS Biomater. Sci. Eng. 2021, 7, 2791–2802. [Google Scholar] [CrossRef]
- Asadi, S.; Cappa, C.D.; Barreda, S.; Wexler, A.S.; Bouvier, N.M.; Ristenpart, W.D. Efficacy of masks and face coverings in controlling outward aerosol particle emission from expiratory activities. Sci. Rep. 2020, 10, 15665. [Google Scholar] [CrossRef]
- Kähler, C.J.; Hain, R. Fundamental protective mechanisms of face masks against droplet infections. J. Aerosol Sci. 2020, 148, 105617. [Google Scholar] [CrossRef] [PubMed]
- Zhao, M.; Liao, L.; Xiao, W.; Yu, X.; Wang, H.; Wang, Q.; Lin, Y.L.; Price, A.; Chu, L.; Cui, Y.; et al. Household Materials Selection for Homemade Cloth Face Coverings and Their Filtration Efficiency Enhancement with Triboelectric Charging. Nano Lett. 2020, 20, 5544–5552. [Google Scholar] [CrossRef] [PubMed]
- Rule, A.; Ramachandran, G.; Koehler, K. Comment on Aerosol Filtration Efficiency of Common Fabrics Used in Respiratory Cloth Masks: Questioning Their Findings. ACS Nano 2020, 14, 10756–10757. [Google Scholar] [CrossRef]
- Konda, A.; Prakash, A.; Moss, G.; Schmoldt, M.; Grant, G.; Guha, S. Correction to Aerosol Filtration Efficiency of Common Fabrics Used in Respiratory Cloth Masks. ACS Nano 2020, 14, 10742–10743. [Google Scholar] [CrossRef] [PubMed]
- Carr, I.A.; Hariharan, P.; Guha, S. Letter to the Editor Regarding Aerosol Filtration Efficiency of Common Fabrics Used in Respiratory Cloth Masks. ACS Nano 2020, 14, 10754–10755. [Google Scholar] [CrossRef] [PubMed]
- Alderman, S.L.; Parsons, M.S.; Hogancamp, K.U.; Waggoner, C.A. Evaluation of the effect of media velocity on filter efficiency and most penetrating particle size of nuclear grade high-efficiency particulate air filters. J. Occup. Environ. Hyg. 2008, 5, 713–720. [Google Scholar] [CrossRef] [PubMed]
- Novosselov, I.V.; Ariessohn, P.C. Rectangular slit atmospheric pressure aerodynamic lens aerosol concentrator. Aerosol Sci. Technol. 2014, 48, 163–172. [Google Scholar] [CrossRef]
- Mahamuni, G.; Ockerman, B.; Novosselov, I. Electrostatic Capillary Collector for In-Situ Spectroscopic Analysis of Aerosols. Aerosol Sci. Technol. 2019, 53, 688–700. [Google Scholar] [CrossRef]
- Vaddi, R.S.; Guan, Y.; Novosselov, I. Behavior of ultrafine particles in electro-hydrodynamic flow induced by corona discharge. J. Aerosol Sci. 2020, 148, 105587. [Google Scholar] [CrossRef]
- Keady, P.B. Getting Data you Need with Particle Measurements: TSI Incorporated; TSI Inc.: Shoreview, MN, USA, 2012; Volume 8. [Google Scholar]
- Chien, C.-H.; Theodore, A.; Wu, C.-Y.; Hsu, Y.-M.; Birky, B. Upon correlating diameters measured by optical particle counters and aerodynamic particle sizers. J. Aerosol Sci. 2016, 101, 77–85. [Google Scholar] [CrossRef]
- Njalsson, T.; Novosselov, I. Design and optimization of a compact low-cost optical particle sizer. J. Aerosol Sci. 2018, 119, 1–12. [Google Scholar] [CrossRef] [PubMed]
- Huang, C.-H.; He, J.; Austin, E.; Seto, E.; Novosselov, I. Assessing the value of complex refractive index and particle density for calibration of low-cost particle matter sensor for size-resolved particle count and PM2. 5 measurements. PLoS ONE 2021, 16, e0259745. [Google Scholar] [CrossRef] [PubMed]
- Austin, E.; Novosselov, I.; Seto, E.; Yost, M.G. Laboratory Evaluation of the Shinyei PPD42NS Low-Cost Particulate Matter Sensor. PLoS ONE 2015, 10, e0137789. [Google Scholar]
- Leith, D.; L’Orange, C.; Volckens, J. Quantitative protection factors for common masks and face coverings. Environ. Sci. Technol. 2021, 55, 3136–3143. [Google Scholar] [CrossRef] [PubMed]
- Stan, A.; Steiner, S.; Majeed, S.; Weber, S.S.; Gosh, S.; Semren, T.Ž.; Guy, P.A.; Lebrun, S.; Steinhauser, J.; Tardy, Y.; et al. Aerosol filtration testing of fabrics for development of reusable face masks. Aerosol Air Qual. Res. 2021, 21, 210052. [Google Scholar] [CrossRef]
- Duncan, S.; Bodurtha, P.; Naqvi, S. The protective performance of reusable cloth face masks, disposable procedure masks, KN95 masks and N95 respirators: Filtration and total inward leakage. PLoS ONE 2021, 16, e0258191. [Google Scholar] [CrossRef]
- Pan, J.; Harb, C.; Leng, W.; Marr, L.C. Inward and outward effectiveness of cloth masks, a surgical mask, and a face shield. Aerosol Sci. Technol. 2021, 55, 718–733. [Google Scholar] [CrossRef]
- Tong, Y.; Pan, J.; Kucukdeger, E.; Johnson, A.L.; Marr, L.C.; Johnson, B.N. 3D Printed Mask Frames Improve the Inward Protection Efficiency of a Cloth Mask. ACS ES T Eng. 2021, 1, 1000–1008. [Google Scholar] [CrossRef]
- Cappa, C.D.; San Francisco Opera Costume Department; Ristenpart, W.D.; Barreda, S.; Bouvier, N.M.; Levintal, E.; Roman, S.A.; Wexler, A.S. A highly efficient cloth facemask design. Aerosol Sci. Technol. 2021, 56, 12–28. [Google Scholar] [CrossRef]
- Whyte, H.E.; Montigaud, Y.; Audoux, E.; Verhoeven, P.; Prier, A.; Leclerc, L.; Sarry, G.; Laurent, C.; Le Coq, L.; Pourchez, J.; et al. Comparison of bacterial filtration efficiency vs. particle filtration efficiency to assess the performance of non-medical face masks. Sci. Rep. 2022, 12, 1188. [Google Scholar] [CrossRef]
- Zhang, J.; Dichiara, A.B.; Novosselov, I.; Gao, D.; Chung, J.-H. Polyacrylic acid coated carbon nanotube–paper composites for humidity and moisture sensing. J. Mater. Chem. C 2019, 7, 5374–5380. [Google Scholar] [CrossRef]
- Gibson, P.; Rivin, D.; Kendrick, C.; Schreuder-Gibson, H. Humidity-Dependent Air Permeability of Textile Materials1. Text. Res. J. 1999, 69, 311–317. [Google Scholar] [CrossRef]
- He, J.Y.; Novosselov, I.V. Design and evaluation of an aerodynamic focusing micro-well aerosol collector. Aerosol Sci. Technol. 2017, 51, 1016–1026. [Google Scholar] [CrossRef] [PubMed]
- Gibson, P.W.; Elsaiid, A.E.; Kendrick, C.E.; Rivin, D.; Charmchi, M. A test method to determine the relative humidity dependence of the air permeability of woven textile fabrics. J. Test. Eval. 1997, 25, 416–423. [Google Scholar]
- Huang, S.-H.; Chen, C.-W.; Kuo, Y.-M.; Lai, C.-Y.; McKay, R.; Chen, C.-C. Factors affecting filter penetration and quality factor of particulate respirators. Aerosol Air Qual. Res. 2013, 13, 162–171. [Google Scholar] [CrossRef]
- Yim, W.; Cheng, D.; Patel, S.H.; Kou, R.; Meng, Y.S.; Jokerst, J.V. KN95 and N95 respirators retain filtration efficiency despite a loss of dipole charge during decontamination. ACS Appl. Mater. Interfaces 2020, 12, 54473–54480. [Google Scholar] [CrossRef] [PubMed]
- Rengasamy, S.; Eimer, B.C.; Szalajda, J. A Quantitative Assessment of the Total Inward Leakage of NaCl Aerosol Representing Submicron-Size Bioaerosol through N95 Filtering Facepiece Respirators and Surgical Masks. J. Occup. Environ. Hyg. 2014, 11, 388–396. [Google Scholar] [CrossRef]


Publisher’s Note: MDPI stays neutral with regard to jurisdictional claims in published maps and institutional affiliations. |
© 2022 by the authors. Licensee MDPI, Basel, Switzerland. This article is an open access article distributed under the terms and conditions of the Creative Commons Attribution (CC BY) license (https://creativecommons.org/licenses/by/4.0/).
Share and Cite
Segovia, J.M.; Huang, C.-H.; Mamishev, M.; Yuan, N.; He, J.; Novosselov, I. Performance of Textile Mask Materials in Varied Humidity: Filtration Efficiency, Breathability, and Quality Factor. Appl. Sci. 2022, 12, 9360. https://0-doi-org.brum.beds.ac.uk/10.3390/app12189360
Segovia JM, Huang C-H, Mamishev M, Yuan N, He J, Novosselov I. Performance of Textile Mask Materials in Varied Humidity: Filtration Efficiency, Breathability, and Quality Factor. Applied Sciences. 2022; 12(18):9360. https://0-doi-org.brum.beds.ac.uk/10.3390/app12189360
Chicago/Turabian StyleSegovia, Joelle M., Ching-Hsuan Huang, Maxwell Mamishev, Nanhsun Yuan, Jiayang He, and Igor Novosselov. 2022. "Performance of Textile Mask Materials in Varied Humidity: Filtration Efficiency, Breathability, and Quality Factor" Applied Sciences 12, no. 18: 9360. https://0-doi-org.brum.beds.ac.uk/10.3390/app12189360