Review

Review of Development and Application of Digital Image Correlation Method for Study of Stress–Strain State of RC Structures

1
Department of Highways and Bridges, Lviv Polytechnic National University, 12 St. S. Bandera, 79013 Lviv, Ukraine
2
Department of Building Constructions and Bridges, Lviv Polytechnic National University, 12 St. S. Bandera, 79013 Lviv, Ukraine
3
Faculty of Civil Engineering, Czestochowa University of Technology, 69 St. Dabrowskiego, 42-201 Czestochowa, Poland
*
Author to whom correspondence should be addressed.
Submission received: 16 September 2022 / Revised: 7 October 2022 / Accepted: 7 October 2022 / Published: 10 October 2022
(This article belongs to the Special Issue State-of-the-Art Structural Health Monitoring in Civil Engineering)

Abstract

:

Featured Application

The provided information could be used for further development and improvement of DIC methodology, aiming to increase the accuracy of the results.

Abstract

Reliable assessment and prediction of the technical condition of reinforced concrete structures require accurate data of the stress–strain state of the structure at all stages of loading. The most appropriate technique to obtain such information is digital image correlation. Digital image correlation is a class of contactless methods which includes the following stages: obtaining an image from a studied physical object, saving it in digital form, and further analysis in order to obtain the necessary information about the stress–strain state of the structure. In this research, a detailed analysis of theoretical and experimental findings of digital image correlations was conducted. In the article, the main areas of scientific interest and computational approaches in digital image correlation issues were identified. Moreover, comparative analysis of alternative non-contact techniques, which also could be used for diagnostics of RC structures’ stress–strain state was conducted. The novelty of the study consists of a thorough comparative analysis with the indication of specific features of digital image correlation, which determine its wide application among the other similar methods. On the basis of the conducted literature review, it can be seen that the digital image correlation technique has gone through multi-stage evolution and transformation. Among the most widely studied issues are: image recognition and matching procedures, calibration methods and development of analytical concepts. The digital image correlation technique enables us to study cracking and fracture processes in structural elements, obtaining the full field of deformations and stresses. Further development of image processing methods would provide more precise measuring of stress–strain parameters and reliable assessment of structural behavior.

1. Introduction

Reinforced concrete nowadays occupies the prevalent position in the modern construction industry, as well as in existing buildings and structures. Long-term operation necessitates specific features of the stress–strain state in reinforced concrete (RC) structures [1,2,3,4,5]. Theoretical research and modeling of damaged reinforced concrete elements allow us to carry out reliable assessment of a structure’s actual technical condition and to predict work needed under the influence of various external factors. The main problem in the theoretical evaluation is the need for high accuracy of the source information regarding the physical and mechanical characteristics of materials and the actual parameters of work under loading [6,7,8,9]. In order to obtain these data, a significant number of experimental studies under both laboratory and field conditions should be conducted, which is often economically impractical [1]. In the theoretical modeling of the structure, using both numerical methods and automated software, it is necessary to take into account the individual contribution of each of the parameters of the structural reaction. These results are valuable in determining the necessary strengthening of structural elements and make assumptions on the possibility of its further operation.
The leading trend in engineering is the evolution from the planned monitoring of the technical condition toward the prediction of its changes on the basis of parameters identified by non-destructive studies of real structures [10]. It is obvious that in order to achieve this goal it is necessary to operate with data of the structure stress–strain state at all stages of loading with high accuracy, which is technically impossible when using classical methods of experimental research. Accordingly, techniques with the use of digital image correlation have recently become widespread. Digital image correlation (DIC) is a class of contactless methods which includes the following stages: obtaining an image from studied physical object, saving it in digital form, and further analysis in order to obtain the necessary information about the stress–strain state of the structure [11].
Data analysis consists of comparison of the surface reference image before the application of the load (reference image-RI) with the images corresponding to the different stages of the deformation process (deformed images-DI) [12,13]. Automated image processing is performed with the use of a wide range of specialized software packages, including the following: Vic-2D/3D (Correlated Solutions, Inc., Irmo, SC, USA [14]), StrainMaster (LaVision, Ypsilanti, MI, USA [15]), GOM Correlate Pro, ARAMIS (GOM, Carl Zeiss GOM Metrology GmbH, Braunschweig, Germany [16]), Solid Mechanics DIC (Dantec Dynamics, Skovlunde, Denmark [17]), etc.

2. DIC Methodology Evolution—The History Review

2.1. General Review

Digital image correlation has come through multistage development and evolution, until reaching the form of high-precision technology, which is widely used today. A detailed analysis of the historical background of measurement methods based on image analysis is presented in studies of [11,18,19,20].
The early measurement methods, which were further developed in the DIC-concept, were discussed by Doyle [19] and Gruner [20]. The historical background of modern measurement methods based on image analysis date back to the writings of Leonardo da Vinci in 1480–1492. Most of the works during the following three centuries were dedicated to formulating mathematical principles and algorithms. Specifically, the work of Heinrich Lambert (The Free Perspective, 1759), which had the greatest impact on photography science, should be highlighted. The first practical implementation was performed by Daguerre in 1837 [11]. Afterwards, the photographic methods sparked wide interest in scientific research. Konecny [21] proposed dividing the field of photogrammetry into four different phases: plane photogrammetry (1850–1900), analog photogrammetry (1900–1950), analytical photogrammetry (1950–1985) and digital photogrammetry (1985–present).
During these four stages, the photogrammetric theoretical approaches obtained mathematical representation. Thus, Sturms and Haick in 1883 proposed transition algorithms between projective geometry and perspective imaging [11]. Among the most fundamental contributions of this period are the fundamental geometry of photogrammetry by Sebastian Finsterwald (1899) and projective equations for stereo-imaging which are fundamental to the analytical phase, developed by Otto von Gruber (1924) [11]. Earl Church is known as the author of analytical solutions to the equations of photogrammetry in terms of direction cosines (1945). In addition, Schreier et al. [11] highlighted the research of Dr. Hellmut Schmid (1953), which initiated the development of modern multi-station analytical photogrammetry using matrix notation, and studied the issue of error propagation and reduction.
The general scheme of DIC-method evolution, indicating the main stages and contributions is shown on Figure 1.

2.2. First Studies on Digital Image Correlation

Most of the studies of this early period were dedicated to extracting 3D information of objects through comparison of photographic records [11]. One of the first works dedicated to image correlation could be assigned to Gilbert Hobrough, who in the early 1950s analyzed the specifics of different points of view by comparing analog presentation of photographs, thus becoming one of the first scientists who made an attempt to extract positional information from the image correlation and introduced the matching process [12]. Extensive analysis of DIC technology from 1955 to 1979, conducted by Rosenfeld [22], identified its application in character recognition, microscopy, medicine, radiology and photogrammetry, whereas DIC usage for engineering issues during these years was rather rare [11,22]. Nevertheless, experimental approaches in solid mechanics were rapidly developing toward methods of holography, laser spectral photography and interferometry, which caused significant evolution in coherent light sources’ measurement technologies [12]. The difficulties, thus, evolved in nonlinearity of the recording process and complexity in information extracting.

2.3. 2D-DIC—From Early Research Till Today

The next stage of optical method development was to the formulation of the main principles for digitally recording images containing measurement data. In addition, algorithms for analyzing digital images and extracting data with high precision were proposed [11].
Among authors who worked on computer-based image processing techniques were Peters and Ranson in 1982 [23], who proposed to use to ultrasonic waves and their reflection before and after loading, thus obtaining full-field digital “images”. In addition, the idea of “matching process” was presented, using continuum mechanics concepts to indicate deformations in small areas.
An important step towards developing the optical method, known today as 2D-digital image correlation (2D-DIC) was made by Sutton et al. in 1983 [24]. They developed main numerical equations and experimentally confirmed the feasibility to use this technique in engineering issues. Sutton et al. in later work (1986 [25]) also proposed using gradient search methods in order to increase the accuracy of subset-matching. Among the authors who studied the possibility of DIC for various engineering issues are Anderson et al. [26] and Chu et al. [27]. Thus, it was shown that the correlation technique provides reliable accuracy for planar translations, rotations and deformations of solid bodies [26,27]. During the 1980s, scientific interest in DIC methodology rapidly increased, and theoretical approaches and procedures were validated, updated and modified. Russell et al. [28] in 1989 combined X-ray radiography and the DIC-method in order to measure internal deformation in composite material and study transverse strain fields [11]. The 1990s was the decade of scientific research on the possibility to measure surface deformations in planar components. For example, cracking processes were studied by McNeill et al. [29] in term of stress intensity factor determination. In addition, the use of image correlation enables tracking the local crack tip plastic zone, caused by “three-dimensional effects” [30].
Further development of the method was conducted by Lyons [31] and Liu et al. [32], who researched the stress–strain state with the use of DIC at high temperature. In addition, according to [11], this period could be characterized by increased interest in DIC to study fracture performance in various materials: metals [33,34,35], plastics [36,37], wood [38] and ceramics [39]. Among the later works are articles by Choi and Shah [40,41], where the concrete was studied and works [42,43], which provided detailed investigations of composites.
Since 2000, the DIC technique has extended to a wide range of engineering issues and tasks. Thus, a great number of research works were conducted, dedicated to improving the matching process accuracy during image recognition. For example, higher order spline interpolation functions were proposed by Schreier et al. in [44]. The same assumptions and propositions were made by Lu and Cary [45], as well as by Schreier and Sutton [46]. Authors in [45,46] noted the applicability of quadratic shape functions for study of non-uniform strain fields [11]. In addition, the investigation of Réthoré et al. [47,48] focused on development of “extended 2D-DIC”, the methodology combining the analytical FEM model and high-precision results, obtained with the use of image correlation
Simultaneously, another area of scientific interest of this period included studies of mechanical properties of materials: elastic [49,50] and hyperelastic properties [51], as well as the properties on a microscale [52].

2.4. 3D-DIC, the Complex Approach to Image Processing

Additional attention should be paid to development of the 3D-DIC method, which provided the possibility of shape and motion measurements. In the case of plane measurements conducted with 2D-DIC, the accuracy of the results can significantly decrease because of even a small out-of-plane motion and curvature effects. This factor had a great impact on estimated deformation results. and from the 1970s to the 1990s, studies examined stereo-vision measurements and the use of multiple cameras.
The application of multiple cameras with subsequent increased accuracy was proven in the works of Morimoto and Fujigaki [53] and Luo et al. [54,55]. Thus, the efficiency of deforming a rectangular grid and FFT methods was confirmed [53]. In addition, as shown by Luo et al. [54,55], two-camera stereo vision is the appropriate method for three-dimensional measurements of the cracking process.
It is necessary to note certain limitations of the 3D-DIC methodologies of the described period [11]. There were motions in calibration process due to manual components and cases of triangulation mismatching, and the square subsets in both cameras remained square. Remarkably, Helm et al. [56] proposed using a specific grid for motion calibration and introduced appropriate constraints to take into account the presence of epipolar lines. In addition, the method included the effect of perspective on subset shape [11,56].
Specific interest was paid to calibration techniques. For example, Devy et al. [57] proposed representing accurate calculation of differences between the model-based and actual measured image plane locations through the squared reprojection errors’ sum which was an influential factor for 3D calibration. In addition, the author in [57] introduced a number of internal and external correction parameters.
A rather remarkable approach was proposed by Lavest et al. [58], who turned back to photogrammetry methods, noting the bundle adjustment was a promising flexible calibration technique, providing accurate results. The same approach was discussed in the work of Garcia et al. [59], who improved the method by changing the number of constraints and reducing the family of calibration parameter solutions. In studies of this period, an important step was the extension of the single camera calibration method to the case of a stereo-camera system. In general, it was identified that the important feature of a reliable calibration procedure is comprehensive consideration of the camera system, rather than separately, which was an important stage in the process of 3D-DIC development.

3. DIC Method for Deformation Measurement

Measurement of deformations according to the DIC method is performed with the use of a stochastic contrast dot pattern, which must have been previously applied to the test area [10]. In general, the method includes tracking the relative position of each point during deformation. Thus, the authors in [10] note that the specific image can be represented as a matrix of natural numbers. Accordingly, the areas of white correspond to the number 0, and black to −100. Taking into account that a single number will not be unique in the matrix, it is appropriate to consider a certain subset of adjacent numbers (area of dots or pixels). This area usually takes the form of a square with a side of 10–50 pixels, and due to the fact that it includes several points with different variations of the gray level, the set of different correlation areas is obtained. (see Figure 2).
The center of each such subset is considered as the measuring (reference) point. For each subset, the position of the point is tracked, and the coordinates on the sequentially obtained images are determined. The fundamental principle used in the DIC method is to match the physical point on the reference image with its position on the images of the deformed surface [10,60]. As shown in Figure 1, the area around a particular pixel can be indicated an area of arbitrary shape, within which the distribution of shades will be unique (the speckle). After that, according to an algorithm using the appropriate software, the plot with the same distribution of pixel shades is found. During the correlation process, subsets of numbers are shifted until the pattern on the deformed image best matches the reference image, which is determined by the total difference in the gray levels of each point [60].
Good pattern determines the possibility to make the correlation with high confidence and low noise level. In the DIC method, the determination of the parameters of the dot pattern (the speckle) is one of the main factors that can reduce the total measurement error and improve the overall result [61]. The main requirements that need to be met by the pattern applied to the surface are given in [62,63] and include the following: high contrast of the pattern, the degree of filling of the surface with the pattern by 50–70%, isotropy and randomness. The optimal size of the points is determined for each case of the study, according to the method described in [63]. General pattern requirements are given on Figure 3.
Among the parameters of the experimental setup are the following (see Figure 4): camera resolution (c × r, pixels), width (w, mm) and height (h, mm) of the studied area, the focal length of the camera (f, mm) and the distance from the camera to the sample (d, mm).
Focal length is a variable parameter that allows the researcher to adjust the distance to the image and increase the sharpness of the studied area display. The resolution (c × r) is a technical characteristic of a digital camera and determines the dimension of the digital image (columns × rows). Using the previously accepted values of c × r and the size of the studied area (h × w), the size of the physical surface, which is displayed by one pixel of the digital image could be obtained [63]:
ξ w = w c ,
ξ h = h r .
Values ξ w , ξ h determine the width and height of the area of the physical surface that corresponds to one pixel of the digital image and are assumed as the equal ( ξ w = ξ h = ξ ). It is important to note, that in most modern digital cameras, the resolution of c × r = 4 × 3   ( 3 × 2 ) is used. Therefore, the most effective use of pixel image is achieved if h / w = 1.33 . By changing the technical parameters of the camera or the size of the studied area, these values are adjusted, and the parameters of the experiment are optimized by maximizing the number of efficiently used pixels.
Then, accepting a certain size of dots in the numerical expression a (pixels), the researcher determines the optimal size of the dots that make up the pattern on the studied physical surface:
d = a ξ .
The optimal value of a depends on the specific features of a particular engineering problem and belongs to a wide range of values. Although this parameter is not strictly limited, application of the most optical speckle size will give the best flexibility. In general, when the pattern is formed from speckles that are too large, or if it is too sparse, it is possible that certain subsets may be entirely on a region of black or a region of white. In such case, good correlation will be hard to obtain, as in any part of the region there will be an exact match. It is possible to eliminate this problem by increased size of subsets, which will probably reduce the spatial resolution [62]. However, for the case of a specifically small size of pattern, the resolution of the camera may not be enough for accurate specimen representation. Thus, the pattern indicates the jitter as it interacts with the sensor pixels, rather than smooth moving.
Official software guides recommend using dots of at least 5 pixels in size. [62].
The authors in [63] recommend the use of a randomly formed pattern of the same number of dots (10, 20 and 30 pixels). The method of application to the investigated surface significantly influences obtaining the desired pattern. A variety of methods can be used to achieve a good speckle pattern. Among the most common are stamps, aerosols, printing, lithography, UV photolithography and laser marking [64]. The official software recommendations [62] highlight the following: Correlated Solutions Speckle Kit, spray paint, sharpie, printed patterns, etc. (see Figure 5). Correlated Solutions recommend using a specifically developed Speckle Pattern Application Kit, in which an arrow of stamp rollers enables producing optimal speckle patterns Ink application includes rolling the dots to the studied surface, and the stamp rockers are pressed onto the specimen. It is recommended to first apply white paint on the surface to create the base coat. Dot sizes and their amounts may vary, depending on camera resolution. [62]
Among the simplest and most common techniques, which can be used for metal, ceramic or composite specimens of intermediate size (within 25 mm and 1.25 m) is spray paint. The surface is prepared by coating in white, after which the spray is streamed. It is possible to create speckles of different scales, either by moving the spray stream across the surface or by holding the specimen above the spray stream. Although this method is rather simple, it has some sufficient limitations. In many cases, it is almost impossible to reach the desired contrast of the pattern, which is critical for strains near the DIC noise floor. In addition, spray paint is not the optimal choice for applications where the specimen would be stiffened or chemically altered [62]. While applying the paint or ink on the surface, the researcher has to thoroughly control the amount of paint used. Thus, a sufficient coat includes thin, light layers. Heavy coats are the possible reason of surface distortion and shape changes. In many cases for membrane and thin structures, it is appropriate to use the ink without an additional base coat. Otherwise, the material will be stiffened, and extra mass will be added, which will cause negative influence on the results.
For samples with complex geometry and textures, a pattern can be created with a sharpie marker. Sharpie (permanent) marker patterns are characterized by very controlled speckle size and high contrast. The main drawback is that such a procedure is rather time-consuming. Thus, for medium through large surfaces, a more effective way is printing speckle patterns. The specific pattern of desired density, dot size and variation is created using a speckle pattern generator and printed vinyl appliqué or adhesive labels [62].
In cases where common methods do not provide the desired quality of the pattern, some specific methods need to be considered. For samples of small sizes, blowing toner powder, carbon black, or graphite powder is a good help. However, if the field is below 3 mm, microscope speckle application is available: photolithography, vapor deposition, TEM grids, etc. In contrast, if the study is performed for large-scale objects (up to 100 m), such as different bridges, slabs or even whole structures, a good possibility is using very large stencil [62].
Additional attention should be paid to complicated conditions of the experiment. For example, heatwaves and high temperatures necessitate using enamel paints, carbon black and graphite particles, which withstand temperature up to 900 °C. If the experiment includes high-strain tests, then the most crucial obstacle is that the spray paint after drying becomes brittle, which leads to the destruction of the pattern [62]. For such cases, it is desirable to use primer spray paint for the base coat or to use ink-based speckles without any base coat. If the experimental research is conducted for specimens made of transparent material, a good choice is to avoid using the base coat and to backlight the surface. It is known that for biological-like materials, the common problem in standard speckling techniques is sticking to the surface. Thus, effective methods include dots of India ink and use of microbeads that bind to the specimen and provide a contrast pattern [62]. In order to assess the quality of the applied pattern and its compliance for a particular task, there are the number of methods based on estimating the entropy and intensity distribution of individual speckle parts, as well as on morphological analysis of the pattern. Thus, some authors recommend using the average intensity gradient as the basic indicative parameter [66,67].
Another important parameter which needs to be considered is the choice of the optimal base for deformation measurement. The use of small bases leads to significant statistical variations in the results. On the other hand, large measurement bases do not allow indicating the local fracture areas [68]. Therefore, for research of the damaged structures and crack resistance of materials, it is necessary to apply bases of the optimum sizes, providing invariance of measurement results to the geometry of a sample and loading. [13,60,69].

4. DIC Method for Crack Resistance Analysis

Deformations of concrete surfaces are the cause of cracking processes, which, in turn, are indicators of violation of the normal operation of the structure during its technical condition monitoring [70,71]. In this case, as noted in [70,71], image correlation is an effective way to minimize the volume of manual technical inspections to optimally solve the problem of estimating the residual life of operational structures.
The ability to track the parameters of the stress–strain state until the destruction stage with high accuracy and the non-contact nature of the DIC methods determine the increased interest in this method of crack resistance study [72,73,74]. In the case of traditional methods for measuring the parameters of cracks, it is necessary to provide direct access to the structure, which often requires termination of the experiment or involves violation of safety rules. In contrast, the DIC includes only photographing the studied area from a certain distance and automated recording of information, which ensures the integrity and continuity of experimental data and safety for the researcher. [75]. An example of the implementation of this technology for real objects is the study of the parameters of the stress–strain state and the effectiveness of the strengthening of the McLenburg Bridge (North Carolina) [76]. According to recent research [77], in order to develop the issue of crack resistance, it is important to accurately determine the stresses and sizes of defects.
For example in the study [72], on the basis of the full field of deformations obtained with the use of DIC, the evolution of crack propagation (crack opening displacement, COD) at different load levels was analyzed. In addition, the effectiveness of composite reinforcement to increase the crack resistance of reinforced concrete structures was evaluated. Progressive results regarding changes in the characteristic patterns of crack formation, depending on the loading type and speed, were obtained by researchers in [71], which indicates the perspective of using the DIC technique for evaluating the destruction mechanisms in reinforced concrete structures. As stated in [71,78], it is advisable to consider the processes of crack formation in the local mode, taking into account the specific features of the material on the micro- and macroscale. In particular, various inclusions, grain boundaries and defects act as stress concentrators and localizers of plastic deformations. Thus, zones with a heterogeneous nature of deformation are the indicators of crack initiation and irreversible destruction processes. It is important to note that in this case, digital image correlation is practically the only method that provides the necessary accuracy for detecting the early accumulation of damage before the initiation of a crack. In addition, this technique enables consistently tracking the process of crack propagation at different stages [71,78]. For example, as was stated in [71,79], the distribution of deformations obtained with DIC is important initial data for identification of cracks, since deformations reach much higher values in the zones of crack formation. In addition, the orientation and localization zones of cracks generally correspond to the directions of the main stresses in the material [71,79].
The approach described above, based on the analysis of local deformations around the top of the crack and their distribution into certain mechanical components, is implemented in 2D-DIC [80]. In addition, the technique of formulation of 3D displacement fields using the stereo-correlation algorithm in order to observe the change in stress intensity coefficients for various mechanisms of crack formation is rather interesting and promising [80]. In addition, the analysis using the DIC data allows monitoring the processes of cracks′ non-homogeneous opening and closing, their growth rate and corresponding stress fields [81].

5. 3D-DIC Method for Formulation of Complete Deformation Picture

In addition, it is necessary to highlight the technique of 3D image correlation, which allows us to obtain a complete picture of deformations in 3-dimensional coordinates, as well as to monitor the parameters of the stress–strain state under dynamic loads [82]. The principle of the technique in this case consists of a three-dimensional description of the studied area from two different points [83]. Let us assume that a certain point A has coordinates in the real space coordinate system O w X w Y w Z w , then the coordinate systems O 1 X 1 Y 1 Z 1 and O 2 X 2 Y 2 Z 2 will correspond to left and right cameras, respectively. Thus, the coordinate system of the picture will be O X Y (see Figure 6).
Points A 1 ( x 1 , y 1 ) and A 2 ( x 2 , y 2 ) will be obtained as a result of shooting the actual point A   ( x w , y w , z w ) of the object in space with the left and right cameras, respectively. If the cameras are calibrated and the coordinates are known, then the 3D coordinates of point A can be determined by triangulation.
In this case, the process of comparing the reference image (RI) with the deformed one (DI) is the following: DI is compared with RI from the left camera, and, at the same time, DI from the right and left cameras are compared [83]. Additional synchronization and coordination of parameters and correlation functions in time, calibration of image systems and additional stages of triangulation determine a new level of complexity and increase the cost of the experimental setup. It is important to take into account that inaccuracies in the synchronization of optical systems in 3D-DIC are the cause of significant inaccuracies in the measured data [82].

6. Review of Alternative Methods for Diagnostics of RC Structures’ Stress–Strain State

Reliable assessment of the technical state of building structures has become one of the most topical engineering issues. Therefore, methods for identification of building structures’ stress–strain state require additional analysis, taking into consideration their specific features, advantages and disadvantages. This is especially important for reinforced concrete structures due to their heterogeneous and complex nature. Thus, this section provides a detailed comparative analysis of various methods and techniques, which, besides DIC, could be used for diagnostics of RC structures’ stress–strain state.
All methods for studying the stress–strain state of reinforced concrete structures are generally divided into destructive and nondestructive [84]. As was stated in the works of Ajagbe et al. [85,86] and Erdoğdu et al. [87], destructive methods make it possible to determine the strength parameters of materials accurately and efficiently, but they significantly affect the durability and service life of the studied structure. This significant drawback could be avoided if non-destructive research methods are used [88,89]. Non-destructive methods consist of inspection, testing and evaluation of building materials and their components without damaging the building elements. Today, such techniques are gaining increasing popularity both in laboratory research and scientific experiments [90,91,92], as well as for practical engineering tasks [93,94,95,96].
When the construction of reinforced concrete structures is already finished, an important task in modern practice is to determine whether the material meets the necessary requirements. Thus, the important characteristics that are reliably determined by non-destructive tests include density, modulus of elasticity, strength, water absorption, surface hardness and location of reinforcement [96,97,98]. There are the number of significant disadvantages to non-destructive techniques, which cause a further search for more reliable approaches to RC structures’ monitoring.
For example, mechanical–electrical methods and the use of Schmidt hammer and depth sensors require physical access to the construction. In addition, such methods are mostly focused on physical parameters of the material, rather than its response to loading impact. This aspect is eliminated in non-contact methods, such as infrared thermography, electromagnetic, electric and thermographic methods and techniques of radiation control and spectral analysis. More thorough consideration is required for non-contact techniques, which enable the study of the structure if direct access to it is limited.
Thus, non-contact methods are often used to assess the condition of a building that has been in operation for a long time, namely to identify cracks, cavities and delamination of concrete [97,98]. Other areas of application of non-contact research methods’ application include quality control of prefabricated reinforced concrete structures, the quality of monolithic and reinforcement work on the construction site [97,98]. In addition, non-contact testing methods are effectively used to increase the reliability and verify other methods during the analysis of the operation of structures subjected to intensive loading, fatigue, aggressive environments and temperature and humidity effects [97,98].
Among the non-contact methods the most widely used are the following: Schmidt′s hammer method, acoustic emission technology, ultrasonic (UT) methods, infrared thermography (IT), terahertz (TH, THz) waves method, technologies based on magnetoscopy and mechanical–electrical transformations, electromagnetic, depth sensors, electric, thermographic, methods of radiation control, spectral analysis and optical examination.
The specific feature of all the methods of non-contact visual control is that they are complex technical systems, which combine special algorithmic and mathematical software with measurement techniques, approaches to transformation and processing of measured data. The common characteristic of these methods is the requirement of thorough statistical analysis of initial data and iterative modelling of processes.
However, such approaches are highly dependent on external factors, such as temperature, humidity and atmospheric conditions. Therefore, their usage for constant long-term field monitoring of the structure is rather complicated and in most cases is associated with decreased accuracy of results.
Another perspective includes the methods based on the behavior of different types of waves: sound, acoustic, optical and terahertz, which provide the complex information on the stress–strain state and strength of the structure. It is appropriate to highlight the methods, which enable identifying the internal, so-called ‘hidden’ parameters of the structural element and invisible defects: ultrasonic (UT) method, image correlation methodology, different laser systems, etc.
Ultrasonic (UT) methods [99,100,101,102,103,104,105,106,107] are based on the behavior of sound waves, which could be interpreted as a defect in a certain solid medium (See Figure 7). The basic principle of the method is the following [99,100]. An ultrasonic pulse is generated by a piezoelectric material and passes through the structure under investigation. When passing through a homogeneous, undamaged material, the parameters of the sound wave remain stable. Any change in the speed of the pulse is identified as a defect (discontinuity of the material) and is converted from sound energy into a visual signal on the device’s display. Ultrasonic flaw detection devices have the ability to work in wide frequency ranges, which makes their measurements extremely accurate and reliable. The effectiveness of such methods depends on the temperature, surface condition and defect orientation [100]. In a number of works [103,104,105,106], an experimental comparison of ultrasonic methods with other technologies is given, which proved the rather high accuracy of UT technologies.
Rather interesting comparative research was provided by the authors of [102], who noted a high correlation between a decrease in ultrasound speed and an increase in acoustic emission in damaged areas. In addition, fairly close values were established during the examination of reinforced concrete structures using the Schmidt hammer and ultrasonic methods [107].
It is important to assume, that the most important conclusions on the structure state can be achieved from visual-based information, including its strains and displacements, arising from the load. Measurement of dynamic and static displacements in time provides the possibility to manage serviceability of the structure and to assess the influence of real loads (operational and environmental) on the stressful condition [108]. For such purpose, the most appropriate is continuous monitoring of the structure state with the use of optical systems containing targets, lasers or LEDs. The basic common principle is the combination of measuring equipment (targets, lasers or LEDs) mounted on a controlled structure from one side and a radiation receiver, namely a phototransistor or video camera from the other side [108].
Below are specified f technologies, similar to DIC, and their specifics, which determine their increasing spread in engineering practice
Projection laser systems (See Figure 8) include two modules facing each other, each with one or two lasers, a camera and a screen [108,109]. According to this concept, the relative displacement between the modules is obtained from calculated positions of the projected laser rays on both screens. Jeon et al. [110] proposed the methodology modification with the use of a visually served paired (ViSP) structured light system. Authors in [110] provide a detailed theoretical description and experimental evaluation of the proposed ViSP. The specific feature of ViSP is that the positions of the laser rays provide the information on the rotation angles of the manipulators, and the projected laser rays can be inside the screen boundary; thus, the position of the lasers is controlled to make the projected laser rays be always on the screen. A comparatively small distance between the camera and the screen causes robustness to the external environmental changes. Among the main drawbacks of this system, the most significant is the limited measurable range due to the limited screen size [108,109].
Similar optical-based systems with a phototransistor receiver and a laser light source were described in the works of Iizuka et al. [112] and Kanekawa et al. [113], where relatively low errors (0.1–0.5 mm) were admitted. Technologies with the use of sensor equipment enable identifying dynamic and static movements and specifics of the stress–strain state.
The optical methods described above have the following specifics: rather small displacement measurement errors and the possibility to provide constant monitoring of the structure during a long period of time. On the other hand, authors in [108] noticed a relatively small distance between the receiver and the radiation source and small displacement measurement range.
There are a number of specific advantages of technologies, similar to DIC, which determine their increasing spread in engineering practice. As was stated by [114], camera-based measuring devices such as digital image correlation, electronic speckle interferometry and laser speckle measurement systems correlations are effective for strain measurement, even in special measuring condition cases.
Within these methods, the Laser Doppler Vibrometry (LDV) system, based on the Doppler effect principle, needs to be discussed in more detail. According to this approach, the vibration of the structure can be calculated based on the laser beam Doppler shift reflected off the vibrating surface [115]. The Doppler effect itself is defined as the certain change in the wave motion frequency, noted by the observer when there is relative motion between the source and the observer [116].
The abovementioned approach allows full noncontact excitation and measurements for modal analysis of various structures and elements. The contactless vibration measurement method utilizing a laser Doppler vibrometer system was thoroughly studied in the paper [117]. The author proposed the non-contact procedure improved with advanced measurement techniques using mirrors [117]. A 3D laser Doppler vibrometer (3D LDV) has proved to be rather effective for quality assurance and control. The 3D LDV consists of the measurement of the frequency response of single or multiple points without any time gaps. The work [116] emphasizes the modification of the approach, enabling full non-contact monitoring, which uses acoustic pressure changes as the excitation source and three LDV (PSV-500 by Polytec) as the sensing system. A number of studies [118,119,120] have proved the applicability of scanning laser vibrometry for damage detection in different types of materials. The principle of the method is based on indication of damages according to analysis of elastic wave interaction with discontinuities. Thus, cracks, holes and slits are monitored on different scales. For instance, authors in [119] used scanning laser vibrometry for detection of damages in aluminum elements with small thickness. Articles [118,120] were devoted to delamination detection in composite materials.
However, according to [114], 3D-scanning laser Doppler vibrometry has its limitations due to long measuring time, and reduced signal-to-noise ratio. The laser Doppler velocimetry technique provides, in contrast to the vibrometry approach, the following advantages [114]: high time resolution and low cost of data processing. The critical challenge in the wide application of LDV approaches is its generally high cost. Thus, it is mostly used in the automotive industry, aerospace industry and for examinations of specific structures (light and ultralight), where other methods are not possible to use [116]. The example of this method application is given on Figure 9 [121].
Digital image correlation technology implies specific characteristics, which are the combination of various optical method advantages, which could be highlighted. Application of a DIC method for construction tasks includes a number pf specific features, which are described in the next section.

7. Application of DIC Methodology for Monitoring of RC Structures: Specifics, Advantages and Challenges

The specific feature of DIC is its universality, thus the possibility to use it for defectoscopy, stress–strain analysis and deformation control. The technique is appropriate for measurements on different scales: both for the microscale at crack analysis, as well as for the macroscale for deflections identification, which is not typical for other wave-based methods. In addition, image correlation is applicable for long-term automated monitoring of the structure condition for identification and recording of strength parameters in time scale. Another important advantage is relatively low impact of external temperature and atmospheric factors, which in comparison with other methods determines higher accuracy of the results.
The specifics indicated above determine why DIC is recommended for structural monitoring of building objects of different sizes. Scientists obtain the full-size accurate complex data of the investigated object.
However, the use of an image correlation technique for real engineering objects is not yet popular. Although DIC is a specifically promising approach for full-scale monitoring of building structures, more investigation of this issue is needed.
In addition, there are still a relatively small number of scientific works dedicated to DIC monitoring of RC structures. On the basis of the conducted literature review, it is important to note that most of the experimental studies were conducted for steel or composite materials and inconsistent attention was paid to reinforced concrete, which is an inhomogeneous material on the macroscale and requires more detailed analysis. The presence of different inclusions and grains form the specific natural pattern on the studied surface. Thus, the calibration and matching algorithms should take into consideration this pattern, and corresponding corrections to measurement procedure should be ensured. For today, there are not enough experimental studies of reinforced concrete structures with image correlation. Therefore, a lack of results of previous studies impedes development and improvement of the measurement algorithm for such structures. It could be assumed that DIC could provide the complex full-scale informational model of a reinforced concrete structure with a consistent amount of accurate data and the possibility to analyze its performance during the long-time loading process. Thus, further research in this area will be significant for engineering practice.

8. Conclusions

The reliable study of engineering problems and the identification of further areas for improvement require thorough research on background and existing investigations. In this study, a detailed analysis of theoretical and experimental findings of digital image correlation was provided. The main trends in computational approaches were identified On the basis of the conducted literature review, it is obvious that the digital image correlation technique has come through multi-stage evolution and transformation. Starting from the first theoretical investigations on image-based measuring methods, much attention was paid to image recognition and matching procedures. A great number of scientific studies were also dedicated to calibration methods and the development of analytical concepts aiming to increase the accuracy of the results. In general, after various improvements and modifications, the DIC-technique has become a unique methodology for investigation of the stress–strain state of constructions.
In addition, the work includes a thorough comparative analysis of alternative techniques, which, in addition to the DIC, are effective for diagnostics of RC structures’ stress–strain state. Specific advantages of image-based technologies in comparison with other methods, determining their wide and effective application were identified.
It provides the possibility to study cracking and fracture processes in structural elements, obtaining the full field of deformation and most extended picture of structure performance. The method is applicable to use for a wide range of engineering issues and for different structural materials and provides reliable data on a micro- and macroscale. Further development of the DIC technique would surely enable more precise measuring of stress–strain parameters and reliable assessment of structural behavior at different loading stages.
In recent research, specific attention was paid to the development and improvement of the matching process, synchronization and coordination of parameters and correlation functions in time and calibration of image systems. These questions are being currently discussed in engineering. However, there is still a lack of knowledge, and further research is required.
Among the issues, which are not thoroughly covered in scientific works, are: the specifics of DIC use for different types of natural and artificial materials, the impact of external factors and environmental conditions. A specific feature of the DIC method is the possibility to apply it not only for laboratory testing, but also for site research. In such cases, accurate measurement and the reduction of errors should be of particular importance. The absence of detailed analysis of this problem is the reason for numerous challenges faced by scientists when using the DIC method for site investigations.
It should also be noted that there is no exact unanimous decision on the specifics and parameters of the speckle pattern, which provides the highest accuracy. Although there is a clear understanding of the importance of parameters, such as size of dots, measurement bases’ sizes and density of the pattern, there is no exact strict methodology to predefine these values during experiment planning. In particular, the necessity for further study is obvious for damaged reinforced concrete structures, which are composite elements with non-homogeneous micro-and macrostructure.
The detailed analysis has shown that the specific advantage of DIC technology is the possibility to obtain the stress–strain data along the whole studied area. This unique feature makes the image-based method almost irreplaceable for engineering tasks. Therefore, this method requires more attention in further research, specifically for damaged structures. In the presence of different damages and defects, the stresses and strains in localized areas need to be taken into account. In these areas, the stress–strain map in some cases is non-continuous, which causes additional inaccuracy of obtained data.
It is possible to conclude that further experimental and theoretical study of DIC methodology is a crucial scientific direction and requires additional attention.

Author Contributions

Conceptualization, Y.B.; investigation, Y.B., J.S. and N.K.; methodology, Y.B., J.S. and N.K.; formal analysis, Y.B., Z.B. and J.S.; writing—review and editing, Z.B., R.K. and J.S.; supervision, Y.B.; validation, R.K. and J.S.; writing—original draft preparation, Y.B., R.K., Z.B., J.S. and N.K.; visualization, N.K. All authors have read and agreed to the published version of the manuscript.

Funding

This research received no external funding.

Institutional Review Board Statement

Not applicable.

Informed Consent Statement

Not applicable.

Data Availability Statement

The data presented in this study are available on request from the corresponding author.

Conflicts of Interest

The authors declare no conflict of interest.

References

  1. Christensen, C.O.; Schmidt, W.J.; Halding, S.P.; Kapoor, M.; Goltermann, P. Digital Image Correlation for Evaluation of Cracks in Reinforced Concrete Bridge Slabs. Infrastructures 2021, 6, 99. [Google Scholar] [CrossRef]
  2. Koteš, P.; Vavruš, M.; Raczkiewicz, W. Innovative strengthening of RC columns using a layer of a fibre reinforced concrete. Acta Polytech. CTU Proc. 2022, 33, 309–315. [Google Scholar] [CrossRef]
  3. Blikharskyy, Y.; Vashkevych, R.; Kopiika, N.; Bobalo, T.; Blikharskyy, Z. Calculation residual strength of reinforced concrete beams with damages, which occurred during loading. IOP Conf. Ser. Mater. Sci. Eng. 2021, 1021, 012012. [Google Scholar] [CrossRef]
  4. Kopiika, N.; Vegera, P.; Vashkevych, R.; Blikharskyy, Z. Stress-strain state of damaged reinforced concrete bended elements at operational load level. Prod. Eng. Arch. 2021, 27, 242–247. [Google Scholar] [CrossRef]
  5. Blikharskyy, Y.; Selejdak, J. Influence of the percentage of reinforcement damage on the bearing-capacity of RC beams. Bud. O Zoptymalizowanym Potencjale Energetycznym 2021, 10, 145–150. [Google Scholar] [CrossRef]
  6. Blikharskyy, Y.; Selejdak, J.; Kopiika, N. Corrosion fatigue damages of rebars under loading in time. Materials 2021, 14, 3416. [Google Scholar] [CrossRef]
  7. Blikharskyy, Y.; Selejdak, J.; Kopiika, N. Specifics of corrosion processes in thermally strengthened rebar. Case Stud. Constr. Mater. 2021, 15, e00646. [Google Scholar] [CrossRef]
  8. Czajkowska, A.; Raczkiewicz, W.; Bacharz, M.; Bacharz, K. Influence of maturing conditions of steel-fibre reinforced concrete on its selected parameters. Bud. O Zoptymalizowanym Potencjale Energetycznym 2020, 9, 47–54. [Google Scholar] [CrossRef]
  9. Kopiika, N.; Selejdak, J.; Blikharskyy, Y. Specifics of physico-mechanical characteristics of thermally-hardened rebar. Prod. Eng. Arch. 2022, 28, 73–81. [Google Scholar] [CrossRef]
  10. Niezrecki, C.; Baqersad, J.; Sabato, A. Digital Image Correlation Techniques for Non-Destructive Evaluation and Structural Health Monitoring. Handb. Adv. Non-Destr. Eval. 2018, 1–46. [Google Scholar] [CrossRef]
  11. Schreier, H.; Orteu, J.J.; Sutton, M.A. Image Correlation for Shape, Motion and Deformation Measurements: Basic Concepts, Theory and Applications; Springer Science & Business Media: New York, NY, USA, 2009; 322p. [Google Scholar]
  12. Hobrough, G.L. The Photogrammetric Record; John Wiley & Sons: Hoboken, NJ, USA, 2003; Volume 18, pp. 337–340. [Google Scholar] [CrossRef]
  13. Ivanytskyi Ya, L.; Maksimenko, O.P.; Molkov Yu, V.; Kun, P.S.; Chepil Ya, O. Methodology for determining the residual resource of reinforced concrete bridge beams and development of technical means for deformation monitoring. Technol. Diagn. Non-Destr. Test. 2016, 3, 44–49. [Google Scholar]
  14. VIC-2D. Refrence Manual. Correlated Solutions, Inc. Knowledgebase-Manuals and Guides. 26p. Available online: https://correlated.kayako.com/article/87-vic-volume-manual (accessed on 3 July 2022).
  15. StrainMaster. Digital Image Correlation Systems for Full Field Shape, Displacement and Strain. Manual. LaVision. 20p. Available online: https://www.lavision.de/de/products/strainmaster/index.php (accessed on 3 July 2022).
  16. GOM Correlate Pro. Electronic Manual. GOM. Available online: https://www.gom.com/en/products/gom-suite/gom-correlate-pro (accessed on 3 July 2022).
  17. Solid Mechanics DIC. Dantec Dynamics. Available online: https://www.dantecdynamics.com/solutions-applications/solutions/stress-strain-espi-dic/digital-image-correlation-dic/ (accessed on 3 July 2022).
  18. Vegera, P.; Vashkevych, R.; Blikharskyy, Y.; Khmil, R. Development Methodology of Determinating Residual Carrying Capacity of Reinforced Concrete Beams with Damages Tensile Reinforcement which Occurred During Loading. East. -Eur. J. Enterp. Technol. 2021, 4, 6–17. [Google Scholar] [CrossRef]
  19. Doyle, F. The historical development of analytical photogrammetry. Photogramm. Eng. 1964, 30, 259–265. [Google Scholar]
  20. Gruner, H. Reinhard Hugershoff. Photogramm. Eng. 1971, 37, 939–947. [Google Scholar]
  21. Konecny, G. The international society for photogrammetry and remote sensing—75 years old, or 75 years young. Photogramm. Eng. Remote Sens. 1985, 51, 919–933. [Google Scholar]
  22. Rosenfeld, A. From image analysis to computer vision: An annotated bibliography, 1955–1979. Comput. Vis. Image Underst. 2001, 84, 298–324. [Google Scholar] [CrossRef]
  23. Peters, W.H.; Ranson, W.F. Digital imaging techniques in experimental stress analysis. Opt. Eng. 1982, 21, 427–431. [Google Scholar] [CrossRef]
  24. Sutton, M.A.; Wolters, W.J.; Peters, W.H.; Ranson, W.F.; McNeill, S.R. Determination of displacements using an improved digital correlation method. Image Vis. Comput. 1983, 1, 133–139. [Google Scholar] [CrossRef]
  25. Sutton, M.A.; Cheng, M.Q.; Peters, W.H.; Chao, Y.J.; McNeill, S.R. Application of an optimized digital correlation method to planar deformation analysis. Image Vis. Comput. 1986, 4, 143–150. [Google Scholar] [CrossRef]
  26. Anderson, J.; Peters, W.H.; Sutton, M.A.; Ranson, W.F.; Chu, T.C. Application of digital correlation methods to rigid body mechanics. Opt. Eng. 1983, 22, 738–742. [Google Scholar]
  27. Chu, T.C.; WFRanson, W.F.; Sutton, M.A.; Peters, W.H. Applications of digital-image correlation techniques to experimental mechanics. Exp. Mech. 1985, 25, 232–244. [Google Scholar] [CrossRef]
  28. Russell, S.S.; Sutton, M.A.; Chen, H.S. Image correlation quantitative NDE of impact and fabrication damage in a glass fiber reinforced composite system. J. Mater. Eval. 1989, 47, 550–561. [Google Scholar]
  29. McNeill, S.R.; Peters, W.H.; Sutton, M.A. Estimation of stress intensity factor by digital image correlation. Eng. Fract. Mech. 1987, 28, 101–112. [Google Scholar] [CrossRef]
  30. Sutton, M.A.; Turner, J.L.; Chao, Y.J.; Bruck, H.A.; Chae, T.L. Experimental investigations of three-dimensional effects near a crack tip using computer vision. Int. J. Fract. 1992, 53, 201–228. [Google Scholar] [CrossRef]
  31. Lyons, J.S.; Liu, J.; Sutton, M.A. High-temperature deformation measurements using digital-image correlation. Exp. Mech. 1996, 36, 64–70. [Google Scholar] [CrossRef]
  32. Liu, J.; Sutton, M.A.; Lyons, J.S. Experimental characterization of crack tip deformations in alloy 718 at high temperatures. ASME J. Eng. Mater. Technol. 1998, 120, 71–78. [Google Scholar] [CrossRef]
  33. Dai, Y.Z.; Tay, C.J.; Chiang, F.P. Determination of the plastic zone by laser-speckle correlation. Exp. Mech. 1991, 31, 348–352. [Google Scholar] [CrossRef]
  34. Tong, W. Strain characterization of propagative deformation bands. J. Mech. Phys. Solids 1998, 46, 2087–2102. [Google Scholar] [CrossRef]
  35. Tong, W. Detection of plastic deformation patterns in a binary aluminum alloy. Exp. Mech. 1997, 37, 452–459. [Google Scholar] [CrossRef]
  36. Umezaki, E.; Futase, K. Deformation behaviour of the cross-section of a heat-sealed area in plastic film used for liquid package bags. J. Strain Anal. Eng. Des. 1997, 32, 29–35. [Google Scholar] [CrossRef]
  37. Lu, H.; Zhang, X.; Knauss, W.G. Uniaxial, shear, and poisson relaxation and their conversion to bulk relaxation: Studies on polymethyl methacrylate. Polym. Compos. 1997, 18, 211–222. [Google Scholar] [CrossRef]
  38. Zink, A.G.; Davidson, R.W.; Hanna, R.B. Strain measurement in wood using a digital image correlation technique. Wood Fiber Sci. 1995, 27, 346–359. [Google Scholar]
  39. Coburn, D.; Slevin, J.A. Development of a digital speckle correlation system for use in the non-destructive testing of advanced engineering ceramics. Key Eng. Mater. 1993, 86, 237–244. [Google Scholar] [CrossRef]
  40. Choi, S.; Shah, S.P. Measurement of deformations on concrete subjected to compression using image correlation. Exp. Mech. 1997, 37, 307–313. [Google Scholar] [CrossRef]
  41. Choi, S.; Shah, S.P. Fracture mechanism in cement-based materials subjected to compression. J. Eng. Mech. 1998, 124, 94–102. [Google Scholar] [CrossRef]
  42. Gonzalez, J.; Knauss, W.G. Strain inhomogeneity and discontinuous crack growth in a particulate composite. J. Mech. Phys. Solids 1998, 46, 1981–1995. [Google Scholar] [CrossRef]
  43. Ha, K.; Schapery, R.A. A three-dimensional viscoelastic constitutive model for particulate composites with growing damage and its experimental validation. Int. J. Solids Struct. 1998, 35, 3497–3517. [Google Scholar] [CrossRef]
  44. Schreier, H.W.; Braasch, J.; Sutton, M.A. Systematic errors in digital image correlation caused by intensity interpolation. Opt. Eng. 2000, 39, 2915–2921. [Google Scholar] [CrossRef] [Green Version]
  45. Lu, H.; Cary, D. Deformation measurements by digital image correlation: Implementation of a second-order displacement gradient. Exp. Mech. 2000, 40, 393–400. [Google Scholar] [CrossRef]
  46. Schreier, H.W.; Sutton, M.A. Systematic errors in digital image correlation due to undermatched subset shape functions. Exp. Mech. 2002, 42, 303–310. [Google Scholar] [CrossRef]
  47. Réthoré, J.; Hild, F.; Roux, S. Shear-band capturing using a multiscale extended digital image correlation technique. Comput. Methods Appl. Mech. Eng. 2007, 196, 5016–5030. [Google Scholar] [CrossRef] [Green Version]
  48. Réthoré, J.; Roux, S.; Hild, F. From pictures to extended finite elements: Extended digital image correlation (X-DIC). Comptes Rendus Mécanique 2007, 335, 131–137. [Google Scholar] [CrossRef] [Green Version]
  49. Geymonat, G.; Hild, F.; Pagano, S. Identification of elastic parameters by displacement field measurement. Comptes Rendus Mécanique 2002, 330, 403–408. [Google Scholar] [CrossRef] [Green Version]
  50. Lecompte, D.; Smits, A.; Sol, H.; Vantomme, J.; Hemelrijck, D. Van. Mixed numerical experimental technique for orthotropic parameter identification using biaxial tensile tests on cruciform specimens. Int. J. Solids Struct. 2007, 44, 1643–1656. [Google Scholar] [CrossRef] [Green Version]
  51. Giton, M.; Caro-Bretelle, A.S.; Ienny, P. Hyperelastic behaviour identification by a forward problem resolution: Application to a tear test of a silicone-rubber. Strain 2006, 42, 291–297. [Google Scholar] [CrossRef]
  52. Héripré, E.; Dexet, M.; Crépin, J.; Gélébart, L.; Roos, A.; Bornert, M.; Caldemaison, D. Coupling between experimental meaurements and polycrystal finite element calculations for micromechanical study of metallic materials. Int. J. Plast. 2007, 23, 1512–1539. [Google Scholar] [CrossRef]
  53. Morimoto, Y.; Fujigaki, M. Automated analysis of 3-D shape and surface strain distributions of a moving object using stereo vision. Opt. Lasers Eng. 1993, 18, 195–212. [Google Scholar] [CrossRef]
  54. Luo, P.F.; Chao, Y.J.; Sutton, M.A. Application of stereo vision to three-dimensional deformation analyses in fracture experiments. Opt. Eng. 1994, 33, 981–990. [Google Scholar] [CrossRef]
  55. Luo, P.F.; Chao, Y.J.; Sutton, M.A.; Peters, W.H. Accurate measurement of three-dimensional deformations in deformable and rigid bodies using computer vision. Exp. Mech. 1993, 33, 123–132. [Google Scholar] [CrossRef]
  56. Helm, Y.J.D.; McNeill, S.R.; Sutton, M.A. Improved three-dimensional image correlation for surface displacement measurement. Opt. Eng. 1996, 35, 1911–1920. [Google Scholar] [CrossRef] [Green Version]
  57. Devy, M.; Garric, V.; Orteu, J.-J. Camera calibration from multiple views of a 2D object using a global non linear minimization method. In Proceedings of the International Conference on Intelligent Robots and Systems (IROS’97), Grenoble, France, 11 September 1997. [Google Scholar] [CrossRef]
  58. Lavest, J.M.; Viala, M.; Dhome, M. Do we really need an accurate calibration pattern to achieve a reliable camera calibration? In Proceedings of the European Conference on Computer Vision, Frieburg, Germany, 2–6 June 1998; pp. 158–174. [Google Scholar] [CrossRef]
  59. Garcia, D.; Orteu, J.-J.; Devy, M. Accurate calibration of a stereovision sensor: Comparison of different approaches. In Proceedings of the 5th Workshop on Vision, Modeling, and Visualization (VMV’2000), Saarbrücken, Germany, 22–24 November 2000; pp. 25–32. [Google Scholar]
  60. Ivanyts’kyi, Y.L.; Mol’kov, Y.V.; Kun’, P.S.; Lenkovs’kyi, T.M.; Wójtowicz, M. Determination of the Local Strains Near Stress Concentrators by the Digital Image Correlation Technique. Mater. Sci. 2015, 50, 488–495. [Google Scholar] [CrossRef]
  61. Hu, W.; Sheng, Z.; Yan, K.; Miao, H.; Fu, Y. A New Pattern Quality Assessment Criterion and Defocusing Degree Determination of Laser Speckle Correlation Method. Sensors 2021, 21, 4728. [Google Scholar] [CrossRef] [PubMed]
  62. Speckle Pattern Fundamentals. Correlated Solutions, Inc. Knowledgebase Technical Articles 2021. 12p. Available online: https://correlated.kayako.com/article/38-speckle-pattern-fundamentals (accessed on 1 July 2022).
  63. Cintron, R.; Saouma, V. Strain measurements with the digital image correlation system Vic-2D. System 2008, 106, 2D. [Google Scholar]
  64. Bouyra, Q.; Blaysat, B.; Chanal, H.; Grédiac, M. Using laser marking to engrave optimal patterns for in-plane displacement and strain measurement. Strain 2021, 58, e12404. [Google Scholar] [CrossRef]
  65. Blikharskyy, Y.; Pavlic, A. Formation of a complete stress-strain curve of concrete using digital image corellation. East. -Eur. J. Enterp. Technol. 2021, 3, 37–44. [Google Scholar] [CrossRef]
  66. Quino, G.; Chen, Y.; Ramakrishnan, K.R.; Martínez-Hergueta, F.; Zumpano, G.; Pellegrino, A.; Petrinic, N. Speckle patterns for DIC in challenging scenarios: Rapid application and impact endurance. Meas. Sci. Technol. 2020, 32, 015203. [Google Scholar] [CrossRef]
  67. Kwon, T.H.; Park, J.; Jeong, H.; Park, K. Assessment of Speckle-Pattern Quality using Deep-Learning-Based CNN. Exp. Mech. 2022, 1–14. [Google Scholar] [CrossRef]
  68. Molkov Yu, V. Application of the method of digital image correlation to the construction of stress-strain diagrams. Mater. Sci. 2013, 48, 832–837. [Google Scholar] [CrossRef]
  69. Ivanyts’kyi, Y.L.; Kun’, P.S.; Lenkovs’kyi, T.M.; Mol’kov, Y.V.; Shtayura, S.T. The Choice of Spacing in Measuring Displacements for the Evaluation of Strains by the Method of Optical-Digital Image Correlation. Mater. Sci. 2018, 53, 849–854. [Google Scholar] [CrossRef]
  70. Cruz, H.; Aval, S.F.; Dhawan, K.; Pourhomayoun, M.; Rodriguez-Nikl, T.; Mazari, M. Non-Contact Surface Displacement Measurement for Concrete Samples Using Image Correlation Technique. In Proceedings of the 2019 International Conference on Image Processing, Computer Vision, & Pattern Recognition, Las Vegas, NV, USA, 29 July–1 August 2019; pp. 151–156. [Google Scholar]
  71. Pan, K.; Rena, C.Y.; Ruiz, G.; Zhang, X.; Wu, Z.; De La Rosa, Á. The propagation speed of multiple dynamic cracks in fiber-reinforced cement-based composites measured using DIC. Cem. Concr. Compos. 2021, 122, 104140. [Google Scholar] [CrossRef]
  72. Meng, S.; Li, J.; Liu, Z.; Wang, W.; Niu, Y.; Ouyang, X. Study of Flexural and Crack Propagation Behavior of Layered Fiber-Reinforced Cementitious Mortar Using the Digital Image Correlation (DIC) Technique. Materials 2021, 14, 4700. [Google Scholar] [CrossRef] [PubMed]
  73. Niu, Y.; Wei, J.; Jiao, C. Crack propagation behavior of ultra-high-performance concrete (UHPC) reinforced with hybrid steel fibers under flexural loading. Constr. Build. Mater. 2021, 294, 123510. [Google Scholar] [CrossRef]
  74. Zhang, Y.; Zhu, Y.; Qu, S.; Kumar, A.; Shao, X. Improvement of flexural and tensile strength of layered-casting UHPC with aligned steel fibers. Constr. Build. Mater. 2020, 251, 118893. [Google Scholar] [CrossRef]
  75. Li, W.; Huang, Y.; Jiang, Y.; Shi, T.; Xing, F. Application of DIC Technology to Shear Crack Measurement of Concrete Beam. In Advances in 3D Image and Graphics Representation, Analysis, Computing and Information Technology: Algorithms and Applications, Proceedings of IC3DIT; Springer: Berlin/Heidelberg, Germany, 2020; Volume 180, pp. 339–346. [Google Scholar] [CrossRef]
  76. Dizaji, M.S.; Harris, D.K.; Kassner, B.; Hill, J.C. Full-field non-destructive image-based diagnostics of a structure using 3D digital image correlation and laser scanner techniques. J. Civ. Struct. Health Monit. 2021, 11, 1415–1428. [Google Scholar] [CrossRef]
  77. Gamot, J.; Lasserre, T.; Richard, L.; Neggers, J.; Swiergiel, N.; Hild, F. Calibrating thermoelastic stress analysis with integrated digital image correlation: Application to fatigue cracks. J. Strain Anal. Eng. Des. 2019, 54, 320–330. [Google Scholar] [CrossRef] [Green Version]
  78. Patriarca, L.; Foletti, S.; Beretta, S. LCF and crack growth: Recent results obtained by DIC. In MATEC Web of Conferences; EDP Sciences: Les Ulis, France, 2018; Volume 165, p. 01001. [Google Scholar]
  79. Mohammad, M.J.; Ogihara, S.; Vinograd, V. Application of DIC to deformation measurement around damages in CFRP cross-ply laminates. Mech. Eng. J. 2019, 6, 19-00003. [Google Scholar] [CrossRef] [Green Version]
  80. Mathieu, F.; Hild, F. 2D and 3D Analyses of Cracks Via DIC. In Fracture and Fatigue; Springer: Cham, Switzerland, 2014; Volume 7, pp. 73–77. [Google Scholar] [CrossRef]
  81. Gonzáles, G.L.G.; González, J.A.O.; Castro, J.T.P.; Freire, J.L.F. Detecting fatigue crack closure and crack growth delays after an overload using DIC measurements. In Fracture, Fatigue, Failure and Damage Evolution; Springer: Cham, Switzerland, 2018; Volume 7, pp. 57–65. [Google Scholar] [CrossRef]
  82. Gorjup, D.; Slavič, J.; Babnik, A.; Boltežar, M. Still-camera multiview Spectral Optical Flow Imaging for 3D operating-deflection-shape identification. Mech. Syst. Signal Process. 2021, 152, 107456. [Google Scholar] [CrossRef]
  83. Tang, Z.Z.; Liang, J.; Xiao, Z.Z.; Guo, C.; Hu, H. Three-dimensional digital image correlation system for deformation measurement in experimental mechanics. Opt. Eng. 2010, 49, 103601. [Google Scholar] [CrossRef]
  84. Rahim, M.A.; Shahidan, S.; Lee, C.O.; Bahari, N.A.A.S.; Abd Rahman, N.; Ayob, A. The Behavior of Non-Destructive Test for Different Grade of Concrete. Int. J. Integr. Eng. 2020, 12, 1–8. [Google Scholar] [CrossRef]
  85. Ajagbe, W.O.; Ganiyu, A.A.; Okoloekwe, C.; Al-Alawi, H.S. Impact of Corroded Bars and Spalling on the Bond Strength of Reinforced Concrete Structures. Mater. Sci. Eng. 2018, 849, 012076. [Google Scholar] [CrossRef]
  86. Ajagbe, W.O.; Tijani, M.A.; Agbede, O.A. Compressive strength of concrete made from aggregates of different sources. USEP J. Res. Inf. Civ. Eng. 2018, 15, 11963–11974. [Google Scholar]
  87. Erdoğdu, S.; Kurbetci, Ş.; Kandil, U.; Nas, M.; Nayır, S. Evaluation of the Compressive Strength of Concrete by means of Cores Taken from Different Casting Direction. In Proceedings of the 13th International Congress on Advances in Civil Engineering, Izmir, Turkey, 12–14 September 2018; pp. 12–14. [Google Scholar]
  88. Rahim, M.A. The Natural Frequency Analysis of Reinforced Concrete Beam with Additional of Lightning Protection Cable. Malays. Constr. Res. J. (MCRJ) 2018, 4, 174–184. [Google Scholar]
  89. Rucka, M. Non-Destructive Testing of Structures. Materials 2020, 13, 4996. [Google Scholar] [CrossRef]
  90. Juraszek, J. Residual Magnetic Field Non-Destructive Testing of Gantry Cranes. Materials 2019, 12, 564. [Google Scholar] [CrossRef] [PubMed]
  91. Noszczyk, P.; Nowak, H. Inverse Contrast in Non-Destructive Materials Research by Using Active Thermography. Materials 2019, 12, 835. [Google Scholar] [CrossRef] [Green Version]
  92. Yassin, A. Acoustic Emission Non-Destructive Testing; The American University of Iraq: Sulaimani, Iraq, 2020; 34p. [Google Scholar]
  93. Drobiec, Ł.; Jasinski, R.; Mazur, W. Accuracy of Eddy-Current and Radar Methods Used in Reinforcement Detection. Materials 2019, 12, 1168. [Google Scholar] [CrossRef] [PubMed] [Green Version]
  94. Maj, M.; Ubysz, A.; Hammadeh, H.; Askifi, F. Non-Destructive Testing of Technical Conditions of RC Industrial Tall Chimneys Subjected to High Temperature. Materials 2019, 12, 2027. [Google Scholar] [CrossRef] [Green Version]
  95. Maj, M.; Ubysz, A.; Tamrazyan, A. Durability of polyurethane—Cement floors. In MATEC Web of Conferences; EDP Sciences: Les Ulis, France, 2018; Volume 251, p. 02026. [Google Scholar] [CrossRef]
  96. Wang, X.; Peng, Y.; Wang, J.; Zeng, Q. Pore Structure Damages in Cement-Based Materials by Mercury Intrusion: A Non-Destructive Assessment by X-ray Computed Tomography. Materials 2019, 12, 2220. [Google Scholar] [CrossRef] [Green Version]
  97. Hoła, A.; Sadowski, L.; Szymanowski, J. Non-destructive testing and analysis of a XIX-century brick masonry building. Arch. Civ. Eng. 2020, 66, 201–219. [Google Scholar] [CrossRef]
  98. Hoła, J.; Runkiewicz, L. Methods and diagnostic techniques used to analyse the technical state of reinforced concrete structures. Struct. Environ. 2018, 10, 309–337. [Google Scholar] [CrossRef]
  99. DSTU B V.2.7-226:2009 Building Materials; Concretes. Ultrasonic method of determination of strength. SE “State Research Institute of Building Structures”. Ministry of Regional Development and Construction of Ukraine: Kyiv, Ukraine, 2009; 28p.
  100. Doktor, M.S.; Fox, C.; Kurz, W.; Stockis, J.P. Characterization of steel buildings by means of non-destructive testing methods. J. Math. Ind. 2018, 8, 1–17. [Google Scholar] [CrossRef] [Green Version]
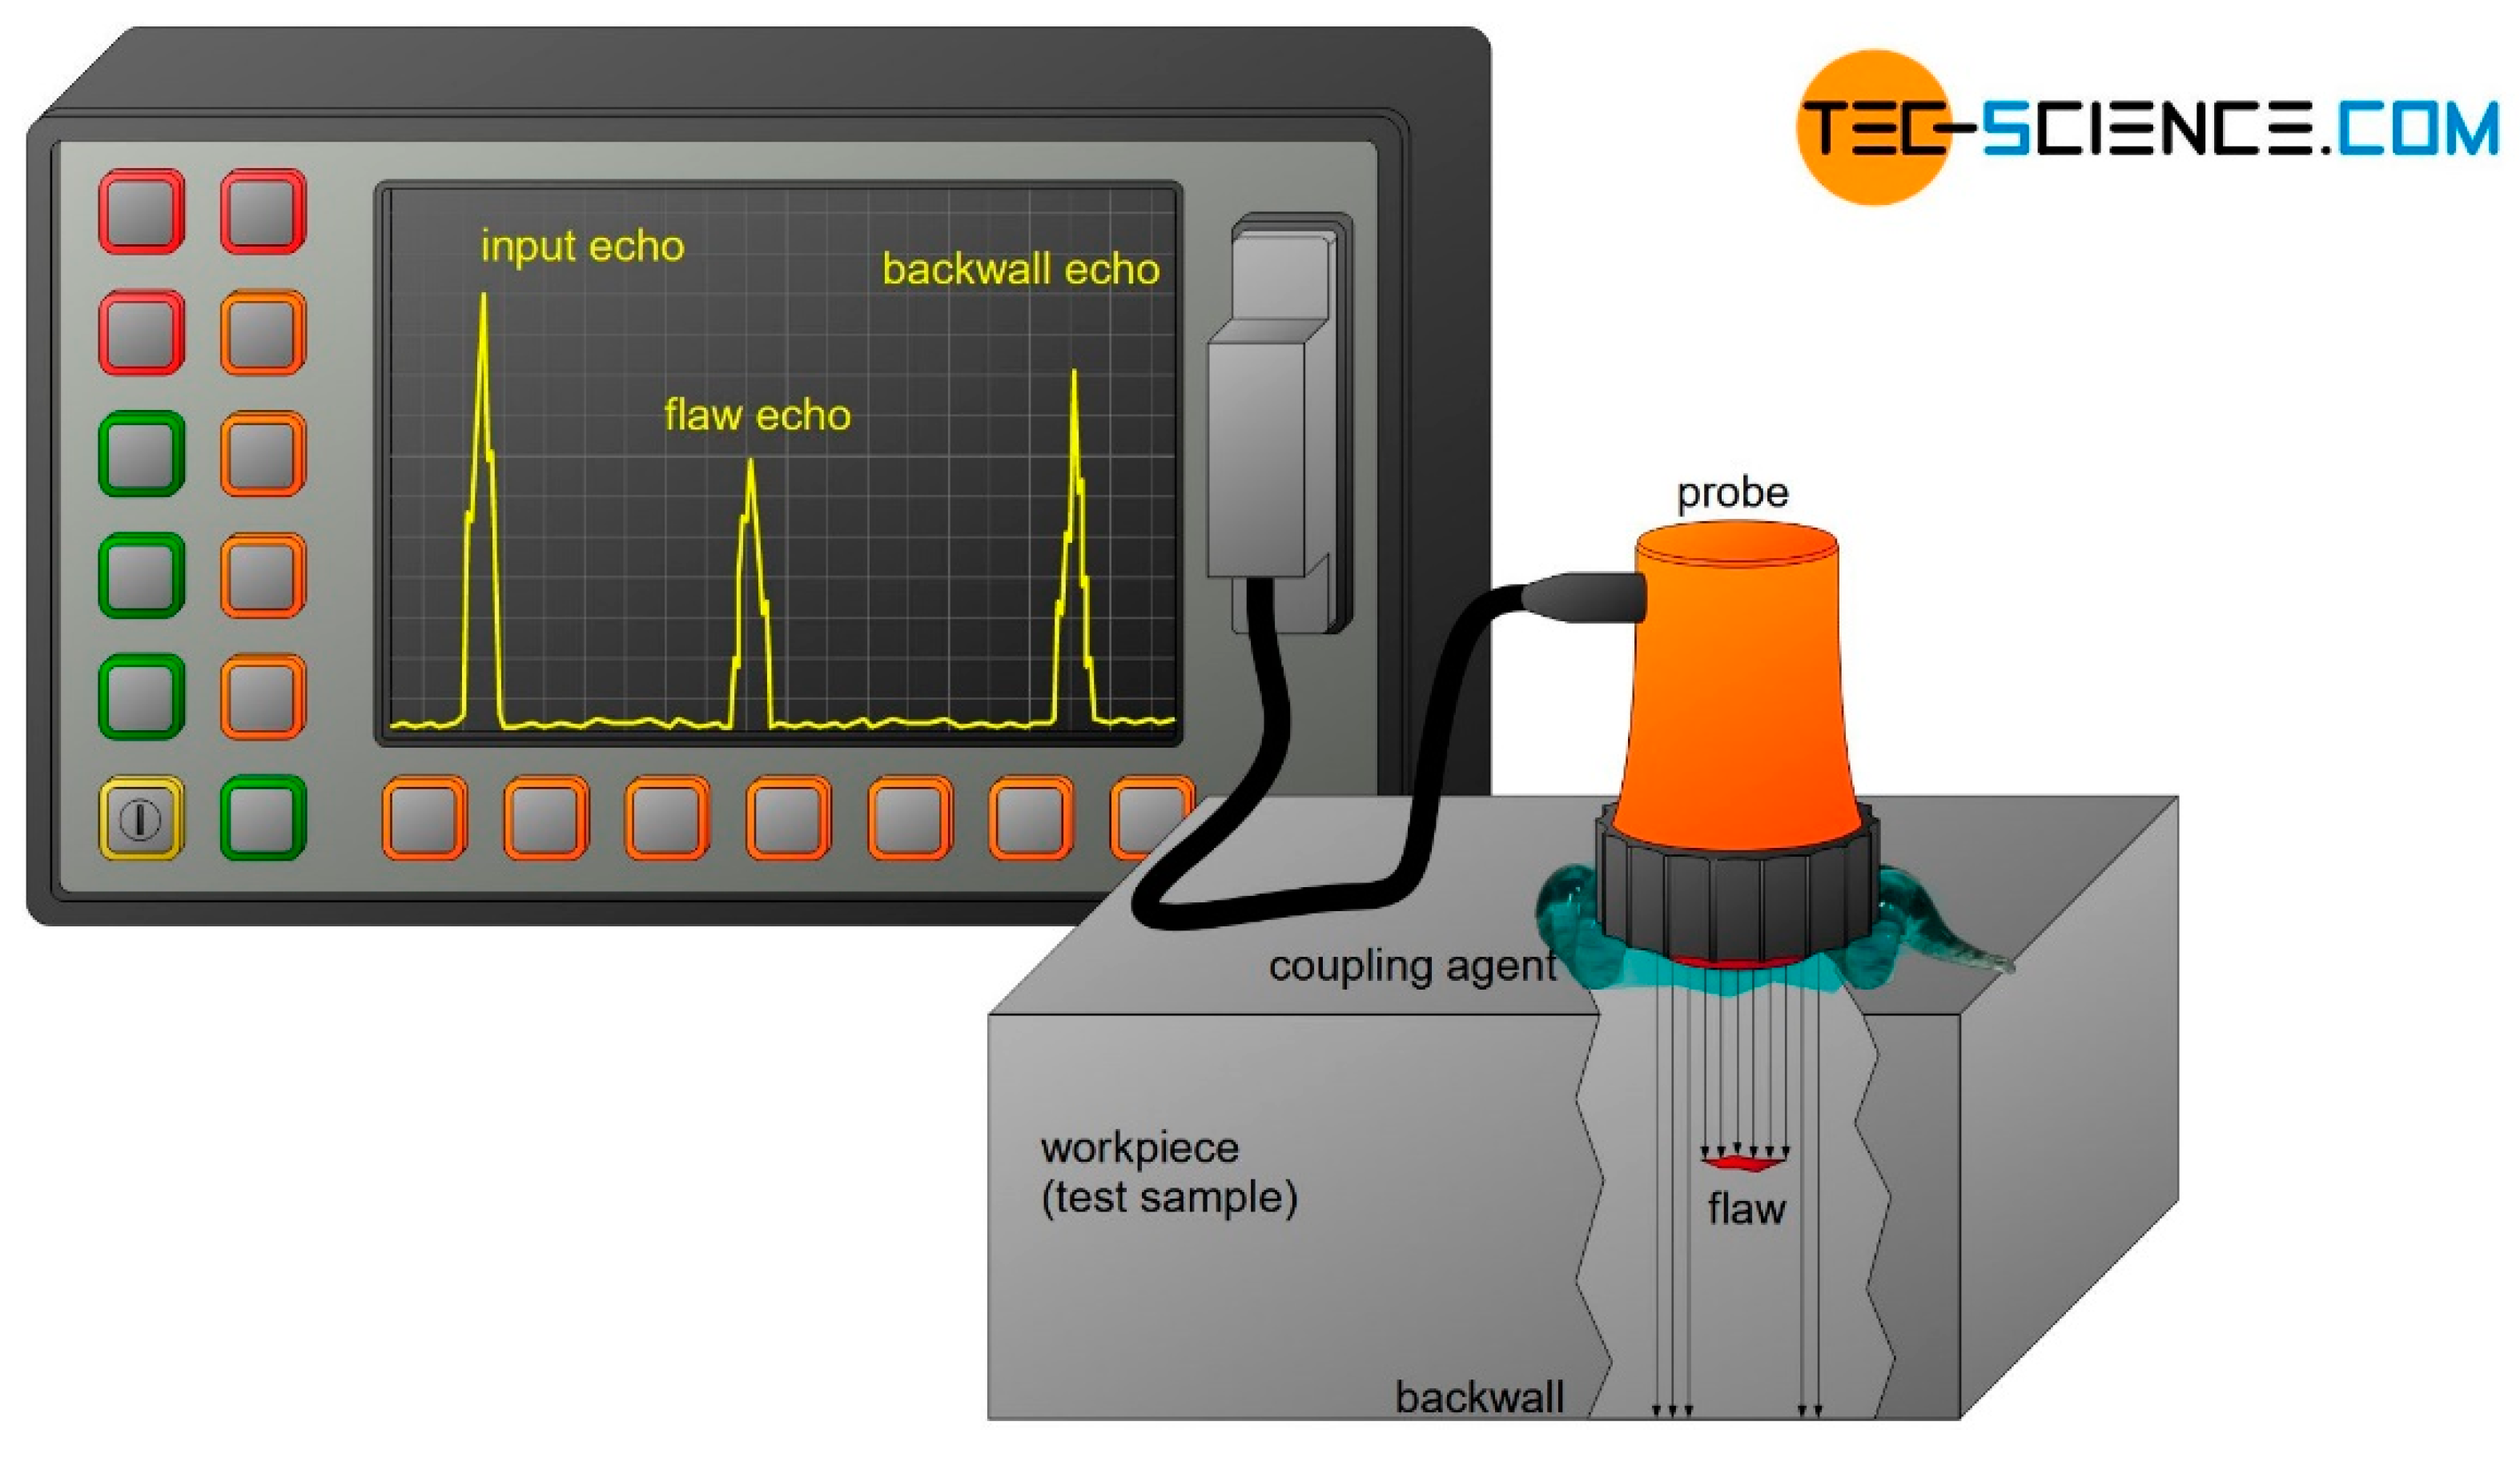
  101. Tec-science. Available online: https://www.tec-science.com/material-science/material-testing/ultrasonic-testing-ut/ (accessed on 5 October 2022).
  102. El Guerjouma, R.; Elaqra, H.A.; Sharia, M. Analysis of Damage of Reinforced Mortar by Non-Destructive Methods. IUG J. Nat. Eng. Stud. 2015, 23, 38–45. [Google Scholar]
  103. Ennis, M. Non-destructive testing at El Morro. CRM Cult. Resour. Manag. 1997, 20, 35. [Google Scholar]
  104. Papanikolaou, S.; Fasnakis, D.; Maropoulos, A.; Giagopoulos, D.; Maropoulos, S.; Theodoulidis, T. Non-destructive testing of welded fatigue specimens. In Proceedings of the MATEC Web of Conferences; EDP Sciences: Les Ulis, France, 2020; Volume 318, p. 01033. [Google Scholar] [CrossRef]
  105. Petryk, V.F.; Protasov, A.G.; Galagan, R.M.; Muraviov, A.V.; Lysenko, I.I. Smartphone-Based Automated Non-Destructive Testing Devices. Devices Methods Meas. 2020, 11, 272–278. [Google Scholar] [CrossRef]
  106. Petrov, M.; Osipov, K.; Fursa, T.; Dann, D. Diagnostics of Damages in Reinforced Concrete by the Parameters of Electric Response to Mechanical Impact. In IOP Conference Series: Materials Science and Engineering; IOP Publishing: Bristol, UK, 2019; Volume 471, p. 052048. [Google Scholar] [CrossRef]
  107. Wiyanto, H.; Chang, J.; Dennis, Y. Concrete structure condition rating in buildings with non-destructive testing. In IOP Conference Series: Materials Science and Engineering; IOP Publishing: Bristol, UK, 2020; Volume 852, p. 012058. [Google Scholar] [CrossRef]
  108. Maksymenko, O.P.; Sakharuk, O.M.; Ivanytskyi, Y.L.; Kun, P.S. Multilaser spot tracking technology for bridge structure displacement measuring. Struct. Control Health Monit. 2021, 28, e2675. [Google Scholar] [CrossRef]
  109. Myung, H.; Lee, S.; Lee, B. Paired structured light for structural health monitoring robot system. Struct Health Monit. 2010, 10, 49–64. [Google Scholar] [CrossRef]
  110. Jeon, H.; Shin, J.U.; Kim, H.; Myung, H. ViSP (visually Servoed paired structured light system) for measuring structural displacement. In Proceedings of the Sensors and Smart Structures Technologies for Civil, Mechanical, and Aerospace Systems, San Diego, CA, USA, 12–15 March 2012; Volume 8345, pp. 582–589. [Google Scholar] [CrossRef]
  111. Industrial Automation Asia. Available online: https://www.iaasiaonline.com/faro-tracersi-laser-for-projection-and-inspection/ (accessed on 5 October 2022).
  112. Iizuka, T.; Mikoshiba, T.; Niitsu, Y. Development of pseudo 3D position measurement with high resolution camera and application for strain measurement of static forced wooden-walls. In Proceedings of the 5th World Conference on Structural Control and Monitoring, Tokyo, Japan, 12–14 July 2010; p. 239. [Google Scholar]
  113. Kiyoshi, K.; Iwao, M.; Maya, S.; Ryota, T.; Motoichi, T.; Satoru, M.; Yasutsugu, S.; Tomohiko, H.; Ryuta, K.; Yoshihiro, N.; et al. An experimental study on relative displacement direct sensing in real-time using phototransistor array for building structures. IEEJ Trans. 2010, 5, 251–255. [Google Scholar] [CrossRef]
  114. Wang, F.; Krause, S.; Hug, J.; Rembe, C. A Contactless Laser Doppler Strain Sensor for Fatigue Testing with Resonance-Testing Machine. Sensors 2021, 21, 319. [Google Scholar] [CrossRef]
  115. Rothberg, S.J.; Allen, M.S.; Castellini, P.; Di Maio, D.; Dirckx, J.J.J.; Ewins, D.J.; Halkon, B.J.; Muyshondt, P.; Paone, N.; Ryan, T.; et al. An international review of laser Doppler vibrometry: Making light work of vibration measurement. Opt. Lasers Eng. 2017, 99, 11–22. [Google Scholar] [CrossRef] [Green Version]
  116. Scislo, L. Quality Assurance and Control of Steel Blade Production Using Full Non-Contact Frequency Response Analysis and 3D Laser Doppler Scanning Vibrometry System. In Proceedings of the 11th IEEE International Conference on Intelligent Data Acquisition and Advanced Computing Systems: Technology and Applications (IDAACS), Cracow, Poland, 22–25 September 2021; pp. 419–423. [Google Scholar] [CrossRef]
  117. Wang, F.; Krause, S.; Hug, J.; Rembe, C. Non-Invasive Measurements Of Ultra- Lightweight Composite Materials Using Laser Doppler Vibrometry System. In Proceedings of the International Congress on Sound and Vibration26, Montreal, QC, Canada, 7–11 July 2019; pp. 1–8. [Google Scholar]
  118. Kudela, P.; Wandowski, T.; Malinowski, P.; Ostachowicz, W. Application of scanning laser Doppler vibrometry for delamination detection in composite structures. Opt. Lasers Eng. 2017, 99, 46–57. [Google Scholar] [CrossRef]
  119. Mallet, L.; Lee, B.C.; Staszewski, W.J. Structural health monitoring using scanning laser vibrometry: II. Lamb waves for damage detection. Smart Mater Struct 2004, 13, 261. [Google Scholar] [CrossRef]
  120. Sohn, H.; Dutta, D.; Yang, J.Y.; Park, H.J.; DeSimio, M.; Olson, S.; Swenson, E. Delamination detection in composites through guided wave field image processing. Compos. Sci. Technol. 2011, 71, 1250–1256. [Google Scholar] [CrossRef]
  121. Dynamic Stress and Strain Measurement. Technical Paper. Source: InFocus • Optical Measurement Solutions, Issue 1/2010, ISSN 1864–9203. 2010 Polytec GmbH. Available online: www.polytec.com/infocus (accessed on 5 October 2022).
Figure 1. Evolution of DIC concept [11].
Applsci 12 10157 g001
Figure 2. The principle of tracking the relative position of the subset with different variations of the gray level (I) in the DIC method.
Applsci 12 10157 g002
Figure 3. General pattern requirements for the DIC method (according to recommendations in [62]).
Applsci 12 10157 g003
Figure 4. Schematic diagram of experimental setup with application of the DIC technique.
Applsci 12 10157 g004
Figure 5. Common pattern application methods ([62,64,65]).
Applsci 12 10157 g005
Figure 6. Scheme of measurement procedure and comparison of data when using 3D-DIC.
Applsci 12 10157 g006
Figure 7. Principle of ultrasonic testing [101].
Applsci 12 10157 g007
Figure 8. Principle of projection laser systems application [111].
Applsci 12 10157 g008
Figure 9. 3-D scanning vibrometer testing a turbine blade [121].
Applsci 12 10157 g009
Publisher’s Note: MDPI stays neutral with regard to jurisdictional claims in published maps and institutional affiliations.

