
A Proposed Uncertainty Reduction Criterion of Renewable Energy Sources for Optimal Operation of Distribution Systems

 ,
,  ,
,  and
and 
Abstract
:1. Introduction
- Probabilistic methods: used when the historical data is available. It can be divided into numerical and analytical approaches [9].
- Possibilistic methods [10]: used when the historical data is unavailable. it can be divided into defuzzification method and alpha-cut method.
- Combined possibilistic and probabilistic methods [11]: these methods mix between the features of the possibilistic and probabilistic methods such as possibilistic-Monte Carlo approach.
2. RESs Uncertainty
2.1. WT Modeling
2.2. PV Modeling
2.2.1. Accurate PV Modeling
2.2.2. Approximate PV Modeling
3. Proposed Reduction Criteria for RESs Uncertainty
- Establishing the base matrix that consists of 8784 rows and 4 columns; the rows represent the year hours, and the columns represent the uncertainty parameters ().
- All the matrix row values are rearranged according to the G values when it is arranged in ascending order.
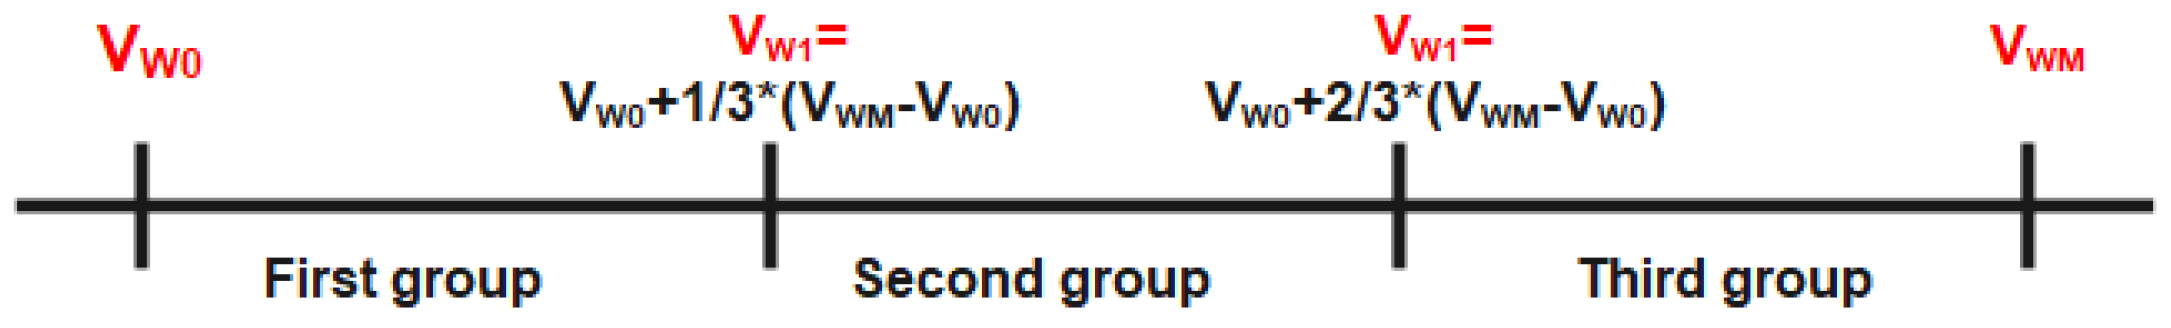
- Forming the G sub-groups as follows: G sub-groups are the groups which are formed by dividing the practical irradiance range into three equal sub-groups limited by four boundaries () as shown in Figure 3, where G0 is the lowest practical solar irradiance, is the highest practical solar irradiance, is the boundary between the first and second sub-groups, and is the boundary between the second and third sub-groups. The values of and are calculated as shown in Figure 3.
- Using the formed sub-groups to divide the base matrix into three sub-matrices (M1, M2, M3), where each sub-group forms a sub-matrix.
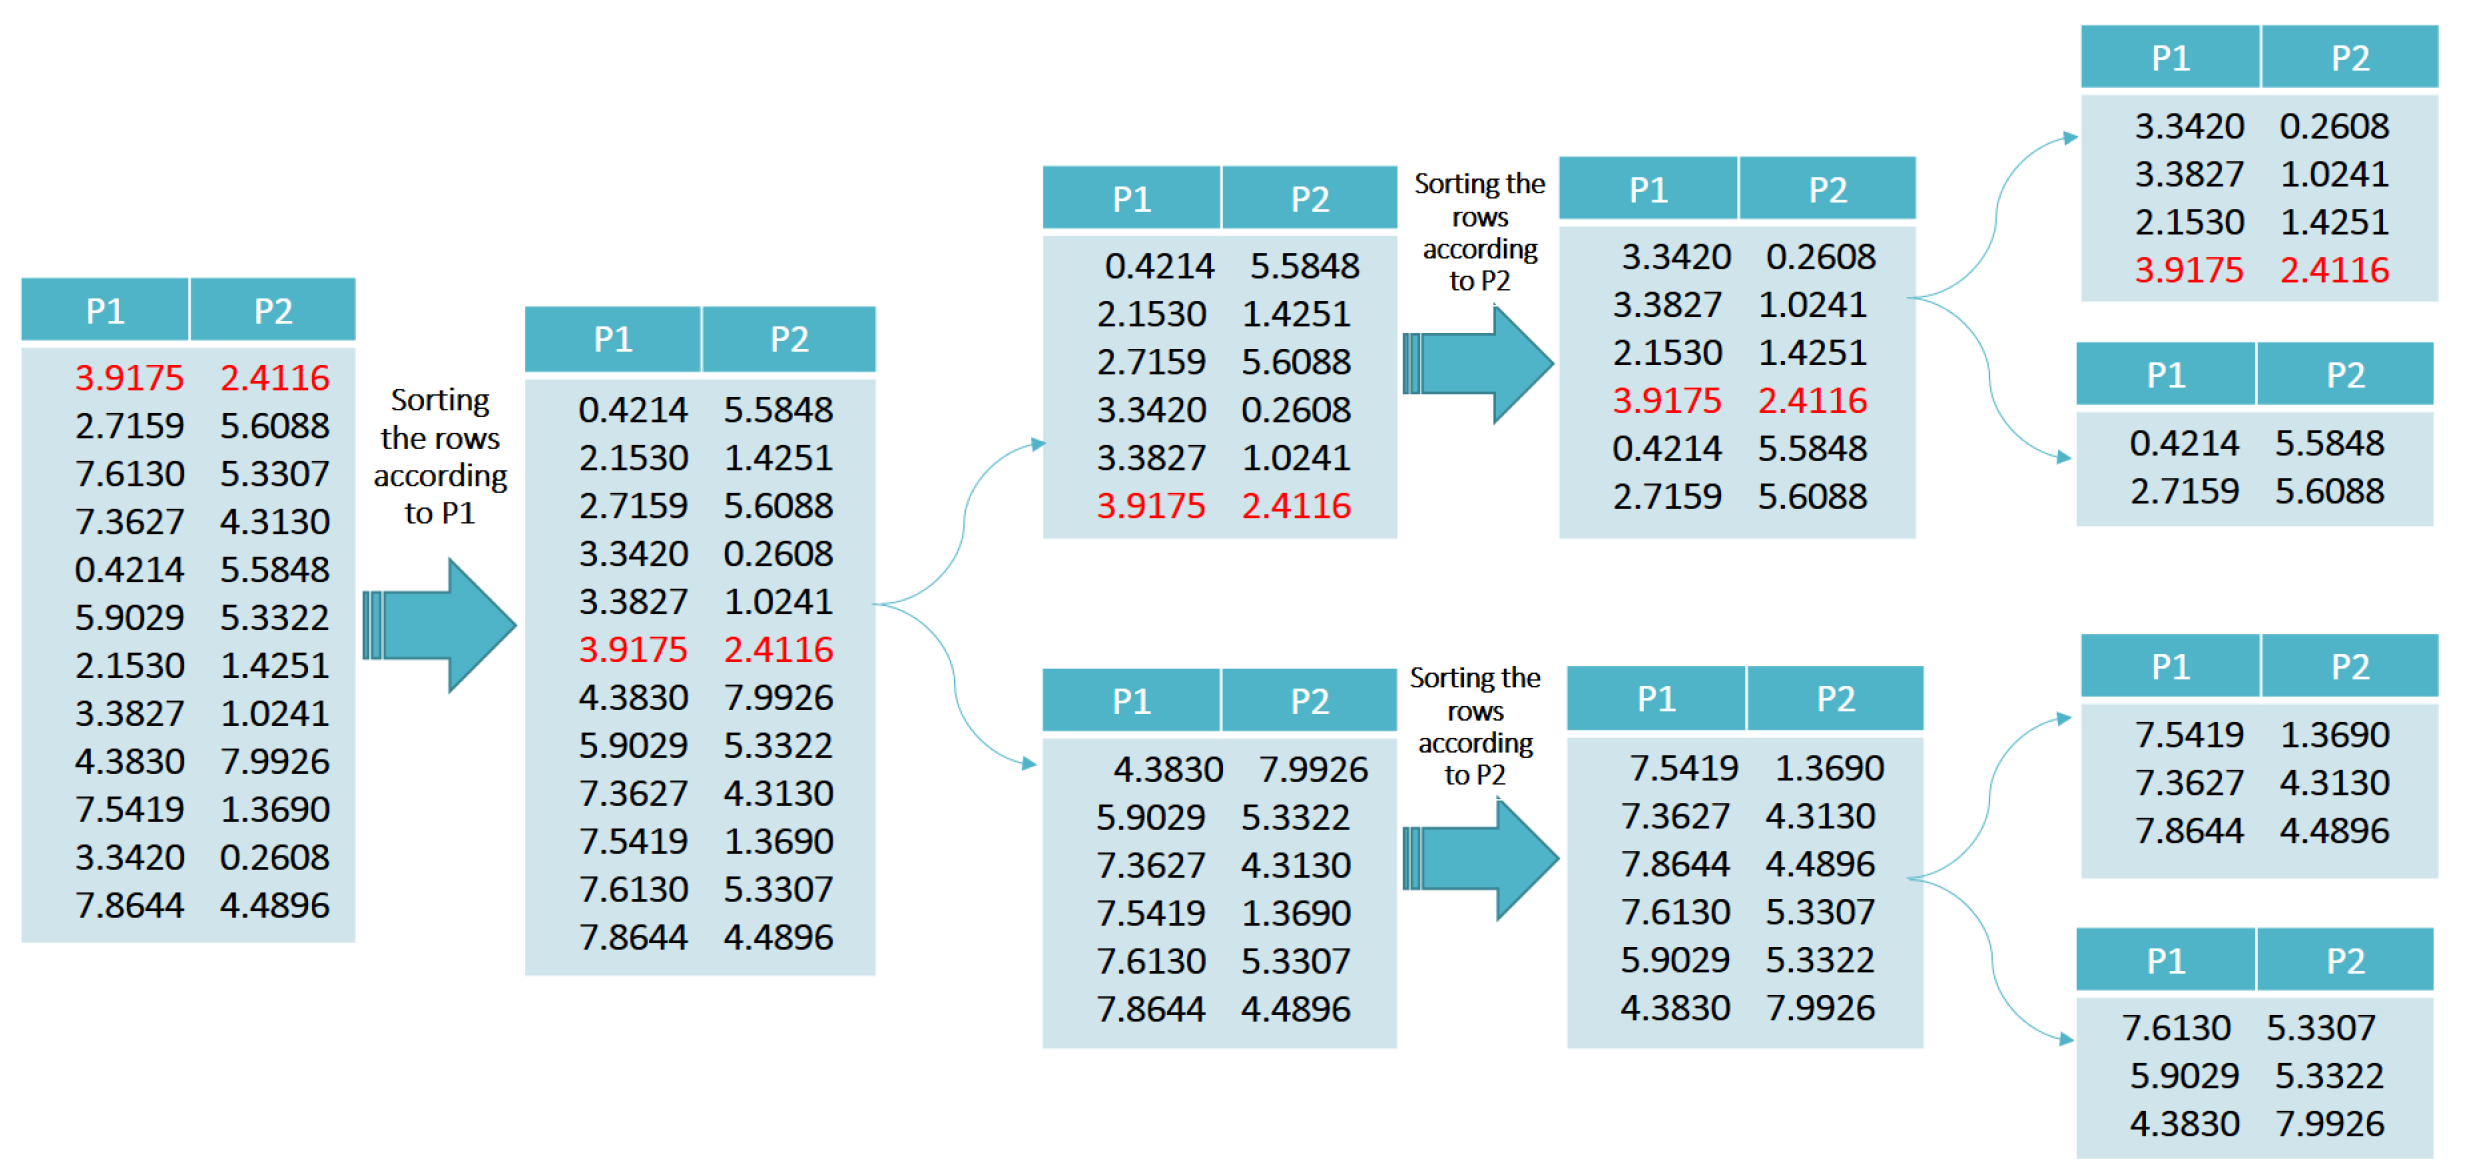
- Rearrange the rows of the sub-matrices () according to the values of T in ascending order.
- Follow the sub-grouping technique used in Stage 1 to form sub-matrices (, ) from () according to T values as shown in Figure 4.
- Rearrange the rows of the sub-matrices () according to the values of in ascending order.
- Follow the sub-grouping technique used in Stage 1 to form sub-matrices (, , ) from () according to values as shown in Figure 5.
- Complete the same steps mentioned in the third stage on (, , ) but according to the values of LR as shown in Figure 6.
4. Implementation of the Proposed Reduction Strategy for Distribution Systems Operation
4.1. Energy Loss Error
4.2. The Lowest and Highest Voltage Value Errors
4.3. Two-Voltages out Limits Error
5. Applications
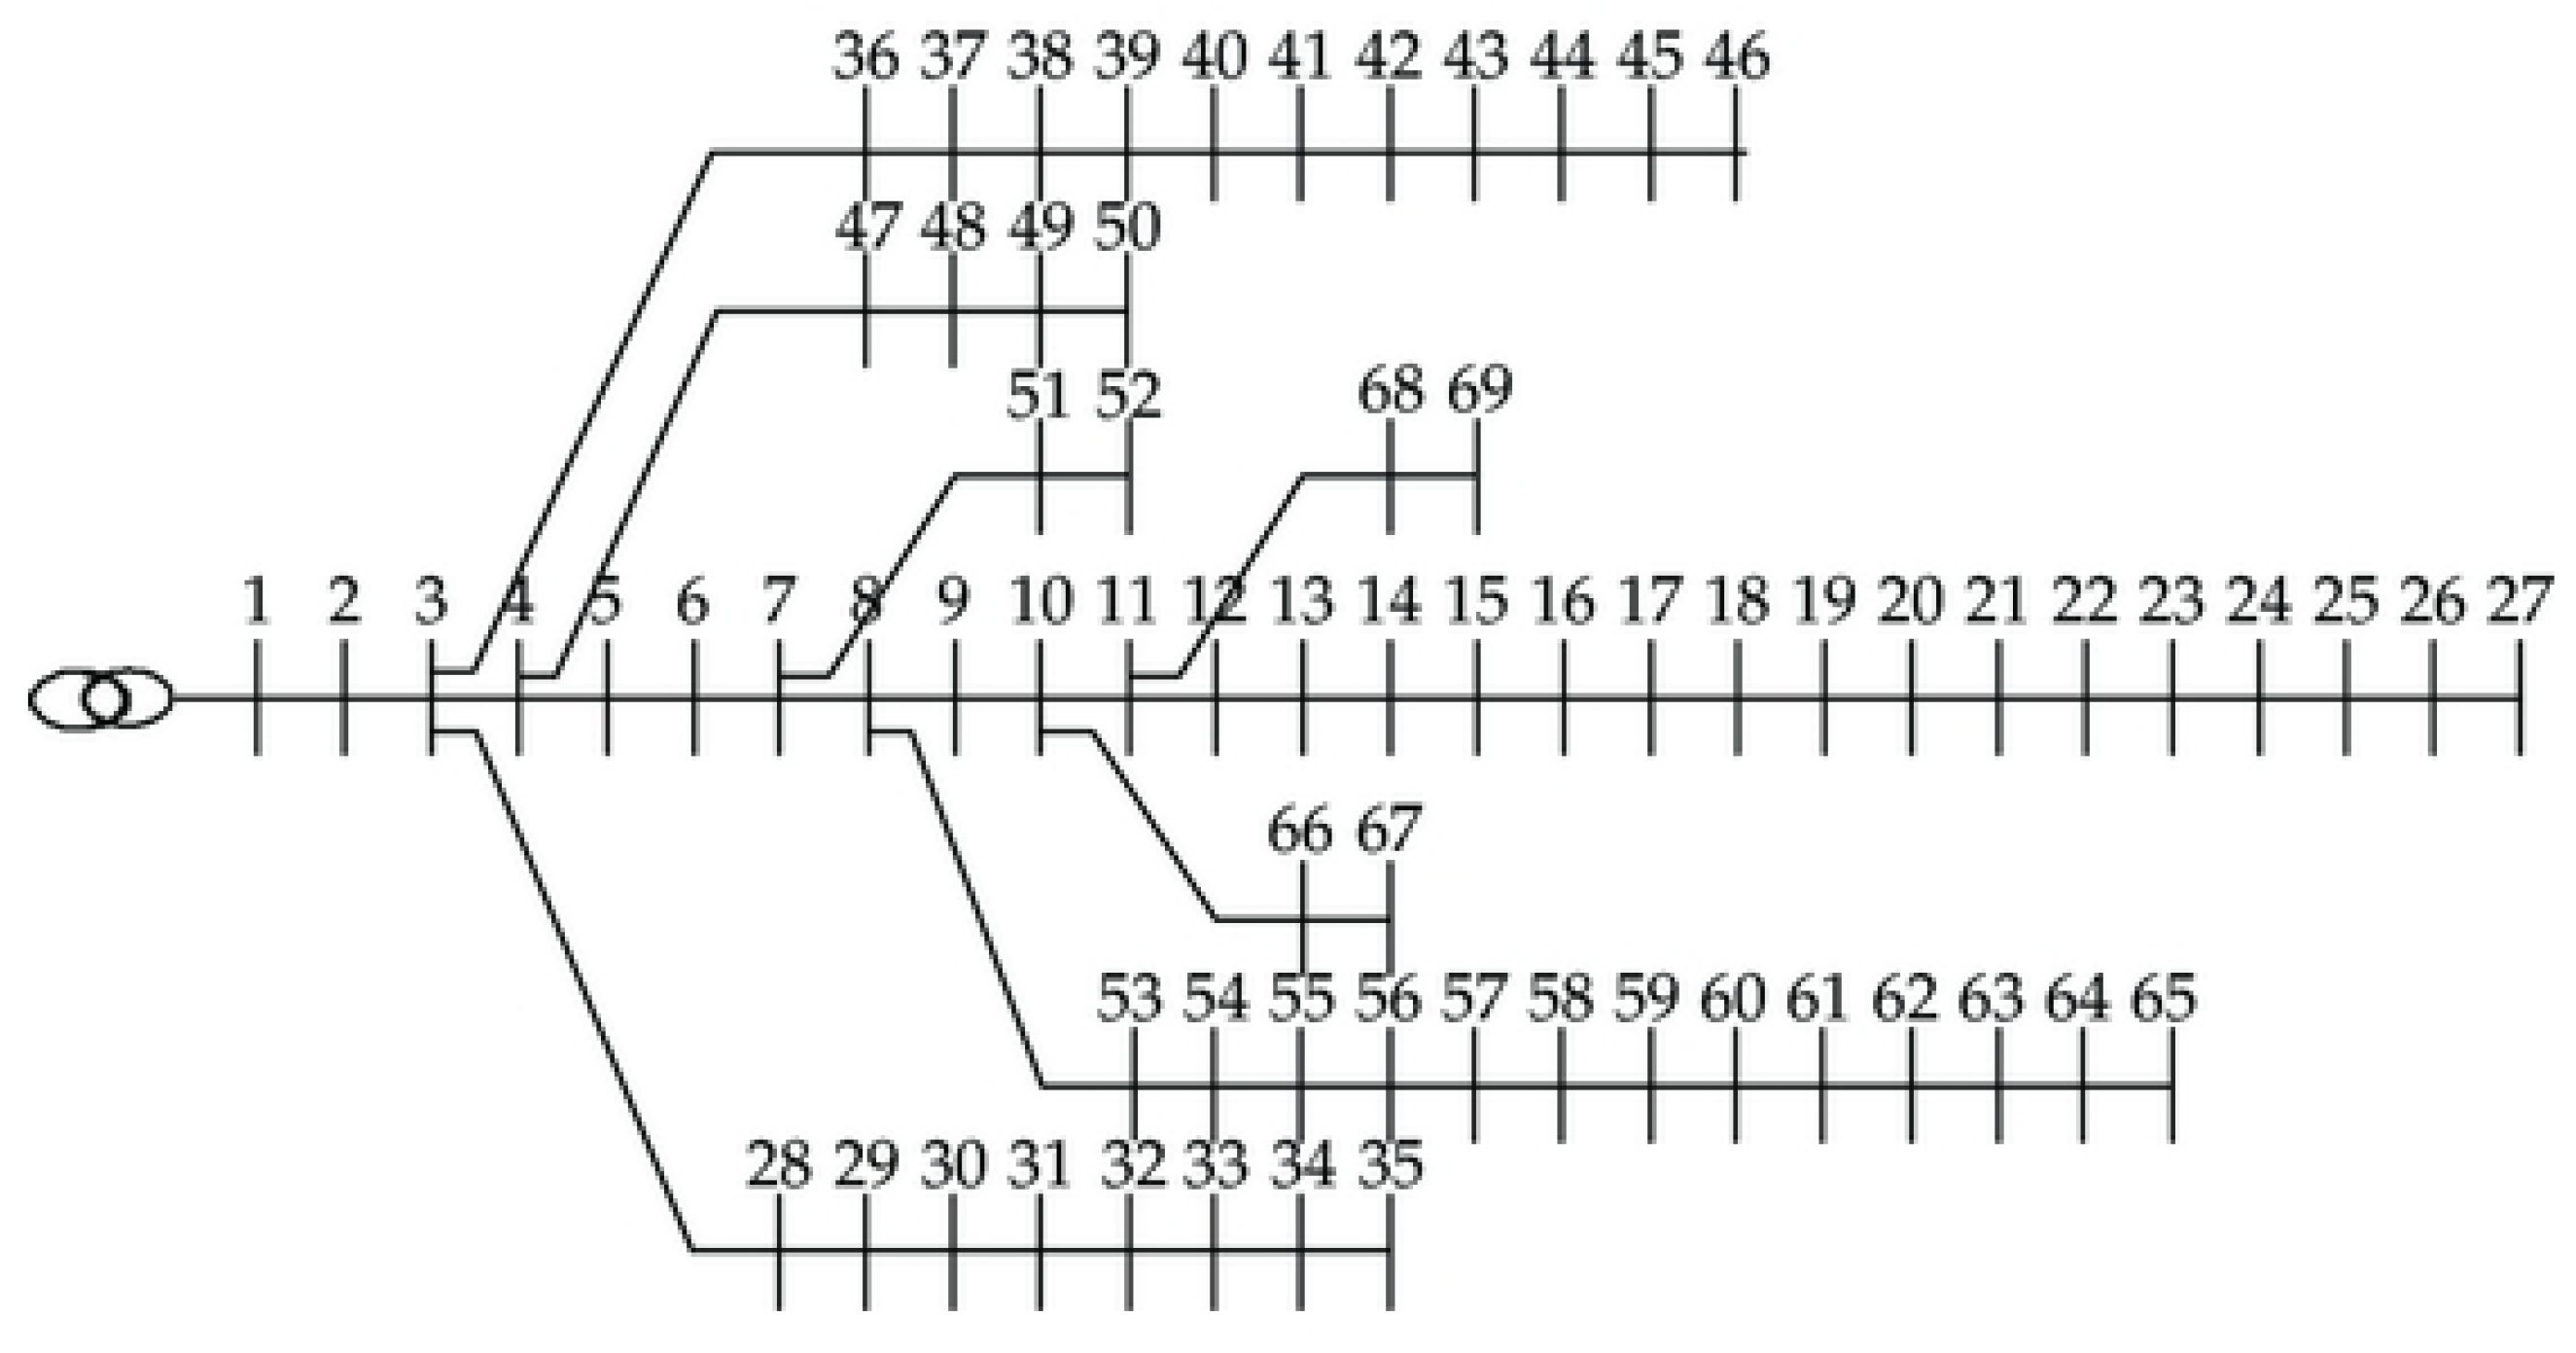
5.1. Description of Test Systems
5.2. Reduction Strategy for Uncertainty
5.2.1. Twenty-Seven Uncertainty Cases Reduction Strategy
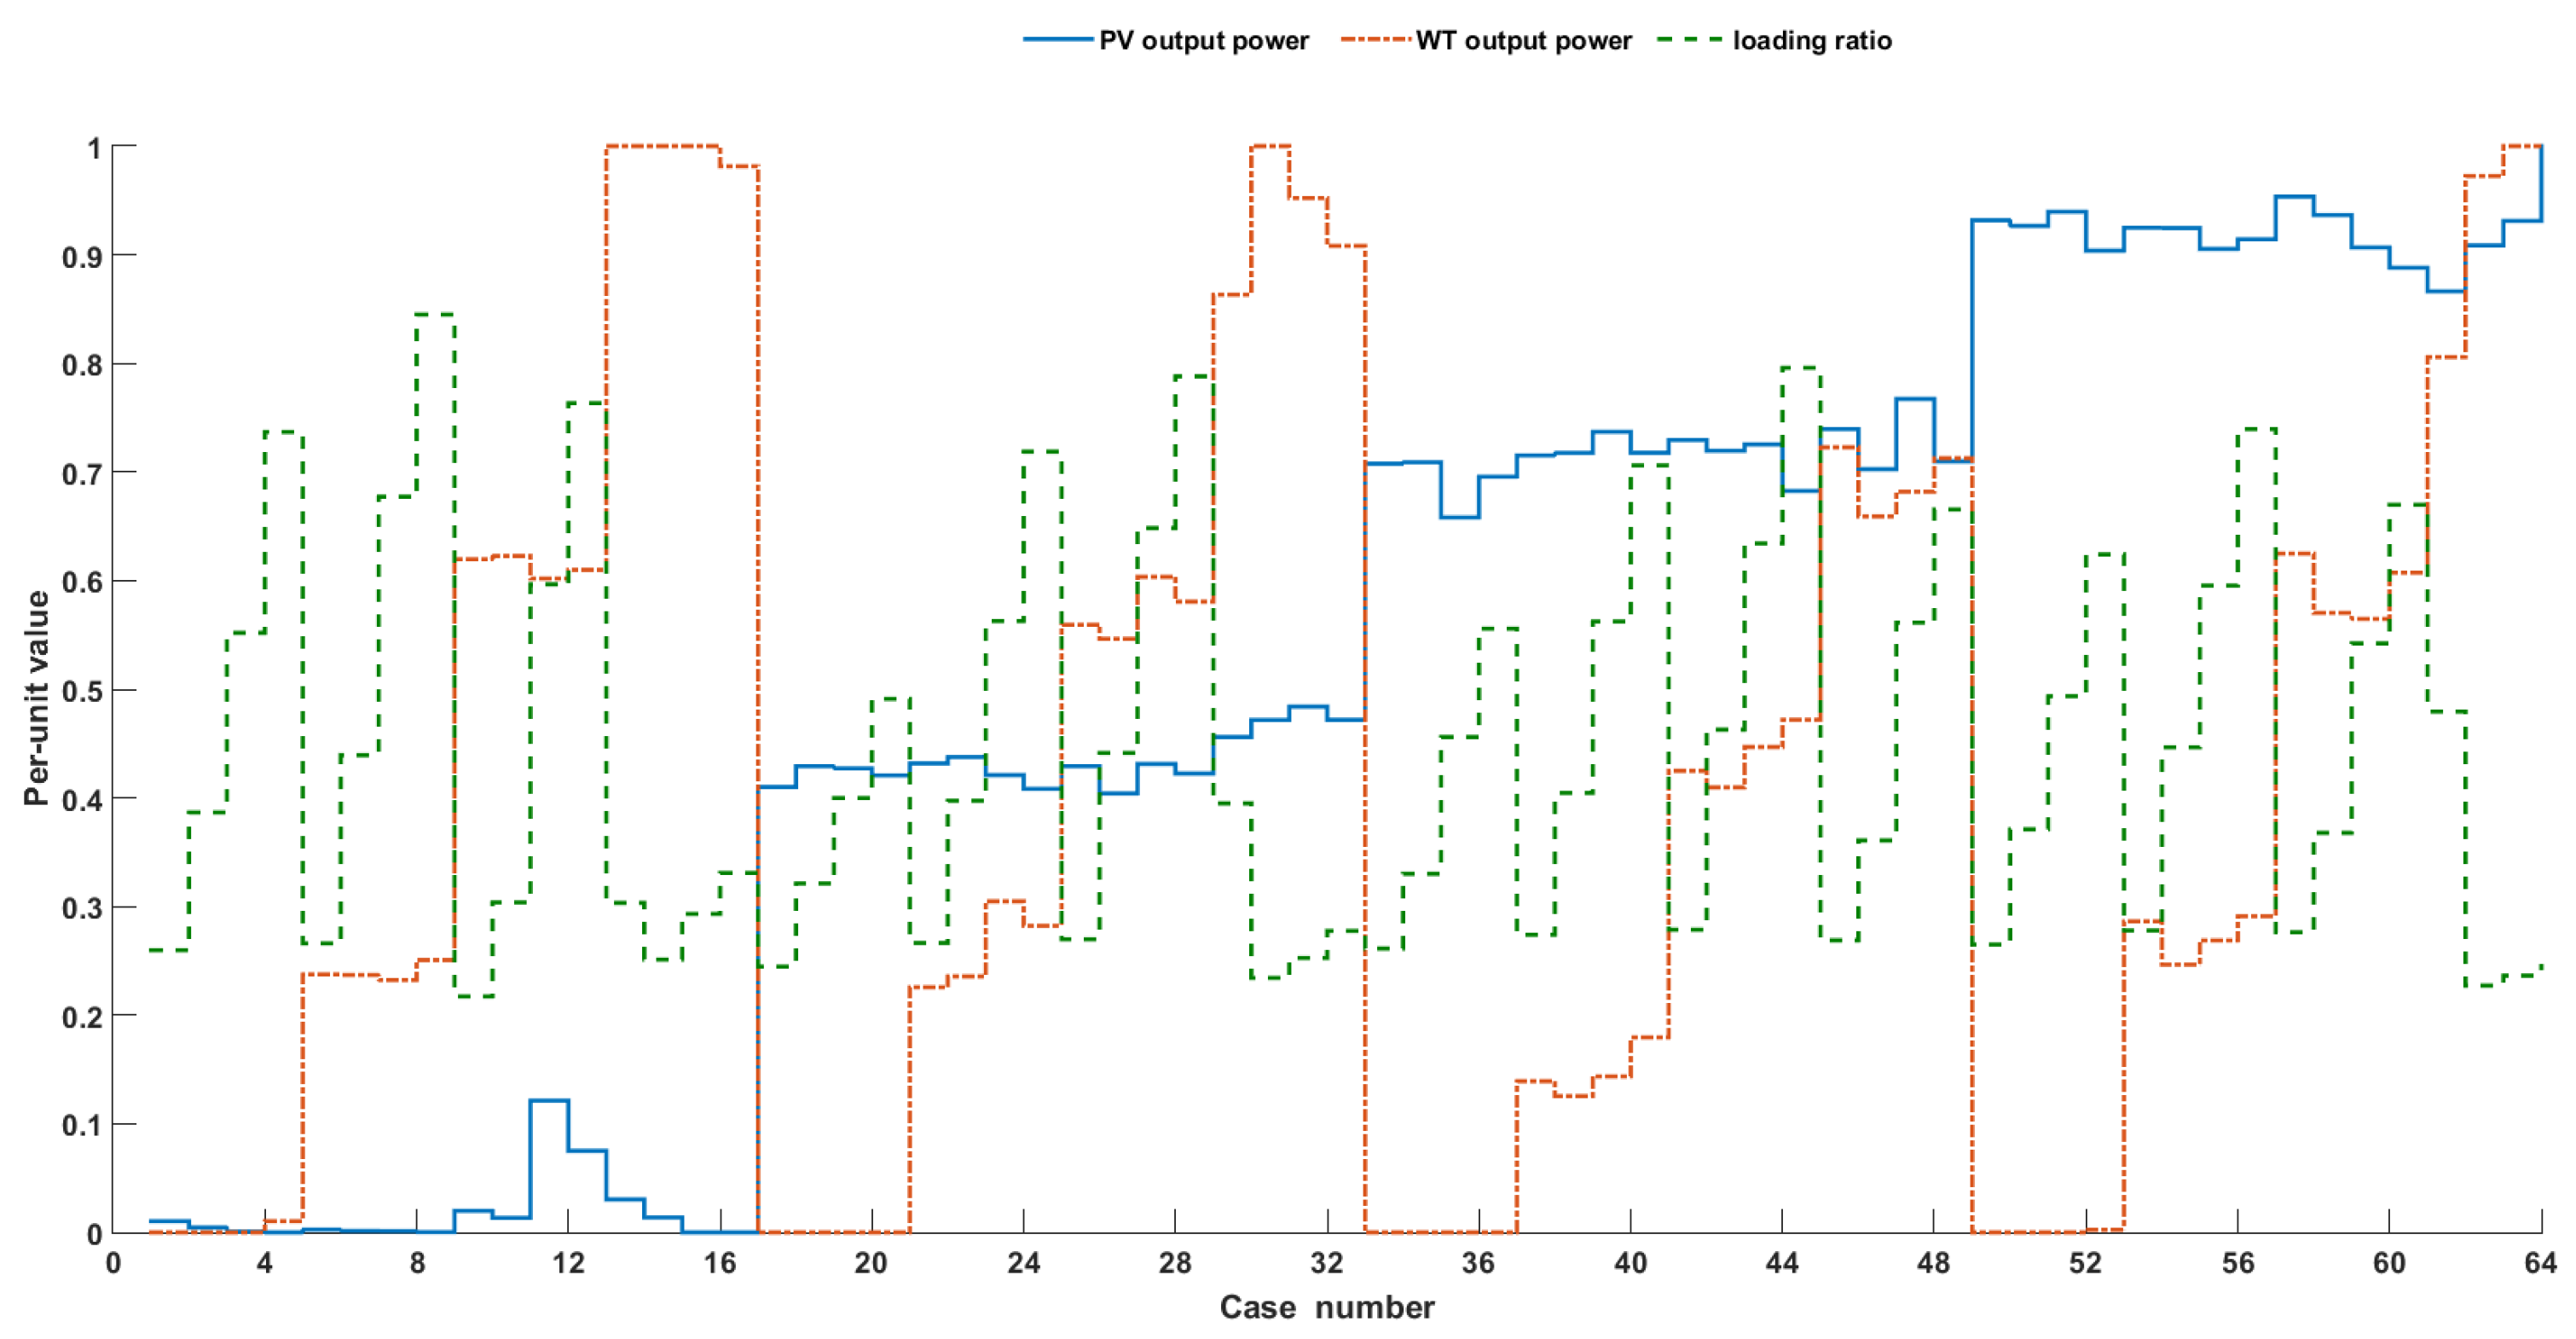
5.2.2. Sixty-Four Uncertainty Cases Reduction Strategy
5.2.3. Eighty-One Uncertainty Cases Reduction Strategy
5.3. Applications to Distribution Systems
6. Conclusions
Author Contributions
Funding
Institutional Review Board Statement
Informed Consent Statement
Data Availability Statement
Acknowledgments
Conflicts of Interest
References
- Gao, H.; Xu, S.; Liu, Y.; Wang, L.; Xiang, Y.; Liu, J. Decentralized optimal operation model for cooperative microgrids considering renewable energy uncertainties. Appl. Energy 2020, 262, 114579. [Google Scholar] [CrossRef]
- Yang, D.; Jiang, C.; Cai, G.; Yang, D.; Liu, X. Interval method based optimal planning of multi-energy microgrid with uncertain renewable generation and demand. Appl. Energy 2020, 277, 115491. [Google Scholar] [CrossRef]
- Ali, E.S.; El-Sehiemy, R.A.; El-Ela, A.; Adel, A.; Mahmoud, K.; Lehtonen, M.; Darwish, M.M. An Effective Bi-Stage Method for Renewable Energy Sources Integration into Unbalanced Distribution Systems Considering Uncertainty. Processes 2021, 9, 471. [Google Scholar] [CrossRef]
- Elsakaan, A.A.; El-Sehiemy, R.A.; Kaddah, S.S.; Elsaid, M.I. Optimal economic–emission power scheduling of RERs in MGs with uncertainty data. IET Gener. Transm. Distrib. 2020, 14, 37–52. [Google Scholar] [CrossRef]
- Xiaohui, Z.; Wenbo, G.; Jiaqing, Z. Decentralized Economic Dispatching of Multi-Micro Grid Considering Wind Power and Photovoltaic Output Uncertainty. IEEE Access 2021, 9, 104093–104103. [Google Scholar] [CrossRef]
- Shaheen, A.M.; Elattar, E.E.; El-Sehiemy, R.A.; Elsayed, A.M. An improved sunflower optimization algorithm-based Monte Carlo simulation for efficiency improvement of radial distribution systems considering wind power uncertainty. IEEE Access 2020, 9, 2332–2344. [Google Scholar] [CrossRef]
- Abou El-Ela, A.A.; El-Sehiemy, R.A.; Ali, E.S.; Kinawy, A.M. Minimisation of voltage fluctuation resulted from renewable energy sources uncertainty in distribution systems. IET Gener. Transm. Distrib. 2019, 13, 2339–2351. [Google Scholar] [CrossRef]
- Sakr, W.; Abd el Ghany, H.A.; EL-Sehiemy, R.A.; Azmy, A.M. A Day-ahead Optimal RERs Scheduling Approach for Virtual Power Plants Considering Different Loading Conditions. In Proceedings of the 2019 21st International Middle East Power Systems Conference (MEPCON), Cairo, Egypt, 17–19 December 2019; pp. 784–789. [Google Scholar]
- Zio, E.; Delfanti, M.; Giorgi, L.; Olivieri, V.; Sansavini, G. Monte Carlo simulation-based probabilistic assessment of DG penetration in medium voltage distribution networks. Int. J. Electr. Power Energy Syst. 2015, 64, 852–860. [Google Scholar] [CrossRef] [Green Version]
- Aien, M.; Rashidinejad, M.; Fotuhi-Firuzabad, M. On possibilistic and probabilistic uncertainty assessment of power flow problem: A review and a new approach. Renew. Sustain. Energy Rev. 2014, 37, 883–895. [Google Scholar] [CrossRef]
- Soroudi, A.; Ehsan, M. A possibilistic–probabilistic tool for evaluating the impact of stochastic renewable and controllable power generation on energy losses in distribution networks—A case study. Renew. Sustain. Energy Rev. 2011, 15, 794–800. [Google Scholar] [CrossRef] [Green Version]
- Bakhtiari, H.; Zhong, J.; Alvarez, M. Predicting the stochastic behavior of uncertainty sources in planning a stand-alone renewable energy-based microgrid using Metropolis–coupled Markov chain Monte Carlo simulation. Appl. Energy 2021, 290, 116719. [Google Scholar] [CrossRef]
- Zhao, Q.; Wang, P.; Goel, L.; Ding, Y. Evaluation of nodal reliability risk in a deregulated power system with photovoltaic power penetration. IET Gener. Transm. Distrib. 2013, 8, 421–430. [Google Scholar] [CrossRef]
- Arabali, A.; Ghofrani, M.; Etezadi-Amoli, M.; Fadali, M.S. Stochastic performance assessment and sizing for a hybrid power system of solar/wind/energy storage. IEEE Trans. Sustain. Energy 2013, 5, 363–371. [Google Scholar] [CrossRef]
- Hong, Y.Y.; Luo, Y.F. Optimal VAR control considering wind farms using probabilistic load-flow and gray-based genetic algorithms. IEEE Trans. Power Deliv. 2009, 24, 1441–1449. [Google Scholar] [CrossRef]
- Hong, Y.Y.; Lin, F.J.; Lin, Y.C.; Hsu, F.Y. Chaotic PSO-based VAR control considering renewables using fast probabilistic power flow. IEEE Trans. Power Deliv. 2013, 29, 1666–1674. [Google Scholar] [CrossRef]
- Moeini-Aghtaie, M.; Abbaspour, A.; Fotuhi-Firuzabad, M. Incorporating large-scale distant wind farms in probabilistic transmission expansion planning—Part I: Theory and algorithm. IEEE Trans. Power Syst. 2012, 27, 1585–1593. [Google Scholar] [CrossRef]
- Bie, Z.; Sun, C.; Ning, G.; Gao, Y. Adequacy evaluation of generating system recognizing random fuzzy wind speed. In Proceedings of the 2013 IEEE PES Asia-Pacific Power and Energy Engineering Conference (APPEEC), Hong Kong, China, 8–13 December 2013; pp. 1–5. [Google Scholar]
- Soroudi, A. Possibilistic-scenario model for DG impact assessment on distribution networks in an uncertain environment. IEEE Trans. Power Syst. 2012, 27, 1283–1293. [Google Scholar] [CrossRef] [Green Version]
- Ben-Tal, A.; El Ghaoui, L.; Nemirovski, A. Robust Optimization; Princeton University Press: Princeton, NJ, USA, 2009. [Google Scholar]
- Lorca, A.; Sun, X.A. Adaptive robust optimization with dynamic uncertainty sets for multi-period economic dispatch under significant wind. IEEE Trans. Power Syst. 2014, 30, 1702–1713. [Google Scholar] [CrossRef] [Green Version]
- Atwa, Y.M.; El-Saadany, E.F. Probabilistic approach for optimal allocation of wind-based distributed generation in distribution systems. IET Renew. Power Gener. 2011, 5, 79–88. [Google Scholar] [CrossRef]
- Rabiee, A.; Mohseni-Bonab, S.M. Maximizing hosting capacity of renewable energy sources in distribution networks: A multi-objective and scenario-based approach. Energy 2017, 120, 417–430. [Google Scholar] [CrossRef]
- Capitanescu, F.; Ochoa, L.F.; Margossian, H.; Hatziargyriou, N.D. Assessing the potential of network reconfiguration to improve distributed generation hosting capacity in active distribution systems. IEEE Trans. Power Syst. 2014, 30, 346–356. [Google Scholar] [CrossRef]
- Ehsan, A.; Cheng, M.; Yang, Q. Scenario-based planning of active distribution systems under uncertainties of renewable generation and electricity demand. CSEE J. Power Energy Syst. 2019, 5, 56–62. [Google Scholar] [CrossRef]
- Chen, B.; Wang, J.; Wang, L.; He, Y.; Wang, Z. Robust optimization for transmission expansion planning: Minimax cost vs. minimax regret. IEEE Trans. Power Syst. 2014, 29, 3069–3077. [Google Scholar] [CrossRef]
- Taha, A.F.; Bazrafshan, M.; Nugroho, S.A.; Gatsis, N.; Qi, J. Robust control for renewable-integrated power networks considering input bound constraints and worst case uncertainty measure. IEEE Trans. Control Netw. Syst. 2019, 6, 1210–1222. [Google Scholar] [CrossRef] [Green Version]
- Zakaria, A.; Ismail, F.B.; Lipu, M.H.; Hannan, M.A. Uncertainty models for stochastic optimization in renewable energy applications. Renew. Energy 2020, 145, 1543–1571. [Google Scholar] [CrossRef]
- Adefarati, T.; Bansal, R. Reliability and economic assessment of a microgrid power system with the integration of renewable energy resources. Appl. Energy 2017, 206, 911–933. [Google Scholar] [CrossRef]
- Chenouard, R.C.; El-Sehiemy, R.A. An interval branch and bound global optimization algorithm for parameter estimation of three photovoltaic models. Energy Convers. Manag. 2020, 205, 112400. [Google Scholar] [CrossRef]
- El-Dabah, M.A.; El-Sehiemy, R.; Becherif, M.; Ebrahim, M.A. Parameter estimation of triple diode photovoltaic model using an artificial ecosystem-based optimizer. Int. Trans. Electr. Energy Syst. 2021, 13, e13043. [Google Scholar] [CrossRef]
- Said, M.S.; Shaheen, A.M.; Ginidi, A.R.; El-Sabbe, A.E. Estimating Parameters of Photovoltaic Models Using Accurate Turbulent Flow of Water Optimizer. Processes 2021, 9, 627. [Google Scholar] [CrossRef]
- Abaza, A.; Fawzy, A.; El-Sehiemy, R.A.; Alghamdi, A.S.; Kamel, S. Sensitive reactive power dispatch solution accomplished with renewable energy allocation using an enhanced coyote optimization algorithm. Ain Shams Eng. J. 2021, 12, 1723–1939. [Google Scholar] [CrossRef]
- Ginidi, R.A.; Shaheen, A.M.; Ginidi, A.R.; El-Sehiemy, R.A.; Elattar, R.A. Supply demand optimization algorithm for parameter extraction of various solar cell models. Energy Rep. 2021, 7, 5772–5794. [Google Scholar] [CrossRef]
- Bayoumi, A.S.; El-Sehiemy, R.A.; Mahmoud, K.; Lehtonen, M.; Darwish, M.M. Assessment of an improved three-diode against modified two-diode patterns of MCS solar cells associated with soft parameter estimation paradigms. Appl. Sci. 2021, 11, 1055. [Google Scholar] [CrossRef]
- Zaky, A.A.; Ibrahim, M.N.; Rezk, H.; Christopoulos, E.; El Sehiemy, R.A.; Hristoforou, E.; Kladas, E.; Sergeant, P.; Falaras, P. Energy efficiency improvement of water pumping system using synchronous reluctance motor fed by perovskite solar cells. Int. J. Energy Res. 2020, 44, 11629–11642. [Google Scholar] [CrossRef]
- Oliva, D.; Abd El Aziz, M.; Hassanien, A.E. Parameter estimation of photovoltaic cells using an improved chaotic whale optimization algorithm. Appl. Energy 2017, 200, 141–154. [Google Scholar] [CrossRef]
- Ramadan, A.R.; Ebeed, M.E.; Kamel, S.K.; Nasrat, L.N. Optimal allocation of renewable energy resources considering uncertainty in load demand and generation. In Proceedings of the 2019 IEEE Conference on Power Electronics and Renewable Energy (CPERE), Aswan, Egypt, 23–25 October 2019; pp. 124–128. [Google Scholar]
- Abbas, A.S.; El-Sehiemy, R.A.; El-Ela, A.; Ali, E.S.; Mahmoud, K.; Lehtonen, M.; Darwish, M.M. Optimal Harmonic Mitigation in Distribution Systems with Inverter Based Distributed Generation. Appl. Sci. 2021, 11, 774. [Google Scholar] [CrossRef]
- Bai, L.; Li, F.; Cui, H.; Jiang, T.; Sun, H.; Zhu, J. Interval optimization based operating strategy for gas-electricity integrated energy systems considering demand response and wind uncertainty. Appl. Energy 2016, 167, 270–279. [Google Scholar] [CrossRef] [Green Version]
- Waly, H.M.; Azazi, H.Z.; Osheba, D.S.; El-Sabbe, A.E. Parameters extraction of photovoltaic sources based on experimental data. IET Renew. Power Gener. 2019, 13, 1466–1473. [Google Scholar] [CrossRef]


| System | 69-Bus | 118-Bus | ||||||||
|---|---|---|---|---|---|---|---|---|---|---|
| Plant type | PV | WT | PV | WT | ||||||
| Place | 61 | 46 | 18 | 47 | 4 | 74 | 93 | 24 | 40 | 69 |
| Nunits (PV modules or wind turbines ) | 2000 | 1000 | 30 | 100 | 2000 | 1000 | 100 | 40 | 80 | 70 |
| Parameter | A) | A) | a1 | a2 | |||
| value | 0.5593 | 23.6471 | 9.9664 | 4.3606 | 8 | 1.5 | 2 |
| Parameter | (m/s) | (m/s) | (m/s) | (KW) |
| value | 3 | 25 | 10 | 11 |
| System | Modeling Method | ||||
|---|---|---|---|---|---|
| 69-bus | All year data | 0.8784 | 1.0446 | 2.5543 | 108.1319 |
| 81 cases | 0.9063 | 1.0445 | 2.4597 | 99.7397 | |
| 27 cases | 0.9121 | 1.0368 | 2.6527 | 88.7837 | |
| 64 cases | 0.8995 | 1.0468 | 2.6776 | 97.3506 | |
| 118-bus | All year data | 0.8760 | 1.0286 | 1.2142 | 217.2986 |
| 81 cases | 0.9058 | 1.0277 | 1.1743 | 193.3500 | |
| 27 cases | 0.9091 | 1.0228 | 1.1663 | 180.8850 | |
| 2-6 | 64 cases | 0.8981 | 1.0283 | 1.1776 | 192.2738 |
| System | Modeling Method | ||||
|---|---|---|---|---|---|
| 69-bus | All year data | - | - | - | - |
| 81 cases | 3.1742 | 0.0161 | 3.7059 | 7.7610 | |
| 27 cases | 3.8372 | 0.7440 | 3.8518 | 17.8932 | |
| 64 cases | 2.3998 | 0.2108 | 4.8266 | 9.9705 | |
| 118-bus | All year data | - | - | - | - |
| 81 cases | 3.4042 | 0.0861 | 3.2889 | 11.0210 | |
| 27 cases | 3.7788 | 0.5623 | 3.9425 | 16.7574 | |
| 64 cases | 2.5230 | 0.0262 | 3.0167 | 11.5163 |
Publisher’s Note: MDPI stays neutral with regard to jurisdictional claims in published maps and institutional affiliations. |
© 2022 by the authors. Licensee MDPI, Basel, Switzerland. This article is an open access article distributed under the terms and conditions of the Creative Commons Attribution (CC BY) license (https://creativecommons.org/licenses/by/4.0/).
Share and Cite
Ali, E.S.; El-Sehiemy, R.A.; Abou El-Ela, A.A.; Tostado-Véliz, M.; Kamel, S. A Proposed Uncertainty Reduction Criterion of Renewable Energy Sources for Optimal Operation of Distribution Systems. Appl. Sci. 2022, 12, 623. https://0-doi-org.brum.beds.ac.uk/10.3390/app12020623
Ali ES, El-Sehiemy RA, Abou El-Ela AA, Tostado-Véliz M, Kamel S. A Proposed Uncertainty Reduction Criterion of Renewable Energy Sources for Optimal Operation of Distribution Systems. Applied Sciences. 2022; 12(2):623. https://0-doi-org.brum.beds.ac.uk/10.3390/app12020623
Chicago/Turabian StyleAli, Eman S., Ragab A. El-Sehiemy, Adel A. Abou El-Ela, Marcos Tostado-Véliz, and Salah Kamel. 2022. "A Proposed Uncertainty Reduction Criterion of Renewable Energy Sources for Optimal Operation of Distribution Systems" Applied Sciences 12, no. 2: 623. https://0-doi-org.brum.beds.ac.uk/10.3390/app12020623