Article

Achieving Electrochemical-Sustainable-Based Solutions for Monitoring and Treating Hydroxychloroquine in Real Water Matrix

by
Danyelle Medeiros de Araújo
1,
Elisama V. Dos Santos
1,2,
Carlos A. Martínez-Huitle
1,2,* and
Achille De Battisti
3,*
1
Laboratório de Eletroquímica Ambiental e Aplicada, Instituto de Química, Universidade Federal do Rio Grande do Norte, Lagoa Nova, Natal 59072-900, Brazil
2
National Institute for Alternative Technologies of Detection, Toxicological Evaluation and Removal of Micropollutants and Radioactives (INCT-DATREM), Institute of Chemistry, Universidade Estadual Paulista, P.O. Box 355, Araraquara 14800-900, Brazil
3
Department of Chemistry, University of Ferrara, Via Luigi Borsari 46, 44121 Ferrara, Italy
*
Authors to whom correspondence should be addressed.
Submission received: 31 October 2021 / Revised: 4 January 2022 / Accepted: 7 January 2022 / Published: 11 January 2022
(This article belongs to the Special Issue Electrochemical Technologies in Water and Wastewater Treatment)

Abstract

:
Hydroxychloroquine (HCQ) has been extensively consumed due to the Coronavirus (COVID-19) pandemic. Therefore, it is increasingly found in different water matrices. For this reason, the concentration of HCQ in water should be monitored and the treatment of contaminated water matrices with HCQ is a key issue to overcome immediately. Thus, in this study, the development of technologies and smart water solutions to reach the Sustainable Development Goal 6 (SDG6) is the main objective. To do that, the integration of electrochemical technologies for their environmental application on HCQ detection, quantification and degradation was performed. Firstly, an electrochemical cork-graphite sensor was prepared to identify/quantify HCQ in river water matrices by differential pulse voltammetric (DPV) method. Subsequently, an HCQ-polluted river water sample was electrochemically treated with BDD electrode by applying 15, 30 and 45 mA cm−2. The HCQ decay and organic matter removal was monitored by DPV with composite sensor and chemical oxygen demand (COD) measurements, respectively. Results clearly confirmed that, on the one hand, the cork-graphite sensor exhibited good current response to quantify of HCQ in the river water matrix, with limit of detection and quantification of 1.46 mg L−1 (≈3.36 µM) and 4.42 mg L−1 (≈10.19 µM), respectively. On the other hand, the electrochemical oxidation (EO) efficiently removed HCQ from real river water sample using BDD electrodes. Complete HCQ removal was achieved at all applied current densities; whereas in terms of COD, significant removals (68%, 71% and 84% at 15, 30 and 45 mA cm−2, respectively) were achieved. Based on the achieved results, the offline integration of electrochemical SDG6 technologies in order to monitor and remove HCQ is an efficient and effective strategy.

1. Introduction

On 11 March 2020, the World Health Organization (WHO) declared COVID-19 a pandemic. This infectious disease is caused by a new strain of CoV, a mutation (ID-19) of its two previous forms and is called SARS-CoV-2 or CoV-19 [1]. During the pandemic of COVID-19, national and international medical organizations around the world treated or alleviated symptoms, in certain hospitalized patients, by using some drugs such as chloroquine, HCQ, azithromycin, ivermectin, dexamethasone, remdesivir, favipiravir and some HIV antivirals [2]. However, the possible use of some of them to treat COVID-19 is only an unproven hypothesis, such as the case of chloroquine and HCQ [3].
In some countries, the use of some of these drugs on large scale during the pandemic was reported, for example, in Italy [4] and Brazil [5]. Consequently, the high risk of water contamination due to their large production and utilization is a key issue to overcome urgently. Sometimes these drugs are not completely metabolized by the body, and their active forms or metabolites can be eliminated through feces and urine [6]. After that, these compounds reach the sewage system when discharged. At that point, some limitations are found in their elimination from water treatment plants which mostly rely on conventional treatment systems in industrialized countries, but it is different in developing nations since they are under different pressures where the pollutants are not efficiently treated or have limitations in the removal of these compounds, provoking environmental and health risks [7,8,9,10,11].
In Brazil, HCQ was included in COVID-19 kits together with ivermectin and azithromycin, as a pre-treatment option [12]. Recent studies have demonstrated that HCQ is present in Brazilian water ecosystems, confirming its high persistence and bioaccumulation in vegetation and groundwater [13]. Therefore, it has motived some investigations to develop sensors for quantifying and monitoring HCQ to determine its potential as contaminant as well as the search for an effective approach to remove this micropollutant from wastewaters before its discharge in water ecosystems [14].
Based on the existing literature, the treatment of different water matrices (synthetic or real) containing HCQ has been carried out by photolysis [15], adsorption [16,17], photocatalysis [18] and electrochemical technologies (electrooxidation (EO), photo-assisted EO and sono-assisted EO) using boron doped diamond (BDD) [19]. However, no real matrices polluted with HCQ were treated in the case of electrochemical treatments.
Considering that several research groups are evaluating the treatment effectiveness of certain technologies by polluting in laboratory different water matrices (e.g., river, sea, groundwater, tap water, drinking water and so on) with a well-known amount of a single target pollutant for understanding the experimental data in order to translate to real applications [20]. Then, this work aims to electrochemically treat a real water matrix polluted with HCQ. To do that, (i) real water samples were collected and preserved, (ii) identification and quantification of HCQ in these water samples was spectrophotometrically and electroanalytically performed and (iii) EO approach in a batch reactor with BDD anode was tested to decontaminate a real water matrix.
In a previous work, the use of the cork-graphite composite as electrochemical sensor for quantifying HCQ in real water matrices [14] was demonstrated, confirming HCQ pollution in lagoon water. However, the possibility to integrate technologies as an appropriate water depollution solution to eliminate HCQ from a real water matrix was not proven yet. Therefore, the development of technologies and smart water solutions to reach the Sustainable Development Goal 6 (SDG6) represent a substantial opportunity to guarantee sustainability and increase competence in water management (to treat and distribute water for human use) [21]. The possibility to integrate SDG6-based electrochemical technologies [22], which have been developed until now, for identifying, quantifying, eliminating and monitoring HCQ in/from real water samples represents a clear benefit for our society, offering a coherent vision for the future [23].

2. Materials and Methods

The highest quality commercially available chemicals were used. HCQ sulfate (purity 99%) and graphite powder were purchased from Sigma-Aldrich (São Paulo, Brazil). H2SO4 was purchased from Merck (São Paulo, Brazil). Specific solutions were prepared using ultra-purified water obtained from a Milli-Q system (Millipore, Natal, Brazil). The raw cork that was used in the experimental studies was provided by Corticeira Amorim S.G.P.S., S.A. (Porto, Portugal). The raw cork granules were washed twice with distilled water for 2 h at 60 °C to remove impurities and other water extractable components that could interfere with the electrochemical analysis. Before use, the raw cork was dried at 60 °C in an oven for 24 h [24].

2.1. Preparation of Cork-Modified Electrodes

The raw cork granules were reduced in size; a fraction below 150 µm (designated as raw cork powder) was selected for constructing the sensor in this work, according to our previous work [24]. The cork–graphite composite sensor (working electrode) was prepared by mechanical homogenization of raw cork powder and graphite in proportions of 70:30% w/w, using 0.3 mL of paraffin oil as a binder and mixing everything in an agate mortar for about 30 min, as previously reported [14].

2.2. Electrochemical Measurements

The electrochemical tests were performed using an Autolab PGSTAT302N (Metrohm, Zurich, Switzerland) that was controlled with GPES software (4.0) and consisted of a three-electrode cell, using Ag/AgCl (3.0 M KCl), Pt wire and a cork–graphite sensor (geometrical area of approximately 0.45 mm2, while a real area of 116 mm2, which was estimated by procedure in [25]) as the reference, auxiliary and working electrodes, respectively. Differential pulse voltammetry (DPV) parameters were as follows—modulation time: (≥0.002 s), 0.05 s; interval time: (≥0.10 s), 0.5 s; initial potential: 1.0 V; final potential: 1.7 V; step potential: 0.00495 V; modulation amplitude: 0.01995 V; potential scan rate: 100 mV s−1; and agitation time: 30 s. The optimized parameters were used for all measurements [14]. All analyses were performed in triplicate. All electrochemical analyses were conducted without deaeration, at 25 ± 2 °C. For the identification/determination of HCQ in river water matrices, firstly, the electrochemical sensor’s response, in terms of current, was verified by constructing an analytical curve in river water samples. Secondly, the HCQ concentration in HCQ-polluted river water sample was electrochemically treated and the HCQ concentration was determined, at collected electrolysis times, using the standard addition method, where the samples were spiked with a known quantity of a standard solution of HCQ, as it is recommended for diminishing the matrix effect on the current-response sensibility [14]. Potentiodynamic measurements (polarization curves and cyclic voltammetry) were also carried out at 25 °C in the conventional cell described above with BDD as working electrode. The exposed apparent area of the working electrodes was 1.5 cm2.

2.3. Real Samples of River

River water samples were collected at the river located in Natal (5°56′56.1″ S 35°10′18.4″ W), Rio Grande do Norte (Brazil). After that, these were acidified to avoid their decomposition and stored at 4 °C until its use. The main physical–chemical characteristics of the real samples used in this work are shown in Table 1.

2.4. Electrochemical Treatment

All electrolysis experiments were conducted in an undivided reactor of 250 mL of capacity that was equipped with magnetic stirring to ensure homogenization and mass transport towards electrodes. Experiments were conducted under galvanostatic conditions with a power supply MINIPA MPL–3305 M triple power DC generator to apply 15, 30 and 45 mA cm−2 as applied current density (j) values. Two electrodes were placed at the center of the reactor with an electrode distance of ≈2 cm (BDD and Ti electrodes were used as anode and cathode, respectively, with a geometric area of 13.5 cm2). The characteristics of the BDD are as follows: 225 sp3/sp2 ratio; 500 mg L−1 boron content; and a diamond layer of 2.68 μm thickness. All BDD-electrolysis were performed for 120 min and were conducted in triplicate. The EO efficiency for degrading HCQ was studied by using 250 mL of polluted river water plus 10 mL of 0.1 M of H2SO4 as supporting electrolyte, which is the volume used to acidify the sample and maintain its physical–chemical conditions. Samples were withdrawn at predetermined time intervals for quantifying HCQ with the cork-graphite sensor during its electrochemical treatment. Chemical oxygen demand (COD), NO3 ammonium and free chlorine were also determined by using HANNA commercial kits.
Additionally, during EO, it was possible to estimate the total current efficiency (TCE) (in %) for the treated solutions at a given electrolysis time (in s) from the COD values, using the following Equation (1) [26]:
TCE   ( % ) = ( Δ ( COD ) exp × F × V s 8 × I × t ) × 100
where Δ(COD)exp is the experimental COD difference between the initial COD and COD at time t, F is the Faraday constant (96,487 C mol−1), Vs is the solution volume (L), I is the applied current (A), 8 is the equivalent mass of oxygen (g eq−1), t is time (s) and Δt is the electrolysis is time interval (s).
Afterwards, the energy consumption (EC) was estimated by Equation (2) in terms of kWh kgCOD−1 [26,27] with the average cell voltage registered during the EO (cell voltage being reasonably constant with just some minor fluctuations; for this reason, the average cell voltage was estimated),
EC / KWh   m 3 = ( E cell × I × t V )
where Ecell is the average potential difference of the cell (V) and t is the BDD-electrolysis duration in h.

3. Results and Discussion

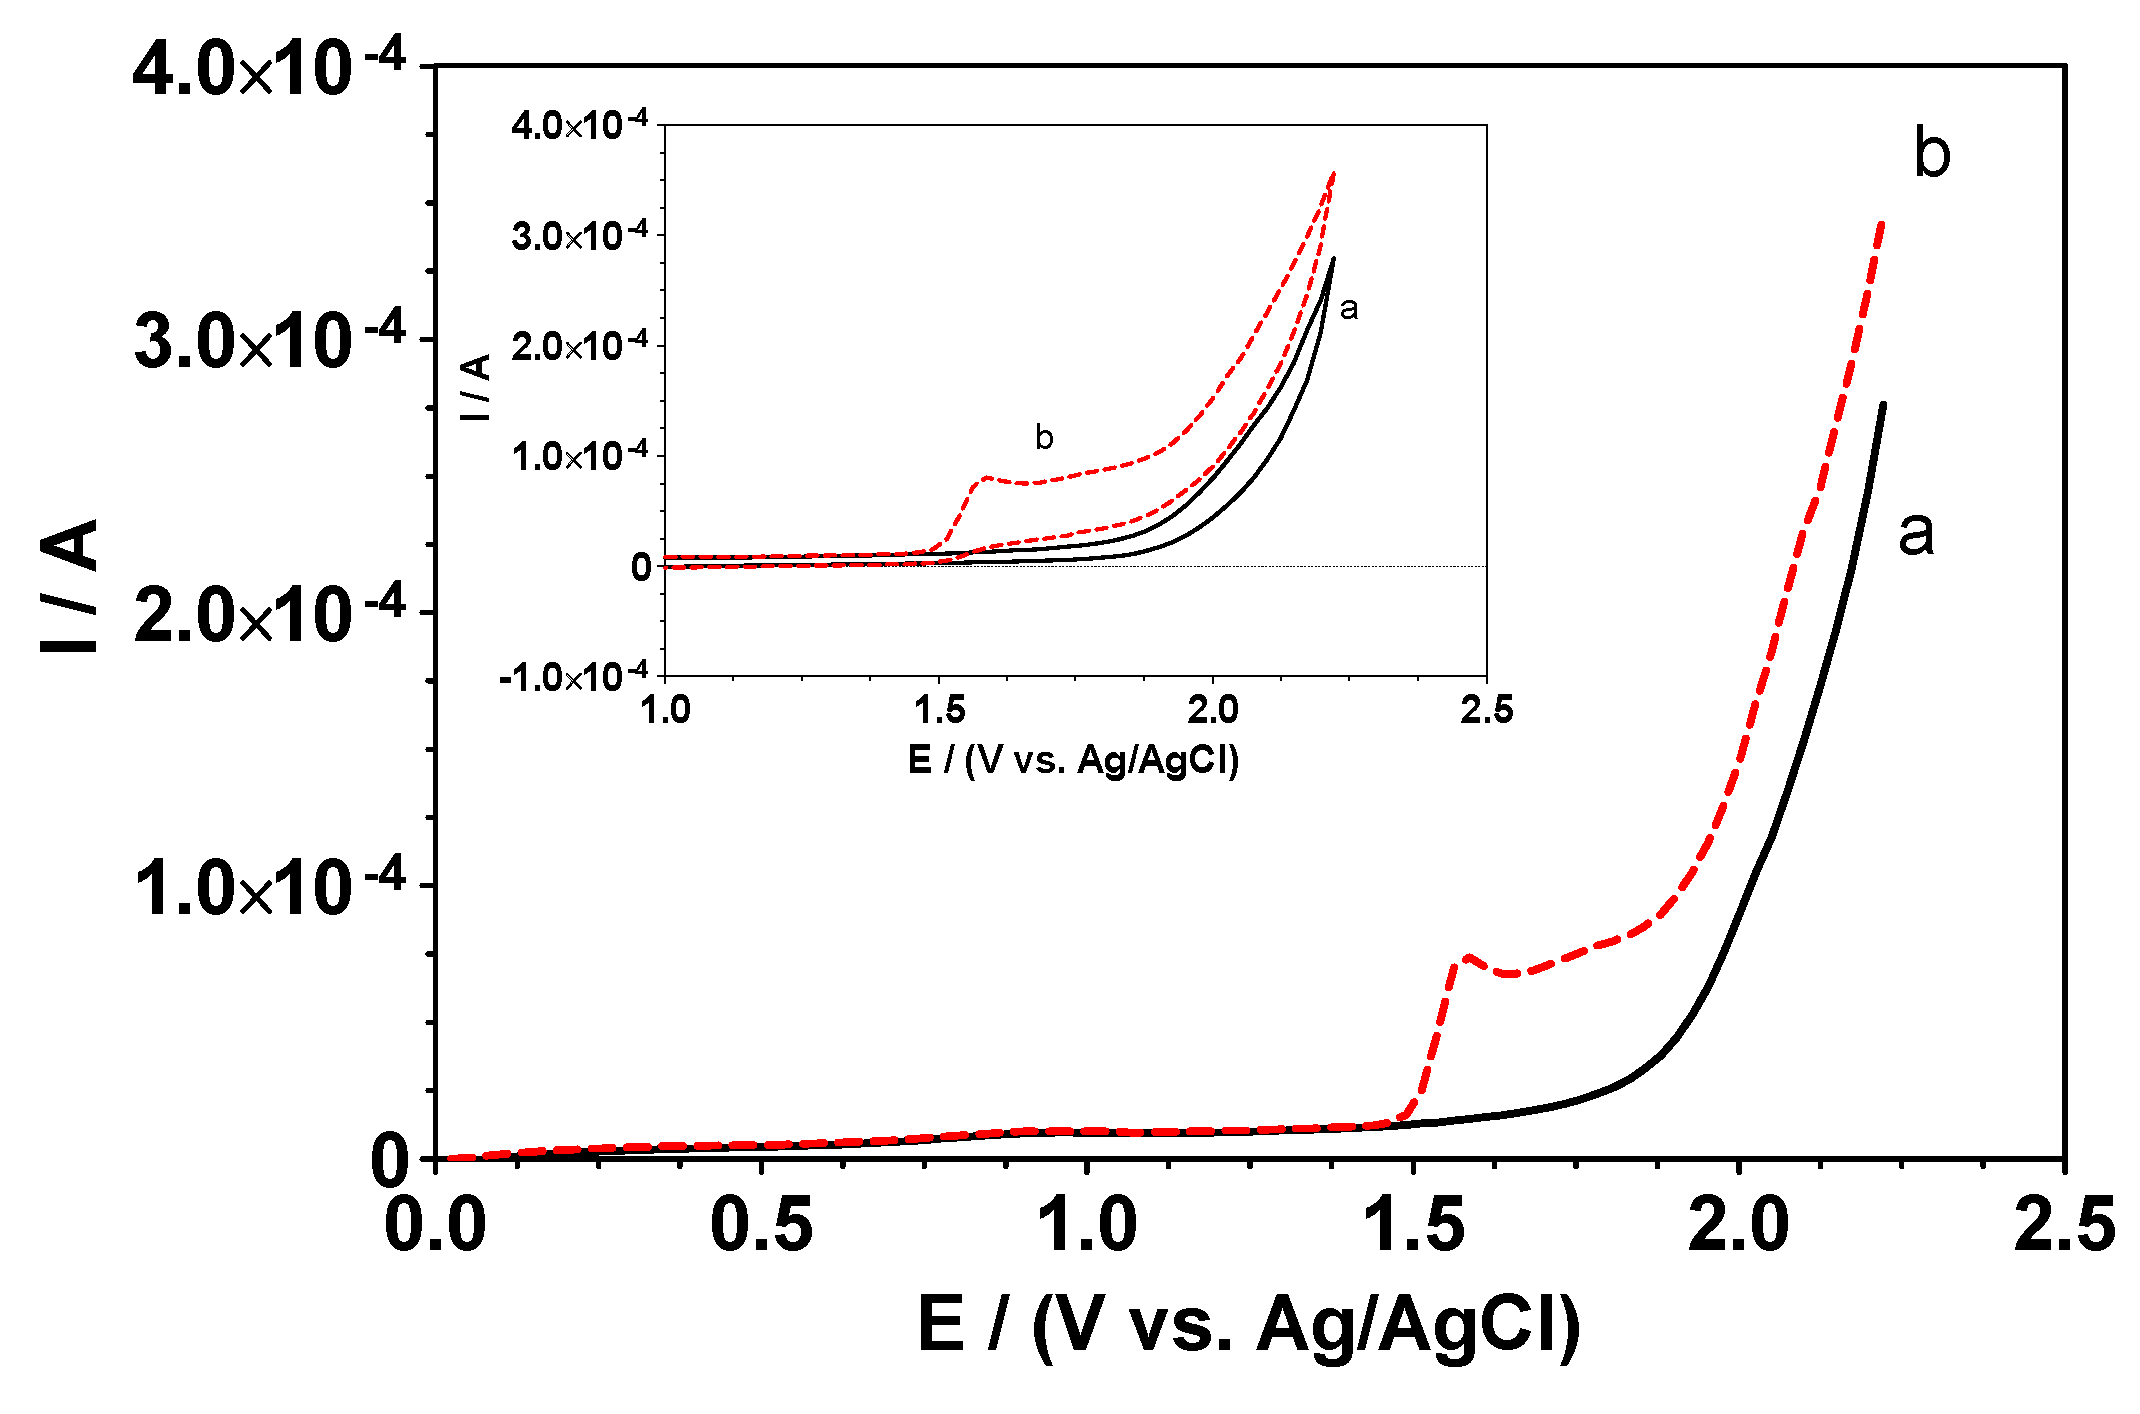
3.1. Identification of the Presence of HCQ in River Water Samples

Collected samples were spectrophotometrically analyzed to identify the HCQ presence in river water according the procedure reported in [14]. From the results obtained (see Table 1), it was possible to confirm the presence of HCQ in a river water sample, which was denominated as “polluted”, with approximately 26.7 mg L−1. Meanwhile, no significant HCQ concentration was determined in another river water sample, which was considered as “non-polluted”. Thus, both samples were used to electrochemically investigate:
(i)
The matrix effect during the analytical curve construction with composite sensor using non-polluted river water sample;
(ii)
The validation of HCQ concentration in polluted river water with DPV by using cork-graphite sensor and;
(iii)
The possibility to integrate technologies as an appropriate water depollution solution to eliminate HCQ from real water matrices.

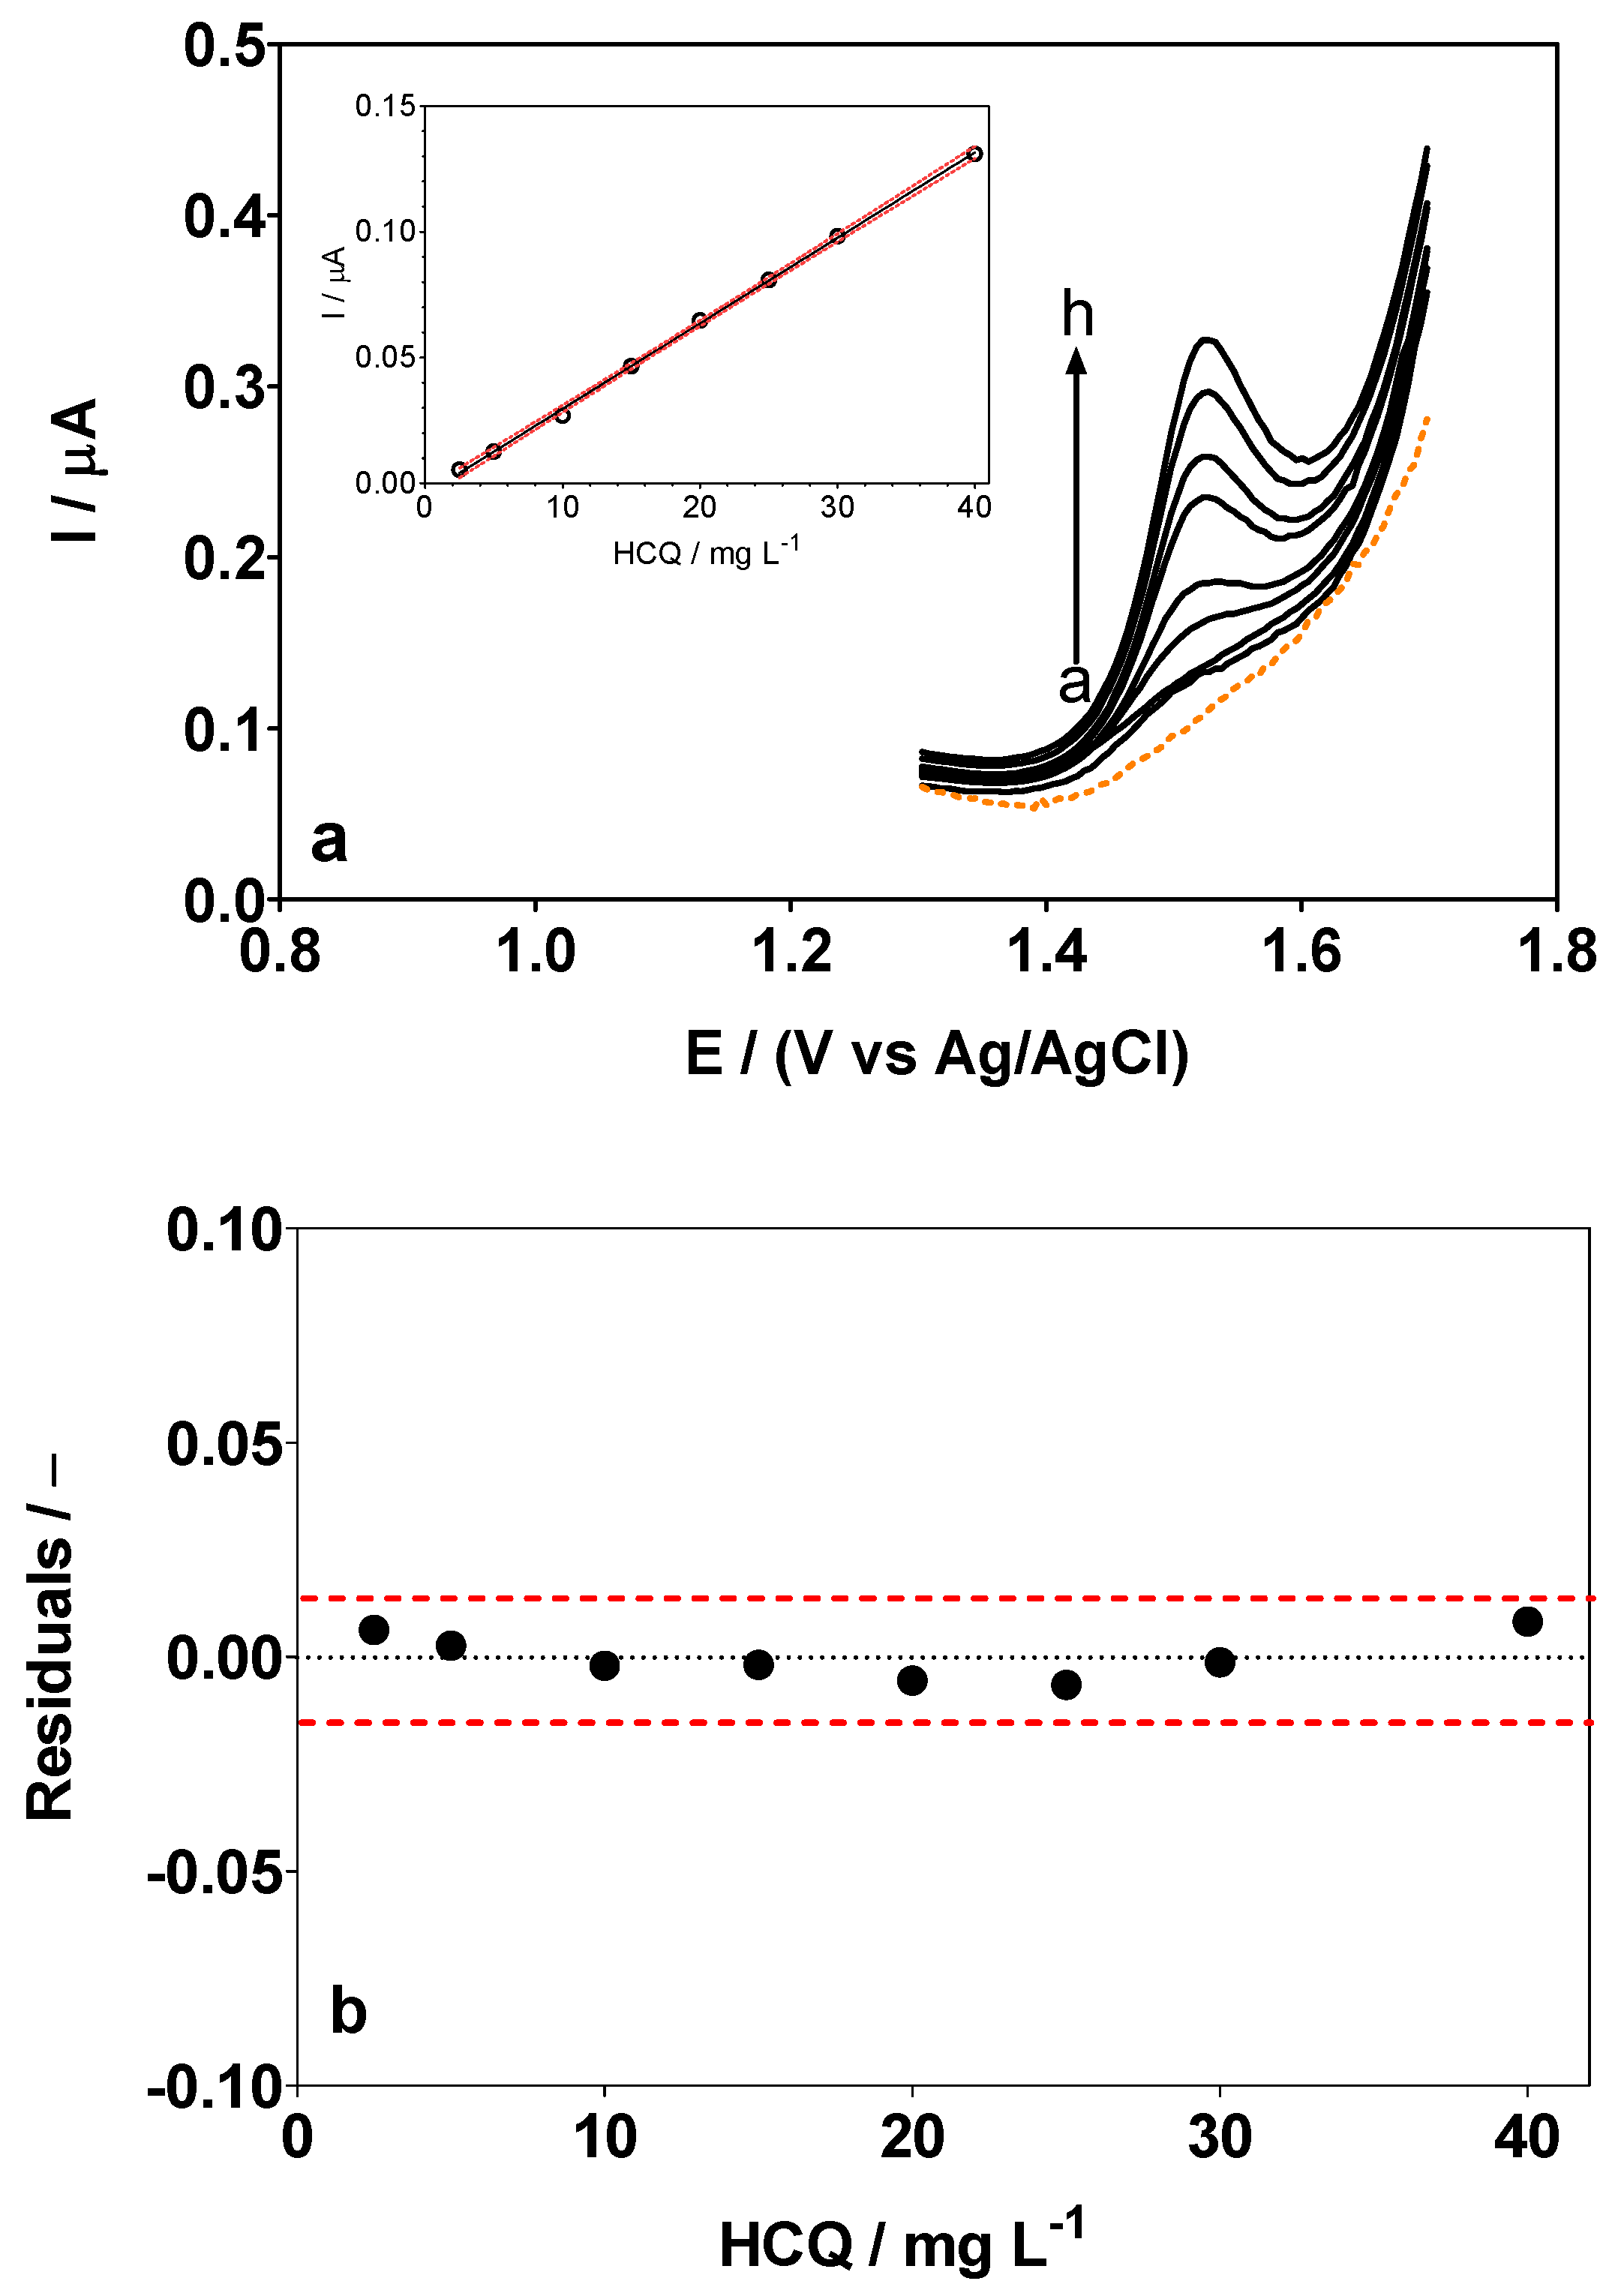
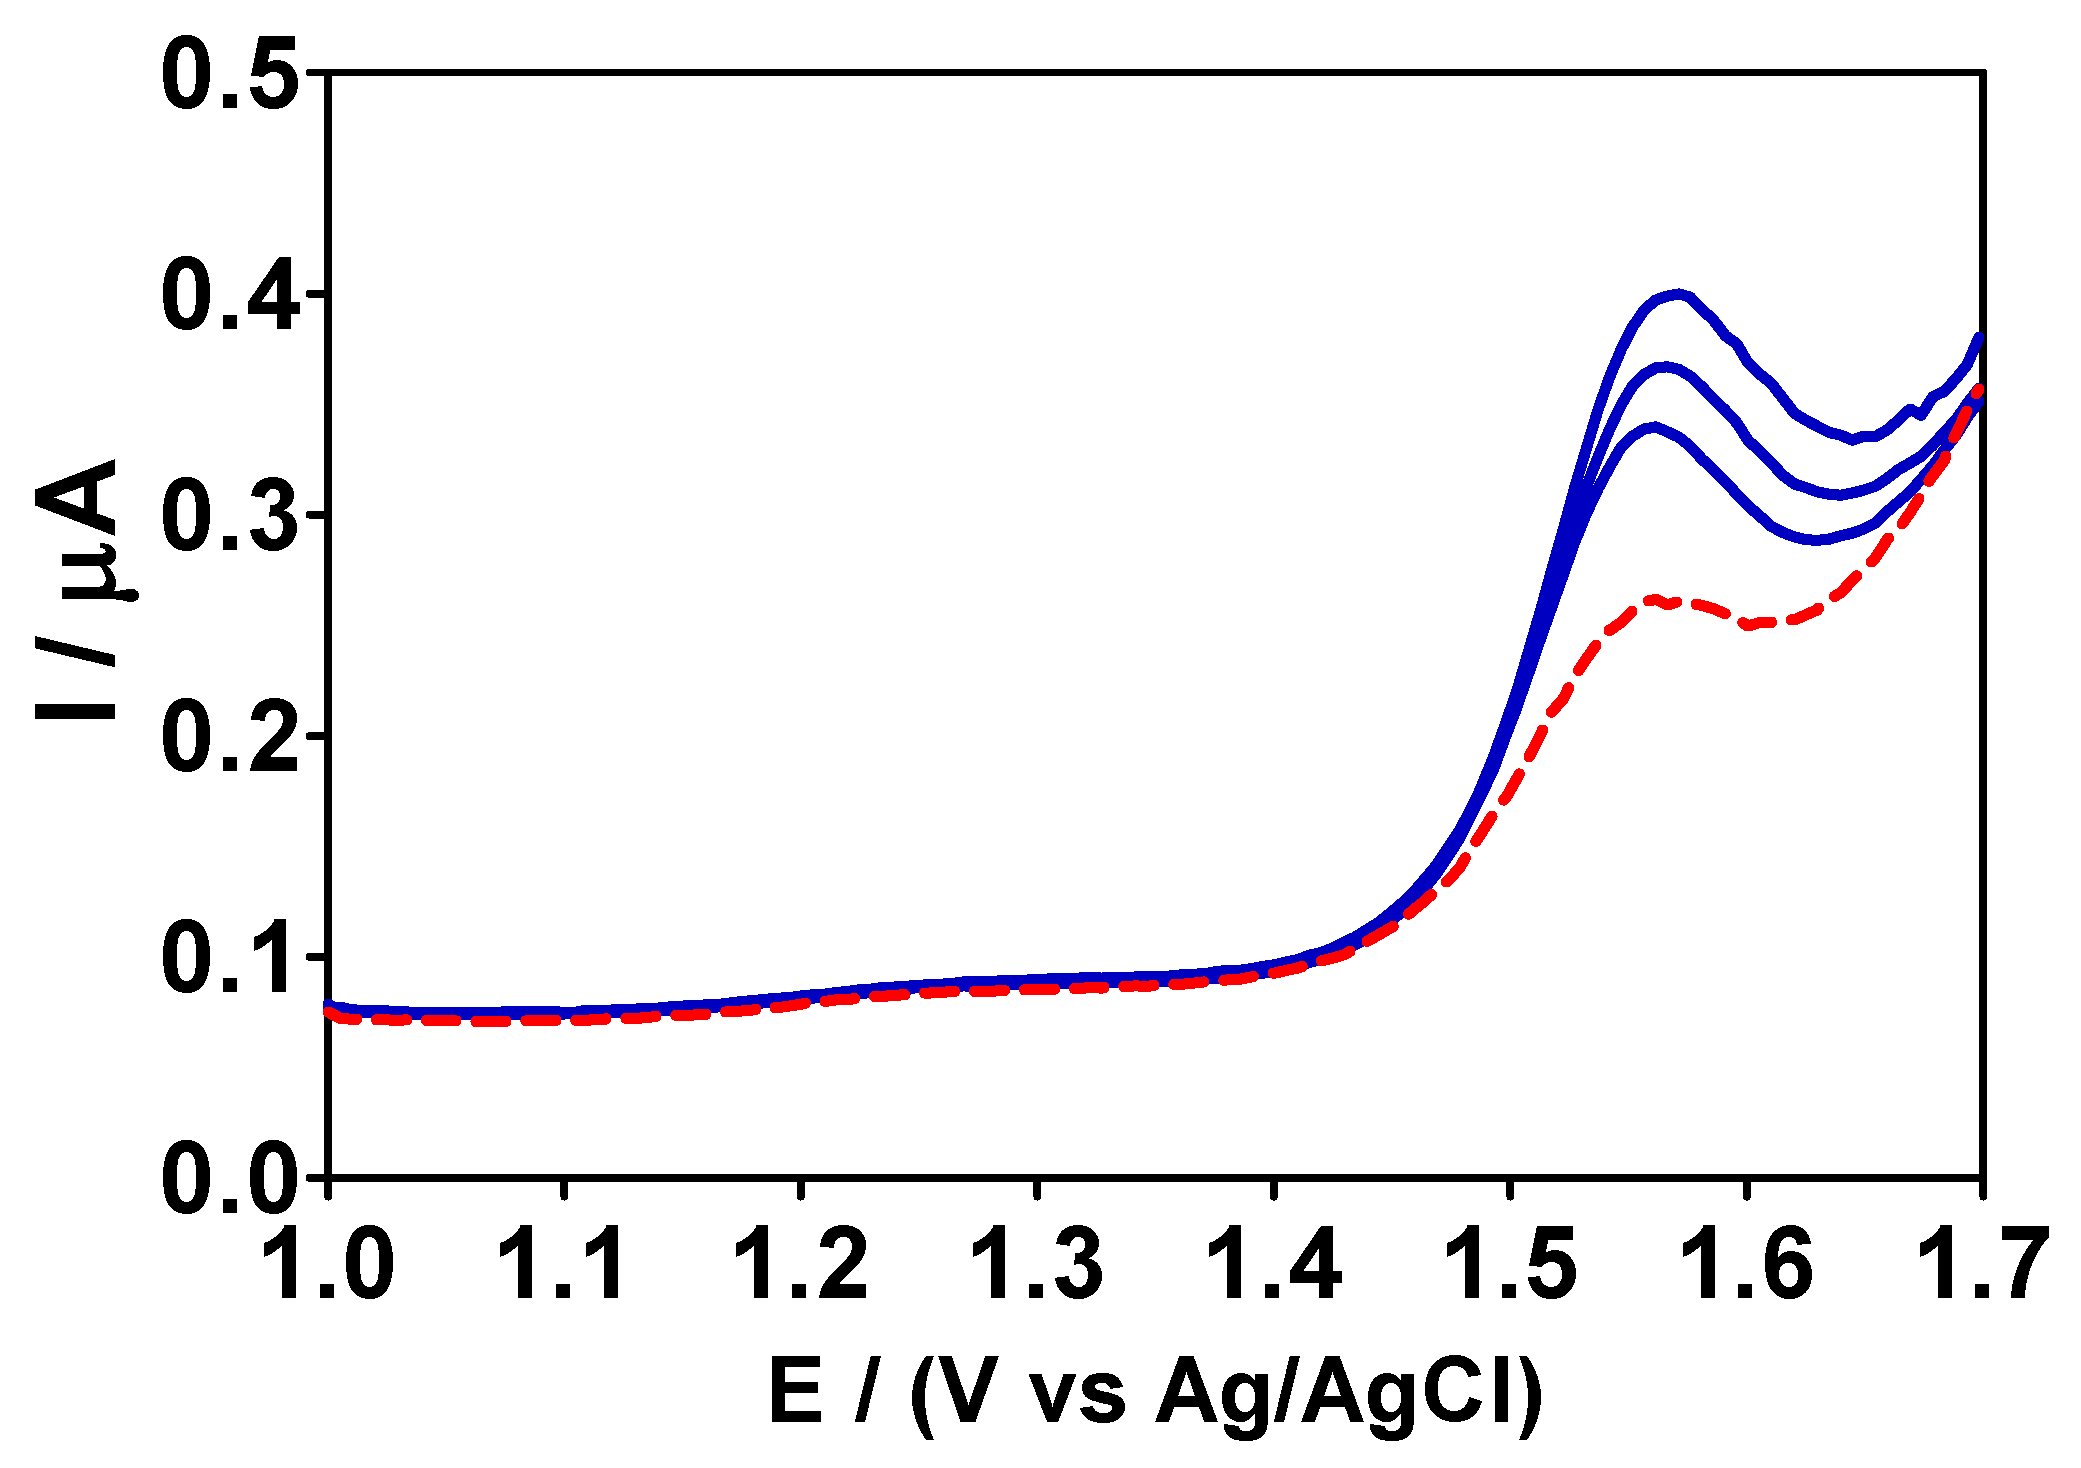
3.2. DPV Analytical Curve and Standard Additions Method in River Water Sample

From the results obtained in our previous work, the composite sensor exhibited an excellent response for detecting HCQ in H2SO4/ultrapure water solution. However, the use of ultrapure water with a single target pollutant could mask the applicability of the experimental data to actual uses [20] with real water matrices (which are composed by several inorganic and organic compounds that can affect the electrochemical sensor response to quantify HCQ). Then, this composite sensor was used to construct an analytical curve with a non-polluted river water matrix (see Table 1). As can be observed in Figure 1, the sensor presented excellent performances, in terms of the electrochemical response (current vs. (HCQ)) as a function of HCQ concentration, when a non-polluted river water sample was used. This behavior demonstrated that non-significant matrix effect was attained at surface sensor during the analytical curve construction. In other words, it was possible to confirm that real water composition did not affect the detection of HCQ.
The analytical curve was represented considering the current-peak (Ip) responses as a function of the linear increase of the HCQ concentration (Figure 1a), in the range from 2.5 to 40 mg L−1 (5.72−92.17 µM). The linear regression equation (Ip vs. (HCQ)) was determined as, Ip(I) = 3.7 × 10⁻³ × [HCQ] − 1.3 × 10⁻² (R2 = 0.990). The limit of detection (LOD) and limit of quantification (LOQ) were found to be 1.46 mg L−1 (≈3.36 µM) and 4.42 mg L−1 (≈10.19 µM), according to Equations (3) and (4).
LOD = 3.3 × Sy/x/b
LQ = 10 × Sy/x/b
where Sy/x is the residual standard deviation and b is the slope of the calibration plot [28,29]. The non-linearity was also evaluated from the residuals of regression curve, as can be observed in Figure 1b. Thus, the absence of significant non-linearity was confirmed, guaranteeing the reliability in real water matrices, as recommended by IUPAC [28,30] and the literature [31]. It is important to highlight that all analyses were performed in triplicate, consequently it was possible to obtain the confidence intervals and standard deviations within 95% (red dotted lines in analytical curve). Thus, this information was used in order to identify false positives and false negatives (α = β = 0.05), as already reported by experts in the field [31].
Later, to evaluate the reliability of directly using the composite sensor in real water matrices, the sensor was used to electroanalytically quantify the HCQ concentration by standard addition method in the polluted river water sample. As can be observed in Figure 2, the HCQ signal was confirmed by intensification of the peaks associated with the addition of different volumes of standard HCQ solution to polluted sample [32]. The HCQ concentration electroanalytically determined by DPV approach was about 26.87 ± 0.34 mg L−1 (61.92 ± 0.04 µM), which was similar to the spectrophotometric measurement reported in Table 1. It is important to highlight that the results were obtained with acceptable standard deviations and confidence intervals, within 95% [31].
In order to develop suitable clean water solutions, the integration of electrochemical-SDG6 technologies was achieved by the electrochemical treatment of polluted HCQ river water matrix with BDD-electrolysis and by the determination, in real-time, of the residual HCQ concentration with the cork-graphite sensor.

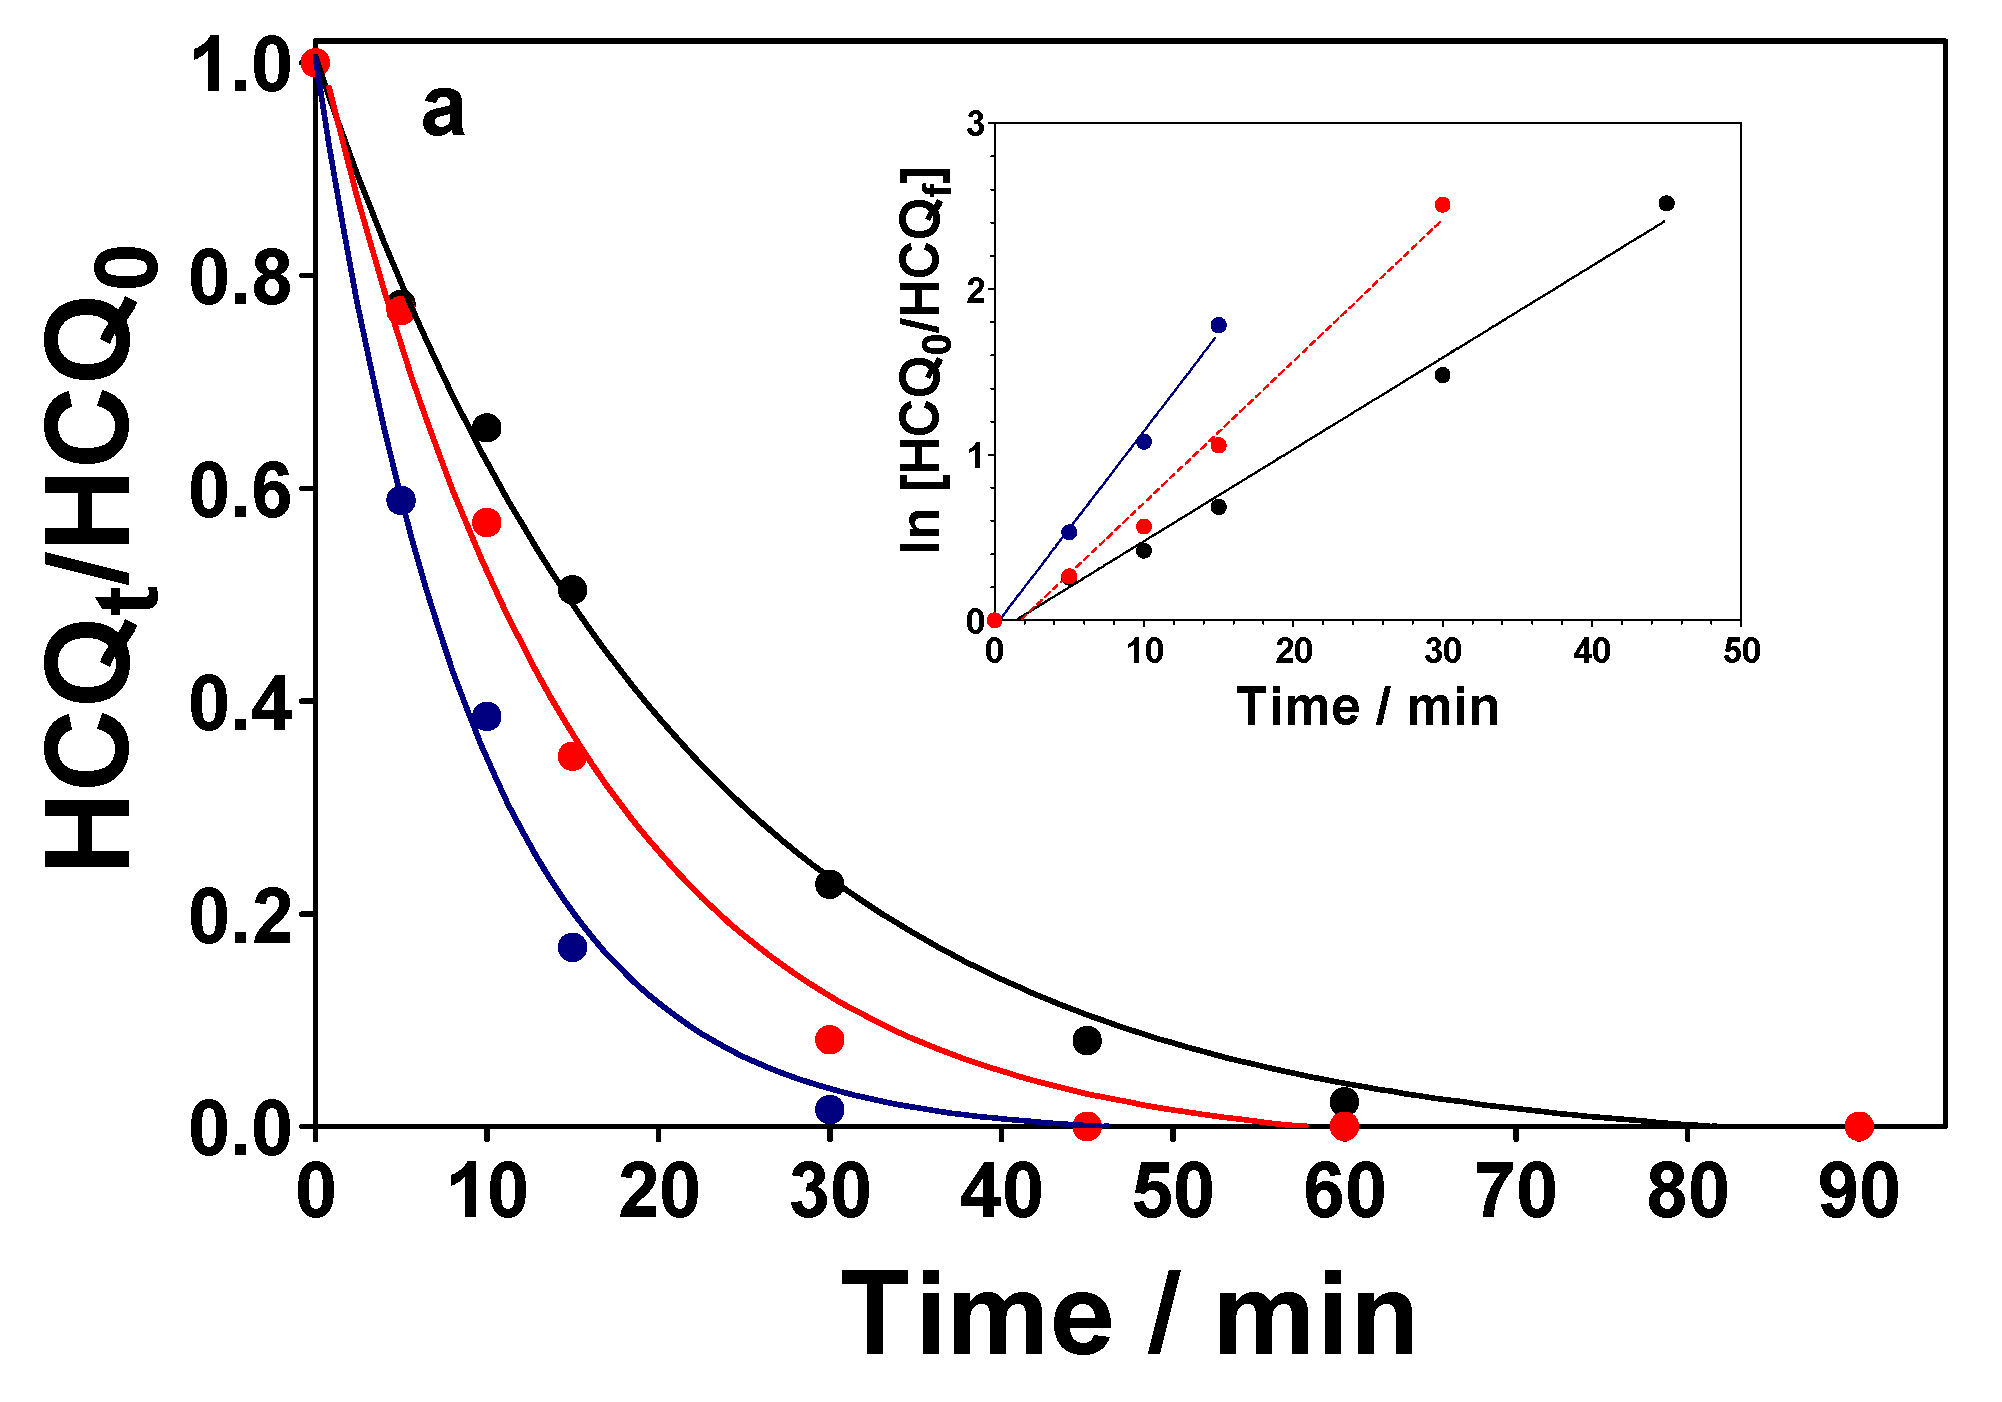
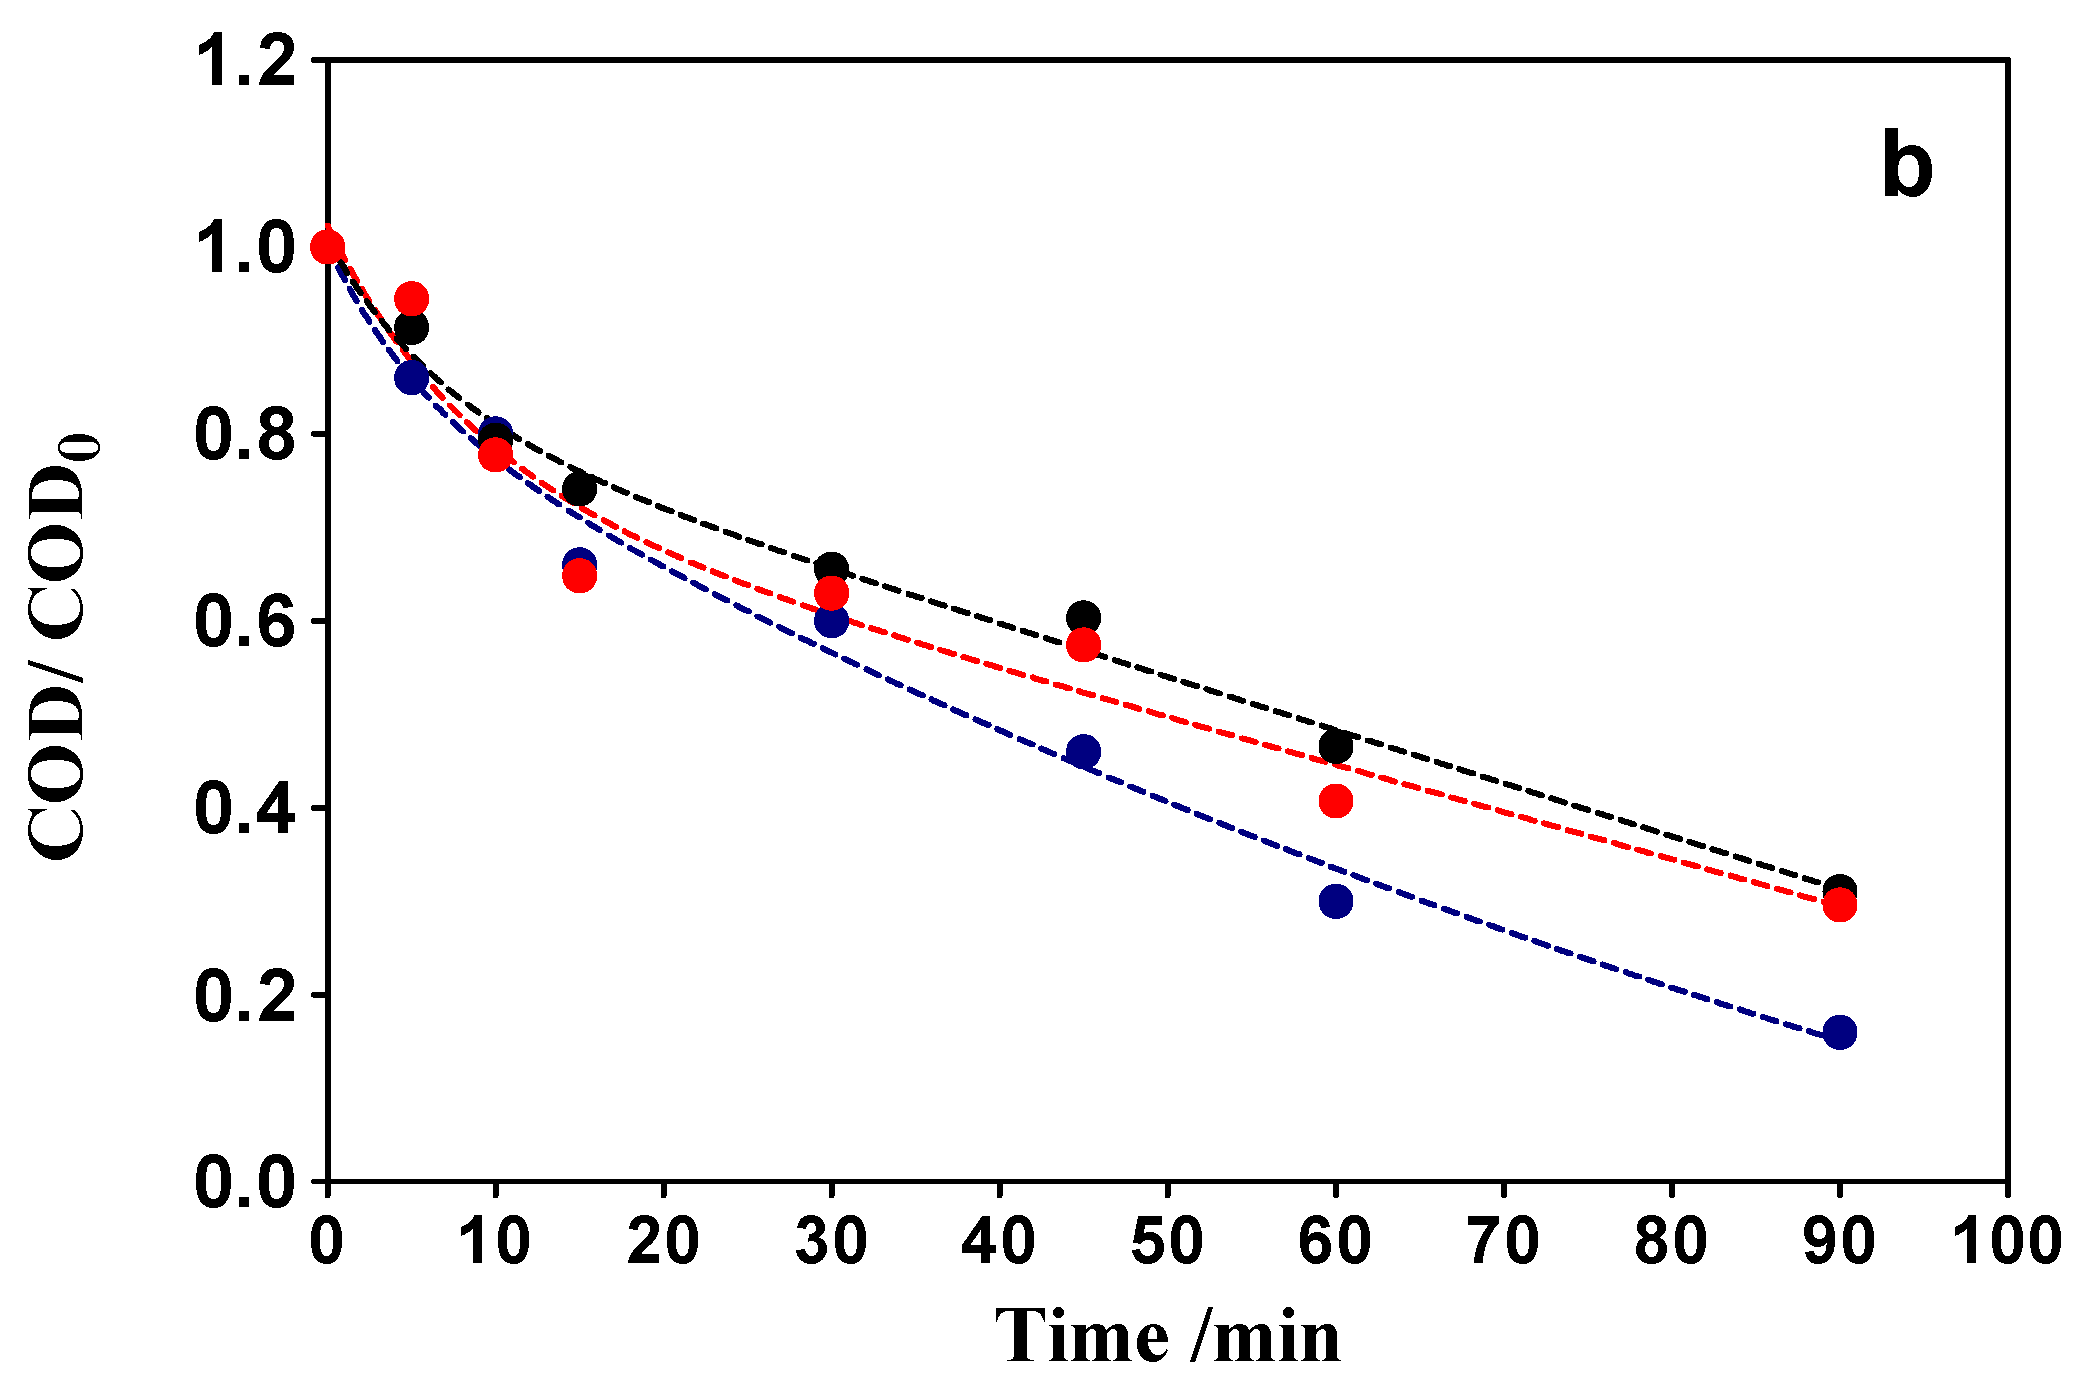
3.3. Degradation of HCQ by BDD-Electrolysis in Real Water Matrices

The elimination of HCQ (Figure 3a) and organic matter (Figure 3b), in terms of COD, in polluted river water sample (≈26.87 mg L−1) by EO approach with BDD electrode is shown in Figure 3. In order to compare j, the electrolysis experiments for removing HCQ using BDD|Ti reactor were performed by applying 15, 30 and 45 mA cm−2 in order to comprehend the effect of this experimental condition. As shown in Figure 3a, normalized changes of HCQ concentration were registered and a complete HCQ decay was attained, for all j values. A faster HCQ elimination was achieved when an increase on the j was reached. This behavior can be attributed to the increase on the production of the oxidants that are typically OH radicals (5), SO4−●(6) and S2O82−(7,8) [33,34], promoting a quick oxidation of HCQ in the polluted river water matrix. BDD electrode is considered a non-active anode material that can produce efficiently free heterogeneous OH radicals at its surface [33] as well as other oxidants [11], which contribute to quickly mineralizing/degrading organics in synthetic and real water matrices [35,36].
BDD + H2O → BDD(OH) + H+ + e
SO4 + BDD(OH) → SO4−• + H2O
SO4−• + SO4−• → S2O82
2SO42− → S2O82− + 2e
In fact, polarization curves (Figure 4) and cyclic voltammetry (inset in Figure 4) have confirmed this information. Figure 4 shows the linear polarization curves of (a) non-polluted and (b) polluted river water matrices with BDD anode at 50 mV s−1 as scan rate. The curves (a and b) are very different and show that oxygen evolution potential starts at +1.85 V versus Ag/AgCl (3 M) when non-polluted water was investigated. This means that BDD anode has high oxygen evolution overpotential in real water matrix, and consequently, it is a poor electrocatalysts for the oxygen evolution reaction (o.e.r.) compared with other electrodes reported in literature [37,38]. Meanwhile, polluted river water sample presented a well-defined peak at about +1.6 V before the o.e.r and it moderately extends to +1.9 V where the production of free heterogeneous OH radicals [33] and other oxidants [11] is feasible. This result clearly indicated that direct and indirect oxidations can be attained, allowing a quick elimination of HCQ from real polluted water matrix [39].
Cyclic voltammograms were also obtained with (a) non-polluted and (b) polluted river water matrices with BDD anode, in acidic sample at 25 °C (inset in Figure 4). On the one hand, the CV curves did not show significant current signals due to the interaction between the water species composition and BDD surface when the non-polluted sample was investigated, confirming that no significant matrix effect was attained. On the other hand, the typical behavior of a non-reversible system was observed when polluted water matrix was studied. The peak in the CV at +1.58 V can be understood in terms of an electroactivity of HCQ towards the diamond electrode, suggesting that the organic substrate can be directly oxidized at BDD surface [39]. Meanwhile, when the potential is increased, a smooth current signal was achieved as an extension of the HCQ peak at +1.58 V. This result indicated that other organic compounds are present in the water matrix, which could be oxidation’s by-products from HCQ [19]. However, these intermediates are indirectly oxidized by free heterogeneous OH radicals [33,37] and other oxidants [11,40] that can be produced at higher potentials [32]. This behavior is in accordance with the HCQ and COD decays in Figure 3.
From data in Figure 3a, kinetic studies were carried out under pseudo-order conditions [41]. Under these experimental circumstances, the concentration of OH in solution was kept in excess with respect to the HCQ in solution which ensures that the reaction of depollution was considered under pseudo-first-order conditions [42]. Then, the kinetic experiments were performed by monitoring the decay of HCQ concentration in real water matrix as a function of time. In view of the principles of chemical kinetics, the rate expression for the decay reaction of HCQ solution can be written as (9) [19],
-d[HCQ]/dt = k[HCQ]m [OH]n
where [HCQ] and [OH] are molar concentrations of HCQ and OH, respectively. m and n are the order of the reaction with respect to the given reactant, separately. k represents the apparent rate constant for the decay reaction. Under an excess of OH concentration in solution, Equation (11) was rewritten as (10),
-d[HCQ]/dt = k[HCQ]m
By using the natural logarithm of HCQ concentration with the reaction time (min) (inset of Figure 3), linear relationships were estimated (R2 = 0.99), which suggested that the decay of HCQ concentration followed pseudo-first order kinetics, and the positive of the slope of this line equals the apparent rate constants of 0.0554 min−1, 0.0855 min−1 and 0.118 min−1 at 15, 30 and 45 mA cm−2, respectively, demonstrating an improvement in the reaction rate when an increase on the j was attained [32].
As can be seen in Figure 3b, COD decay obtained by applying 15, 30 and 45 mA cm−2 was about 18, 16 and 8, respectively, after 90 min of BDD-electrolysis. Taken into consideration that up to 68% of COD removal was obtained at 15 mA cm−2 after 90 min of BDD-electrolysis, while 71% and 84% were achieved by applying 30 and 45 mA cm−2, respectively. This results in evidence that the j influenced the degradation of HCQ, which is justified due to the efficiency production of oxidizing species, mainly free heterogenous OH radicals at BDD surface [19,43,44]. Bensalah and coworkers [19] have reported significant insight regarding the electrochemical treatment of HCQ in synthetic effluents, confirming that the large production of OH radicals from EO of water at the BDD surface of BDD attack immediately HCQ at the vicinity of BDD surface and decompose it into small fragments. In fact, they observed that the pH value of the solutions decreased at the beginning of the treatment due to the formation of acid intermediates during EO of HCQ [19]. Under acidic conditions, two of the HCQ functional groups exist in protonated forms, which may facilitate the rupture of C-N bonds by the attack of OH radicals and thus release the branched group. For this reason, 4-quinolamine, oxamic and oxalic acids, as well as chloride, nitrate and ammonium were identified during HCQ mineralization by Bensalah and coworkers [19]. These assertions are in agreement with the polarization curves and cyclic voltammograms in Figure 4. Additionally, the identification of inorganic by-products (NO3 and free chorine (see Table 1 values for polluted water matrix) in our investigation for the electrochemical treatment of polluted HCQ river water matrix allowed for the confirmation of the fragmentation of the initial HCQ chemical structure, as already reported by Bensalah et at. [19] when synthetic solutions were electrochemically treated, identifying the main by-products and consequently proposing a degradation pathway.

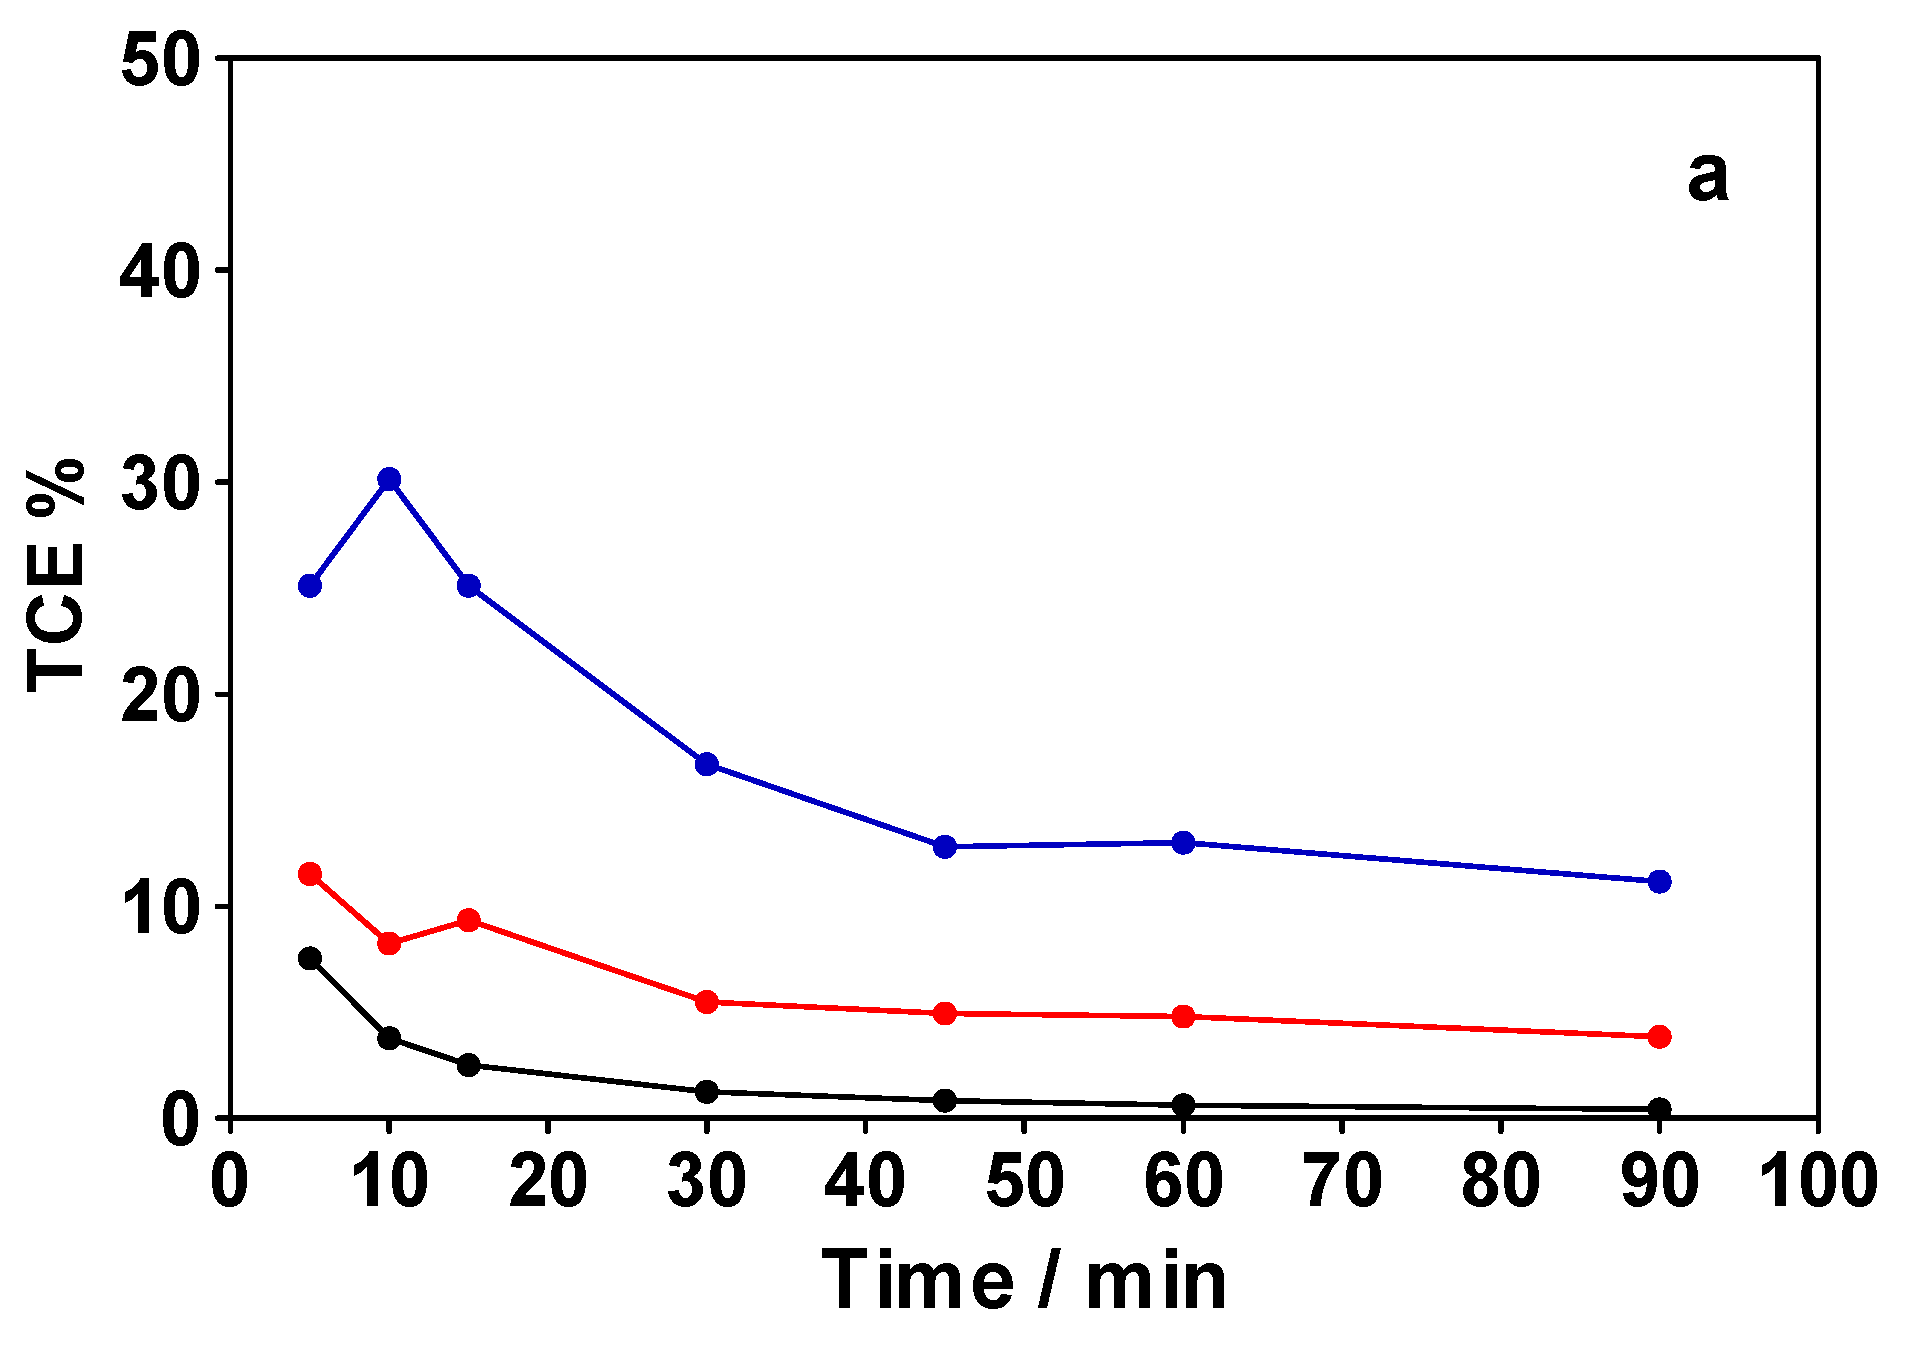
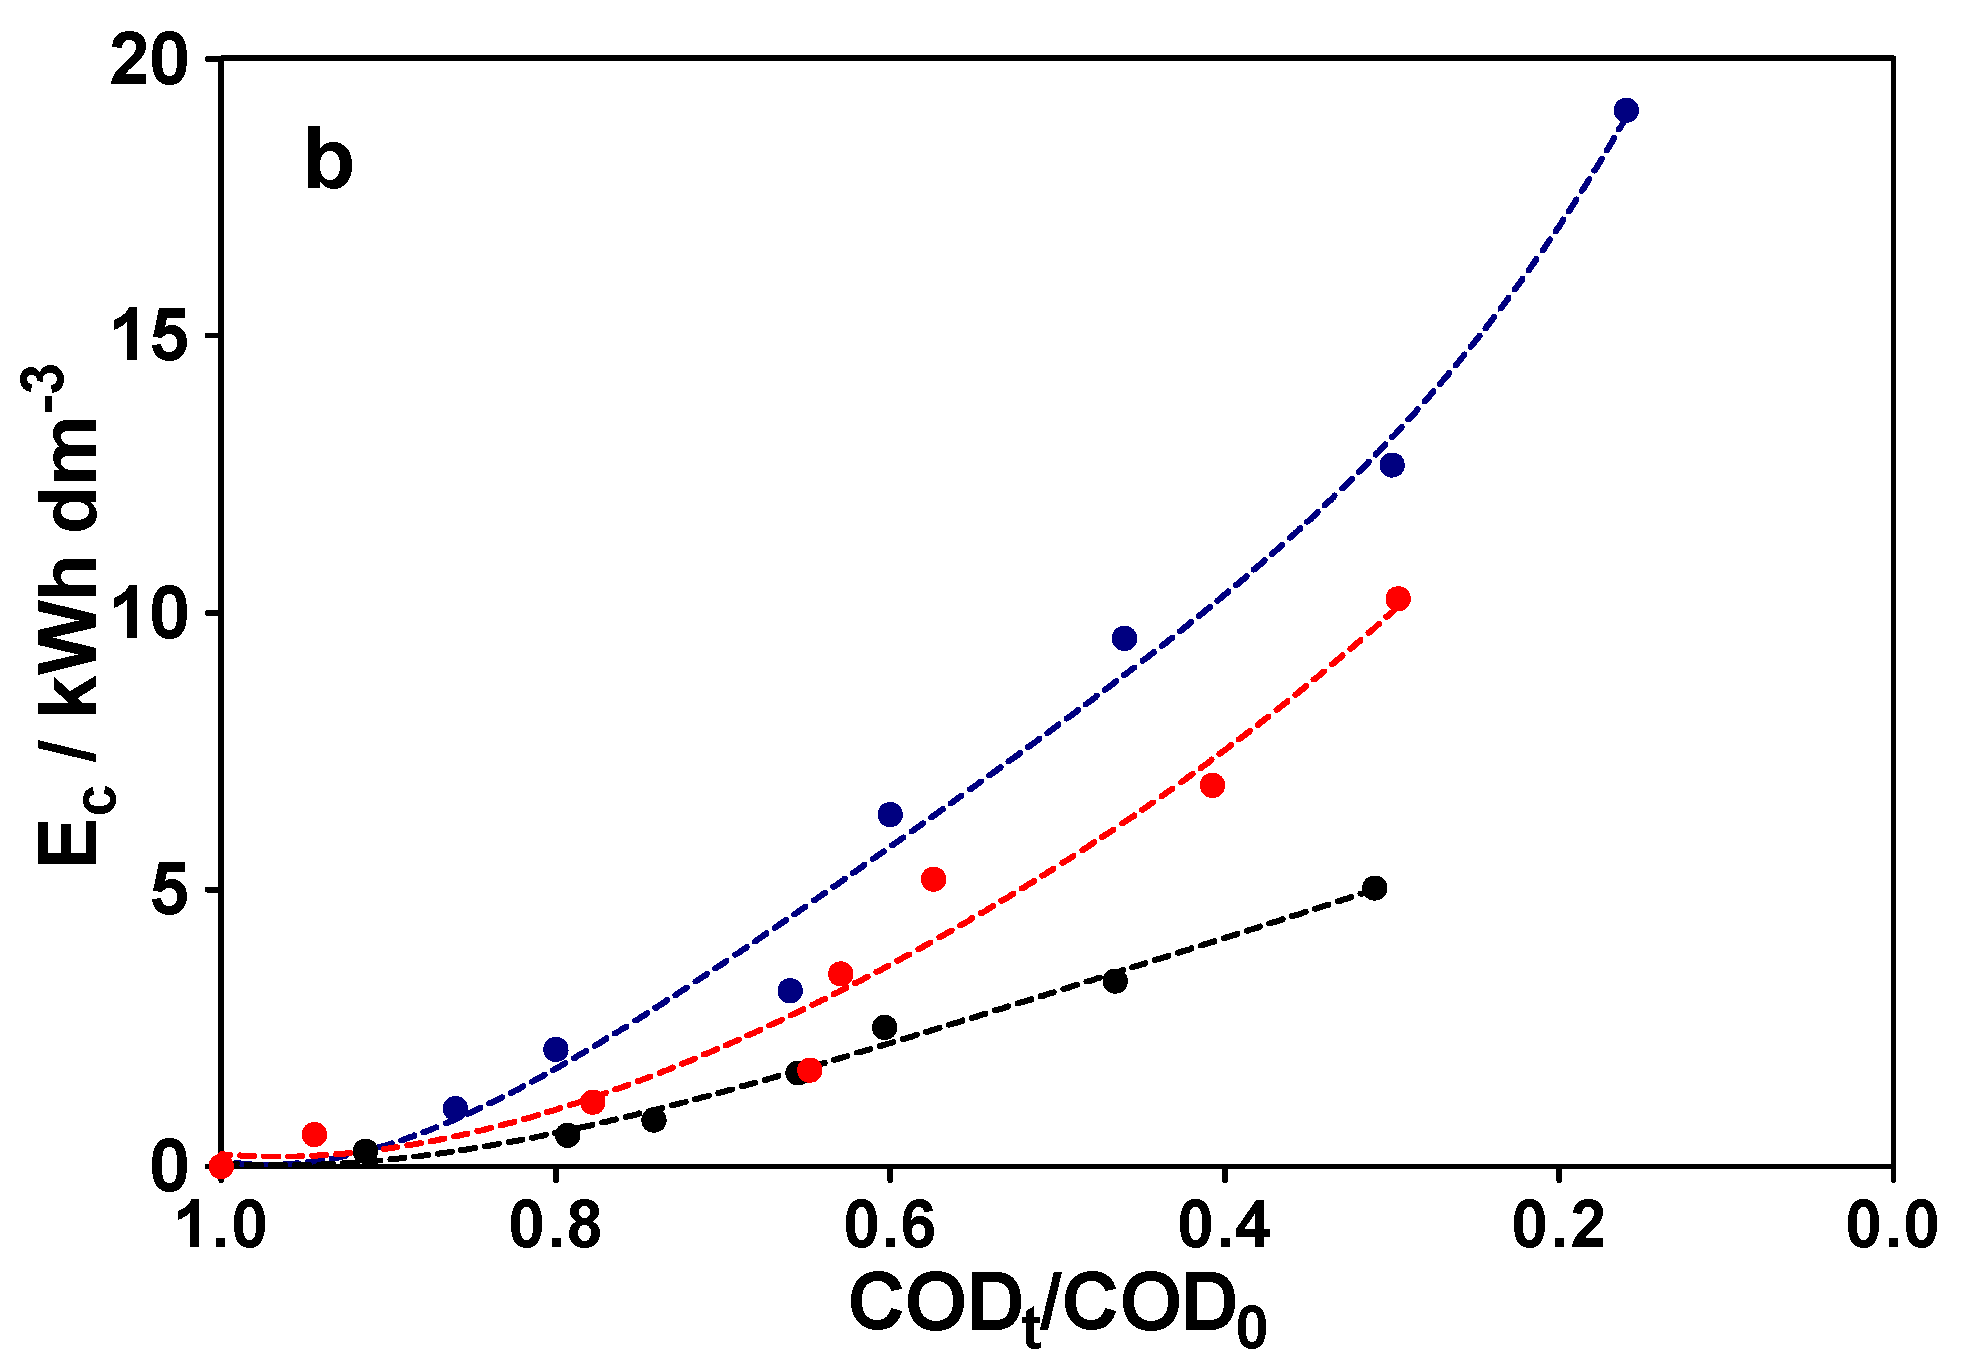
3.4. Efficiency and Energy Consumption

Figure 5 shows the total current efficiency (%TCE) (Figure 5a) and EC (Figure 5b) when a polluted HCQ river water sample was electrochemically treated at different j (15, 30 and 45 mA cm−2). It is an important parameter to evaluate the viability of the EO using BDD anodes [45]. Thus, in the first 30 min for all experiments, a slow %TCE decrease was observed, as a function of time. This behavior can be associated to, on the one hand, the efficient use of current to eliminate HCQ from river water until the process is controlled by mass transport and on the other hand, the existence of parallel reactions, such as oxygen evolution and degradation of persistent by-products formed during HCQ removal (i.e., short-chain aliphatic carboxylic acids), that employ a portion of the electrical energy applied. Meanwhile, the EC increased with j and electrolysis time, thus the most rapid and efficient process was observed at high j. Obviously, as seen Figure 5b, the j has a strong effect of the EC; however, agitated beaker reactor could not be representative for energetic requirements and oxidation environment for scale-up conditions, in terms of effectiveness, mass transport and oxidants production [46]. Therefore, more studies are in progress in order to decrease EC and consequently, the relative costs. Another strategy is based on the integration of photovoltaic (PV) to electrochemical technologies to supply the electrical energy for treating different water matrices [47,48,49]. The falling price and the more efficient materials used in solar photovoltaic panels are making the process promising. Up to now, few research groups are employing solar-driven for water treatment, and as far as we know, there are few reports on BDD electrodes applied for different water matrices.

4. Conclusions

From this work, the following conclusions can be drawn:
This study highlights that is possible to detect and quantify HCQ in real water matrix by DPV technique using electrochemical cork-graphite device. The DPV method using the composite sensor showed a satisfactory current-response and higher sensitivity to determine HCQ in a polluted river water matrix. It is important to emphasize that in previous work [14], an electroanalytical approach was compared with the spectrophotometric method achieving good performances, confirming the analytical confidence of the measurements using cork-graphite sensor.
The HCQ degradation (26.8 mg L−1) was studied under different j (15, 30 and 45 mA cm−2), demonstrating that higher current densities accelerated the organic matter elimination from solution because of the efficient electrogeneration of oxidants with BDD anode. Increasing of j, favor the electrogeneration of different oxidants at the BDD surface or via the participation of OH radicals, favoring the elimination of HCQ from real water matrix.
Detection of NO3 and free chorine after the degradation of HCQ, evidenced by electrochemical SDG6 technology being effectively applied, promoting clean water and sanitization outcomes.

Author Contributions

Conceptualization, E.V.D.S. and C.A.M.-H.; methodology, D.M.d.A.; formal analysis, E.V.D.S. and C.A.M.-H.; resources, C.A.M.-H.; data curation, D.M.d.A., E.V.D.S., C.A.M.-H. and A.D.B.; writing—original draft preparation, D.M.d.A. and E.V.D.S., writing—review and editing, D.M.d.A., E.V.D.S., C.A.M.-H. and A.D.B.; funding acquisition, E.V.D.S. and C.A.M.-H. All authors have read and agreed to the published version of the manuscript.

Funding

This research was funded by Conselho Nacional de Desenvolvimento Científico e Tecnológico (Brazil), grant number 306323/2018-4, and Fundação de Amparo à Pesquisa do Estado de São Paulo (Brazil), grant numbers 2014/50945-4 and 2019/13113-4.

Acknowledgments

Financial supports from the Conselho Nacional de Desenvolvimento Científico e Tecnológico (CNPq–306323/2018-4) and from Fundação de Amparo à Pesquisa do Estado de São Paulo (Brazil) (FAPESP 2014/50945-4 and 2019/13113-4) are gratefully acknowledged.

Conflicts of Interest

The authors declare no conflict of interest.

References

  1. Jin, Y.H.; Cai, L.; Cheng, Z.S.; Cheng, H.; Deng, T.; Fan, Y.P.; Fang, C.; Huang, D.; Huang, L.Q.; Huang, Q.; et al. A rapid advice guideline for the diagnosis and treatment of 2019 novel coronavirus (2019-nCoV) infected pneumonia (standard version). Med. J. Chin. People’s Lib. Army 2020, 45, 1–20. [Google Scholar] [CrossRef] [PubMed] [Green Version]
  2. Biswas, P.; Hasan, M.M.; Dey, D.; dos Santos Costa, A.C.; Polash, S.A.; Bibi, S.; Ferdous, N.; Kaium, M.A.; Rahman, M.H.; Jeet, F.K.; et al. Candidate antiviral drugs for COVID-19 and their environmental implications: A comprehensive analysis. Environ. Sci. Pollut. Res. 2021, 28, 59570–59593. [Google Scholar] [CrossRef]
  3. Ghazy, R.M.; Almaghraby, A.; Shaaban, R.; Kamal, A.; Beshir, H.; Moursi, A.; Ramadan, A.; Taha, S.H.N. A systematic review and meta-analysis on chloroquine and hydroxychloroquine as monotherapy or combined with azithromycin in COVID-19 treatment. Sci. Rep. 2020, 10, 1–18. [Google Scholar] [CrossRef]
  4. Sartor, G.; Del Riccio, M.; Dal Poz, I.; Bonanni, P.; Bonaccorsi, G. COVID-19 in Italy: Considerations on official data. Int. J. Infect. Dis. 2020, 98, 188–190. [Google Scholar] [CrossRef]
  5. Martins, L.D.; da Silva, I.; Batista, W.V.; de Fátima Andrade, M.; de Freitas, E.D.; Martins, J.A. How socio-economic and atmospheric variables impact COVID-19 and influenza outbreaks in tropical and subtropical regions of Brazil. Environ. Res. 2020, 191, 110184. [Google Scholar] [CrossRef] [PubMed]
  6. Heberer, T. Occurrence, fate, and removal of pharmaceutical residues in the aquatic environment: A review of recent research data. Toxicol. Lett. 2002, 131, 5–17. [Google Scholar] [CrossRef]
  7. Eggen, R.I.L.; Hollender, J.; Joss, A.; Scharer, M.; Stamm, C. Reducing the Discharge of Micropollutants in the Aquatic Environment: The Benefits of Upgrading Wastewater Treatment Plants. Environ. Sci. Technol. 2014, 48, 7683–7689. [Google Scholar] [CrossRef]
  8. Gruchlik, Y.; Linge, K.; Joll, C. Removal of organic micropollutants in waste stabilisation ponds: A review. J. Environ. Manag. 2018, 206, 202–214. [Google Scholar] [CrossRef] [PubMed]
  9. Nippes, R.P.; Macruz, P.D.; Neves Olsen Scaliante, M.H. Toxicity reduction of persistent pollutants through the photo-fenton process and radiation/H2O2 using different sources of radiation and neutral pH. J. Environ. Manag. 2021, 289, 112500. [Google Scholar] [CrossRef]
  10. Rivera-Utrilla, J.; Sánchez-Polo, M.; Ferro-García, M.Á.; Prados-Joya, G.; Ocampo-Pérez, R. Pharmaceuticals as emerging contaminants and their removal from water. A review. Chemosphere 2013, 93, 1268–1287. [Google Scholar] [CrossRef]
  11. Martínez-Huitle, C.A.; Brillas, E. A critical review over the electrochemical disinfection of bacteria in synthetic and real wastewaters using a boron-doped diamond anode. Curr. Opin. Solid State Mater. Sci. 2021, 25, 100926. [Google Scholar] [CrossRef]
  12. Furlan, L.; Caramelli, B. The regrettable story of the “Covid Kit” and the “Early Treatment of COVID-19” in Brazil. Lancet Reg. Health-Am. 2021, 4, 100089. [Google Scholar] [CrossRef]
  13. Farias, D.F.; Souza, T.; Souza, J.A.C.R.; Vieira, L.R.; Muniz, M.S.; Martins, R.X.; Gonçalves, Í.F.S.; Pereira, E.A.S.; Maia, M.E.S.; Silva, M.G.F. COVID-19 Therapies in Brazil: Should we be concerned with the impacts on aquatic wildlife? Environ. Toxicol. Chem. 2020, 39, 2348–2350. [Google Scholar] [CrossRef] [PubMed]
  14. de Araújo, D.M.; Paiva, S.d.S.S.M.; Henrique, J.M.M.; Martínez-Huitle, C.A.; Dos Santos, E.V. Green composite sensor for monitoring hydroxychloroquine in different water matrix. Materials 2021, 14, 4990. [Google Scholar] [CrossRef] [PubMed]
  15. Dabić, D.; Babić, S.; Škorić, I. The role of photodegradation in the environmental fate of hydroxychloroquine. Chemosphere 2019, 230, 268–277. [Google Scholar] [CrossRef] [PubMed]
  16. Gümüş, D.; Gümüş, F. Removal of hydroxychloroquine using engineered biochar from algal biodiesel industry waste: Characterization and design of experiment (DoE). Arab. J. Sci. Eng. 2021, 46, 1–10. [Google Scholar] [CrossRef]
  17. Bendjeffal, H.; Ziati, M.; Aloui, A.; Mamine, H.; Metidji, T.; Djebli, A.; Bouhedja, Y. Adsorption and removal of hydroxychloroquine from aqueous media using Algerian kaolin: Full factorial optimisation, kinetic, thermodynamic, and equilibrium studies. Int. J. Environ. Anal. Chem. 2021, 101, 1–22. [Google Scholar] [CrossRef]
  18. da Silva, P.L.; Nippes, R.P.; Macruz, P.D.; Hegeto, F.L.; Olsen Scaliante, M.H.N. Photocatalytic degradation of hydroxychloroquine using ZnO supported on clinoptilolite zeolite. Water Sci. Technol. 2021, 84, 763–776. [Google Scholar] [CrossRef] [PubMed]
  19. Bensalah, N.; Midassi, S.; Ahmad, M.I.; Bedoui, A. Degradation of hydroxychloroquine by electrochemical advanced oxidation processes. Chem. Eng. J. 2020, 402, 126279. [Google Scholar] [CrossRef]
  20. Brito, L.R.D.; Ganiyu, S.O.; dos Santos, E.V.; Oturan, M.A.; Martínez-Huitle, C.A. Removal of antibiotic rifampicin from aqueous media by advanced electrochemical oxidation: Role of electrode materials, electrolytes and real water matrices. Electrochim. Acta 2021, 396, 139254. [Google Scholar] [CrossRef]
  21. Van der Bruggen, B. Sustainable implementation of innovative technologies for water purification. Nat. Rev. Chem. 2021, 5, 217–218. [Google Scholar] [CrossRef]
  22. Martínez-Huitle, C.A.; Rodrigo, M.A.; Sirés, I.; Scialdone, O. Single and coupled electrochemical processes and reactors for the abatement of organic water pollutants: A Critical review. Chem. Rev. 2015, 115, 13362–13407. [Google Scholar] [CrossRef] [PubMed]
  23. Mishra, B.K.; Chakraborty, S.; Kumar, P.; Saraswat, C. Sustainable Solutions for Urban Water Security; Springer International Publishing: New York, NY, USA, 2020; Volume 93. [Google Scholar] [CrossRef]
  24. Monteiro, M.; Da Silva, D.; Quiroz, M.; Vilar, V.; Martínez-Huitle, C.; Dos Santos, E. Applicability of cork as novel modifiers to develop electrochemical sensor for caffeine determination. Materials 2020, 14, 37. [Google Scholar] [CrossRef]
  25. Trasatti, S.; Petri, O.A. Real surface area measurements in electrochemistry. J. Electroanal. Chem. 1992, 327, 353–376. [Google Scholar] [CrossRef]
  26. Brillas, E.; Martínez-Huitle, C.A. Decontamination of wastewaters containing synthetic organic dyes by electrochemical methods. An updated review. Appl. Catal. B Environ. 2015, 166–167, 603–643. [Google Scholar] [CrossRef]
  27. Abidi, J.; Samet, Y.; Panizza, M.; Martinez-Huitle, C.A.; Carpanese, M.P.; Clematis, D. A boron-doped diamond anode for the electrochemical removal of parabens in low-conductive solution: From a conventional flow cell to a solid polymer electrolyte system. ChemElectroChem 2020, 7, 314–319. [Google Scholar] [CrossRef]
  28. Danzer, K.; Currie, L.A. Guideline for calibration in analytical chemistry— Part 1. Fundamentals and single component calibration. Pure Appl. Chem. 1998, 70, 993–1014. [Google Scholar] [CrossRef]
  29. Currie, L.A. International union of pure and applied chemistry nomenclature in evaluation of analytical methods including detection and quantification capabilities. Pure Appl. Chem. 1995, 67, 1699–1723. [Google Scholar] [CrossRef]
  30. Currie, L.A. Nomenclature in evaluation of analytical methods including detection and quantification capabilities (IUPAC Recommendations 1995). Anal. Chim. Acta 1999, 391, 105–126. [Google Scholar] [CrossRef]
  31. Desimoni, E.; Brunetti, B. About estimating the limit of detection of heteroscedastic analytical systems. Anal. Chim. Acta 2009, 655, 30–37. [Google Scholar] [CrossRef]
  32. Bensalah, N.; Faouzi Ahmadi, M.; Martinez-Huitle, C.A. Electrochemical oxidation of 2-chloroaniline in single and divided electrochemical flow cells using boron doped diamond anodes. Sep. Purif. Technol. 2021, 263, 118399. [Google Scholar] [CrossRef]
  33. Ganiyu, S.O.; Martínez-Huitle, C.A.; Oturan, M.A. Electrochemical advanced oxidation processes for wastewater treatment: Advances in formation and detection of reactive species and mechanisms. Curr. Opin. Electrochem. 2021, 27, 100678. [Google Scholar] [CrossRef]
  34. Martínez-Huitle, C.A.; Panizza, M. Electrochemical oxidation of organic pollutants for wastewater treatment. Curr. Opin. Electrochem. 2018, 11, 62–71. [Google Scholar] [CrossRef]
  35. Clematis, D.; Panizza, M. Application of boron-doped diamond electrodes for electrochemical oxidation of real wastewaters. Curr. Opin. Electrochem. 2021, 100844. [Google Scholar] [CrossRef]
  36. Scaria, J.; Gopinath, A.; Nidheesh, P.V. A versatile strategy to eliminate emerging contaminants from the aqueous environment: Heterogeneous Fenton process. J. Clean. Prod. 2021, 278, 124014. [Google Scholar] [CrossRef]
  37. He, Y.; Lin, H.; Guo, Z.; Zhang, W.; Li, H.; Huang, W. Recent developments and advances in boron-doped diamond electrodes for electrochemical oxidation of organic pollutants. Sep. Purif. Technol. 2019, 212, 802–821. [Google Scholar] [CrossRef]
  38. Hu, Z.; Cai, J.; Song, G.; Tian, Y.; Zhou, M. Anodic oxidation of organic pollutants: Anode fabrication, process hybrid and environmental applications. Curr. Opin. Electrochem. 2021, 26, 100659. [Google Scholar] [CrossRef]
  39. Ahmadi, M.F.; da Silva, Á.R.L.; Martínez-Huitle, C.A.; Bensalah, N. Understanding the electro-catalytic effect of benzene ring substitution on the electrochemical oxidation of aniline and its derivatives using BDD anode: Cyclic voltammetry, bulk electrolysis and theoretical calculations. Electrochim. Acta 2021, 369, 137688. [Google Scholar] [CrossRef]
  40. Garcia-Rodriguez, O.; Mousset, E.; Olvera-Vargas, H.; Lefebvre, O. Electrochemical treatment of highly concentrated wastewater: A review of experimental and modeling approaches from lab- to full-scale. Crit. Rev. Environ. Sci. Technol. 2020, 52, 240–309. [Google Scholar] [CrossRef]
  41. Peter Atkins, P.; De Paula, J. Atkins’ Physical Chemistry; OUP Oxford: Oxford, UK, 2014. [Google Scholar]
  42. Comninellis, C.; Kapalka, A.; Malato, S.; Parsons, S.A.; Poulios, I.; Mantzavinos, D. Advanced oxidation processes for water treatment: Advances and trends for R&D. J. Chem. Technol. Biotechnol. 2008, 83, 769–776. [Google Scholar] [CrossRef]
  43. Medeiros De Araújo, D.; Cañizares, P.; Martínez-Huitle, C.A.; Rodrigo, M.A. Electrochemical conversion/combustion of a model organic pollutant on BDD anode: Role of sp3/sp2 ratio. Electrochem. Commun. 2014, 47, 37–40. [Google Scholar] [CrossRef]
  44. Espinoza, L.C.; Henríquez, A.; Contreras, D.; Salazar, R. Evidence for the production of hydroxyl radicals at boron-doped diamond electrodes with different sp3/sp2 ratios and its relationship with the anodic oxidation of aniline. Electrochem. Commun. 2018, 90, 30–33. [Google Scholar] [CrossRef]
  45. Henrique, J.M.M.; Monteiro, M.K.S.; Cardozo, J.C.; Martínez-Huitle, C.A.; da Silva, D.R.; dos Santos, E.V. Integrated-electrochemical approaches powered by photovoltaic energy for detecting and treating paracetamol in water. J. Electroanal. Chem. 2020, 876, 114734. [Google Scholar] [CrossRef]
  46. Divyapriya, G.; Singh, S.; Martínez-Huitle, C.A.; Scaria, J.; Karim, A.V.; Nidheesh, P.V. Treatment of real wastewater by photoelectrochemical methods: An overview. Chemosphere 2021, 276, 130188. [Google Scholar] [CrossRef]
  47. Ganiyu, S.O.; Martínez-Huitle, C.A. The use of renewable energies driving electrochemical technologies for environmental applications. Curr. Opin. Electrochem. 2020, 22, 211–220. [Google Scholar] [CrossRef]
  48. de Melo Henrique, J.M.; de Andrade, D.C.; Barros Neto, E.L.; da Silva, D.R.; dos Santos, E.V. Solar-powered BDD-electrolysis remediation of soil washing fluid spiked with diesel. J. Chem. Technol. Biotechnol. 2019, 94, 2999–3006. [Google Scholar] [CrossRef]
  49. Ganiyu, S.O.; Martínez-Huitle, C.A.; Rodrigo, M.A. Renewable energies driven electrochemical wastewater/soil decontamination technologies: A critical review of fundamental concepts and applications. Appl. Catal. B Environ. 2020, 270, 118857. [Google Scholar] [CrossRef]
Figure 1. (a) DPV curves for electrochemical cork-graphite sensor in acidified sample of river water sample by adding well-known volumes (HCQ solution (10 mM)) to obtain: (a) 2.5 (b) 5, (c) 10, (d) 15, (e) 20, (f) 25, (g) 30, (h) 40 mg L−1. Blank is the red dashed line. Inset: Plot of electrochemical responses, in terms of current, as a function of HCQ concentration. (b) Graphic representation of the residual’s behavior, which confirms the linearity of the calibration curve.
Applsci 12 00699 g001
Figure 2. Results obtained for determining HCQ in river water by the standard additions method using the DPV approach with a cork-graphite sensor () standard additions of 1 mM HCQ in 0.1 M H2SO4 (200, 400 and 600 µL) as well as (---) river water sample.
Applsci 12 00699 g002
Figure 3. Effect of j: (●) 15, (●) 30 and (●) 45 mA cm−2 on the abatement of 26.8 mg L−1 of HCQ in an acidic river water matrix with H2SO4: (a) normalized HCQ concentration decays ([HCQ]t/[HCQ]0 at time t and t = 0 (in min) considering an initial HCQ concentration of 26.87 mg L−1, as electroanalytically determined by DPV approach with cork-graphite sensor at 25 ± 2 °C). Inset: Decay kinetic analysis assuming pseudo-first order reaction. (b) COD decay, over time in min.
Applsci 12 00699 g003aApplsci 12 00699 g003b
Figure 4. Linear polarization curves of (a) non-polluted and (b) polluted river water matrices with BDD anode at 50 mV s−1 as scan rate.
Applsci 12 00699 g004
Figure 5. (a) Total current efficiency (%TCE) over time and (b) energy consumption (EC) as a function of COD removal, during the treatment of a solution containing HCQ (26.8 mg L−1) at different current densities (●) 15, (●) 30 and (●) 45 mA cm−2 on the abatement of 26.8 mg L−1 of HCQ in a 0.1 M H2SO4 solution.
Applsci 12 00699 g005aApplsci 12 00699 g005b
Table 1. Physical–chemical characteristics of the real river samples. Non-electrochemically treated and after electrochemical treatment.
ParametersNo Treated Samples
(As-Collected)
After Electrochemical Treatment
mg L−1Non-PollutedPolluted15 mA cm−230 mA cm−245 mA cm−2
[HCQ]0.026.7 b>1.46 a>1.46 a>1.46 a
pH7.57.62.72.02.0
COD57.258.018.016.00.8
[NO3]2.12.014.917.312.3
Free chlorine0.030.030.070.240.38
a [HCQ] below 1.46 mg L−1 (≈3.36 µM) determined by spectrophotometric approach [14]. b [HCQ] also determined by spectrophotometric approach [14].
Publisher’s Note: MDPI stays neutral with regard to jurisdictional claims in published maps and institutional affiliations.

