
Water Retention Curve of Biocemented Sands Using MIP Results

1
CERIS, Instituto Superior Técnico, University of Lisbon, Av. Rovisco Pais, 1, 1049-001 Lisboa, Portugal
2
Instituto Superior Técnico, University of Lisbon, 1049-001 Lisboa, Portugal
3
INESC-MN, R Alves Redol, 9, 1000-029 Lisbon, Portugal
*
Author to whom correspondence should be addressed.
Appl. Sci. 2022, 12(20), 10447; https://0-doi-org.brum.beds.ac.uk/10.3390/app122010447
Submission received: 6 September 2022
/
Revised: 9 October 2022
/
Accepted: 9 October 2022
/
Published: 17 October 2022
(This article belongs to the Special Issue Unsaturated Soils: Testing and Modelling)
Abstract
:Featured Application
WRC, MIP, biocementation, and sands.
Abstract
Biocementation is a soil treatment technique wherein bacteria living in soil pores promote the precipitation of calcium carbonate. One of the most recent applications of this treatment is to provide resistance against the erosion of slopes by creating a resistant cover but still allowing infiltration to avoid water runoff. For modeling infiltration, it is fundamental to know the water retention curve of the treated material. This may not be an easy task because the soils most suitable for biocementation treatment are sands, due to their large pore sizes and consequent high permeability. The water retention curves (WRCs) of such types of soil are characterized for having a very small air entry value, followed by an almost-horizontal zone, which cannot be measured by using the vapor equilibrium, most of the existing sensors, or a water dewpoint potentiometer. Data from mercury intrusion porosimetry (MIP) tests can be used as an alternative to find the WRC, and this is explored in this paper. The model for the water retention curve presented considers the deformability of the soil during the MIP test, assuming an isotropic elastic behavior. The WRC derived from the MIP tests is well-fitted to the points measured by using a water dewpoint psychrometer (only for suctions above 1 MPa) and vapor equilibrium.
1. Introduction
Biocementation is a soil treatment technique wherein bacteria living in soil pores promote the precipitation of calcium carbonate (biocement). This biocement bonds soil particles and therefore improves the overall mechanical behavior and reduces permeability (see Reference [1], for example). The improvement effect depends on the amount precipitated, soil density, and grading size distribution [2,3]. The process depends on the hydrolysis of urea, CO(NH2)2, (Equation (1)) releasing carbonate ions CO32−. Calcium carbonate, CaCO3, precipitates in the presence of a feeding solution containing calcium ions, Ca2+ (Equation (2)).
This soil treatment technique is mostly adopted to increase the load-bearing capacity of foundations [1,4], provide resistance to erosion and against liquefaction [5,6,7], and decrease permeability in barriers [8]. Recently, it was used for reducing the collapse potential of soils [9,10]. The soils most adequate for this treatment are sandy soils because of their relatively large pore size with consequent high permeability, which is necessary for the circulation of the treatment fluid and compatible with bacteria size [11]. When using this technique in real cases, it is important to predict the improvement achieved (amount of calcium carbonate, strength increment, and permeability reduction) and trust in its durability. To help with such a purpose, it is important to model infiltration, as it occurs during the treatment and in service conditions, especially by taking into consideration most of the applications of this treatment. For example, one of the most recent applications of this treatment is to provide resistance against erosion of slopes by creating a resistant cover but still allowing infiltration in order to avoid water runoff. Therefore, it is fundamental to know the water retention curve of the treated material. The study of the unsaturated behavior of biocemented soils and, in particular, their water-retention properties, is relatively new, and no references were found in terms of water retention curves [12,13], which are required for numerical modeling:
CO(NH2)2 + 2 H2O → CO32− + 2 NH4+
Ca2+ + CO32− → CaCO3
The water retention curves (WRCs) of sandy soils are characterized by having a very small air entry value, followed by an almost horizontal zone and then a sharp transition for the highest suctions at the residual water content [14,15]. The air entry value is small because the pores sizes are very large, in proportion to the grains size. The sharp transition occurs when the water in the soil pores is no longer in the free form but is adsorbed into the grains. Because the particles are mainly silt instead of clay minerals, the amount of adsorbed water is very low so the water content when this transition occurs (named as residual water content) is also very low. Therefore, the water retention curve depends on pore size distribution, and this is the origin of the definition of the water retention curve, firstly defined as a tool to estimate soil permeability [16,17]. Naturally that the changes of water-retention properties were then investigated as a function of the evolution of pore size distribution caused by grading size distribution, as well as stress and suction changes [18,19,20]. Further studies allowed us to better understand the coupled hydro-mechanical behavior of the soils occurring during wetting and drying, particularly when volume changes caused by water absorption and desorption were relevant (clayey soils), and how this behavior was affecting the measurement of the water retention curves (for example, see References [15,21,22,23,24]). Later, the WRCs were incorporated into constitutive models for unsaturated soils to reflect this coupled behavior (for example, see References [25,26,27]).
Because the water retention curve is dependent on the pore size distribution, the information on pore size can naturally be used for its determination, and the data from mercury intrusion porosimetry (MIP) tests earn relevance. Data from mercury intrusion porosimetry tests can be used as an alternative to direct suction measurement for drying paths that use data from the intrusion of non-wetting mercury, considering it to be equivalent to air entry into the soil. This has been investigated by others [15,28,29,30,31,32,33,34] mainly for clayey soils and is explored in this paper for sandy soils. Although it is assumed that the soil volume remains constant during mercury intrusion, for active clayey soils, the consideration of some deformation helps in regard to adjusting the WRC from MIP to experimental data [35].
As far as the authors know, the studies using MIP data to estimate the WRC were performed for soils with a significant fine fraction, and the adjustment was very successful for the small suctions range, below the air entry value [16]. However, for the entire suction range, the curve had to be corrected to consider soil deformation occurring during the measurement of WRC due to soil–water interaction, namely volume changes, which are not occurring during MIP tests because mercury is used instead of water [19,36]. In fact, in clayey soils, the volume changes occur when mobilizing the water in the inter-aggregates (free, macrostructural water), which is between the air entry value and the residual water content, while almost no volume changes occur above the residual water content because it is when the water in the aggregates (adsorbed water) is mobilized, and the energy required is very high. For sandy soils, there is no adsorbed water by the sand particles (mainly quartz), and therefore no deformations are expected to occur as a result of the water–soil interaction explained by expansibility. However, sandy soils can also experience marked deformations due to changes in capillary forces, for example, when collapse occurs because suction is providing stability to their open structure. Anyway, the perfect adjustment of the curves from MIP and WRC is not expected, because some simplifications are adopted in MIP tests, such as (i) no deformations occur during the intrusion, (ii) pore geometry is characterized by a series of capillary cylindrical pores, (iii) all pores are connected and accessed by the mercury, and (iv) there is no influence of the air trapped in the pores or the presence of adsorbed water in the case of clay aggregates.
To take some of these limitations into consideration, the model for the water retention curve presented in this paper considers the deformability of the soil during the intrusion, assuming an isotropic elastic behavior, until a minimum void ratio defined by the maximum volume of mercury intruded. The model was tested in this study to find the WRC of a sandy soil extracted from a slope before and after being treated by using biocementation. The model was calibrated by using data from oedometer tests performed to measure the saturated and unsaturated compressibility indexes of the soil. The definition of this model explores alternative ways to find information about the WRC when the equipment available is not able to measure low suctions. Therefore, the water retention curve was measured by using WP4 (suctions above 1 MPa) and mercury intrusion porosimetry tests, MIP. Complementary tests were also performed, such as permeability tests (saturated permeability), mineralogical analysis by X-Ray diffractometry, XRD, and visualization by using Scanning Electron Microscope, SEM), to confirm that biocementation occurred.
2. Model Proposed
The water retention curve can be derived from pore-size-distribution data. The model proposed by Romero et al. [15] for clayey soils was adopted as a starting point; however, it was adapted to discard the adsorbed water at the level of the microstructure and its volume change, and, instead, it considered the deformation of the soil skeleton resulting from the intrusion process [35]. In this study, it was assumed that, although the intruded mercury would fill both the void’s volume of the sample (inner volume) and the space between the sample and the sample holder (outer volume), there would be differences because some air can be trapped in the sample voids, and some of those cannot be accessed due to soil structure. Because it is difficult to characterize this differential, it is assumed that the exterior mercury was applying pressure in a material with some compressible air trapped in closed and inaccessible pores, and that the material behaves elastically under isotropic compression. Only the drying path of the WRC was simulated, because the intrusion of non-wetting mercury in MIP tests is equivalent to air entry during drying.
The suction, s, can be computed directly from mercury pressure, pHg, using the Laplace equation (Equation (3)):
where Tw and THg are the surface tensions of water and mercury, respectively (Tw = 0.073 N/m and THg = 0.489 N/m); and θw and θHg are the contact angles of water and mercury, respectively (θw = 0° and θHg = 120°).
As defined by Romero et al. [15], the degree of saturation, Sr, can be computed by using Equation (4), and the water content can be computed by using Equation (5):
In both equations, Srm is the degree of saturation computed by considering the volume of mercury intruded until that step in relation to the maximum volume of intruded mercury (Equation (6)), and wres represents the voids that cannot be filled with mercury (Equation (7)). Both parameters are determined by knowing the eMIP, the void ratio filled with mercury until the current stage (volume of mercury intruded divided by the volume of solids of the sample), and eMIP,max, the maximum void ratio that was filled in the intrusion phase (maximum volume of mercury intruded divided by the volume of solids of the sample). Finally, wsat is the water content of the soil when fully saturated. The void ratio, e, at preparation is determined as usual (Equation (8), where Gs is the density of the solid particles):
Parameter wres in the model proposed here is updated during the intrusion process to consider changes in the void ratio, Δe (Equation (9)), of the soil when compressed inside the intrusion penetrometer. These changes are assumed to be isotropic and elastic during intrusion, and therefore the elastic compressibility index, κ, is adopted to compute the reduction in void ratio during compression caused by increasing mercury pressure (Equation (10)). From a physical point of view, it must be ensured that the void ratio computed while considering volume changes must be larger than eMIP,max:
3. Materials and Methods
3.1. Soil and Soil Samples
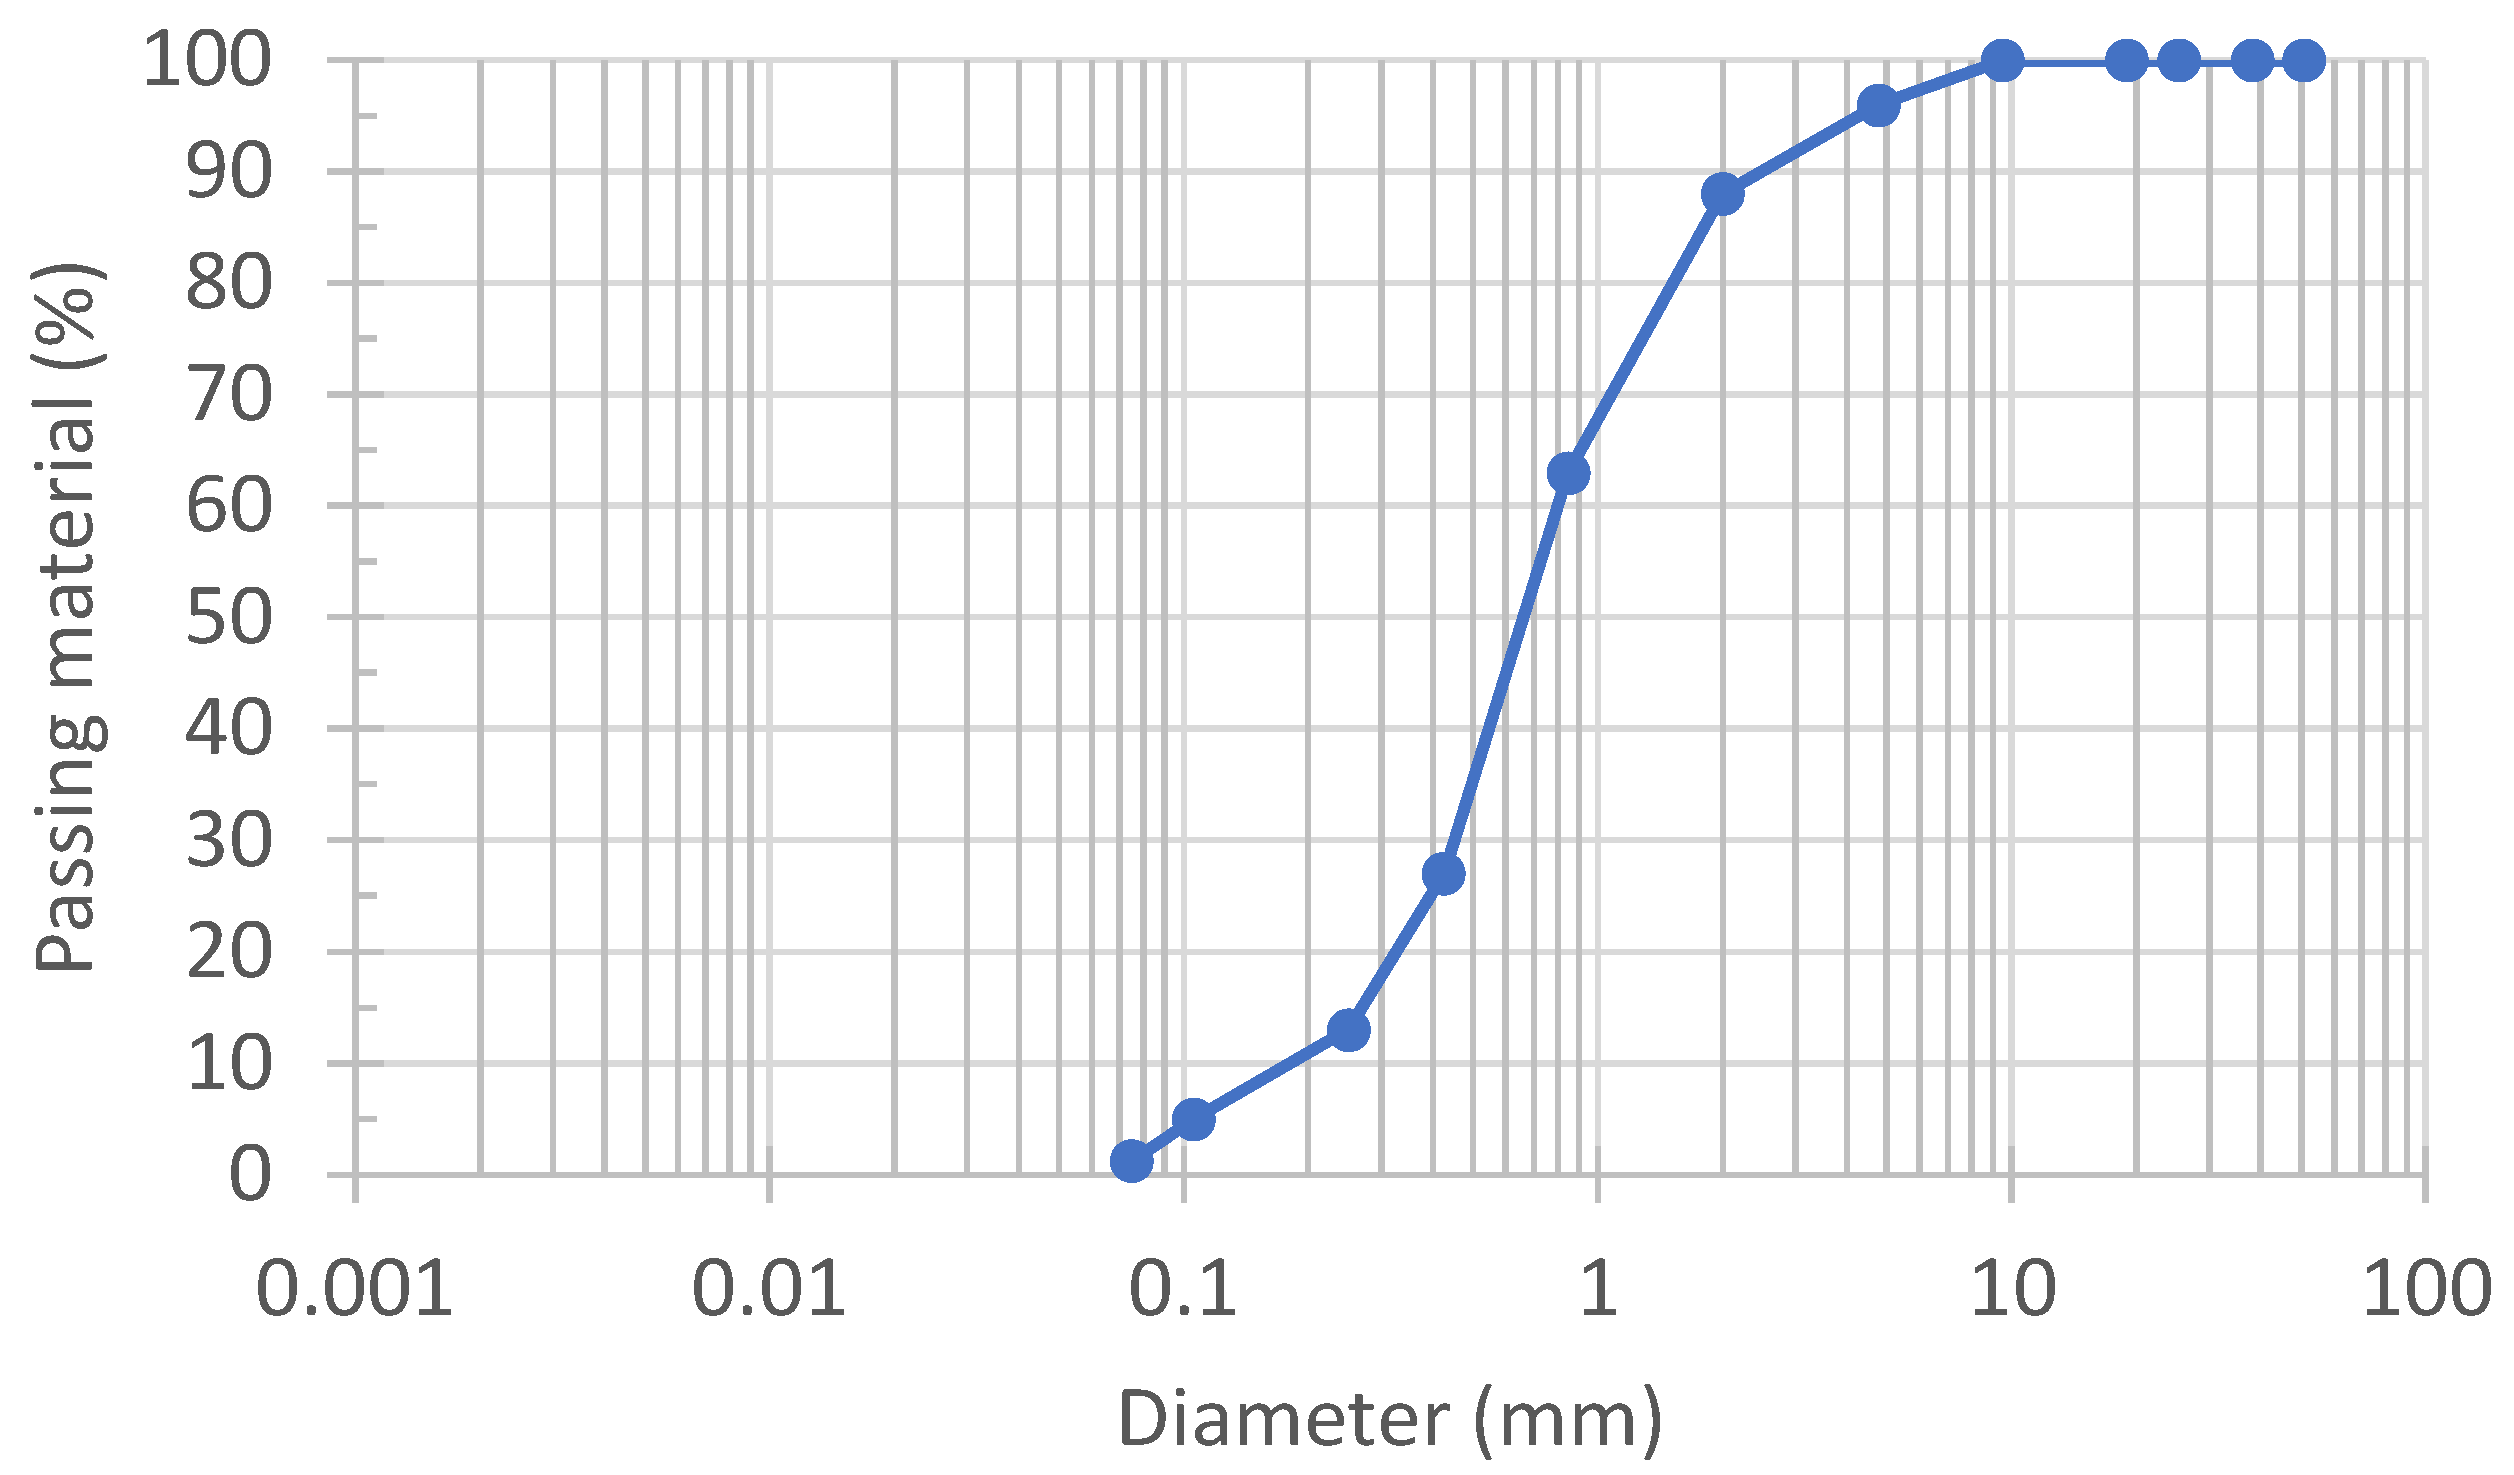
A well-graded quarzitic sand, classified as SW according to the Unified Soil Classification System, was used in this work. The grading size distribution of this soil is in Figure 1, presenting an average diameter of D50 = 0.65 mm and 1.2% of particles with a diameter of D < 0.075 mm. The volumetric weight of the solid particles is 26.1 kN/m3.
The samples tested were prepared with dry volumetric weight of 16.5 kN/m3 and water content of 5% to reproduce in situ conditions (initial void ratio is e = 0.58). This amount of water was enough to prepare a fluid sandy material that was homogeneous. They were mounted in oedometric stainless steel rings to perform oedometer and permeability tests and have samples to extract pieces for other tests. The material was premixed with distilled water before being placed by tamping in the rings (7 cm diameter and 2 cm height). Previous studies have shown that the soil has a moderate collapse potential [37] because the collapse index is 7.9%, as determined by using ASTM D5333-03 [38] (collapse deformation measured when the soil is fully saturated under the vertical stress of 200 kPa), which corresponds to a soil classified as having moderately severe collapse potential.
3.2. Bacteria and Feeding Solution
The bacteria used were from the species Bacillus pasteurii; such bacteria are non-pathogenic and very common in soils. The composition of the culture medium was 20 g/L yeast extract, 10 g/L of ammonium sulphate, and 0.13 M Tris buffer pH 9.0. They were grown at 30 °C until reaching an optical density of 1 measured for 600 nm (OD600). This corresponds to approximately 108 cells/mL. The composition of the feeding solution is of 0.5 M urea (30.03 g/L) and 0.5 M (55.40 g/L) of calcium chloride (calcium source), 1:10 diluted growth medium, 2.12 g/L of sodium bicarbonate, and 10 g/L of ammonium chloride.
3.3. Biocementation Treatment
The samples reserved for the biocementation treatment were placed above a plastic grid, which measured 0.5 cm in thickness, inside an empty plastic reservoir. The grid allowed us to create a gap between their bottom and that of the reservoir, so that the fluids with bacteria and with feeding solution could flow through the samples (see Figure 2).
Bacteria and feeding solution were added to the soil in the first three days of treatment, using a syringe to drop the fluid in the entire surface. Void volume, VV, was added each day; one-third of this volume (1/3VV) consisted of bacteria solution, and the other two-thirds of void volume (2/3VV) consisted of feeding solution. Then the samples were submerged in the feeding solution for the last three days. It can be assumed that all the samples were fully saturated during and after the treatment.
3.4. Tests Performed
3.4.1. Oedometer Tests
All the samples treated with water and with bacteria were dried to have known and constant suction. Drying was applied in a laboratory environment (relative humidity was RH = 53%, and temperature was T = 20 ± 1 °C, approx.) for 48 h. This period was enough to completely dry the samples, with their weight being controlled during this time to become stable after 24 h. Final suction was measured by using water potentiometer equipment (WP4).
For the unsaturated test, the samples were loaded and dried in a laboratory environment. For the saturated test, the samples were fully saturated after being dried so that the two tests could be compared by considering the same yielding space at (s:p) space [39]. Although the model proposed by Alonso et al. [39] is not applied to sandy soils, it was used to define the saturated and unsaturated compressibility, as well as yielding stresses and the elastic compressibility on wetting.
The loading path of the oedometer tests was 25, 50, 100, 200, 400, 800, and 1200 kPa, and the unloading was 400 and 25 kPa. The load increments were applied each 24 h. Full saturation was applied by submersion, using distilled water for both the treated and untreated samples. For the saturated test, the sample was fully saturated under 50 kPa. For the unsaturated test, full saturation was applied under 1200 kPa, with one unload–reload cycle being applied at stresses 800-400-800 kPa before the final load increment to 1200 kPa and full saturation in order to measure the unsaturated elastic compressibility index. The choice of this interval for unloading was to be sure that yielding would occur. There is no relevance for the choice of this interval, assuming that the soil behavior is elastic because the amount of biocement measured should not be very high.
3.4.2. Saturated Permeability
A falling water head test was performed to measure the saturated permeability by adapting a triaxial cell to the size of oedometer samples [37]. The sample was placed in the base of a triaxial cell inside a metallic tube exactly with the same diameter (7 cm). All joints were sealed with silicone to avoid leakage and force water flow only through the soil. Then the tube was filled with 10 cm of water above the soil, and the downstream valve was opened. The time interval necessary for water drop 1 cm in the tube was recorded, and permeability was computed as usual. Three measurements were taken, and the average value was taken.
3.4.3. Tests to Confirm the Presence of Biocement
The content of calcium carbonate was measured in each sample by the leaching method, using hydrochloric acid (0.5 M). The percentage of calcium carbonate content, %CaCO3, is given by Equation (11):
where mdry soil before is the initial weight of the soil after being oven-dried at 105 °C for 24 h, and mdry soil after is the weight of the soil after being washed by the acid until no more gas bubbles were liberated and then dried in an oven at 105 °C for 24 h. The soil was washed with distilled water before this test to remove dry precipitates from the feeding solution.
The presence of calcium carbonate was confirmed by X-ray diffraction tests, and scanning electron microscopy (SEM) images provided direct information about the presence of biocement particles coating the particles of soil.
3.4.4. Mercury Intrusion Porosimetry Tests
Mercury intrusion porosimetry (MIP) tests were performed in cubic pieces extracted from the samples (1 × 1 × 1 cm3) after being air-dried in the laboratory environment for 48 h. These tests were performed to find the pore size distributions of the untreated soil (with the water content at preparation) and after the biocementation treatment. The equipment used was AutoPore IV 9500. The low pressures applied were from approximately 3.6 to 155 kPa, and the high pressures were from approximately 0.17 to 227 MPa, with 78 s intrusion time. The contact angle adopted for the mercury was 140°.
3.4.5. Water Retention Curve
The water retention curve was measured by using the water potentiometer equipment WP4-C [40,41]. This equipment allows suction measurements between 0.5 and 84 MPa, which is not enough for sandy soils, as their air entry value is below 1 MPa, and a significant part of the curve may be under this low suction value. This equipment was used for biocemented soils by reference [13], but not for uniform grading-size sands.
The vapor equilibrium was also used to confirm WP4 measurements; however, the applied suctions were above 0.5 MPa (0.5, 3, 15, and 39 MPa). The solutions used were prepared with NaCl, following the procedure described in Reference [42].
Only the drying paths are analyzed in this paper; they are compared with the pore distribution curve of the intrusion part of the MIP test. Although there are many equations to be used in the literature (see Reference [43], for example), the equation proposed by Van Genuchten [17] (Equation (12)) was used to adjust the MIP and the experimental data because this equation is the one most used in commercial programs:
where s is suction, Sr is the degree of saturation, P is the air entry value (MPa), and y is a constant. Constants P and y are determined numerically.
4. Results and Discussion
4.1. Oedometer Tests
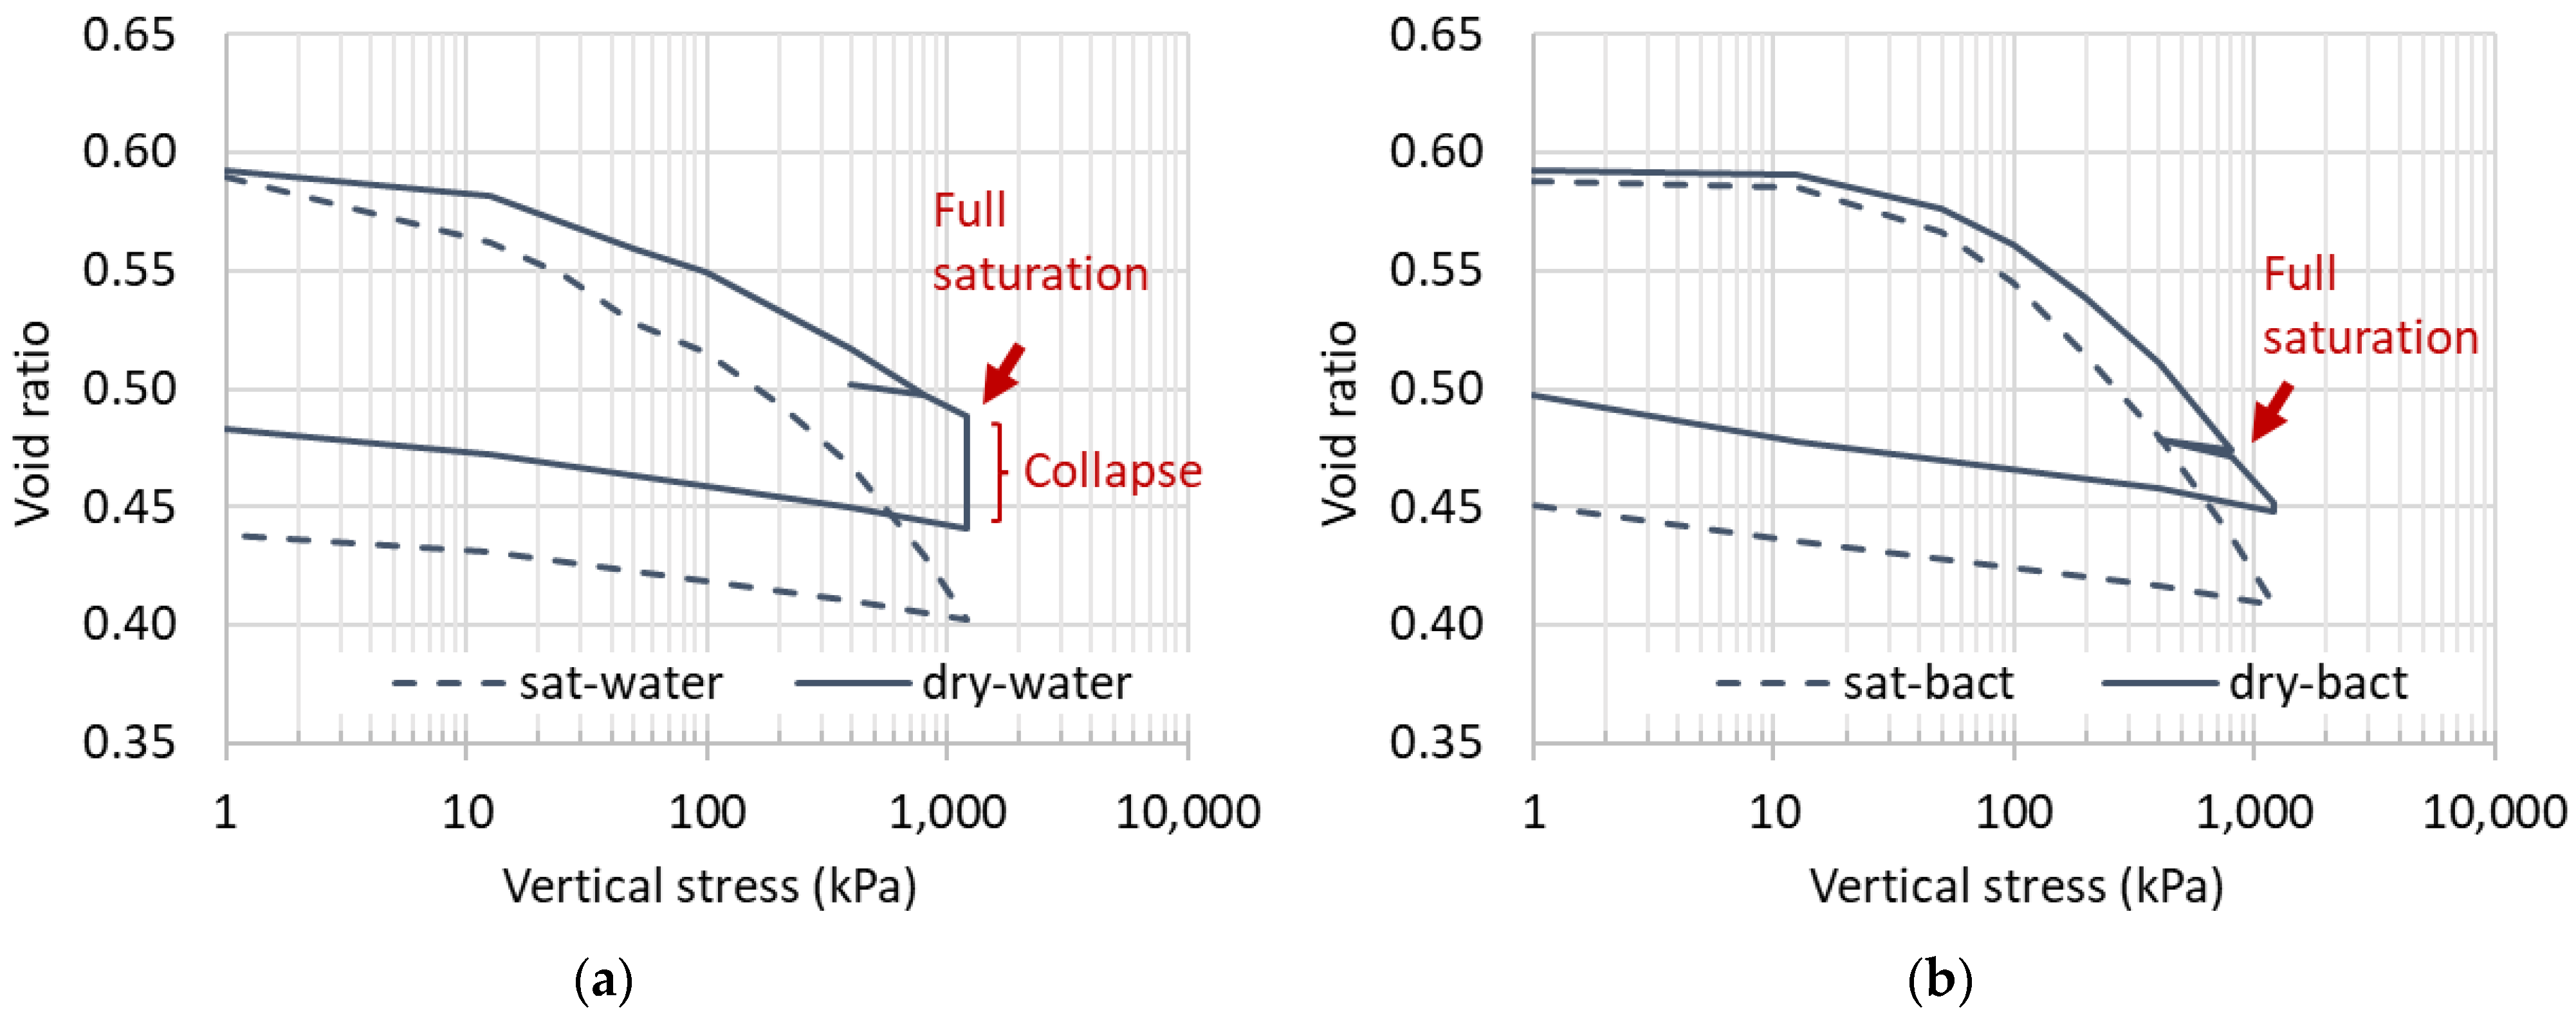
The compressibility curves of the oedometric tests are presented in Figure 3 for the samples with and without treatment (bacteria and water, respectively). The elastoplastic and elastic compressibility indexes, Cc and Cs, are presented in Table 1 for the saturated and unsaturated tests (when wetting until full saturation was applied 1200 kPa). The initial suction of the samples after drying in the laboratory environment is also presented in Table 1, confirming that they were very similar before and after the treatment.
It is worth noting that the high collapse deformation observed for the untreated soil after full saturation is highlighted in Figure 3a. The biocemented soil behaves like the untreated soil because the Cc is larger for the full saturated state than for the unsaturated one [39]. The relationship between Cc for the saturated and unsaturated samples is 4.0 for the untreated samples and 1.5 for the biocemented ones. For the treated soil, both suction and the biocement bonds maintain the metastable structure during loading in the unsaturated state [44,45,46], while the biocement continues playing this role in the saturated sample; this explains the lower amount of contrast in the Cc values for the treated soil. The presence of the biocemented bonds also increases the values of the yielding stresses, σ′y (see Table 1).
The values of Cc found are larger for the biocemented soil than for the untreated soil independently from suction—a result also found by others [47,48,49]. It was explained by structure loss caused by bond breakage during the increment of vertical stress. This is also observed in structured soils when progressive bond breakage is occurring during loading [50]. There is also the possibility of biocement dissolution after full saturation if vaterite is precipitated [51].
The elastic compressibility indexes, Cs, computed for all cases are almost the same—a result expected for the untreated soil [39]. For the biocemented soil, the presence of structure is not marked probably because the amount of biocement precipitated was small.
With Cc and Cs, it was possible to determine the elastoplastic and elastic compressibility index for changes in the net mean stresses, λ and κ, respectively [39]. The collapse deformations when full saturation was applied under 1200 kPa are also present in Table 1. Their value decreases with the treatment, proving its efficiency to treat the collapsible soils [9,10]. The elastic compressibility index for suction changes, κs, was not computed, because these collapse deformations are not elastic.
4.2. Saturated Permeability
The saturated permeability measured in the untreated sample was 5.4 × 10⁻⁵ m/s, and the one measured for the treated samples was 4.1 × 10⁻⁵ m/s. Permeability decreased slightly after the treatment. This is expected because the amount of biocement precipitated should have had some clogging effect of the soil pores [2].
4.3. Presence of Biocement
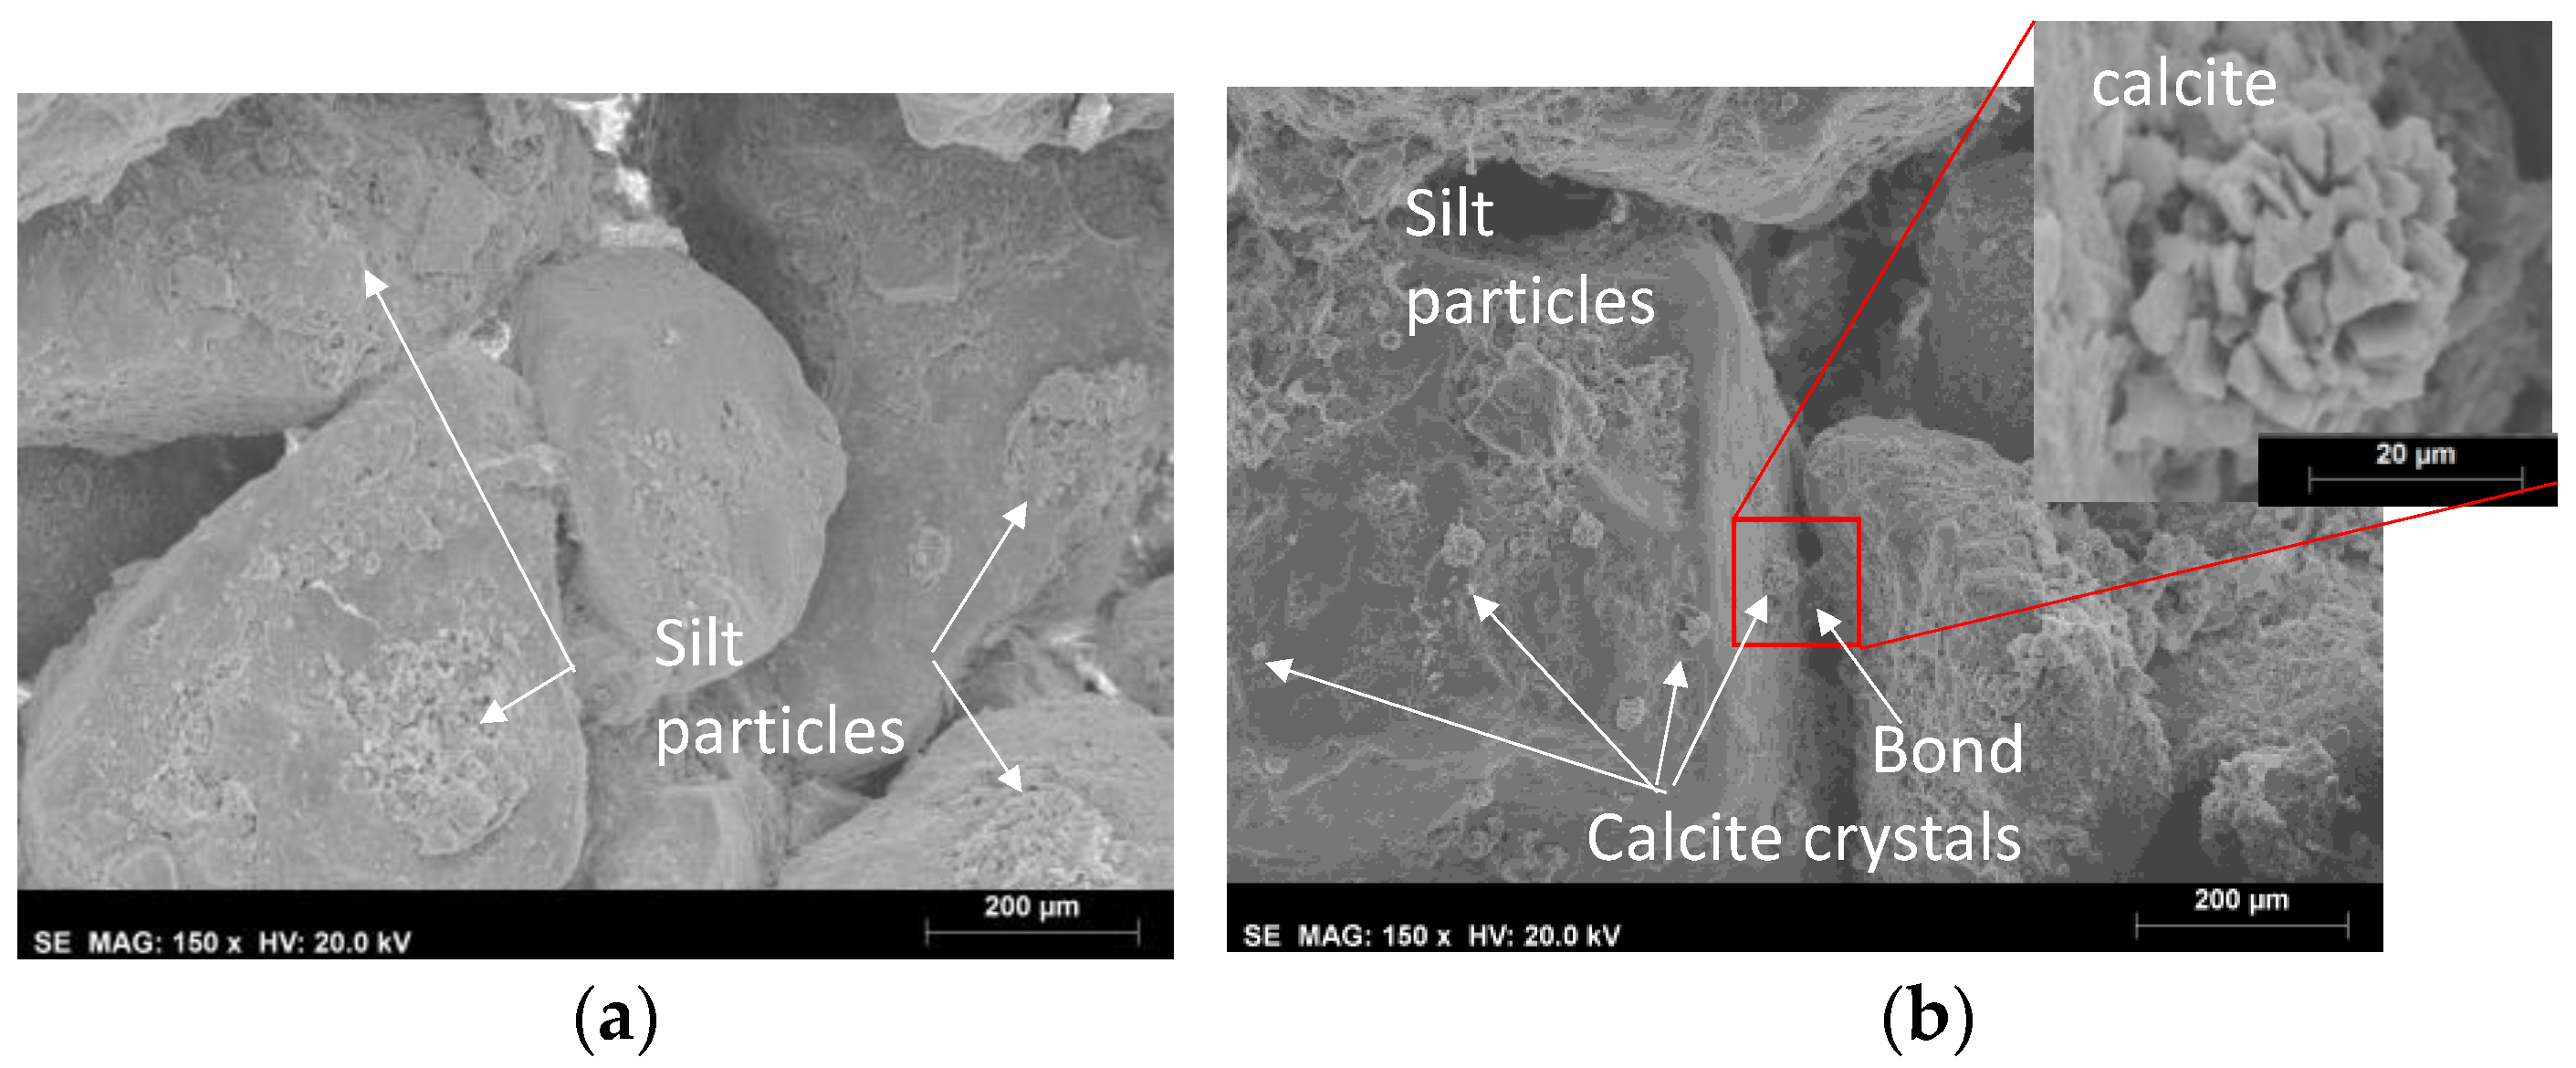
A small percentage of calcium carbonate was found in the leaching test performed on the untreated sample (0.96%), and it can be explained by mineral dissolution after acid exposition. This value increases (3.45%) for the biocemented sample, confirming that the treatment has occurred. The minerals detected by XRD on biocemented samples confirm the presence of calcium carbonate in the mineral forms of calcite and vaterite. Calcite particles and some bonds were also visible in the SEM images (see Figure 4).
4.4. Mercury Intrusion Porosimetry Tests and Water Retention Curve
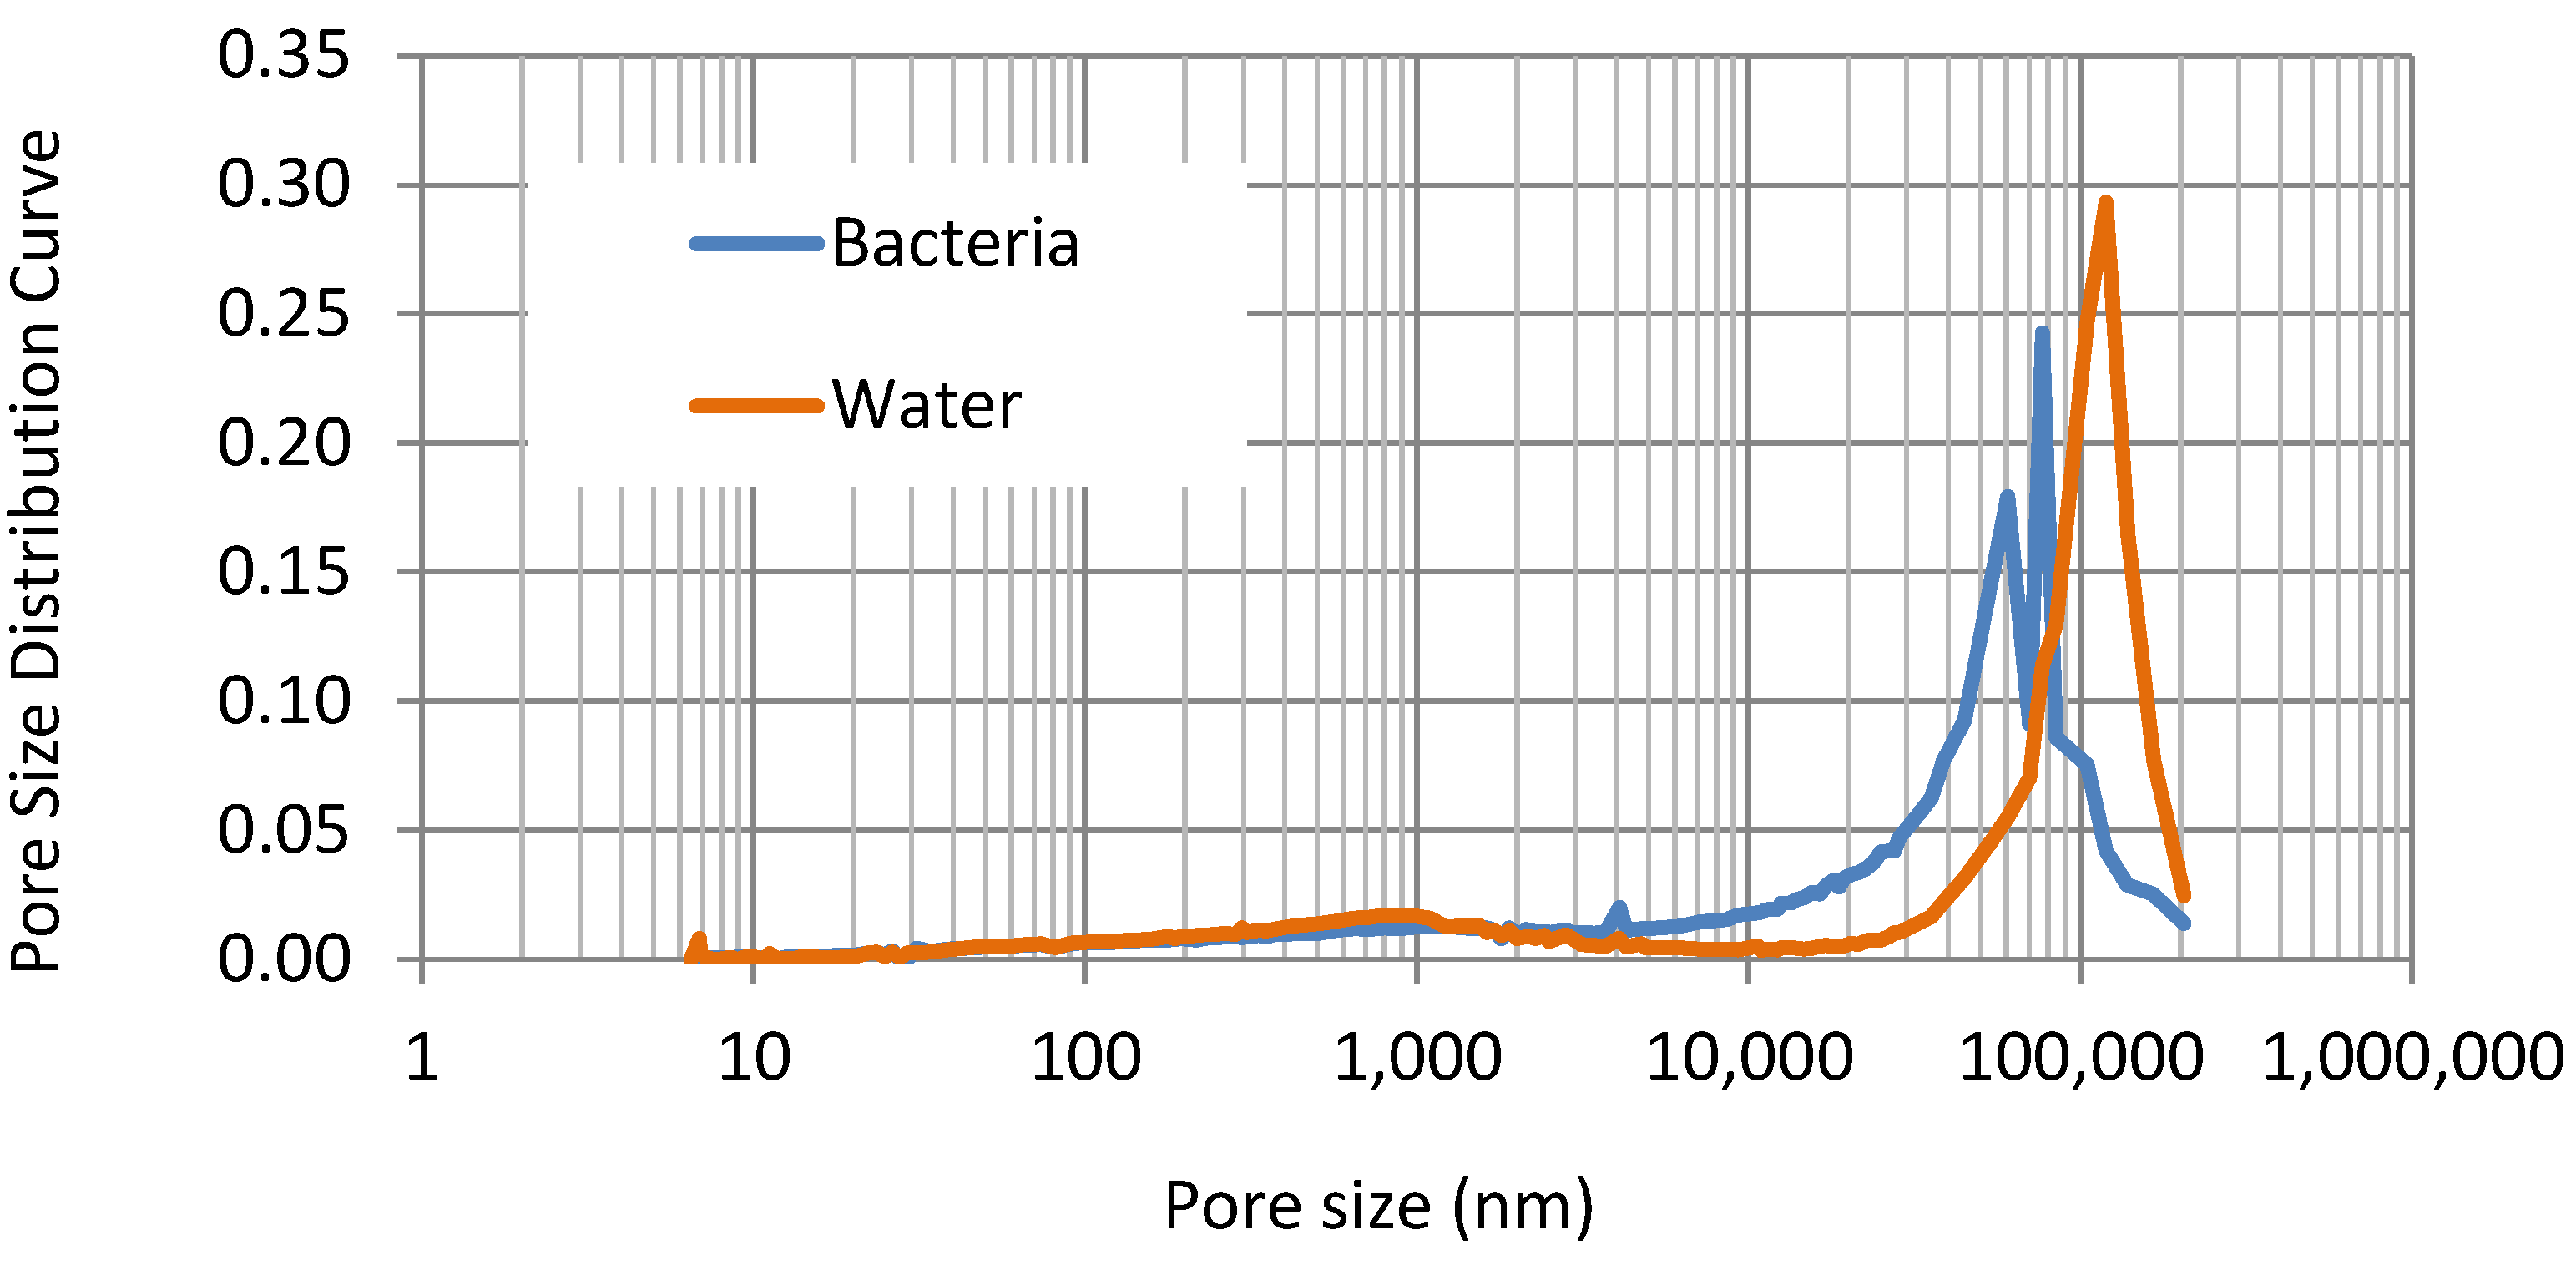
The pore size distribution curves from the MIP tests are presented in Figure 5 for the biocemented soil (Bact) and the untreated soil (Soil).
For the untreated soil, a marked peak is found at 100 µm, and a second one, much smaller and less narrow, is found around 800 nm. The treated soil presents a bimodal pore distribution, with dominant pores sizes of 75 µm and 60 µm. A very small quantity of pores with a diameter of 4 µm were also detected for this material that are not representative, and eventually there were also some pores around 800 nm that were detected. This result is consistent with the reduction of permeability observed after the treatment.
The experimental points measured with WP4-C and after vapor equilibrium are presented in Figure 6 for the drying branch of the WRC. They are all above 1 MPa due to the limitation of these methods. The WRCs computed from the pore size distribution measured in MIP tests, using the model proposed (Equations (4)–(6), (9) and (10); the values of κ used are those for the unsaturated cases in Table 1) are also in Figure 6 (bacteria MIP—biocemented soil: κ = 0.031, eMIP,max = 0.308, e = 0.582; water MIP—untreated soil: κ = 0.033, eMIP,max = 0.314, e = 0.588). It can be seen that there is a good adjustment of the curve to the measured points.
As expected, the curves computed from pore size distribution data have very low air entry value, followed by an almost-horizontal part. The air entry values are very similar for both the treated and untreated soils, being slightly larger for the biocemented soil. This result was expected because the largest pores of the two soils have similar diameters (same peaks in Figure 5); however, the biocemented soil has a doble peak, and, therefore, the smallest pores are contributing to increase the value air entry value. The transition to the largest suctions is not very sharp, probably due to the existence of some small pores detected in the MIP tests, as well (around 800 nm and 4 µm for the treated soil). The differences on the water-retention behavior observed before and after the treatment are expected because the pores’ geometry (size, volume, and tortuosity) has changed.
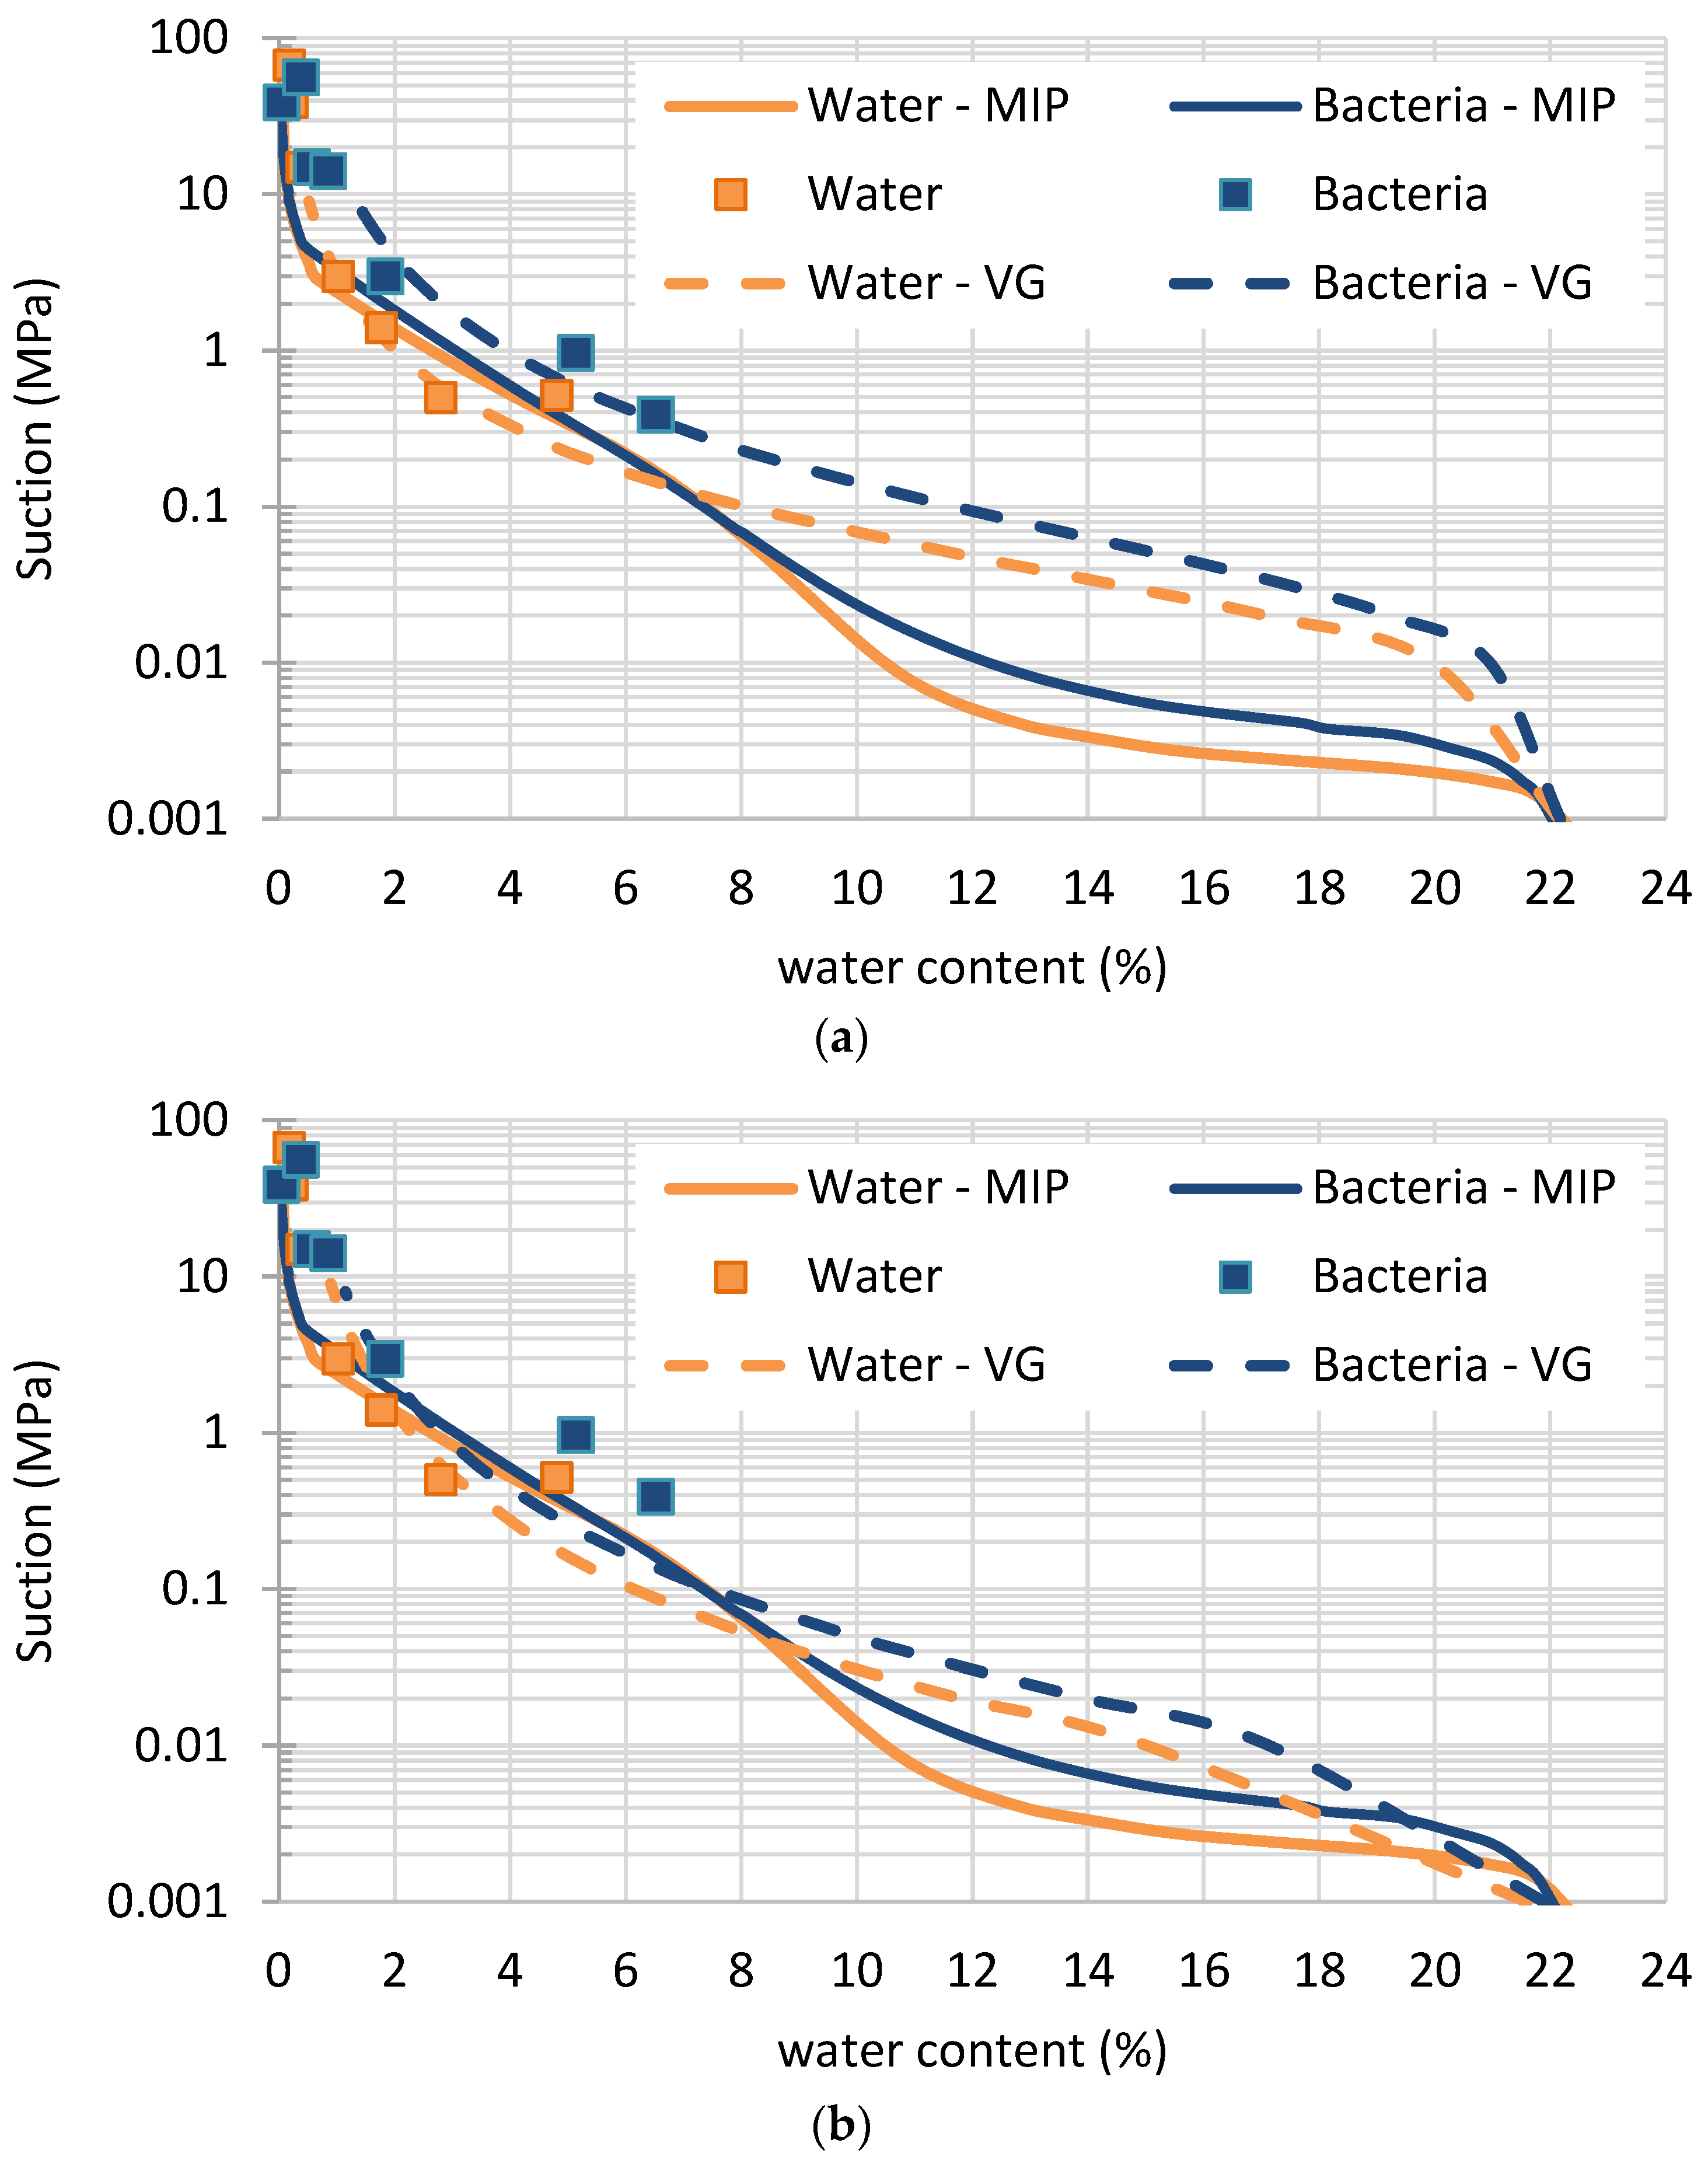
The curves from pore size distribution obtained in MIP tests were adjusted by using the expression proposed by Van Genuchten (Equation (12)). They are all presented in Figure 7 (bacteria VG—biocemented soil; water VG—untreated soil).
In Figure 7a (P = 0.02 MPa and y = 0.38 for the untreated soil, and P = 0.03 MPa and y = 0.33 for the biocemented soil), the curve computed by using Equation (12) was fitted for the experimental points. In Figure 7b (P = 0.005 MPa and y = 0.30 for the untreated soil, and P = 0.003 MPa and y = 0.30 for the biocemented soil), the curve computed by using Equation (12) was fitted considering the curve computed using pore size distribution data. The adjustment in Figure 7b appears to be worse than in Figure 7a because it does not fit the experimental points or the computed curve well; however, it fits the air entry value better and reduces the overall error computed by using mean square method.
The adjustment using data from pore size distribution obtained in MIP tests is considered acceptable below the air entry value [16], where the pressures applied for mercury intrusion are very small. The same is valid here, as insignificant changes in the void ratio are experienced for this range of pressures. By using the model proposed, which adjusts very well the experimental points measured above 0.5 MPa using conventional methods, it is believed that the curves from MIP are reliable. Therefore, data from pore size distribution can be acceptable, and the problem is the shape of the curve computed by using Equation (12). This is not the correct equation of the WRC of sandy materials, and many and other alternatives to define the WRC that are not available in commercial programs should be tested. Their choice is out of the scope of this paper, as the intention is to find information for low suctions and not the correct curve adjustment.
5. Conclusions
The paper was focused on the definition of the water retention curve of sandy soils, as this is necessary to investigate the effects of biocementation treatment, for example, to prevent soil erosion. This is a novel contribution.
A model to find the water retention curve based on pore size distribution from mercury intrusion tests was proposed and tested for a sand before and after biocementation. The model adopted considers the compressibility of the soil during the porosimetry test, caused by the presence of air entrapped in the soil pores. This explains the large differences between the void ratio at preparation and the void ratio computed by considering the total volume of mercury intruded. The model must be tested in other soils where air could be trapped in the soil pores and not removed during MIP tests, such as in the artificially cemented soil investigated.
The adjustment with the model proposed was able to fit the experimental data of the water retention curve well that were above 0.5 MPa, measured by using conventional methods. Below the air entry value, it is believed that the curves from MIP tests are reliable, as well, because the intrusion pressures are very small and are in accordance with the largest void diameters detected. The shape found for the transition zone is expected, as well, considering the usual pore size distributions of sands.
The curve in the lowest suctions can be measured by using tensiometers, axis translation, and pressure plate apparatus, but they cannot be measured by using vapor equilibrium (unless the environment is highly controlled), by most of the existing commercial sensors (resistive, capacitive, and inductive), and by water dewpoint potentiometers. Indirect techniques such as through using pore size distribution from mercury intrusion porosimetry (MIP) tests can be investigated to define the water retention curves of such soils, overcoming the difficulties in measuring the points at a very low suction range.
Author Contributions
Conceptualization, R.C.; methodology, R.C. and I.B.; validation, J.V., I.B. and R.C.; formal analysis, J.V. and R.C.; investigation, J.V. and R.C.; resources, I.B.; data curation, J.V.; writing—original draft preparation, J.V.; writing—review and editing, R.C.; visualization, R.C.; supervision, R.C.; project administration, R.C.; funding acquisition, R.C. All authors have read and agreed to the published version of the manuscript.
Funding
This research was funded by Fundação para a Ciência e a Tecnologia, FCT, I.P, projects BIOSOIL (ref. PTDC/ECI-EGC/32590/2017), and CALCITE (ref. PTDC/ECI-EGC/1086/2021).
Institutional Review Board Statement
Not applicable.
Data Availability Statement
The data presented in this study are available upon request from the corresponding author.
Conflicts of Interest
The authors declare no conflict of interest.
References
- Inanov, V.; Chu, J.; Stabnikov, V. Chapter 2 basic, construction microbial biotechnology. In Biotechnologies and Biomimetics for Civil Engineering; Pacheco Torgal, F., Labrincha, J.A., Diamanti, M.V., Yu, C.-P., Lee, H.K., Eds.; Springer: Berlin/Heidelberg, Germany, 2015. [Google Scholar]
- Al Qabany, A.; Soga, K.; Santamarina, C. Factors Affecting Efficiency of Microbially Induced Calcite Precipitation. J. Geotech. Geoenviron. Eng. 2012, 138, 992–1001. [Google Scholar] [CrossRef]
- Terzis, D.; Bernier-Latmani, R.; Laloui, L. Fabric characteristics and mechanical response of bio-improved sand to various treatment conditions. Geotech. Lett. 2016, 6, 50–57. [Google Scholar] [CrossRef] [Green Version]
- DeJong, J.T.; Fritzges, M.B.; Nüsslein, K. Microbially Induced Cementation to Control Sand Response to Undrained Shear. J. Geotech. Geoenviron. Eng. 2006, 132, 1381–1392. [Google Scholar] [CrossRef]
- Salifu, E.; MacLachlan, E.; Iyer, K.R.; Knapp, C.W.; Tarantino, A. Application of microbially induced calcite precipitation in erosion mitigation and stabilisation of sandy soil foreshore slopes: A preliminary investigation. Eng. Geol. 2016, 201, 96–105. [Google Scholar] [CrossRef] [Green Version]
- Montoya, B.M.; DeJong, J.; Boulanger, R. Dynamic response of liquefiable sand improved by microbial-induced calcite precipitation. Geotechnique 2013, 63, 302–312. [Google Scholar] [CrossRef]
- Chek, A.; Crowley, R.; Ellis, T.N.; Durnin, M.; Wingender, B. Evaluation of Factors Affecting Erodibility Improvement for MICP-Treated Beach Sand. J. Geotech. Geoenviron. Eng. 2021, 147, 04021001. [Google Scholar] [CrossRef]
- Chu, J.; Ivanov, V.; Stabnikov, V.; Li, B. Microbial method for construction of an aquaculture pond in sand. Géotechnique 2013, 63, 871–875. [Google Scholar] [CrossRef]
- Sisakht, B.N.; Nikooee, E.; Habibagahi, G.; Niazi, A. Stabilisation of collapsible soils: A biological technique. In Proceedings of the XVI ECSMGE Geotechnical Engineering for Infrastructure and Development, Edinburgh, UK, 12–17 September 2015; pp. 2829–2834. [Google Scholar]
- Sun, X.; Miao, L.; Chen, R. The application of bio-cementation for improvement in collapsibility of loess. Int. J. Environ. Sci. Technol. 2020, 18, 2607–2618. [Google Scholar] [CrossRef]
- Phadnis, H.S.; Santamarina, J.C. Bacteria in sediments: Pore size effects. Geotech. Lett. 2011, 1, 91–93. [Google Scholar] [CrossRef]
- Saffari, R.; Nikooee, E.; Habibagahi, G.; van Genuchten, M.T. Effects of Biological Stabilization on the Water Retention Properties of Unsaturated Soils. J. Geotech. Geoenv. Eng. 2019, 145, 04019028. [Google Scholar]
- Saffari, R.; Nikooee, E.; Habibagahi, G. The effect of microbial calcite precipitation on the retention properties of unsaturated fine-grained soils: Discussion of the governing factors. E3S Web Conf. 2020, 195, 05009. [Google Scholar] [CrossRef]
- Fredlund, D.G.; Rahardjo, H. Soil Mechanics for Unsaturated Soils; Wiley: New York, NY, USA, 1993. [Google Scholar]
- Romero, E.; Gens, A.; Lloret, A. Water permeability, water retention and microstructure of unsaturated compacted Boom clay. Eng. Geol. 1999, 54, 117–127. [Google Scholar] [CrossRef]
- Garcia-Bengochea, I.; Altschaeffl, A.G.; Lovell, C.W. Pore Distribution and Permeability of Silty Clays. J. Geotech. Eng. Div. 1979, 105, 839–856. [Google Scholar] [CrossRef]
- van Genuchten, M.T. A Closed-form Equation for Predicting the Hydraulic Conductivity of Unsaturated Soils. Soil Sci. Soc. Am. J. 1980, 44, 892–898. [Google Scholar] [CrossRef] [Green Version]
- Lapierre, C.; Leroueil, S.; Locat, J. Mercury intrusion and permeability of Louisville clay. Can. Geotech. J. 1990, 27, 761–773. [Google Scholar] [CrossRef]
- Romero, E.; Simms, P.H. Microstructure Investigation in Unsaturated Soils: A Review with Special Attention to Contribution of Mercury Intrusion Porosimetry and Environmental Scanning Electron Microscopy. Geotech. Geol. Eng. 2008, 26, 705–727. [Google Scholar] [CrossRef]
- Wang, M.; Pande, G.; Pietruszczak, S.; Zeng, Z. Determination of strain-dependent soil water retention characteristics from gradation curve. J. Rock Mech. Geotech. Eng. 2020, 12, 1356–1360. [Google Scholar] [CrossRef]
- Juang, C.; Holtz, R. Fabric, pore size distribution and permeability for sandy soils. J. Geotech. Eng. 1986, 112, 855–868. [Google Scholar] [CrossRef]
- Delage, P.; Lefebvre, G. Study of the structure of a sensitive Champlain clay and of its evolution during consolidation. Can. Geotech. J. 1984, 21, 21–35. [Google Scholar] [CrossRef]
- Hu, R.; Chen, Y.F.; Liu, H.H.; Zhou, C.B. A water retention curve and unsaturated hydraulic conductivity model for deformable soils: Consideration of the change in pore-size distribution. Géotechnique 2013, 63, 1389–1405. [Google Scholar] [CrossRef]
- Romero, E.; Vecchia, G.D.; Jommi, C. An insight into the water retention properties of compacted clayey soils. Géotechnique 2011, 61, 313–328. [Google Scholar] [CrossRef]
- Romero, E.; Vaunat, J. Retention curves of deformable clays. In Experimental Evidence and Theoretical Approaches in Unsaturated Soils, Proceedings of the Workshop on Unsaturated Soils, Trento, Italy, 10–12 April 2000; Tarantino, A., Mancuso, C., Balkema Rotterdam, A.A., Eds.; Taylor & Francis: New York, NY, USA, 2000; pp. 91–108. [Google Scholar]
- Gallipoli, D.; Gens, A.; Sharma, R.; Vaunat, J. An elasto-plastic model for soil incorporating the effects of suction and degree of saturation on mechanical behavior. Géotechnique 2003, 53, 123–135. [Google Scholar] [CrossRef]
- Maranha, J.R.; Pereira, C.; Cardoso, R. Effective stress in unsaturated soils: Lessons from capillarity in regular sphere arrangements. Geomech. Energy Environ. 2022, 100341. [Google Scholar] [CrossRef]
- Prapaharan, S.; Altschaeffl, A.G.; Dempsey, B. Moisture curve of compacted clay: Mercury intrusion method. J. Geotech. Eng. 1985, 111, 1139–1143. [Google Scholar] [CrossRef]
- Aubertin, M.; Mbonimpa, M.; Bussière, B.; Chapuis, R.P. A model to predict the water retention curve from basic geotechnical properties. Can. Geotech. J. 2003, 40, 1104–1122. [Google Scholar] [CrossRef]
- Zhang, L.M.; Li, X. Microporosity Structure of Coarse Granular Soils. J. Geotech. Geoenviron. Eng. 2010, 136, 1425–1436. [Google Scholar] [CrossRef]
- Wang, J.-P.; Hu, N.; François, B.; Lambert, P. Estimating water retention curves and strength properties of unsaturated sandy soils from basic soil gradation parameters. Water Resour. Res. 2017, 53, 6069–6088. [Google Scholar] [CrossRef]
- Li, P.; Vanapalli, S.; Li, T. Review of collapse triggering mechanism of collapsible soils due to wetting. J. Rock Mech. Geotech. Eng. 2016, 8, 256–274. [Google Scholar] [CrossRef]
- Cheng, Q.; Ng, C.W.W.; Zhou, C.; Tang, C.S. A new water retention model that considers pore non-uniformity and evolution of pore size distribution. Bull. Eng. Geol. Environ. 2019, 78, 5055–5065. [Google Scholar] [CrossRef]
- Sun, W.-J.; Cui, Y.-J. Determining the soil-water retention curve using mercury intrusion porosimetry test in consideration of soil volume change. J. Rock Mech. Geotech. Eng. 2020, 12, 1070–1079. [Google Scholar] [CrossRef]
- Penumadu, D.; Dean, J. Compressibility effect in evaluating the pore-size distribution of kaolin clay using mercury intrusion porosimetry. Can. Geotech. J. 2000, 37, 393–405. [Google Scholar] [CrossRef]
- Simms, P.H.; Yanful, E.K. Predicting soil–water characteristic curves of compacted plastic soils from measured pore-size distributions. Géotechnique 2002, 52, 269–278. [Google Scholar] [CrossRef]
- Vieira, J. Analysis of the Hydromechanical Behavior of a Real Soil Treated by BIO-Cementation. Master’s Thesis, Instituto Superior Técnico, University of Lisbon, Lisboa, Portugal, 2022. (In Portuguese). [Google Scholar]
- ASTM D5333-03; Standard Test Method for Measurement of Collapse Potential of Soils. ASTM International: West Conshohocken, PA, USA, 2003.
- Alonso, E.E.; Gens, A.; Josa, A. A constitutive model for partially saturated soils. Géotechnique 1990, 40, 405–430. [Google Scholar] [CrossRef] [Green Version]
- Leong, E.-C.; Tripathy, S.; Rahardjo, H. Total suction measurement of unsaturated soils with a device using the chilled-mirror dew-point technique. Géotechnique 2003, 53, 173–182. [Google Scholar] [CrossRef]
- Cardoso, R.; Lima, A.; Romero, E.; Ferrari, A. A comparative study of soil suction measurement using two different high-range psychrometers. In Proceedings of the 2nd International Conference, Mechanics of Unsaturated Soils, Weimar, Germany, 7–9 March 2007; Springer: Berlin, Germany, 2007. [Google Scholar]
- Romero, E. Controlled-suction techniques. In Proceedings of the 4th National Brazilian Symposium on Unsaturated Soils, Rio de Janeiro, Brazil, 25–28 July 2011; Gehling, W.Y., Schnaid, F., Eds.; ABMS: Rio de Janeiro, Brazil, 2001; pp. 535–542. [Google Scholar]
- Fredlund, D.; Xing, A. Equations for the soil-water characteristic curve. Can. Geotech. J. 1994, 31, 521–532. [Google Scholar] [CrossRef]
- Mitchell, J.; Soga, K. Fundamentals of Soil Behavior, 3rd ed.; John Wiley and Sons: Hoboken, NJ, USA, 2005. [Google Scholar]
- Haeri, S.M.; Garakani, A.A.; Khosravi, A.; Meehan, C.L. Assessing the Hydro-Mechanical Behavior of Collapsible Soils Using a Modified Triaxial Test Device. Geotech. Test. J. 2013, 37, 190–204. [Google Scholar] [CrossRef]
- Vandanapu, R.; Omer, J.R.; Attom, M.F. Geotechnical case studies: Emphasis on collapsible soil cases. Proc. Inst. Civ. Eng. Forensic Eng. 2016, 169, 103–110. [Google Scholar] [CrossRef] [Green Version]
- Lee, M.L.; Ng, W.S.; Tanaka, Y. Stress-deformation and compressibility responses of bio-mediated residual soils. Ecol. Eng. 2013, 60, 142–149. [Google Scholar] [CrossRef]
- Cardoso, R.; Borges, I.; Pires, I. Modelling oedometer tests on biocemented soils considering bonds presence. In Congress on Numerical Methods in Engineering; CMN2019: Guimarães, Portugal, 2019. [Google Scholar]
- Harran, R.; Terzis, D.; Laloui, L. Characterizing the Deformation Evolution with Stress and Time of Biocemented Sands. J. Geotech. Geoenviron. Eng. 2022, 148, 04022074. [Google Scholar] [CrossRef]
- Leroueil, S.; Vaughan, P.R. The general and congruent effects of structure in natural soils and weak rocks. Géotechnique 1990, 40, 467–488. [Google Scholar] [CrossRef]
- Cardoso, R.; Pedreira, R.; Duarte, S.O.; Monteiro, G.A. About calcium carbonate precipitation on sand biocementation. Eng. Geol. 2020, 271, 105612. [Google Scholar] [CrossRef]
Figure 1.
Grading size distribution curve of the soil.

Figure 2.
Experimental setup: (a) first three days and (b) submersion.

Figure 3.
Oedometric curves: (a) untreated samples and (b) biocemented samples.

Figure 4.
SEM images of the soil: (a) before treatment; (b) after treatment, showing calcite crystals.
Figure 4.
SEM images of the soil: (a) before treatment; (b) after treatment, showing calcite crystals.

Figure 5.
Pore size distributions of the samples tested (bacteria—biocemented soil; water—untreated soil in natural state).
Figure 5.
Pore size distributions of the samples tested (bacteria—biocemented soil; water—untreated soil in natural state).

Figure 6.
Water retention curve and its adjustment from using the equations proposed in this paper in which the material behaves elastically under isotropic compression. (Bacteria—biocemented soil; water—untreated soil in natural state).
Figure 6.
Water retention curve and its adjustment from using the equations proposed in this paper in which the material behaves elastically under isotropic compression. (Bacteria—biocemented soil; water—untreated soil in natural state).

Figure 7.
Adjustment water-retention data, using the equation proposed by Van Genuchten [17] (Equation (12)) to fit (a) the experimental points and (b) the curve computed by using pore size distribution. (Bacteria—biocemented soil; water—untreated soil in natural state).
Figure 7.
Adjustment water-retention data, using the equation proposed by Van Genuchten [17] (Equation (12)) to fit (a) the experimental points and (b) the curve computed by using pore size distribution. (Bacteria—biocemented soil; water—untreated soil in natural state).


Table 1.
Results of the oedometer tests.
| Sample | δεvol (%) | Cc | Cs | κ | λ(s) | σ′y (kPa) | |
|---|---|---|---|---|---|---|---|
| Untreated soil—water (initial suction s = 67.5 MPa) | Saturated | -- | 0.137 | 0.014 | 0.034 | 0.316 | 80 |
| Unsaturated | 3.0 | 0.034 | 0.015 | 0.035 | 0.114 | 100 | |
| Biocemented soil—bacteria (initial suction s = 62.7 MPa) | Saturated | -- | 0.162 | 0.013 | 0.031 | 0.372 | 100 |
| Unsaturated | 0.2 | 0.109 | 0.016 | 0.037 | 0.285 | 120 |
Publisher’s Note: MDPI stays neutral with regard to jurisdictional claims in published maps and institutional affiliations. |
© 2022 by the authors. Licensee MDPI, Basel, Switzerland. This article is an open access article distributed under the terms and conditions of the Creative Commons Attribution (CC BY) license (https://creativecommons.org/licenses/by/4.0/).
Share and Cite
MDPI and ACS Style
Cardoso, R.; Vieira, J.; Borges, I. Water Retention Curve of Biocemented Sands Using MIP Results. Appl. Sci. 2022, 12, 10447. https://0-doi-org.brum.beds.ac.uk/10.3390/app122010447
AMA Style
Cardoso R, Vieira J, Borges I. Water Retention Curve of Biocemented Sands Using MIP Results. Applied Sciences. 2022; 12(20):10447. https://0-doi-org.brum.beds.ac.uk/10.3390/app122010447
Chicago/Turabian StyleCardoso, Rafaela, Joana Vieira, and Inês Borges. 2022. "Water Retention Curve of Biocemented Sands Using MIP Results" Applied Sciences 12, no. 20: 10447. https://0-doi-org.brum.beds.ac.uk/10.3390/app122010447
Note that from the first issue of 2016, this journal uses article numbers instead of page numbers. See further details here.