
Whole-Heart Assessment of Turbulent Kinetic Energy in the Repaired Tetralogy of Fallot

1
Department of Biomedical Engineering, University of Calgary, Calgary, AB T2N 1N4, Canada
2
Stephenson Cardiac Imaging Centre, University of Calgary, Calgary, AB T2N 1N4, Canada
3
Department of Cardiac Sciences, Cumming School of Medicine, University of Calgary, Calgary, AB T2N 1N4, Canada
4
Libin Cardiovascular Institute, University of Calgary, Calgary, AB T2N 1N4, Canada
5
Alberta Children’s Hospital Research Institute, University of Calgary, Calgary, AB T2N 1N4, Canada
6
Department of Biochemistry and Molecular Biology, Cumming School of Medicine, University of Calgary, Calgary, AB T2N 1N4, Canada
7
Department of Radiology, Cumming School of Medicine, University of Calgary, Calgary, AB T2N 1N4, Canada
*
Author to whom correspondence should be addressed.
Appl. Sci. 2022, 12(21), 10946; https://doi.org/10.3390/app122110946
Submission received: 30 September 2022
/
Revised: 24 October 2022
/
Accepted: 24 October 2022
/
Published: 28 October 2022
(This article belongs to the Special Issue Biomedical Imaging Technologies for Cardiovascular Disease - Volume II)
Abstract
:Featured Application
Turbulence kinetic energy can be useful to characterize repair of Tetralogy of Fallot hemodynamic abnormalities.
Abstract
Approximately 10% of congenital heart diseases (CHDs) include Tetralogy of Fallot (TOF). Fortunately, due to advanced surgical techniques, most patients survive until adulthood. However, these patients require frequent monitoring for postoperative complications leading to heart hemodynamic alterations. Turbulent kinetic energy (TKE), as derived from 4D-flow magnetic resonance imaging (4D-flow MRI), has been used to characterize abnormal heart hemodynamics in CHD. Hence, this study aimed to assess the difference in TKE between patients with repaired TOF (rTOF) and healthy volunteers. A total of 35 subjects, 17 rTOF patients and 18 controls, underwent standard-of-care cardiac MRI and research 4D-flow MRI using a clinical 3T scanner. Heart chambers and great vessels were segmented using 3D angiograms derived from 4D-flow MRI. The TKE was quantified within segmented volumes. TKE was compared to standard cardiac MRI metrics. Controls demonstrated higher TKE in the left atria and left ventricle. However, patients demonstrated higher TKE in the right atria, right ventricle (p < 0.05), and pulmonary artery. Lastly, no correlation was observed between TKE and standard clinical measurements. TKE can be a key indicator of the abnormal hemodynamics present in patients with rTOF and can assist future interventions and help monitor long-term outcomes.
1. Introduction
In the cardiovascular system, blood flow is maintained with high efficiency to obtain laminar flow between heart chambers and vessels [1]. However, nonlaminar flow (transitional and turbulent) is observed in many congenital heart diseases; in particular, patients with repaired Tetralogy of Fallot (rTOF) can develop changes in turbulent kinetic energy (TKE) [2]. Tetralogy of Fallot (TOF) is a common cyanotic congenital heart defect which is a combination of four defects including right ventricular hypertrophy (RVH), pulmonary stenosis (PS), ventricular septal defect (VSD), and overriding aortic root [3]. Luckily, due to advancements in cardiovascular surgical techniques that aim to increase flow to the pulmonary circulation, a 40% reduction in death outcomes has been achieved in specialized hospitals [4]. Long-term survival can reach 90% after 20 years of surgical repair. Despite patients now surviving into adulthood, these patients still require frequent and long-term monitoring for many postoperative complications that still arise over time, including right ventricle (RV) dilation and hypertrophy, left or right ventricular dysfunction, RV outflow tract obstruction, and pulmonary regurgitation (PR) [4]. These complications are due to the adverse effects faced within the hemodynamics of the cardiovascular system, contributing to poor long-term outcomes including sudden cardiac death, progressive exercise intolerance, and ventricular arrhythmia [5,6,7]. Surgical and percutaneous pulmonary valve replacements could prevent some of these long-term complications. Unfortunately, guideline indications are not well-supported for these procedures since a better understanding of heart (dys)function and hemodynamics in rTOF is needed.
Transthoracic echocardiography is the first line imaging modality for assessing cardiovascular diseases given its easy accessibility, low cost, and safety [8,9]. However, it may be limited by poor acoustic windows, beam alignments, operator dependence, and inaccuracy for quantifying regurgitant lesions [10,11,12]. Currently, standard cardiac magnetic resonance (CMR) is the gold standard for monitoring heart functions and remodeling in patients with rTOF [13]. CMR is able to identify rTOF complications based on morphological and simplified functional parameters including ejection fraction, ventricular volume, etc. [14]. However, these measurements provide a late expression of the physiological changes that occur, resulting in an inaccurate prediction of the true outcome [15,16]. Flow is usually evaluated using 2D phase contrast, which can provide unidirectional velocity measurements perpendicular to the acquisition plane in the vessel of interest. In addition, these measurements do not provide us with an accurate representation of the 3D complexity of the blood flow due to its 2D nature, hence limiting access to flow information in all directions [17]. Furthermore, due to this restriction, it does not provide detailed information or a complete picture regarding alterations in the hemodynamic patterns within the entire heart. In addition, noninvasive Doppler methods allow us to measure adverse velocity fluctuations, but they are also limited in one direction due to the restriction of the ultrasound beam and have an elevated user variability [18,19]. Hence, advanced imaging modalities and more sensitive markers need to be developed, evaluated, and assessed in order to help guide therapy and improve future outcomes within this patient cohort.
A promising noninvasive approach is 4D-flow magnetic resonance imaging (MRI), which provides advanced hemodynamic information enabling the quantification of advanced fluid dynamic metrics, including Turbulent Kinetic Energy (TKE), pressure difference maps, and viscous energy loss [5,20]. As blood flow velocities are measured in all three spatial directions with 4D-flow MRI, it facilitates the volumetric analysis of congenital diseases, such as TOF. In particular, 4D-flow-derived TKE describes the kinetic energy of the fluctuating velocity field and quantifies the inefficiencies of the energetic transfer in the blood flow [21]. This metric can help provide a functional outcome for patients with rTOF [22]. Therefore, the objective of this study is to use 4D-flow MRI to quantify TKE on the entire heart of patients with rTOF and compare it to standard clinical parameters.
2. Materials and Methods
2.1. Study Population
A single-center retrospective case study was performed to compare patients with rTOF with health controls. A total of 17 patients with rTOF (age: 28 ± 8, 5 females) and 18 controls (36 ± 12, 7 females) were recruited from our local observational Cardiovascular Imaging Registry of Calgary (CIROC). The University of Calgary Research Ethics Board approved the study and all subjects provided written consent at the time of the scan’s examination. Research activities were performed in accordance with the Declaration of Helsinki. Informed consent from both cohorts was captured using health questionnaires and a dedicated software was used for the collection of standard MRI-related parameters (CardioDITM, Cohesic Inc., Calgary, AB, Canada). Inclusion criteria for the controls were the following: All participants had no history of cardiovascular diseases or diabetes; they were all older than 18 years of age and had no history of uncontrolled hypertension, as confirmed by a certified nurse. Moreover, the inclusion criteria for the patients were the following: All patients had a history of a TOF repair, and all were older than 18 years of age at the time of examination. However, the exclusion criteria for the controls included the following if they were unable to complete the MRI scan, while the exclusion criteria for the patients were the following: if the patient had severe renal impairments (eGFR < 30 mL/min/1.73 m2) and if they were unable to complete the MRI scans due to implantable devices or any other contra-indications for MRI [23]. Prior to scanning, basic demographic measurements were collected, including age, sex, weight, and heart rate. The body surface area was calculated using the Mosteller formula.
2.2. Cardiac Magnetic Resonance Imaging Protocol
A standardized cardiac imaging protocol for congenital heart diseases was performed on all participants using 3T MRI scanners (Skyra and Prisma, Siemens, Erlangen, Germany) in accordance with published recommendations [23]. Imaging of the entire heart was achieved via standard routine electrocardiographic (ECG) gating, balanced time-resolved steady-state free precision (SSFP) cine imaging in short-axis, 3-chamber, 2-chamber, and 4-chamber views. Moreover, a 3D contrast-enhanced magnetic resonance angiography (CEMRA) of the entire heart was also performed by administering 0.2 mmol/kg of gadolinium contrast (Gadovist®, Bayer Inc., Mississauga, ON, Canada). For volumetric blood flow assessments, a time-resolved 3D phase-contrast MRI with three-directional velocity encoding was obtained using a 4D-flow MRI WIP from Siemens (WIP 845A). The entire heart was covered using sagittal slices. The acquisition was performed for 5–10 min followed by the administration of the contrast agent, using retrospective ECG gating and free-breathing supported by a diaphragmatic motion navigator. The following parameters were used for the 4D-flow acquisition: bandwidth = 455–495 Hz/Pixel; pulse repetition time = 4.53–5.07 ms; echo time = 2.01–2.35 ms; flip angle = 15 degrees; spatial resolution = 2.0–3.6 × 2.0–3.0 × 2.5–3.5 mm3; Venc = 150–250 cm/s; phases = 30; and temporal resolution = 25–35 ms. The total acquisition time varied depending on the patient’s heart rate and respiratory navigator efficiency.
2.3. Standard Cardiac Imaging Analysis
Standard cardiac images were analyzed by a blinded observer on the same day of the acquisition using a dedicated clinical software cvi42 version 5.11.5 (Circle Cardiovascular Imaging Inc, Calgary, AB, Canada) to determine left and right end-diastolic volume (LVEDV; RVEDV), LV and RV end-systolic volume (LVESV; RVESV), and LV and RV ejection fraction (LVEF; RVEF), as part of standard clinical reading.
2.4. 4D-Flow Data Analysis
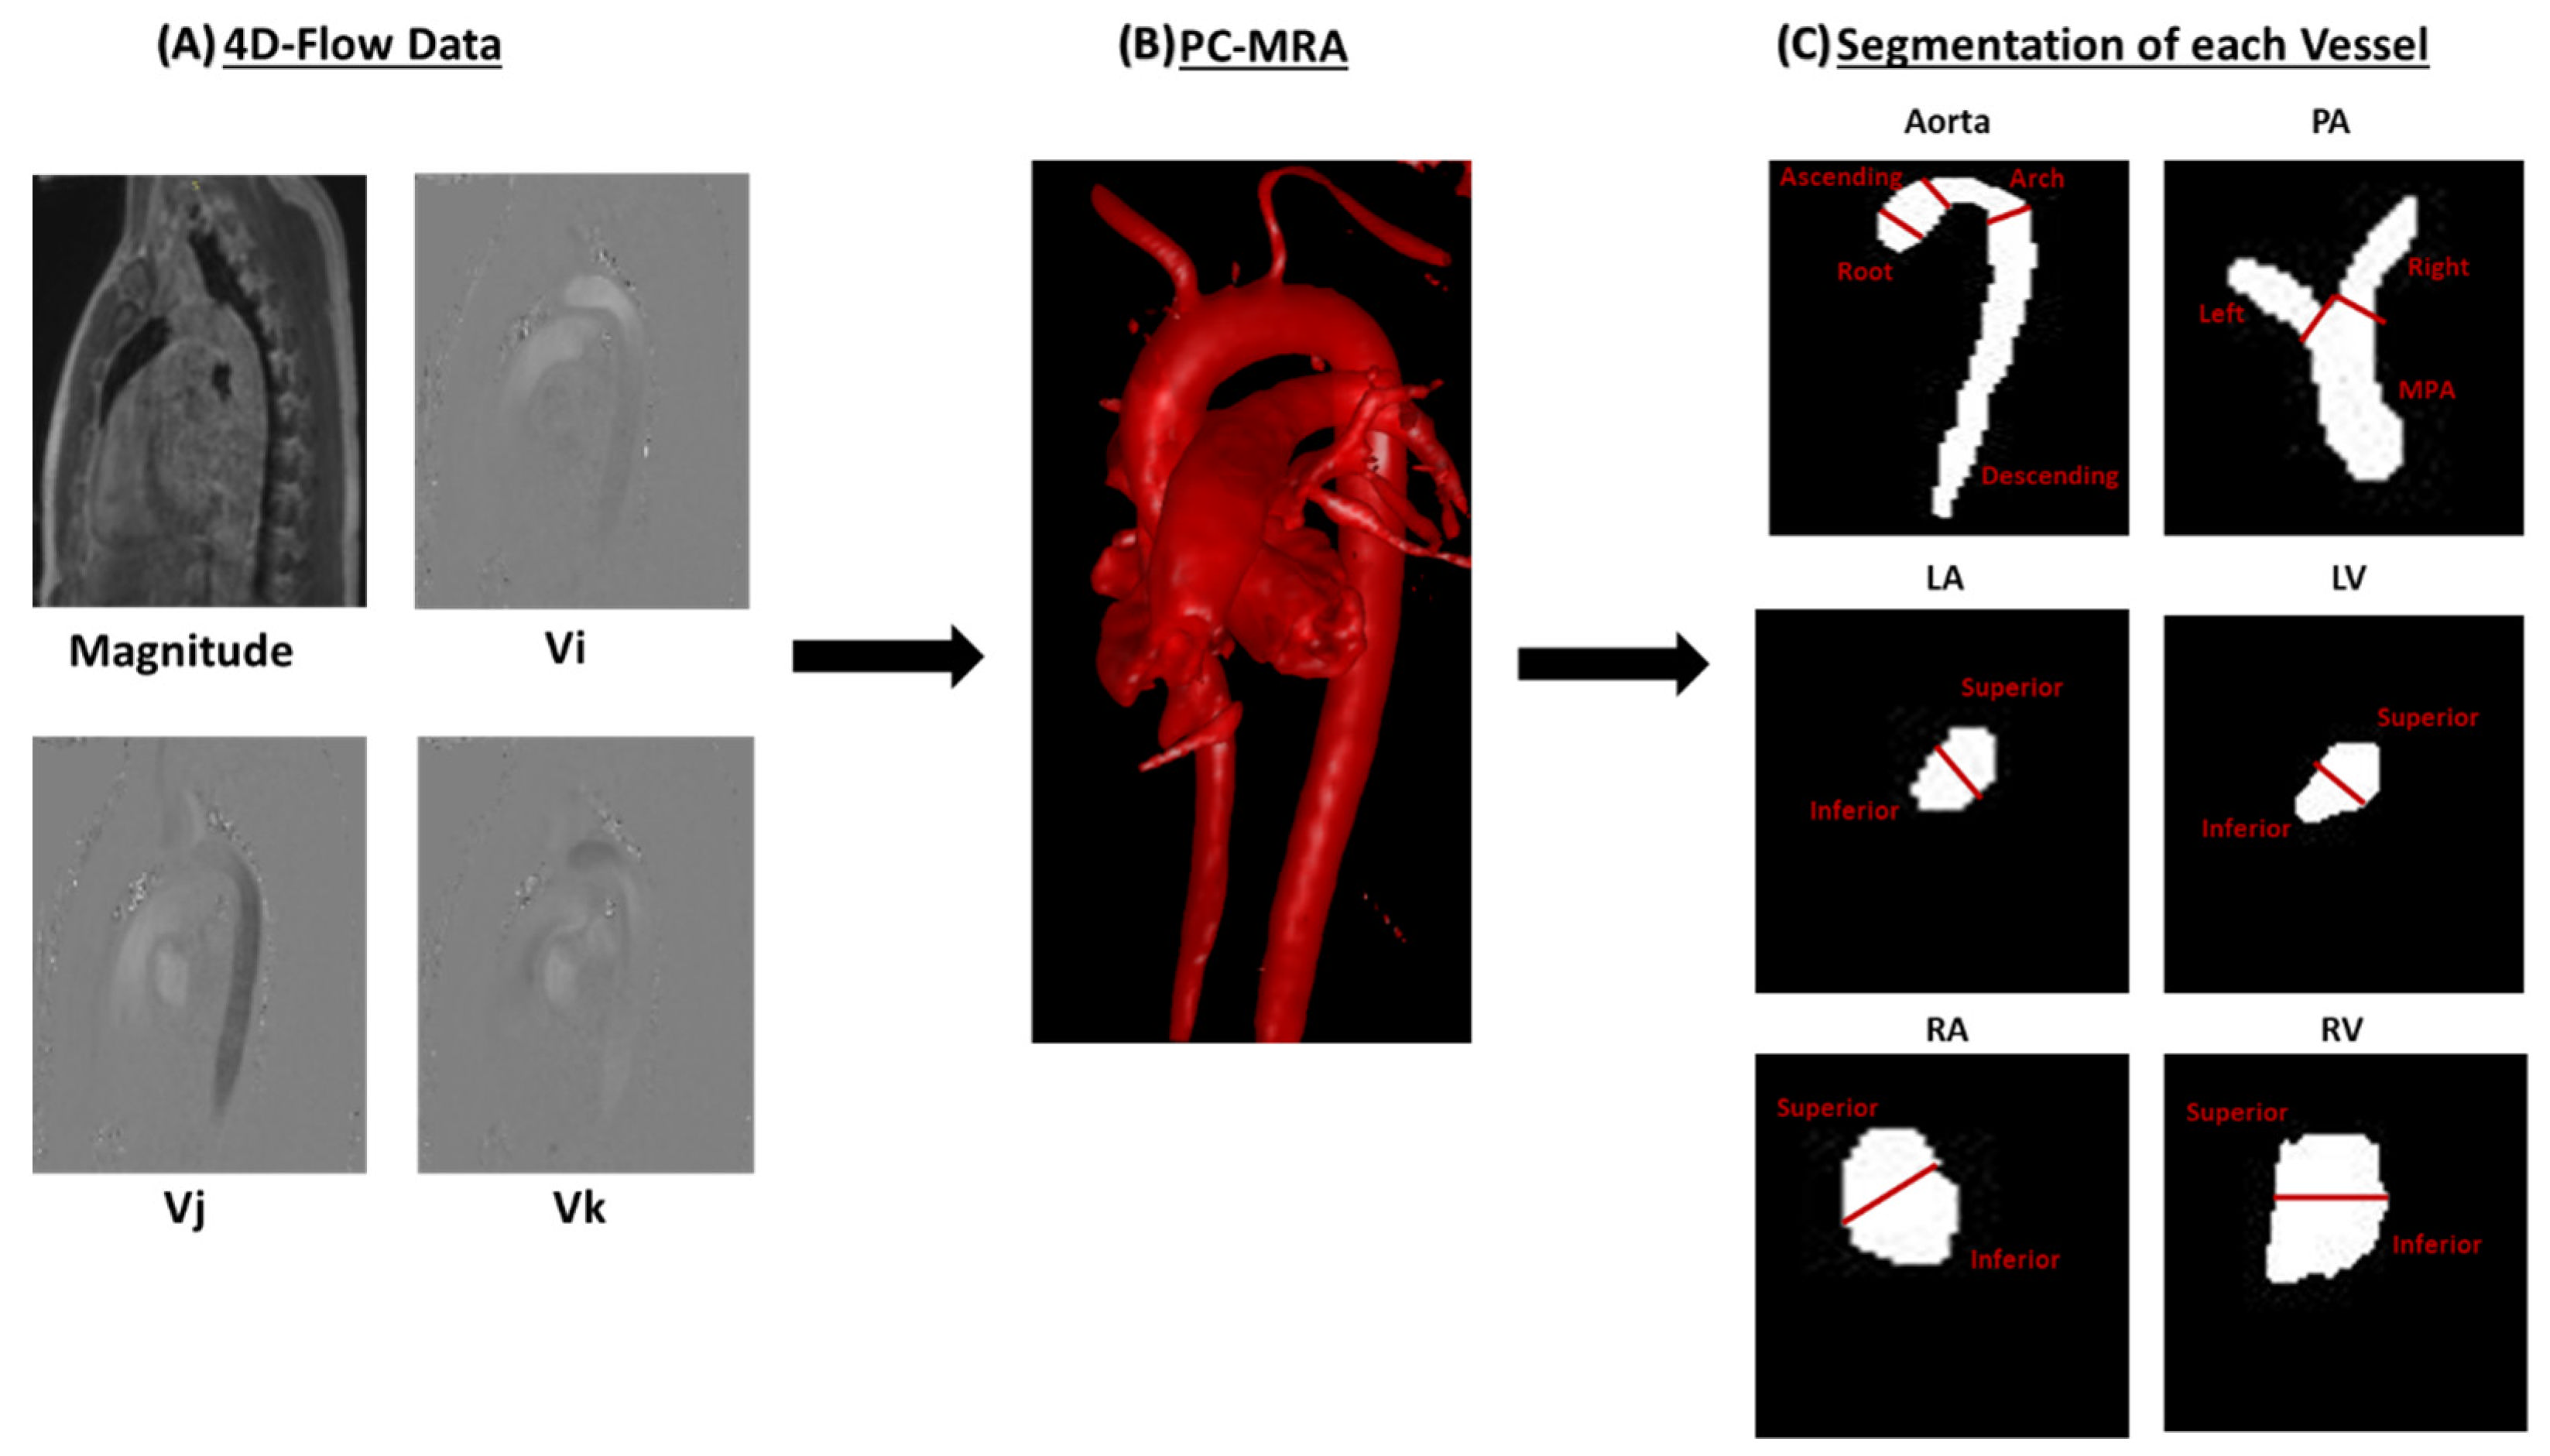
As shown in Figure 1, after acquisition, 4D-flow data were corrected for eddy currents, i.e., linear phase drift according to static tissues, noise masking, and velocity aliasing using “Velomap_tool”, a Matlab tool developed by Bock et al. in 2007 and that is broadly used by the flow MRI community [24]. Our in-house tool “4D-Flow Analysis Tool” was developed in MATLAB 2020b (Mathworks, Natick, MA, USA) and integrates the Velomap tool for data pre-processing. After data correction, an individual phase-contrast magnetic resonance angiogram (PC-MRA) throughout the entire cardiac cycle was used to segment the following vessels: Aorta, Pulmonary Artery (PA), Left Atria (LA), Left Ventricle (LV), Right Atria (RA), and Right Ventricle (RV). The PC-MRA is given by , where is the magnitude image, is the spatial location within the volume, is the velocity-encoded image with j representing the velocity encoding direction in image coordinates (x, y, z), and i is the measured time frame in the cardiac cycle. This segmentation approach has been previously reported [25,26]. Furthermore, each vessel was divided into several regional volumes for facilitating data analysis. The Aorta was divided into the following 4 segments: aortic root, arch, ascending aorta, and descending aorta. The PA was divided into the following 3 segments: left pulmonary artery (LPA), right pulmonary artery (RPA), and mid pulmonary artery (MPA). Lastly, the LA, LV, RA, and RV were divided into the following 2 segments: inferior and superior.
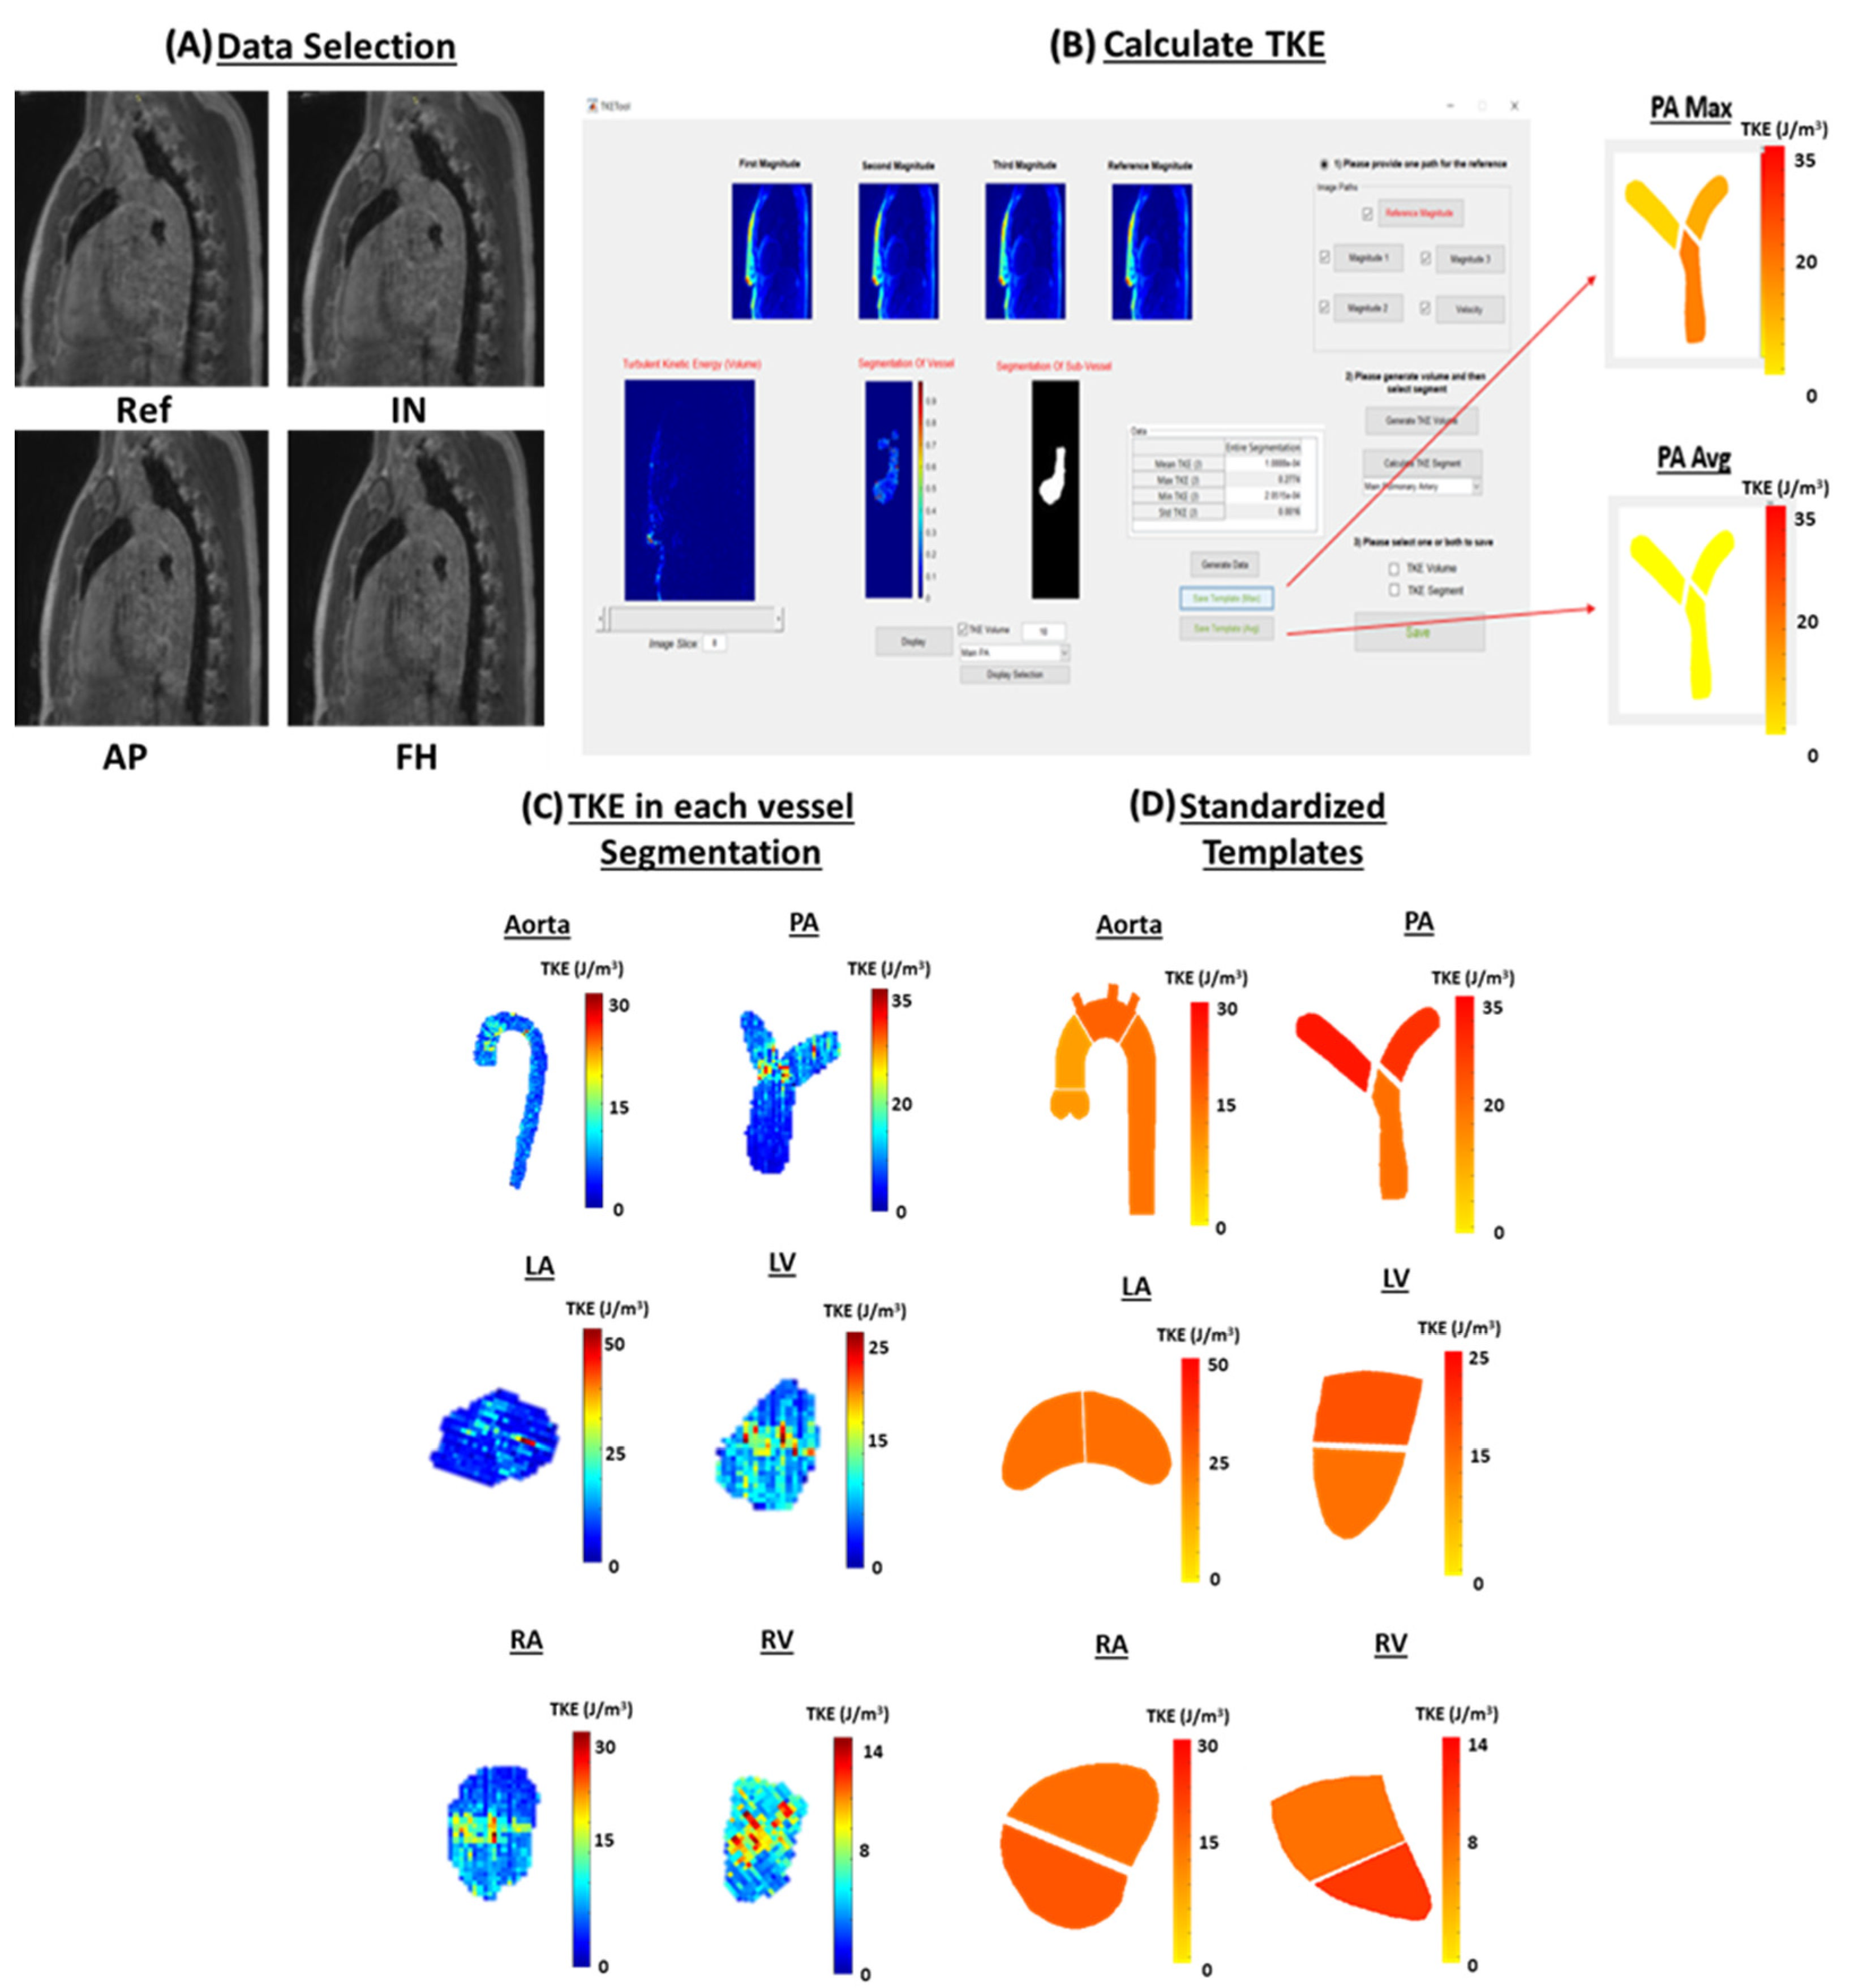
After segmentation, an in-house Matlab tool “YYC 4D Flow TKE Tool” was used to calculate TKE throughout the entire cardiac cycle for each segmentation, as demonstrated in Figure 2. The magnitude of the individual velocity-encoding directions was reconstructed to compute TKE. TKE is defined as , where is the fluid density, and is the fluctuation intensity in the three orthogonal directions [21]. TKE has been validated in vitro and in vivo by several groups [21,27,28,29,30]. Our implementation is based on the original code from Dyverfeldt et al. [21]. Our TKE tool facilitates the integration of individual segmentations and TKE calculation to generate standardized analysis reports using regions of interest and templates.
TKE is calculated using the magnitude information from the 4D-flow dataset and taking the intervoxel velocity standard deviation in all 3 spatial directions throughout the cardiac cycle [27]. A variety of hemodynamic parameters were computed for the entire segmentation along with each volumetric segment for each vessel, including maximum TKE (TKEmax), minimum TKE (TKEmin), mean TKE (TKEmean), and standard deviation TKE (TKEstdv). TKEmax was defined as the maximum TKE in any voxel in each region. Similarly, TKEmin was defined as the minimum TKE in any voxel in each region. While TKEmean was defined as the mean TKE in each region. Lastly, TKEstdv was defined as the standard deviation in each region. In addition, simplified standardized templates were created to compare TKE between the two cohorts.
2.5. Statistical Analysis
Statistical analyses were performed using SPSS 25 (SPSS, Chicago, IL, USA). Normality was assessed using the Shapiro–Wilk test and the Kolmogorov–Smirnov test. Due to the data not following a normal distribution, a Mann–Whitney-U test was performed for both study demographics along with the TKE comparison between the two groups. Results are provided as the group mean ± standard deviation and a p-value < 0.05 was used to consider the statistical significance. Furthermore, Pearson’s correlation was used to analyze the relationship between TKE and the left ventricular ejection fraction (LVEF), right ventricular ejection fraction (RVEF), indexed left ventricular end-diastolic volume (LVEDVi), indexed left ventricular systolic volume (LVESVi), indexed right ventricular end-diastolic volume (RVEDVi), and indexed right ventricular end-systolic volume (RVESVi). The body surface area was used for indexation. A p-value < 0.01 was considered statistically significant.
3. Results
Patient Characteristics
Table 1 demonstrates the clinical parameters along with the demographic data acquired for the 17 controls and 18 patients that were enrolled in the study. The age at scan was higher in the controls compared with patients (26 ± 13 years vs. 29 ± 9 years, p = 0.05). As seen in Table 1, LVEF (58 ± 9% vs. 64 ± 7%, p = 0.04), LVEDV (138 ± 32 mL vs. 168 ± 38 mL, p = 0.02), LVEDVi (76 ± 12 mL/m2 vs. 88 ± 16 mL/m2, p = 0.02), RVESV (117 ± 56 mL vs. 78 ± 27 mL, p = 0.04), RVEF (48 ± 8 % vs. 56 ± 6 %, p = 0.01), RVESVi (65 ± 30 mL/m2 vs. 40 ± 12 mL/m2, p = 0.01), and RVEDVi (121 ± 39 mL/m2 vs. 91 ± 19 mL/m2, p = 0.02) were statistically different between patients and controls.
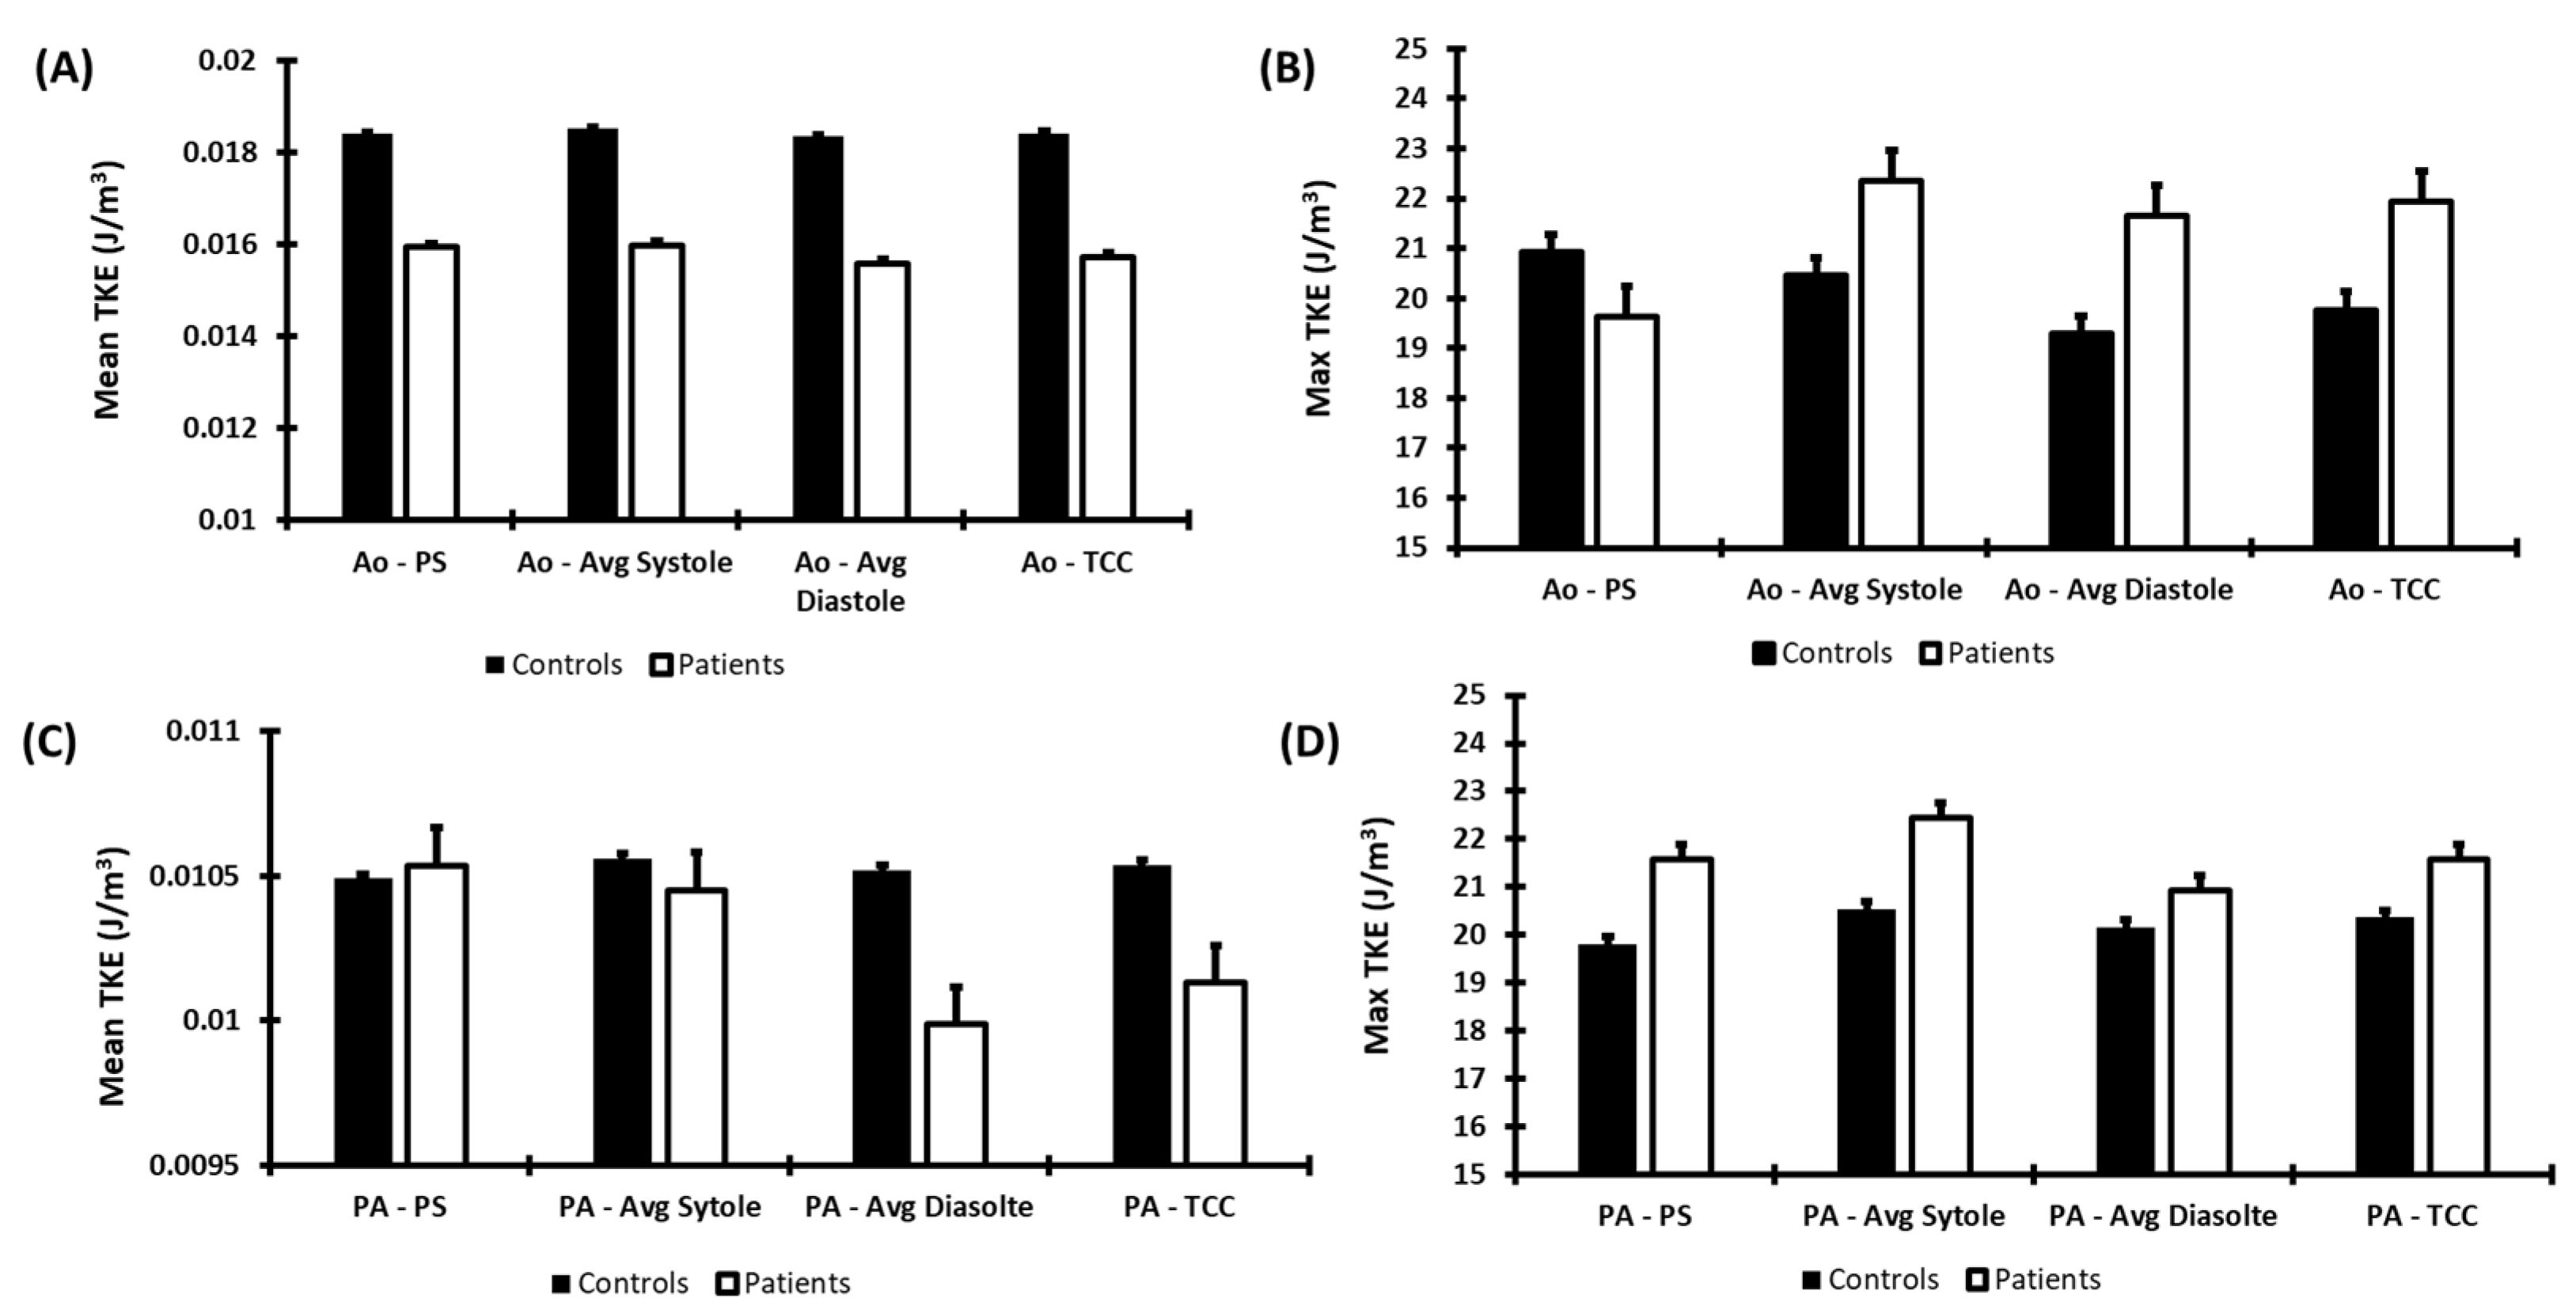
Hemodynamic parameters of the aorta and PA for both cohorts are seen in Figure 3. Controls demonstrated a higher TKEmean in the aorta than patients during all phases of the cardiac cycle, including peak systole (PS), average systole (avg systole), average diastole (avg diastole), and total cardiac cycle (TCC). However, patients demonstrated a higher TKEmax in the aorta than controls at avg systole, avg diastole, and TCC. In addition, patients demonstrated a higher TKEmax in PA compared to the controls throughout the entire cardiac cycle. TKEmean in the PA was only higher in patients compared to controls at PS. Yet, no statistical significance was observed between the two cohorts for both TKEmean and TKEmax in the aorta and PA.
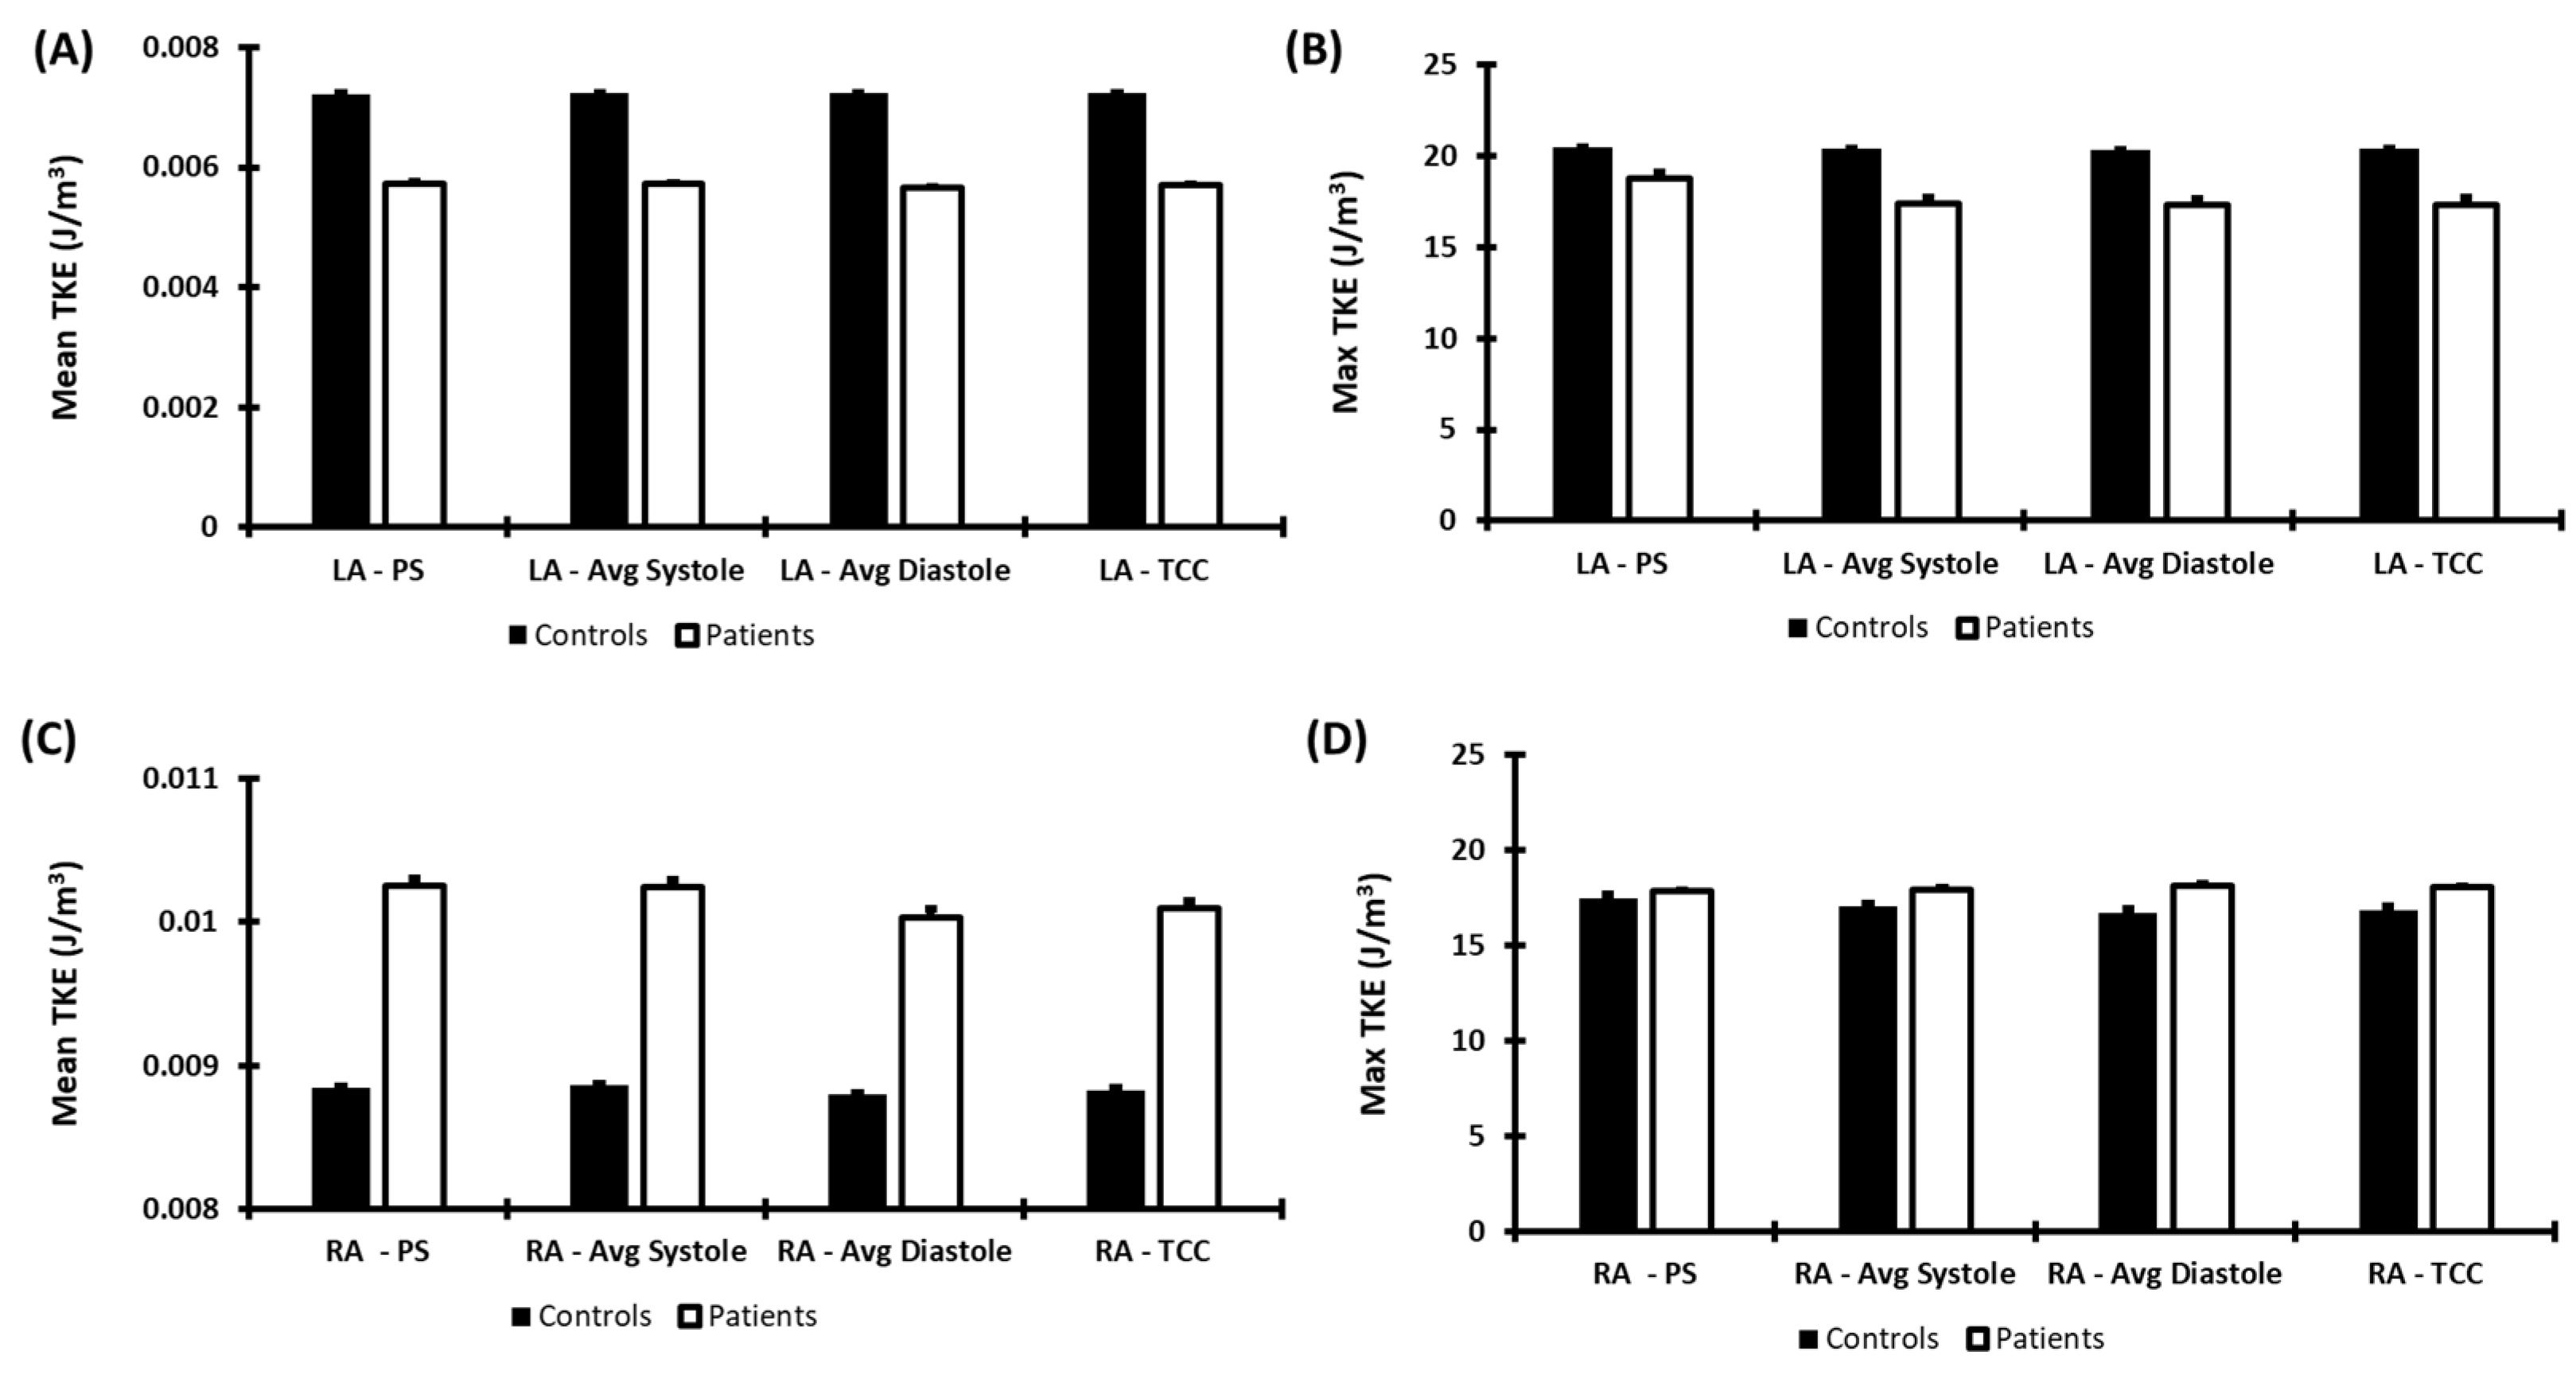
Furthermore, Figure 4 demonstrates the hemodynamic parameters observed in the LA and RA for both cohorts. TKEmean was observed to be higher in controls compared to patients throughout the cardiac cycle in the LA. Similarly, TKEmax was also observed to be higher in controls compared to patients throughout the cardiac cycle in the LA. Although, TKEmean was observed to be higher in patients compared to controls in the RA throughout the cardiac cycle. Similarly, patients also demonstrated a higher TKEmax compared to controls throughout the cardiac cycle in the RA. No statistical significance was observed between the two cohorts in either the LA or the RA.
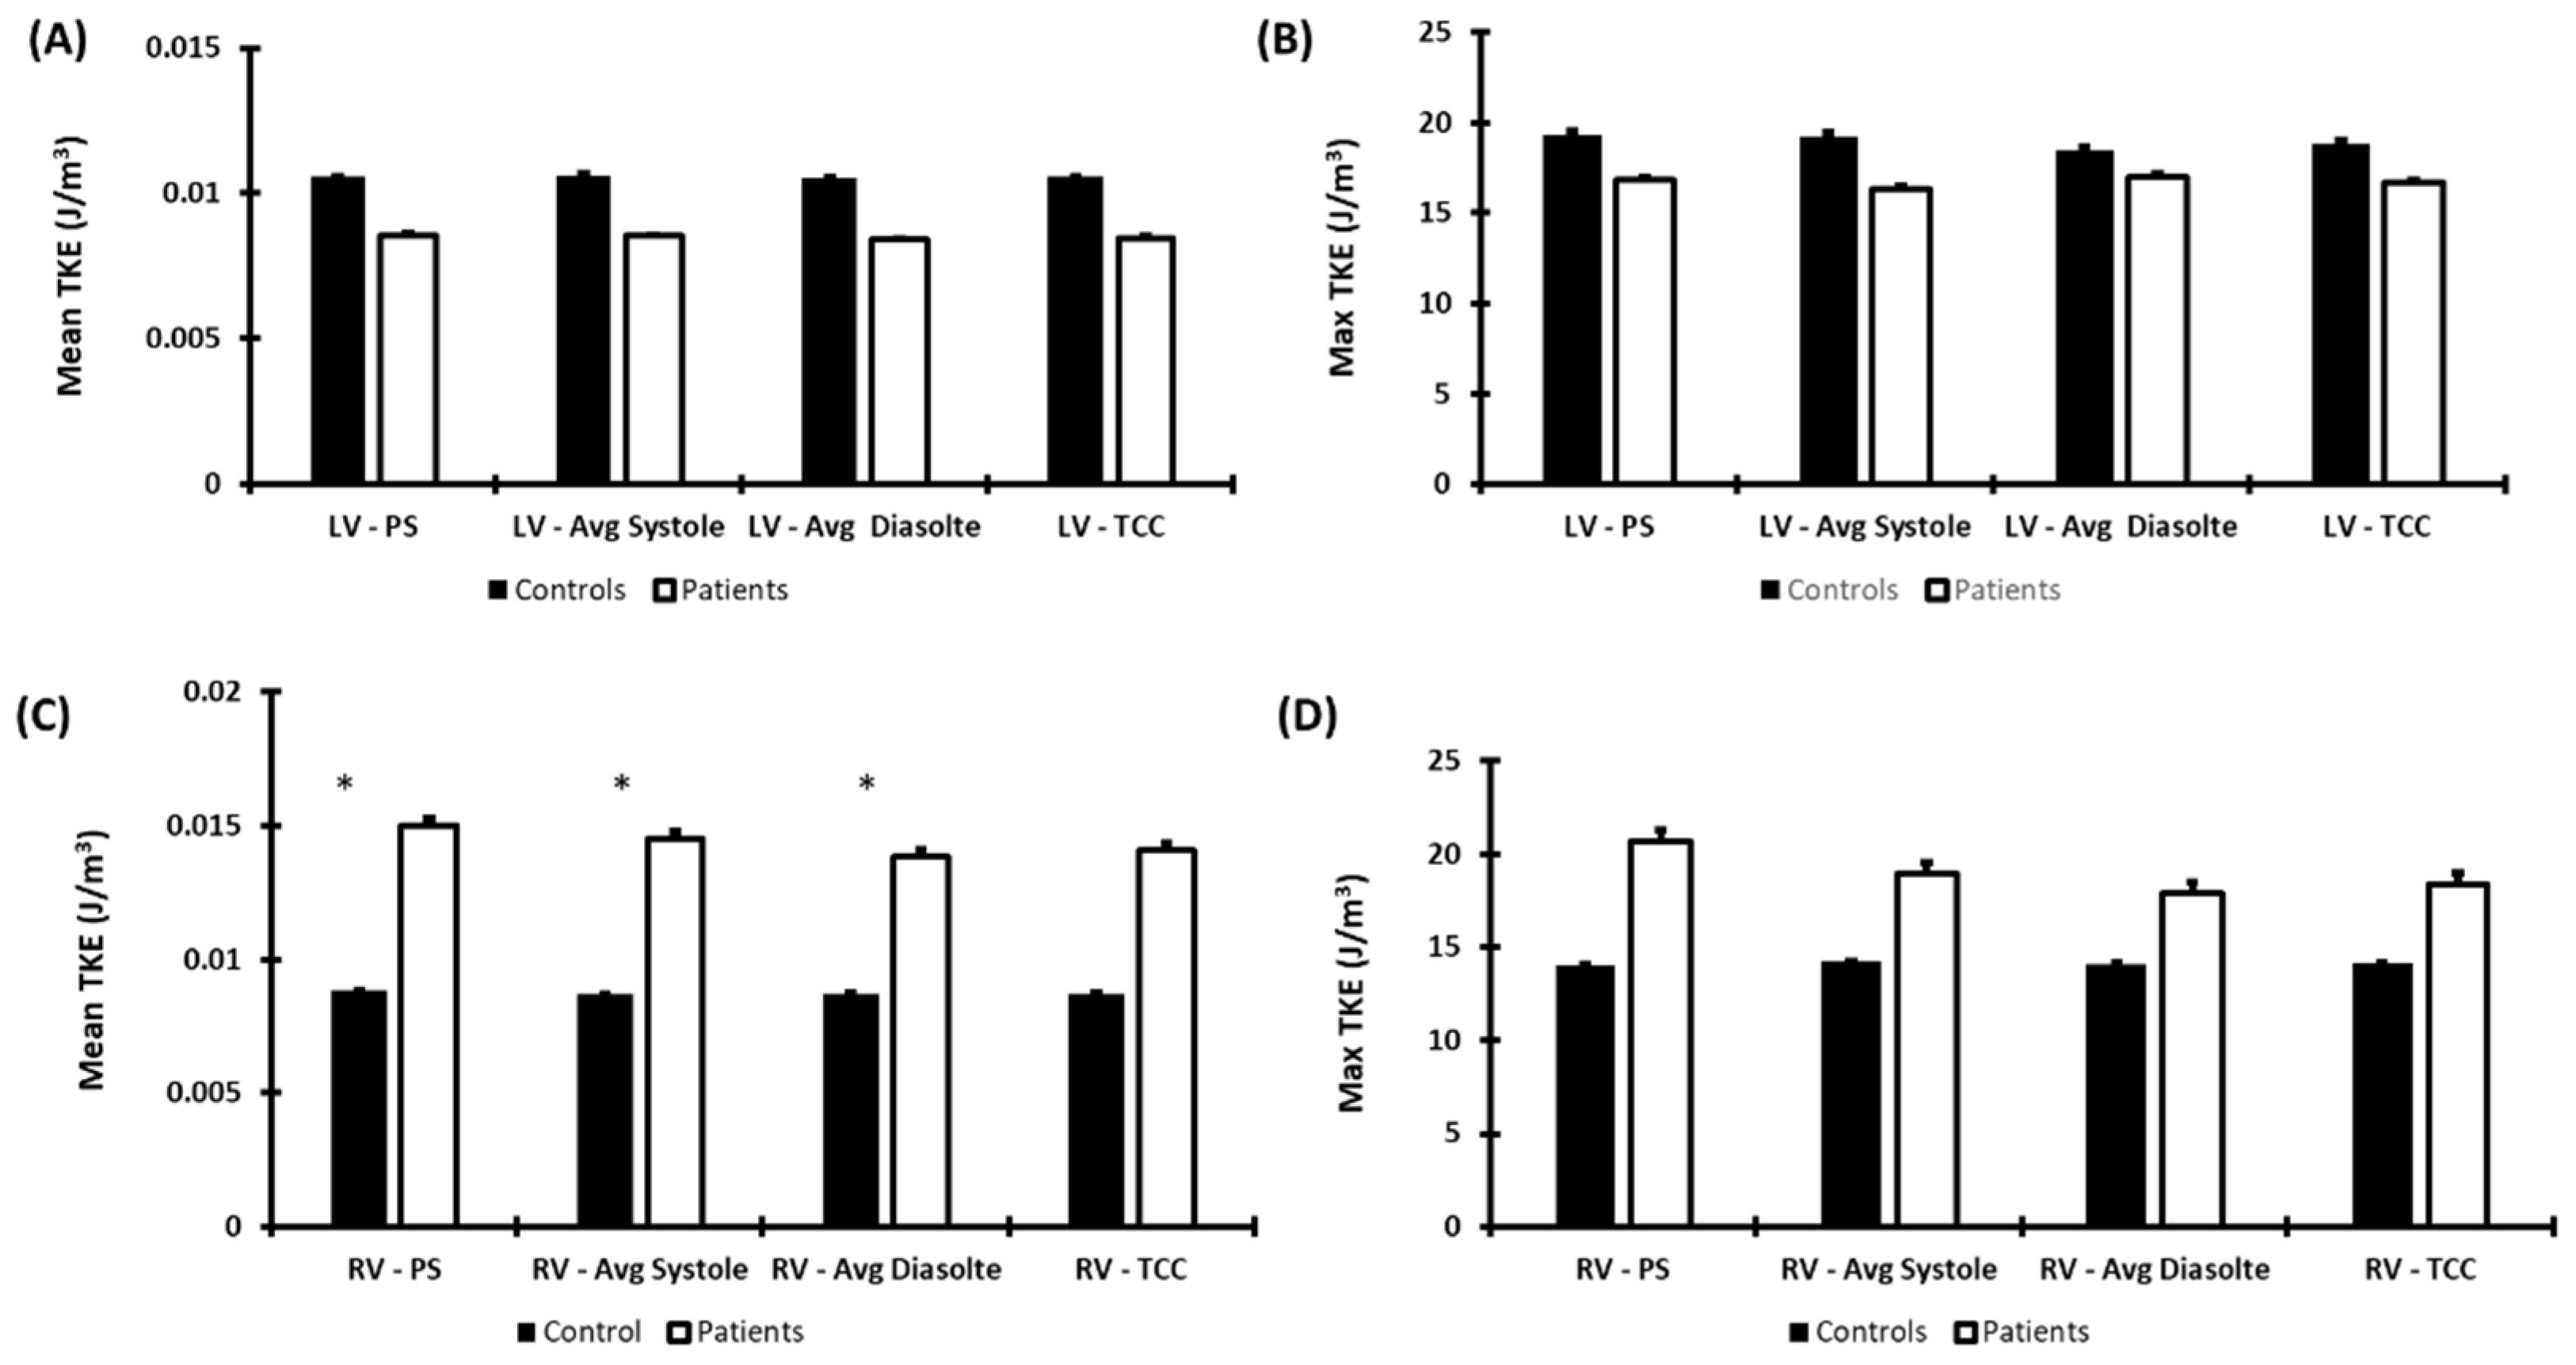
Moreover, Figure 5 demonstrates the hemodynamic parameters observed in the LV and RV for both cohorts. TKEmean was observed to be higher in controls compared to patients in the LV throughout the cardiac cycle. Controls also demonstrated higher TKEmax in the LV compared to patients throughout the cardiac cycle. However, no statistical significance was observed in the LV. Similarly, patients also demonstrated a higher TKEmax and TKEmean at the RV throughout the cardiac cycle. Statistical significance between the two cohorts was observed for TKEmean at PS (0.015 ± 0.009 J/m3 vs. 0.009 ± 0.005 J/m3, p < 0.05), avg systole (0.015 ± 0.007 J/m3 vs. 0.009 ± 0.005 J/m3, p < 0.05), and avg diastole (0.014 ± 0.007 J/m3 vs. 0.009 ± 0.005 J/m3, p < 0.05). Pearson’s correlation was also computed between standard clinical measurements and TKE. However, no significant or strong correlation was found between the two.
4. Discussion
This study demonstrated that TKE may impact the entire heart throughout the cardiac cycle. Patients with rTOF showed abnormal TKE changes in all chambers, providing further insight into the hemodynamic alterations of the entire heart for this patient cohort. Our main findings showed that controls exhibit higher TKEmean and TKEmax in both the LA and LV compared to patients. This may be due to defects that are mostly observed on the right side of the heart. In addition, we may observe this difference because patients with rTOF may also exhibit slower velocities in these vessels compared to controls. Hence, this may have led to lower values of TKE, as observed in this study. Furthermore, this study did observe higher values of both TKEmean and TKEmax in the RV in patients compared to controls. These results were similar to previously reported findings in energetic changes on rTOF, as compared with controls [2]. Therefore, this may suggest that patients with rTOF may have an imbalance of velocities between left- and right-sided chambers of the heart, leading to higher velocities on the right and resulting in elevated TKE values in the RV.
In the current study, we derived TKE from a whole-heart 4D-flow MRI acquisition in adult patients. It is important to remark that this type of acquisition can also be performed in pediatric patients by adjusting the spatial resolution and velocity-encoding parameters [5]. In adults, a spatial resolution of 2.5–3.0 mm3 is recommended; in pediatric populations, 1.5 mm3 is recommended, and 0.75–1.0 mm3 is recommended in neonates. The advantages of 4D-flow MRI in neonatal and pediatric populations over standard 2D phase-contrast are well-documented [31,32]. The advances in acceleration techniques reached clinically acceptable scan times, and the possibility of free-breathing protocols and the use of feed and wrap have become more practical for diminishing emotional stress [33]. However, the use of sedation and anesthesia is still clinical routine for facilitating the exam [34,35]. In both adult and pediatric patients, motion artifacts can impact the accuracy of the 4D-flow acquisition. Respiratory motion is usually well managed by using a respiratory navigator, as we used in our study cohort. Novel free-breathing methods manage motion effects within the image acquisition framework [36,37]. However, large motion effects cannot be effectively corrected.
TKEmax was also shown to be elevated in the PA within patients compared to controls throughout the entire cardiac cycle. This may be due to the fact that PR is observed within this patient cohort [38]. This relates to how we observed elevated TKE in the RV, as previous studies demonstrated that PR significantly impacts the flow in the RV [39]. Unfortunately, not many studies evaluated TKE in patients with rTOF, but some studies demonstrated elevated KE in the RV and PA compared to controls [40]. In particular, Fredriksson et al. highlighted the potential clinical value of TKE in the development of late complications after TOF repair and the importance of follow-up [22]. TKE comes to provide additional information beyond the heart function and strain characterization that can be achieved with a standard-of-care ultrasound and MRI. It is reasonable to consider that these basic metrics can support decision making, but there could be other factors besides RV volume and deformation rate that can contribute to an adverse outcome. Flow-derived metrics, as TKE, could provide a major understanding on 3D intra-cardiac hemodynamics and local alterations within the blood flow. It is important to remark that 3D hemodynamics are not fully characterized using standard ultrasound or MRI. Furthermore, studies also demonstrated the alteration of flow patterns by overserving higher retrograde flow and pathological vortices within the right side of the heart in patients with rTOF compared to controls [41,42]. The observation of retrograde flow and vortices may explain the elevated TKE measured in the PA and RV throughout the cardiac cycle, as an expenditure of energy occurs during vortex formation and dissipation. Right-sided vortices may represent energy loss and poor efficient circulation, which can potentially be harmful for the RV in TOF with impaired contractile capacity and could indicate an early intervention. However, in the current study, the vortex formation was not evaluated or investigated in association with TKE.
Moreover, this study also evaluated the comparison between TKE with standard clinical measurements including LVEF, RVEF, LVEDVi, LVESVi, RVEDVi, and RVESVi. As no significant or strong correlation was observed between TKE and standard clinical measurements evaluated, this suggests that TKE is an independent local measurement providing further insight into the abnormal flow seen in this patient cohort. A previous study performed by Dyverfeldt et al. also demonstrated similar results. This study also found that the total TKE was not related to global flow patterns that are evaluated by magnetic-resonance-measured velocity fields [30].
As the current work was an exploratory pilot study, the recruitment of more patients and healthy controls is highly recommended in further understanding how TKE may play a role in various vessels within this patient cohort. Moreover, the evaluation of other irregular flow parameters should be conducted and correlated for each vessel for a better understanding of hemodynamic differences between patients and controls. In the current study, we developed simple reporting templates for the visual assessment of individuals and cohorts. The latter could simplify the TKE interpretation and could be used for a visual follow-up assessment. However, not all templates respected current clinical guidelines. In particular, ventricular templates could use the American Heart Association’s (AHA) standard reporting procedures when reporting to clinicians. Our simplified approach aimed to provide a quick snapshot of TKE. The latter highlights the need for well-defined reporting for TKE and 4D-flow measurements, which can be substantially complex given the large amount of data. This aspect explains why a single time point is frequently reported (e.g., peak systole) or simplified using time-average values or maximum intensity projections. Furthermore, in future, TKE measurements could be indexed to the volume of each vessel for both controls and patients, which may provide further insight into the difference observed between the right and left chambers. The association of TKE with the onset of any rTOF complications must be investigated to understand the TKE role in adverse outcomes. Lastly, intra-observer and inter-observer variabilities should be evaluated to validate this technique.
Our study only considered rTOF patients for the investigation of TKE. However, other congenital diseases could benefit from the characterization of abnormal TKE. A recent numerical study demonstrated that lower vortex formation and lower TKE can identify deteriorated intra-cardiac performance in Fontan patients, while the ejection fraction did not, whereas the latter still needs to be demonstrated in vivo [43]. The use of computational fluid dynamics (CFD) to complement and/or validate 4D-flow-derived calculations is not new. TKE, as it is calculated our study, has been validated using experimental models, and CFD reported a good agreement between MRIs, models, and simulations [44]. Some CFD studies evaluated the influence of the pulmonary artery bifurcation angle, pressure distribution, and flow patterns [45,46]. In particular, Loke et al. reported a framework for computational modeling using cardiac MRI images and 4D-flow MRI in rTOF patients and included the calculation of kinetic energy, vorticity, and TKE in rTOF [47]. However, these studies were mostly exploratory with a limited number of subjects. Furthermore, CFD has also been used to improve the calculation of wall shear stress, as 4D-flow spatial and temporal resolutions can underestimate this measurement [48,49,50]. Casas et al. used CFD to assess the impact of spatial resolutions and reported that TKE estimates were accurate and minorly impacted by resolution, while viscous energy dissipation was underestimated and showed resolution dependance [48]. However, 4D-flow in vivo acquisition mostly reflects the macro-scale of turbulence, as data are acquired with a 2–3 mm3 resolution [49]. CFD can facilitate the TKE understanding of the turbulence cascade at the Kolmogorov micro-scale, which is something that cannot be achieve in-vivo. Exploring hemodynamic data with CFD in such scales can be computationally demanding and time consuming. Some level of feasibility can be achieved using novel 3D Lattice Boltzmann methods, which have proved to be more efficient for clinical applications [50].
Some additional limitations of this study include a small sample size as not many patients and controls were enrolled in this study. The patient’s sample size also limited the ability to investigate specific complications (e.g., pulmonary regurgitation). Age and sex matching or propensity score matching could also improve that study design for TKE assessments. In the current study, controls were on average 7 years older than patients, and no personalized analysis was performed. Long acquisition (>10 min) can be an important limitation in clinical settings. In the current study, the 4D-flow acquisition in all subjects was inferior to 10 min. Acceleration techniques such as compressed sensing can reduce up to 50% of the acquisition time, but the effect on TKE accuracy is still unknown. Another limitation of this study may include variability in the segmentations, as each patient has a different characteristic and morphology of vessels. It must be remarked that segmentations were static and were not adjusted to the dynamic motion of the heart. Heart motion can be significant and affect the averaged TKE calculation in ventricles. A future alternative could be the use of automated segmentation using machine learning methods.
Similarly to flow-derived parameters, the accuracy of TKE is greatly dependent upon spatial and temporal resolution. The latter must be particularly considered when scanning children. As reported by Dillinger et al., the level of intra-voxel underestimation will depend on the turbulence level and velocity encoding strategy [51]. Single encoding gradient can vary by 20%. A Lagrangian velocity spectrum on a voxel-by-voxel basis may correct the latter. Although the approach used for this study to calculate TKE has been validated, more larger and longitudinal studies would be beneficial for understanding the observed hemodynamic fluctuations.
5. Conclusions
In conclusion, this study demonstrated that TKE can be evaluated in the whole heart of patients with rTOF. TKEs in the RV, RA, and PA were higher in rTOF patients compared to the controls. These results suggest that TKE could potentially serve as an independent biomarker for the monitoring of rTOF. Further validation and longitudinal studies may provide further insight into the hemodynamics of rTOF patients for improving patient management and clinical decision making.
Author Contributions
Conceptualization, A.H. and J.G.; methodology, J.G.; software, A.H. and J.G.; validation, A.H., J.A.W., S.C.G. and J.G.; formal analysis, A.H.; investigation, A.H., S.C.G. and J.G.; resources, S.C.G. and J.G.; data curation, A.H.; writing—original draft preparation, A.H. and J.G.; writing—review and editing, S.C.G., J.A.W. and J.G.; visualization, A.H. and J.G.; supervision, J.G.; project administration, J.G.; funding acquisition, S.C.G. and J.G. All authors have read and agreed to the published version of the manuscript.
Funding
This research was funded by The University of Calgary, URGC SEM #1054341; J.G. start-up funding. We acknowledge the support of the Natural Science and Engineering Research Council of Canada/Conseil de recherche en science naturelles et en génie du Canada, RGPIN-2020-04549, and DGECR-2020-00204.
Institutional Review Board Statement
The study was conducted according to the guidelines of the Declaration of Helsinki and approved by the Conjoint Health Research Ethics Board of University of Calgary (REB13-0902 approved on 6/18/2014 and currently active).
Informed Consent Statement
Written informed consent was obtained from all subjects involved in the study.
Data Availability Statement
The anonymized data presented in this study are available upon request from the corresponding author. The data are not publicly available due to privacy and ethical restrictions.
Conflicts of Interest
The authors declare no conflict of interest.
References
- Richter, Y.; Edelman, E.R. Cardiology Is Flow. Circulation 2006, 113, 2679–2682. [Google Scholar] [CrossRef] [PubMed] [Green Version]
- Fredriksson, A.G.; Svalbring, E.; Eriksson, J.; Dyverfeldt, P.; Alehagen, U.; Engvall, J.E.; Ebbers, T.; Carlhall, C.J. 4D flow CMR can detect subtle right ventricular dysfunction in primary left ventricular disease. J. Cardiovasc. Magn. Reson. 2015, 17 (Suppl. 1), Q4. [Google Scholar] [CrossRef] [Green Version]
- Lloyd-Jones, D.; Adams, R.J.; Brown, T.M.; Carnethon, M.; Dai, S.; De Simone, G.; Ferguson, T.B.; Ford, E.; Furie, K.; Gillespie, C.; et al. Heart Disease and Stroke Statistics—2010 Update. Circulation 2010, 121, e46–e215. [Google Scholar] [CrossRef] [PubMed] [Green Version]
- Hu, L.; Ouyang, R.; Sun, A.; Wang, Q.; Guo, C.; Peng, Y.; Qin, Y.; Zhang, Y.; Xiang, Y.; Zhong, Y. Pulmonary artery hemodynamic assessment of blood flow characteristics in repaired tetralogy of Fallot patients versus healthy child volunteers. Quant. Imaging Med. Surg. 2020, 10, 921–933. [Google Scholar] [CrossRef]
- Zhong, L.; Schrauben, E.M.; Garcia, J.; Uribe, S.; Grieve, S.M.; Elbaz, M.S.M.; Barker, A.J.; Geiger, J.; Nordmeyer, S.; Marsden, A.; et al. Intracardiac 4D Flow MRI in Congenital Heart Disease: Recommendations on Behalf of the ISMRM Flow & Motion Study Group. J. Magn. Reson. Imaging 2019, 50, 677–681. [Google Scholar] [CrossRef] [PubMed] [Green Version]
- Adamson, L.; Vohra, H.A.; Haw, M.P. Does pulmonary valve replacement post repair of tetralogy of Fallot improve right ventricular function? Interact. Cardiovasc. Thorac. Surg. 2009, 9, 520–527. [Google Scholar] [CrossRef]
- Khalaf, A.; Tani, D.; Tadros, S.; Madan, S. Right- and Left-Ventricular Strain Evaluation in Repaired Pediatric Tetralogy of Fallot Patients Using Magnetic Resonance Tagging. Pediatr. Cardiol. 2013, 34, 1206–1211. [Google Scholar] [CrossRef]
- Baumgartner, H.; Falk, V.; Bax, J.J.; De Bonis, M.; Hamm, C.; Holm, P.J.; Iung, B.; Lancellotti, P.; Lansac, E.; Rodriguez Muñoz, D.; et al. 2017 ESC/EACTS Guidelines for the management of valvular heart disease. Eur. Heart J. 2017, 38, 2739–2791. [Google Scholar] [CrossRef]
- Otto, C.M.; Nishimura, R.A.; Bonow, R.O.; Carabello, B.A.; Erwin, J.P.; Gentile, F.; Jneid, H.; Krieger, E.V.; Mack, M.; McLeod, C.; et al. 2020 ACC/AHA Guideline for the Management of Patients With Valvular Heart Disease: A Report of the American College of Cardiology/American Heart Association Joint Committee on Clinical Practice Guidelines. Circulation 2021, 143. [Google Scholar] [CrossRef]
- Myerson, S.G. CMR in Evaluating Valvular Heart Disease. JACC Cardiovasc. Imaging 2021, 14, 2020–2032. [Google Scholar] [CrossRef]
- Malik, S.B.; Chen, N.; Parker, R.A.; Hsu, J.Y. Transthoracic Echocardiography: Pitfalls and Limitations as Delineated at Cardiac CT and MR Imaging. Radio Graph. 2017, 37, 383–406. [Google Scholar] [CrossRef] [Green Version]
- Grant, M.D.; Mann, R.D.; Kristenson, S.D.; Buck, R.M.; Mendoza, J.D.; Reese, J.M.; Grant, D.W.; Roberge, E.A. Transthoracic Echocardiography: Beginner’s Guide with Emphasis on Blind Spots as Identified with CT and MRI. Radio Graph. 2021, 41, E1022–E1042. [Google Scholar] [CrossRef] [PubMed]
- Therrien, J.; Provost, Y.; Merchant, N.; Williams, W.; Colman, J.; Webb, G. Optimal timing for pulmonary valve replacement in adults after tetralogy of Fallot repair. Am. J. Cardiol. 2005, 95, 779–782. [Google Scholar] [CrossRef] [PubMed]
- Robinson, J.D.; Rose, M.J.; Joh, M.; Jarvis, K.; Schnell, S.; Barker, A.J.; Rigsby, C.K.; Markl, M. 4-D flow magnetic-resonance-imaging-derived energetic biomarkers are abnormal in children with repaired tetralogy of Fallot and associated with disease severity. Pediatr. Radiol. 2019, 49, 308–317. [Google Scholar] [CrossRef] [PubMed]
- Knauth, A.L.; Gauvreau, K.; Powell, A.J.; Landzberg, M.J.; Walsh, E.P.; Lock, J.E.; del Nido, P.J.; Geva, T. Ventricular size and function assessed by cardiac MRI predict major adverse clinical outcomes late after tetralogy of Fallot repair. Heart 2008, 94, 211–216. [Google Scholar] [CrossRef] [PubMed]
- Valente, A.M.; Gauvreau, K.; Assenza, G.E.; Babu-Narayan, S.V.; Schreier, J.; Gatzoulis, M.A.; Groenink, M.; Inuzuka, R.; Kilner, P.J.; Koyak, Z.; et al. Contemporary predictors of death and sustained ventricular tachycardia in patients with repaired tetralogy of Fallot enrolled in the INDICATOR cohort. Heart 2014, 100, 247–253. [Google Scholar] [CrossRef] [Green Version]
- Dyverfeldt, P.; Bissell, M.; Barker, A.J.; Bolger, A.F.; Carlhäll, C.-J.; Ebbers, T.; Francios, C.J.; Frydrychowicz, A.; Geiger, J.; Giese, D.; et al. 4D flow cardiovascular magnetic resonance consensus statement. J. Cardiovasc. Magn. Reson. 2015, 17, 72. [Google Scholar] [CrossRef] [Green Version]
- Grigioni, M.; Daniele, C.; D’Avenio, G.; Barbaro, V. On the monodimensional approach to the estimation of the highest Reynolds shear stress in a turbulent flow. J. Biomech. 2000, 33, 701–708. [Google Scholar] [CrossRef]
- Isaaz, K.; Bruntz, J.F.; Costa, A.D.; Winninger, D.; Cerisier, A.; de Chillou, C.; Sadoul, N.; Lamaud, M.; Ethevenot, G.; Aliot, E. Noninvasive quantitation of blood flow turbulence in patients with aortic valve disease using online digital computer analysis of Doppler velocity data. J. Am. Soc. Echocardiogr. 2003, 16, 965–974. [Google Scholar] [CrossRef]
- Garcia, J.; Barker, A.J.; Markl, M. The Role of Imaging of Flow Patterns by 4D Flow MRI in Aortic Stenosis. JACC Cardiovasc. Imaging 2019, 12, 252–266. [Google Scholar] [CrossRef]
- Dyverfeldt, P.; Kvitting, J.-P.E.; Sigfridsson, A.; Engvall, J.; Bolger, A.F.; Ebbers, T. Assessment of fluctuating velocities in disturbed cardiovascular blood flow: In vivo feasibility of generalized phase-contrast MRI. J. Magn. Reson. Imaging 2008, 28, 655–663. [Google Scholar] [CrossRef] [PubMed] [Green Version]
- Fredriksson, A.; Trzebiatowska-Krzynska, A.; Dyverfeldt, P.; Engvall, J.; Ebbers, T.; Carlhäll, C.-J. Turbulent kinetic energy in the right ventricle: Potential MR marker for risk stratification of adults with repaired Tetralogy of Fallot. J. Magn. Reson. Imaging 2018, 47, 1043–1053. [Google Scholar] [CrossRef] [PubMed] [Green Version]
- Kramer, C.M.; Barkhausen, J.; Bucciarelli-Ducci, C.; Flamm, S.D.; Kim, R.J.; Nagel, E. Standardized cardiovascular magnetic resonance imaging (CMR) protocols: 2020 update. J. Cardiovasc. Magn. Reson. 2020, 22, 17. [Google Scholar] [CrossRef] [PubMed]
- Bock, J.; Kreher, B.; Hennig, J.; Markl, M. Optimized Pre-Processing of Time-Resolved 2 D and 3 D Phase Contrast MRI Data. In Proceedings of the 15th Annual Meeting of ISMRM, Berlin, Germany, 19–25 May 2007. [Google Scholar]
- Geeraert, P.; Jamalidinan, F.; Burns, F.; Jarvis, K.; Bristow, M.S.; Lydell, C.; Hidalgo Tobon, S.S.; de Celis Alonso, B.; Fedak, P.W.M.; White, J.A.; et al. Hemodynamic Assessment in Bicuspid Aortic Valve Disease and Aortic Dilation: New Insights From Voxel-By-Voxel Analysis of Reverse Flow, Stasis, and Energetics. Front. Bioeng. Biotechnol. 2022, 9, 725113. Available online: https://www.frontiersin.org/articles/10.3389/fbioe.2021.725113 (accessed on 11 August 2022).
- Fatehi Hassanabad, A.; Burns, F.; Bristow, M.S.; Lydell, C.; Howarth, A.G.; Heydari, B.; Gao, X.; Fedak, P.W.M.; White, J.A.; Garcia, J. Pressure drop mapping using 4D flow MRI in patients with bicuspid aortic valve disease: A novel marker of valvular obstruction. Magn. Reson. Imaging 2020, 65, 175–182. [Google Scholar] [CrossRef]
- Sundin, J.; Bustamante, M.; Ebbers, T.; Dyverfeldt, P.; Carlhäll, C.-J. Turbulent Intensity of Blood Flow in the Healthy Aorta Increases with Dobutamine Stress and is Related to Cardiac Output. Front. Physiol. 2022, 13, 869701. [Google Scholar] [CrossRef]
- Ha, H.; Ziegler, M.; Welander, M.; Bjarnegård, N.; Carlhäll, C.-J.; Lindenberger, M.; Länne, T.; Ebbers, T.; Dyverfeldt, P. Age-Related Vascular Changes Affect Turbulence in Aortic Blood Flow. Front. Physiol. 2018, 9, 36. [Google Scholar] [CrossRef] [Green Version]
- Binter, C.; Gotschy, A.; Sündermann, S.H.; Frank, M.; Tanner, F.C.; Lüscher, T.F.; Manka, R.; Kozerke, S. Turbulent Kinetic Energy Assessed by Multipoint 4-Dimensional Flow Magnetic Resonance Imaging Provides Additional Information Relative to Echocardiography for the Determination of Aortic Stenosis Severity. Circ. Cardiovasc. Imaging 2017, 10, e005486. [Google Scholar] [CrossRef] [Green Version]
- Ha, H.; Lantz, J.; Ziegler, M.; Casas, B.; Karlsson, M.; Dyverfeldt, P.; Ebbers, T. Estimating the irreversible pressure drop across a stenosis by quantifying turbulence production using 4D Flow MRI. Sci. Rep. 2017, 7, 46618. [Google Scholar] [CrossRef] [Green Version]
- Geiger, J.; Callaghan, F.M.; Burkhardt, B.E.U.; Valsangiacomo Buechel, E.R.; Kellenberger, C.J. Additional value and new insights by four-dimensional flow magnetic resonance imaging in congenital heart disease: Application in neonates and young children. Pediatr. Radiol. 2021, 51, 1503–1517. [Google Scholar] [CrossRef]
- Panayiotou, H.R.; Mills, L.K.; Broadbent, D.A.; Shelley, D.; Scheffczik, J.; Olaru, A.M.; Jin, N.; Greenwood, J.P.; Michael, H.; Plein, S.; et al. Comprehensive Neonatal Cardiac, Feed and Wrap, Non-contrast, Non-sedated, Free-breathing Compressed Sensing 4D Flow MRI Assessment. J. Magn. Reson. Imaging 2022. [Google Scholar] [CrossRef]
- Cheng, J.Y.; Hanneman, K.; Zhang, T.; Alley, M.T.; Lai, P.; Tamir, J.I.; Uecker, M.; Pauly, J.M.; Lustig, M.; Vasanawala, S.S. Comprehensive motion-compensated highly accelerated 4D flow MRI with ferumoxytol enhancement for pediatric congenital heart disease: Motion-Compensated Accelerated 4D Flow. J. Magn. Reson. Imaging 2016, 43, 1355–1368. [Google Scholar] [CrossRef] [PubMed] [Green Version]
- Hanneman, K.; Kino, A.; Cheng, J.Y.; Alley, M.T.; Vasanawala, S.S. Assessment of the precision and reproducibility of ventricular volume, function, and mass measurements with ferumoxytol-enhanced 4D flow MRI: 4D Flow MRI Assessment of Ventricular Mass. J. Magn. Reson. Imaging 2016, 44, 383–392. [Google Scholar] [CrossRef] [PubMed]
- Moghari, M.H.; van der Geest, R.J.; Brighenti, M.; Powell, A.J. Cardiac magnetic resonance using fused 3D cine and 4D flow sequences:Validation of ventricular and blood flow measurements. Magn. Reson. Imaging 2020, 74, 203–212. [Google Scholar] [CrossRef]
- Ma, L.E.; Yerly, J.; Piccini, D.; Di Sopra, L.; Roy, C.W.; Carr, J.C.; Rigsby, C.K.; Kim, D.; Stuber, M.; Markl, M. 5D Flow MRI: A Fully Self-gated, Free-running Framework for Cardiac and Respiratory Motion–resolved 3D Hemodynamics. Radiol. Cardiothorac. Imaging 2020, 2, e200219. [Google Scholar] [CrossRef] [PubMed]
- Dimov, I.P.; Tous, C.; Li, N.; Barat, M.; Bomberna, T.; Debbaut, C.; Jin, N.; Moran, G.; Tang, A.; Soulez, G. Assessment of hepatic arterial hemodynamics with 4D flow MRI: In vitro analysis of motion and spatial resolution related error and in vivo feasibility study in 20 volunteers. Eur. Radiol. 2022. [Google Scholar] [CrossRef] [PubMed]
- Valente, A.M.; Cook, S.; Festa, P.; Ko, H.H.; Krishnamurthy, R.; Taylor, A.M.; Warnes, C.A.; Kreutzer, J.; Geva, T. Multimodality Imaging Guidelines for Patients with Repaired Tetralogy of Fallot: A Report from the American Society of Echocardiography: Developed in Collaboration with the Society for Cardiovascular Magnetic Resonance and the Society for Pediatric Radiology. J. Am. Soc. Echocardiogr. 2014, 27, 111–141. [Google Scholar] [CrossRef]
- Mikhail, A.; Labbio, G.D.; Darwish, A.; Kadem, L. How pulmonary valve regurgitation after tetralogy of fallot repair changes the flow dynamics in the right ventricle: An in vitro study. Med. Eng. Phys. 2020, 83, 48–55. [Google Scholar] [CrossRef]
- Tsuchiya, N.; Nagao, M.; Shiina, Y.; Miyazaki, S.; Inai, K.; Murayama, S.; Sakai, S. Circulation derived from 4D flow MRI correlates with right ventricular dysfunction in patients with tetralogy of Fallot. Sci. Rep. 2021, 11, 11623. [Google Scholar] [CrossRef]
- Geiger, J.; Markl, M.; Jung, B.; Grohmann, J.; Stiller, B.; Langer, M.; Arnold, R. 4D-MR flow analysis in patients after repair for tetralogy of Fallot. Eur. Radiol. 2011, 21, 1651–1657. [Google Scholar] [CrossRef]
- Hirtler, D.; Garcia, J.; Barker, A.J.; Geiger, J. Assessment of intracardiac flow and vorticity in the right heart of patients after repair of tetralogy of Fallot by flow-sensitive 4D-MRI. Eur. Radiol. 2016, 26, 3598–3607. [Google Scholar] [CrossRef]
- Grünwald, A.; Korte, J.; Wilmanns, N.; Winkler, C.; Linden, K.; Herberg, U.; Groß-Hardt, S.; Steinseifer, U.; Neidlin, M. Intraventricular Flow Simulations in Singular Right Ventricles Reveal Deteriorated Washout and Low Vortex Formation. Cardiovasc. Eng. Technol. 2022, 13, 495–503. [Google Scholar] [CrossRef] [PubMed]
- Petersson, S.; Dyverfeldt, P.; Sigfridsson, A.; Lantz, J.; Carlhäll, C.; Ebbers, T. Quantification of turbulence and velocity in stenotic flow using spiral three-dimensional phase-contrast MRI. Magn. Reson. Med. 2016, 75, 1249–1255. [Google Scholar] [CrossRef] [PubMed]
- Chern, M.-J.; Wu, M.-T.; Her, S.-W. Numerical Study for Blood Flow in Pulmonary Arteries after Repair of Tetralogy of Fallot. Comput. Math. Methods Med. 2012, 2012, 1–18. [Google Scholar] [CrossRef] [PubMed] [Green Version]
- Boumpouli, M.; Danton, M.H.D.; Gourlay, T.; Kazakidi, A. Blood flow simulations in the pulmonary bifurcation in relation to adult patients with repaired tetralogy of Fallot. Med. Eng. Phys. 2020, 85, 123–138. [Google Scholar] [CrossRef] [PubMed]
- Loke, Y.-H.; Capuano, F.; Balaras, E.; Olivieri, L.J. Computational Modeling of Right Ventricular Motion and Intracardiac Flow in Repaired Tetralogy of Fallot. Cardiovasc. Eng. Technol. 2022, 13, 41–54. [Google Scholar] [CrossRef] [PubMed]
- Manchester, E.L.; Pirola, S.; Salmasi, M.Y.; O’Regan, D.P.; Athanasiou, T.; Xu, X.Y. Evaluation of Computational Methodologies for Accurate Prediction of Wall Shear Stress and Turbulence Parameters in a Patient-Specific Aorta. Front. Bioeng. Biotechnol. 2022, 10, 836611. [Google Scholar] [CrossRef]
- Garcia, J.; Sheitt, H.; Bristow, M.S.; Lydell, C.; Howarth, A.G.; Heydari, B.; Prato, F.S.; Drangova, M.; Thornhill, R.E.; Nery, P.; et al. Left atrial vortex size and velocity distributions by 4D flow MRI in patients with paroxysmal atrial fibrillation: Associations with age and CHA 2 DS 2 -VASc risk score. J. Magn. Reson. Imaging 2020, 51, 871–884. [Google Scholar] [CrossRef]
- Sadeghi, R.; Gasner, N.; Khodaei, S.; Garcia, J.; Keshavarz-Motamed, Z. Impact of mixed valvular disease on coarctation hemodynamics using patient-specific lumped parameter and Lattice Boltzmann modeling. Int. J. Mech. Sci. 2022, 217, 107038. [Google Scholar] [CrossRef]
- Dillinger, H.; McGrath, C.; Guenthner, C.; Kozerke, S. Fundamentals of turbulent flow spectrum imaging. Magn. Reson. Med. 2022, 87, 1231–1249. [Google Scholar] [CrossRef]
Figure 1.
Postprocessing of 4D-flow data. First, 4D-flow velocity data in each direction (Vi, Vj, and Vk) were corrected for eddy currents, noise, and aliasing (Panel (A)). Followed by correcting the data, a phase contrast-magnetic resonance angiogram (PC-MRA) was created (Panel (B)) and was used to isolate the following vessels (Panel (C)): Aorta, Pulmonary Artery (PA), Left Atria (LA), Left Ventricle (LV), Right Atria (RA), and Right Ventricle (RV). After segmentation, each vessel was subdivided into various sections. The Aorta is subdivided into the root, ascending, arch, and descending. The PA is divided into the left pulmonary artery, right pulmonary artery, and main pulmonary artery (MPA). The LA, LV, RA, and RV are all divided in the same way, splitting it into its superior and inferior components.

Figure 2.
Calculation and analysis of turbulent kinetic energy (TKE). Panel (A) shows samples of the magnitude in each direction, including the reference velocity magnitude, in-plane velocity magnitude (IN), anterior–posterior velocity magnitude (AP), and foot head velocity magnitude (FH). This is followed by the calculation of TKE using the YYC 4D Flow TKE Tool that was built in-house (ρ is the fluid density, and indicates the standard deviation of the component of velocity vector at the i-direction, Panel (B)). In Panel (C), TKE is shown for a healthy control at phase 5 in the Aorta, Pulmonary Artery (PA), Left Atria (LA), Left Ventricle (LV), Right Atria (RA), and Right Ventricle (RV). Similarly, standardized templates were also computed for each vessel (Panel (D)).

Figure 3.
Turbulent kinetic energy in the aorta and pulmonary artery. Mean turbulent kinetic energy (TKE) and max TKE were calculated throughout the entire cardiac cycle, including peak systole (PS), average systole (avg systole), average diastole (avg diastole), and total cardiac cycle (TCC) in the Aorta (Ao) and Pulmonary Artery (PA) for both patients and controls. Panel (A) shows mean TKE in the Ao. Panel (B) shows max TKE in the Ao. Panel (C) shows mean TKE in the PA, and Panel (D) shows max TKE in the PA. No statistical significance was observed between the two cohorts in either the Ao or the PA.

Figure 4.
Turbulent kinetic energy in the left atria and right atria. Mean turbulent kinetic energy (TKE) and max TKE were calculated throughout the entire cardiac cycle, including peak systole (PS), average systole (avg systole), average diastole (avg diastole), and total cardiac cycle (TCC) in the Left Atria (LA) and Right Atria (RA) for both patients and controls. Panels (A,B) show the mean TKE and the max TKE in the LA for both controls and patients. Panels (C,D) show the mean TKE and max TKE in the RA. No statistical significance was observed between the two cohorts in the LA and RA.

Figure 5.
Turbulent kinetic energy in the left ventricle and right ventricle. Mean turbulent kinetic energy (TKE) and max TKE were calculated throughout the entire cardiac cycle, including peak systole (PS), average systole (avg systole), average diastole (avg diastole), and total cardiac cycle (TCC) in the Left Ventricle (LV) and Right Ventricle (RV) for both patients and controls. Panels (A,B) show the mean TKE and the max TKE in the LV throughout the entire cardiac cycle for controls and patients. Panels (C,D) show the mean TKE and the max TKE in the RA throughout the entire cardiac cycle for controls and patients. Statistical significance between the two cohorts was only observed in the RV at PS, avg systole, and avg diastole (*: p < 0.05).


Table 1.
Subject baseline characteristics.
| Characteristic | Patients (n = 17) | Controls (n = 18) | p-Value |
|---|---|---|---|
| Age at scan (year) | 29 ± 9 | 36 ± 13 | 0.05 |
| Sex (f/m) | 5/12 | 7/11 | 0.56 |
| BSA (m2) | 1.80 ± 0.21 | 1.91 ± 0.29 | 0.18 |
| HR (bpm) | 73 ± 13 | 65 ± 12 | 0.08 |
| BP systolic (mmHg) | 107 ± 8 | 113 ± 17 | 0.15 |
| BP diastolic (mmHg) | 60 ± 10 | 66 ± 16 | 0.20 |
| LVEF (%) | 58 ± 9 | 64 ± 7 | 0.04 |
| LVEDV (mL) | 138 ± 32 | 168 ± 38 | 0.02 |
| LVEDVi (mL/m2) | 76 ± 12 | 88 ± 16 | 0.02 |
| LVESV (mL) | 59 ± 22 | 62 ± 19 | 0.60 |
| LVESVi (mL/m2) | 32 ± 11 | 33 ± 9 | 0.90 |
| LVMASS (g) | 93 ± 24 | 104 ± 31 | 0.23 |
| LVMASSi (g/m2) | 51 ± 11 | 53 ± 10 | 0.52 |
| RVEF (%) | 48 ± 8 | 56 ± 6 | 0.01 |
| RVEDV (mL) | 220 ± 80 | 177 ± 46 | 0.11 |
| RVEDVi (mL/m2) | 121 ± 39 | 91 ± 19 | 0.02 |
| RVESV (mL) | 117 ± 56 | 78 ± 27 | 0.04 |
| RVESVi (mL/m2) | 65 ± 30 | 40 ± 12 | 0.01 |
BSA: Body surface area; HR: heart rate; BP: blood pressure; LVEDVi: Indexed Left Ventricular End Diastolic Volume; LVESVi: Indexed Left Ventricular End Systolic Volume; LVEF: Left Ventricular Ejection Fraction; LVMASSi: Indexed Left Ventricular Mass (LVEF); LVEDV: Left Ventricular End Diastolic Volume; LVESV: Left Ventricular End Diastolic Volume; LVMASS: Left Ventricular Mass (LVEF); RVEDVi: Indexed Right Ventricular End Diastolic Volume; RVESVi: Indexed Right Ventricular End Systolic Volume; RVEF: Right Ventricular Ejection Fraction; RVEDV: Right Ventricular End Diastolic Volume; RVESV: Right Ventricular End Systolic Volume.
Publisher’s Note: MDPI stays neutral with regard to jurisdictional claims in published maps and institutional affiliations. |
© 2022 by the authors. Licensee MDPI, Basel, Switzerland. This article is an open access article distributed under the terms and conditions of the Creative Commons Attribution (CC BY) license (https://creativecommons.org/licenses/by/4.0/).
Share and Cite
MDPI and ACS Style
Hudani, A.; White, J.A.; Greenway, S.C.; Garcia, J. Whole-Heart Assessment of Turbulent Kinetic Energy in the Repaired Tetralogy of Fallot. Appl. Sci. 2022, 12, 10946. https://0-doi-org.brum.beds.ac.uk/10.3390/app122110946
AMA Style
Hudani A, White JA, Greenway SC, Garcia J. Whole-Heart Assessment of Turbulent Kinetic Energy in the Repaired Tetralogy of Fallot. Applied Sciences. 2022; 12(21):10946. https://0-doi-org.brum.beds.ac.uk/10.3390/app122110946
Chicago/Turabian StyleHudani, Ashifa, James A. White, Steven C. Greenway, and Julio Garcia. 2022. "Whole-Heart Assessment of Turbulent Kinetic Energy in the Repaired Tetralogy of Fallot" Applied Sciences 12, no. 21: 10946. https://0-doi-org.brum.beds.ac.uk/10.3390/app122110946
Note that from the first issue of 2016, this journal uses article numbers instead of page numbers. See further details here.