Article

Clear Declining Behaviors and Causes in Atmospheric Polycyclic Aromatic Hydrocarbon Concentrations at the West End of Japan from 2017 to 2021

1
Faculty of Environmental Science, Nagasaki University, Nagasaki 852-8521, Japan
2
Graduate School of Fisheries and Environmental Sciences, Nagasaki University, Nagasaki 852-8521, Japan
*
Author to whom correspondence should be addressed.
Submission received: 31 August 2022 / Revised: 16 October 2022 / Accepted: 25 October 2022 / Published: 29 October 2022

Abstract

:
In order to determine recent behaviors in atmospheric polycyclic aromatic hydrocarbon (PAH) concentrations at the west end of Japan and to reveal the causes of these behaviors, atmospheric PAH concentrations were measured in suburban and forest sites of Nagasaki, Japan from 2017 to 2021. The results showed that the total concentration of PAHs decreased considerably by 60% and 57% in suburban and forest sites, respectively, over this period. When analyzed by season, the rate of decrease in winter was markedly high. Therefore, the decreasing behavior in PAH concentrations in Nagasaki in recent years was considered to be mainly due to less PAHs originating from cold continental regions such as northern China. In particular, the reduction in coal and biomass combustion for winter heating in households, the efforts to improve air quality, and the limitation of economic activities in response to COVID-19 were likely responsible for the decrease in atmospheric PAH concentrations. In addition, although the PAH concentrations decreased, there was no significant change in the breakdown of the number of benzene rings in the PAH or in the attributes of their sources.

1. Introduction

Polycyclic aromatic hydrocarbons (PAHs) are air pollutants, many of which are suspected carcinogens [1]. They are widely present in air [2,3,4], water [5,6,7], and soil [8,9,10]. In particular, atmospheric PAHs are fast-moving and can travel relatively freely, causing wide-area and transboundary pollution [11,12,13], which can cause exposure to people who are far from the source. China is representative of a country that has achieved considerable economic development in recent years. For example, China’s GDP has continued to rise [14], and its consumption of fossil fuels and vehicle fleets have continued to increase in recent years [15]; however, similar to many countries, environmental pollution, including air pollution by PAHs in relation to economic development, has become a serious challenge. As Japan is located close to China, people living in Japan are concerned not only about pollution of domestic origin but also about the health effects of cross-border pollution from China and other neighboring countries.
The standard of living in China has been improving along with economic development in such areas as the shift from coal to natural gas use in households. In addition, various environmental measures have been implemented, including the promotion of renewable energy [15] and regulation of automobile use. Furthermore, Japan has been cooperating to improve environmental pollution in China. For example, Japan’s Ministry of the Environment implemented a project over 5 years (2014–2018) to utilize Japanese knowledge and expertise in the field of air pollution for capacity building and human resource development in major Chinese cities [16]. In addition, as a novel coronavirus spread in China around January 2020, temporary lockdowns were implemented in some cities for approximately 2 months [17,18]. Subsequently, when new cases of infection were confirmed in a Chinese city, measures such as the temporary suspension of factory operations, blockade of the area in question, and restriction of activities were implemented.
As previously mentioned, air pollution by PAHs is a health concern; therefore, it is important to investigate and analyze the atmospheric behavior of these substances. In addition, understanding the impact of environmental changes in a country on neighboring regions is essential for developing countermeasures. If PAH concentrations in the atmosphere are measured over long duration at Japanese sites that are directly exposed to transboundary pollution from China, the causal relationship between economic activities in China and PAH concentrations in Japan could be determined by tracing behaviors in the measured values. Our previous research showed no notable trends in PAH concentrations in Nagasaki, located at the west end of Japan, from 2012 to 2018 [19]. The purpose of this study was to identify recent behaviors in PAH concentrations in Nagasaki following the previous study and to speculate on the causes of these behaviors.

2. Materials and Methods

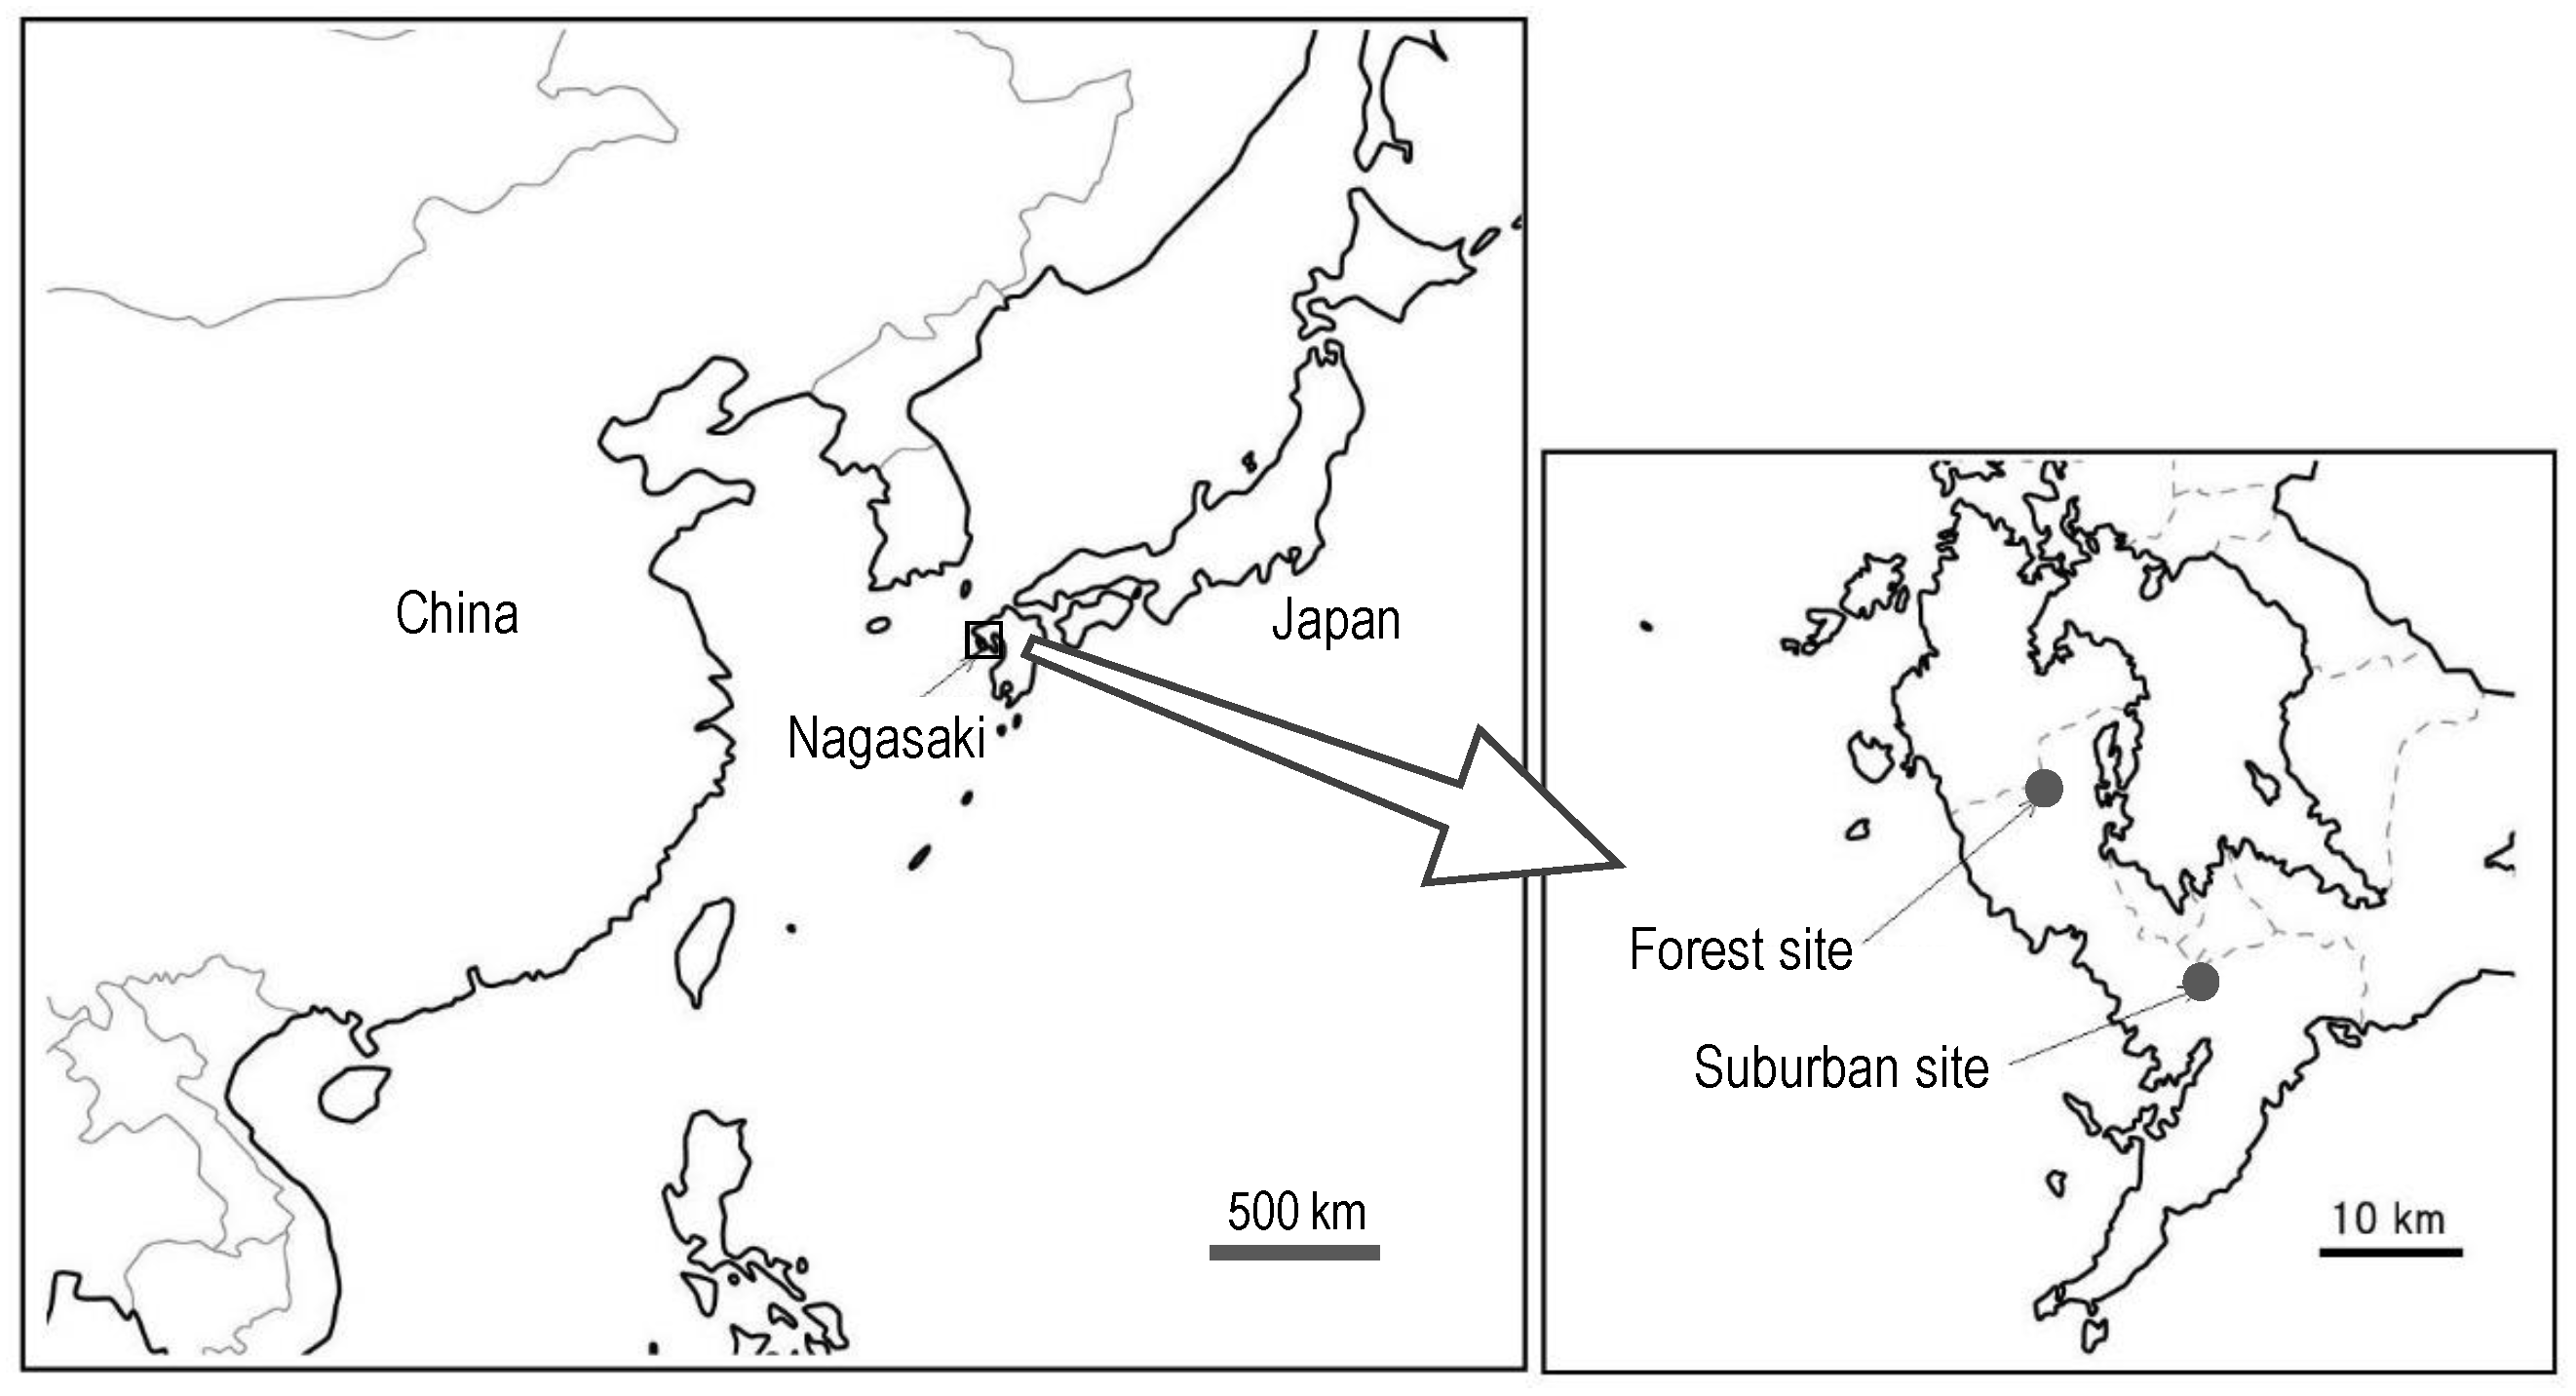
2.1. Sample Collection

Methods of sample collection in this study were the same as in our previous study. Atmospheric particles were collected at suburban and forest sites in Nagasaki, at the west end of Japan, as shown in Figure 1. The forest site was situated in a park near the top of a mountain in the Nishisonogi Peninsula that was covered by trees. There are few anthropogenic sources of pollution around the site. The suburban site was located at Bunkyo Campus, Nagasaki University. Sampling was performed on the roof of a four-story building. The campus is surrounded by the residential and business districts of Nagasaki City.
Quartz fiber filters (QR-100, Advantec, Tokyo, Japan) were preheated at 800 °C for 8 h. The total suspended particles were retrieved using a high-volume sampler (HV-7000F, Sibata Scientific Technology Ltd., Saitama, Japan) at a flow rate of 700 L/min. Aerosol particle collection occurred three or four times in each season (winter, December–February; spring, March–May; summer, June–August; and autumn, September–November) from 2017 to 2021. The sampling period was 1 week.

2.2. PAH Analysis

Methods of PAH analysis in this study were almost the same as in the previous study, although the analytes were somewhat different. In this case, 15 PAHs and one methylated substance were selected for quantification: acenaphthylene, phenanthrene, anthracene (Ant), 3-methylphenanthrene (Mph), fluoranthene (Flt), pyrene (Pyr), benzo[a]anthracene, chrysene, benzo[b]fluoranthene, benzo[k]fluoranthene, benzo[e]pyrene, benzo[a]pyrene, dibenz[a,h]anthracene, indeno [1,2,3-cd]pyrene, benzo[ghi]perylene, and coronene (Cor). In this study, these were denoted as “PAHs”. These standard reagents, apart from Ant, Mph, and Cor, were purchased from AccuStandard Inc. (New Haven, CT, USA). Ant was purchased from Nacalai Tesque, Inc. (Kyoto, Japan), while Mph and Cor were purchased from Tokyo Chemical Industry Co. Ltd. (Tokyo, Japan). Acenaphthene-d10, phenanthrene-d10, pelyrene-d12, and pyrene–d10 were used as surrogate compounds for precise measurements. The first three were purchased from Wako Pure Chemical Industries, Ltd. (Osaka, Japan), and pyrene–d10 was acquired from Kanto Chemical Co. Inc. (Tokyo, Japan). Silica gel C-200 was purchased from Wako Pure Chemical Industries, Ltd. for cleanup and the analytical-grade solvents were purchased from Nacalai Tesque, Inc.
The filters were stored in a desiccator for more than 2 days. The filter was cut into pieces, placed in a centrifuge tube, and 100 ng of each of the four surrogates was added. Further 30 mL of acetone was introduced, and ultrasonic extraction was performed for 10 min. After centrifugation, the extract was filtered through a cartridge with a pore size of 0.45 μm. This procedure was repeated three times. The filtrate was concentrated to approximately 1 mL using nitrogen blow. Polar compounds in the solution, components that interfere with the analysis, were removed by adsorption on 15 mL of 5% H2O deactivated silica gel. The component containing PAHs was eluted with 50 mL of an acetone-dichloromethane mixture (3:2, v/v). This eluate was collected and concentrated for GC/MS analyses.
The eluted samples were dehydrated and concentrated to 1 mL using nitrogen blow. The PAHs were determined using a 7890A gas chromatograph (Agilent Technologies, Santa Clara, CA, USA) equipped with a 7000A mass spectrometer (Agilent Technologies). An aliquot of 1 μL was injected into an HP-1MS capillary column with 1.4 mL/min helium gas. The injector temperature was maintained at 300 °C. The column temperature was programmed as follows: 60 °C for 1 min, heat to 300 °C at 10 °C/min, and hold for 5 min. The molecular weight of each PAH and deuterium-labeled PAH was used for quantification in selected ion monitoring (SIM) mode. The concentration of the target component was quantified by the internal standard method using the standard for each PAH and the surrogate described above.

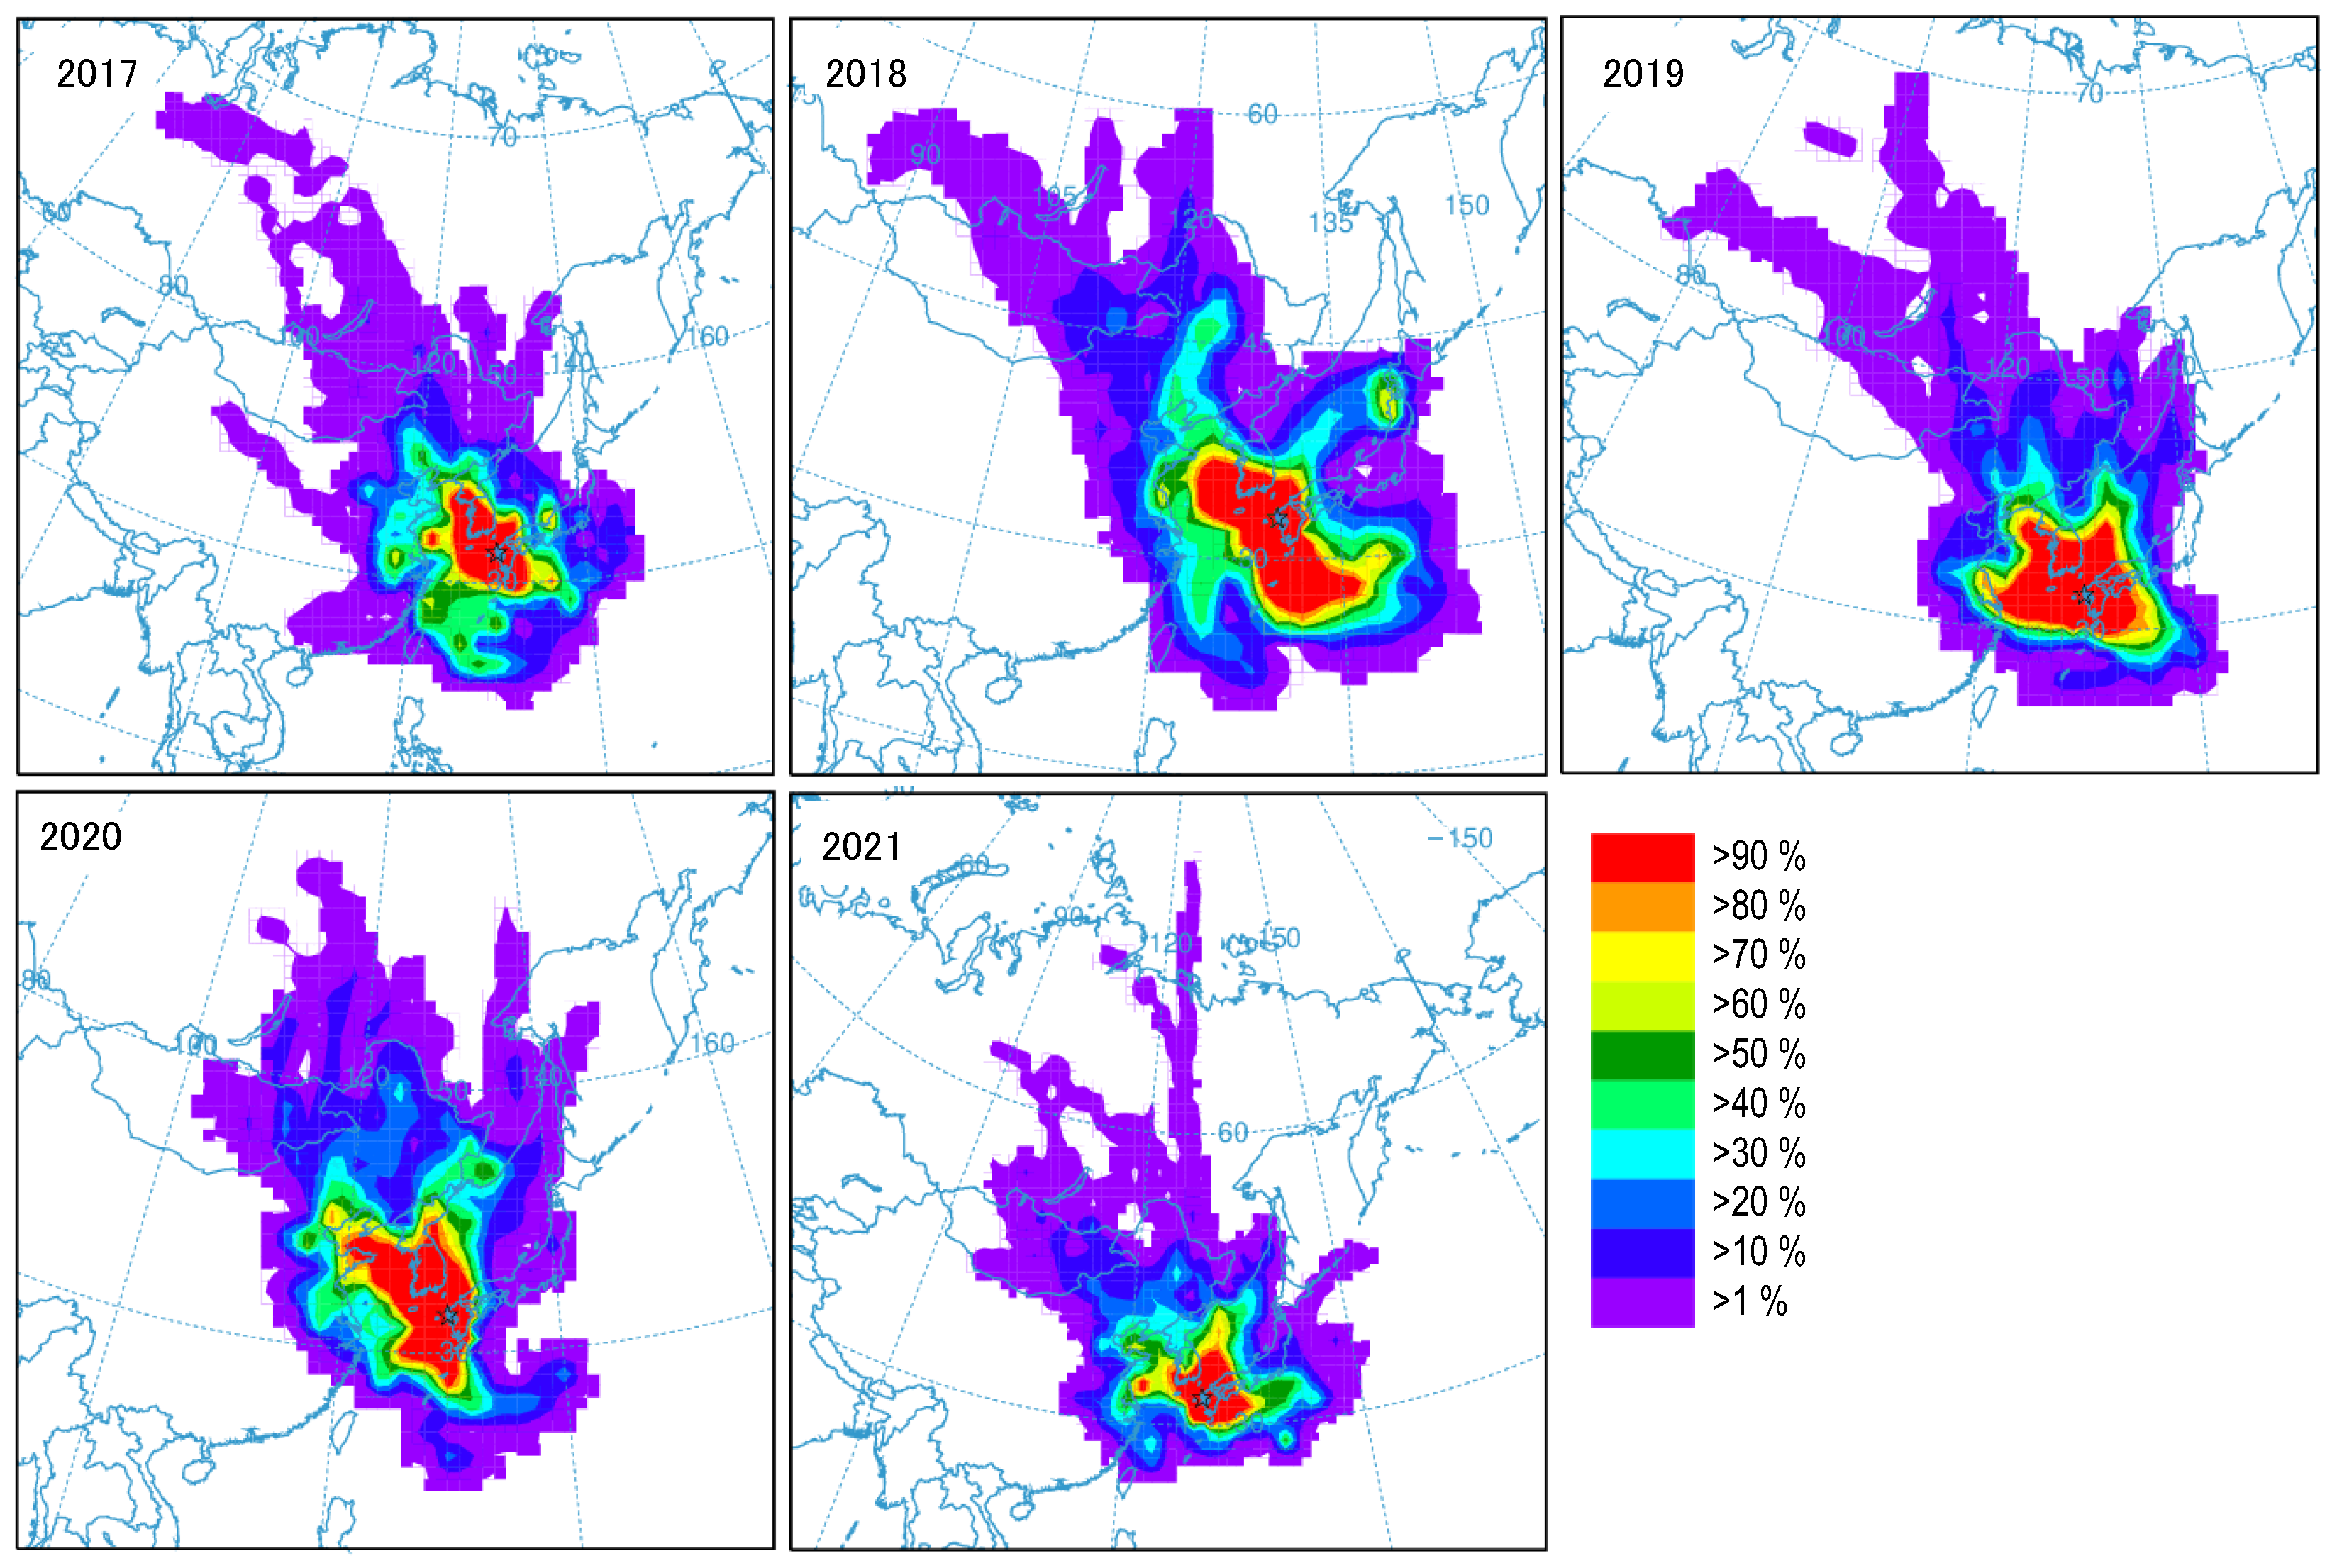
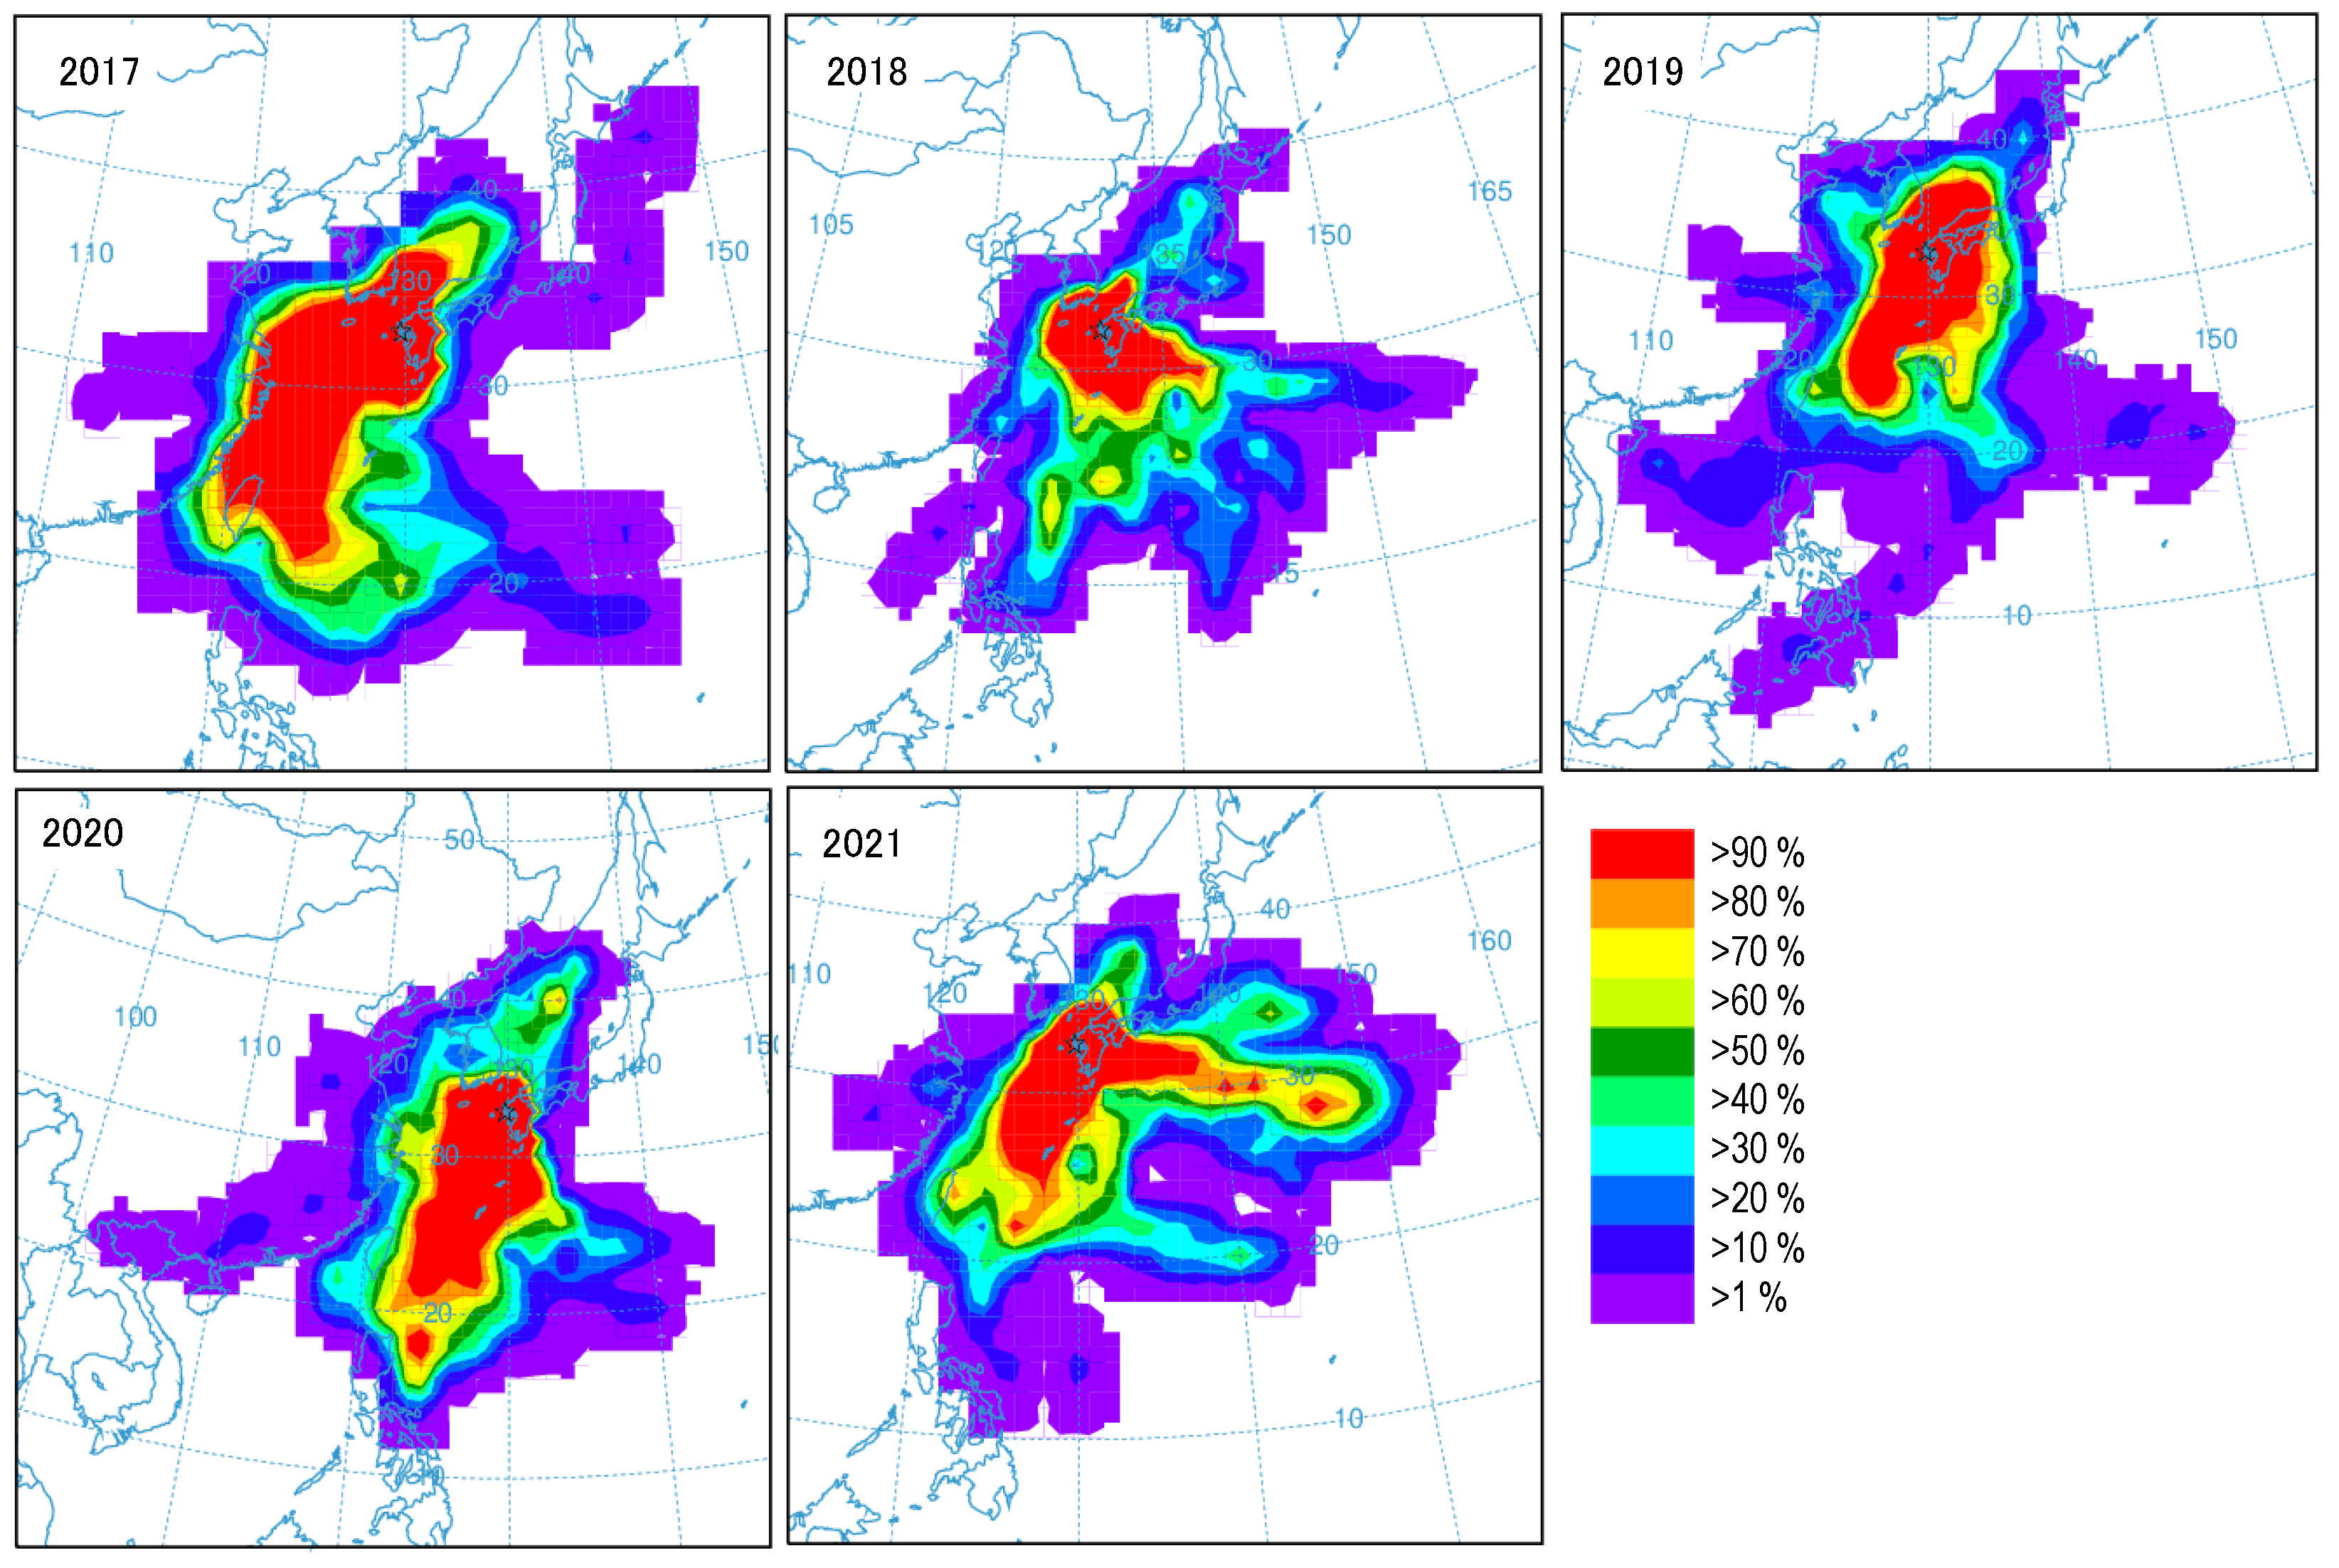
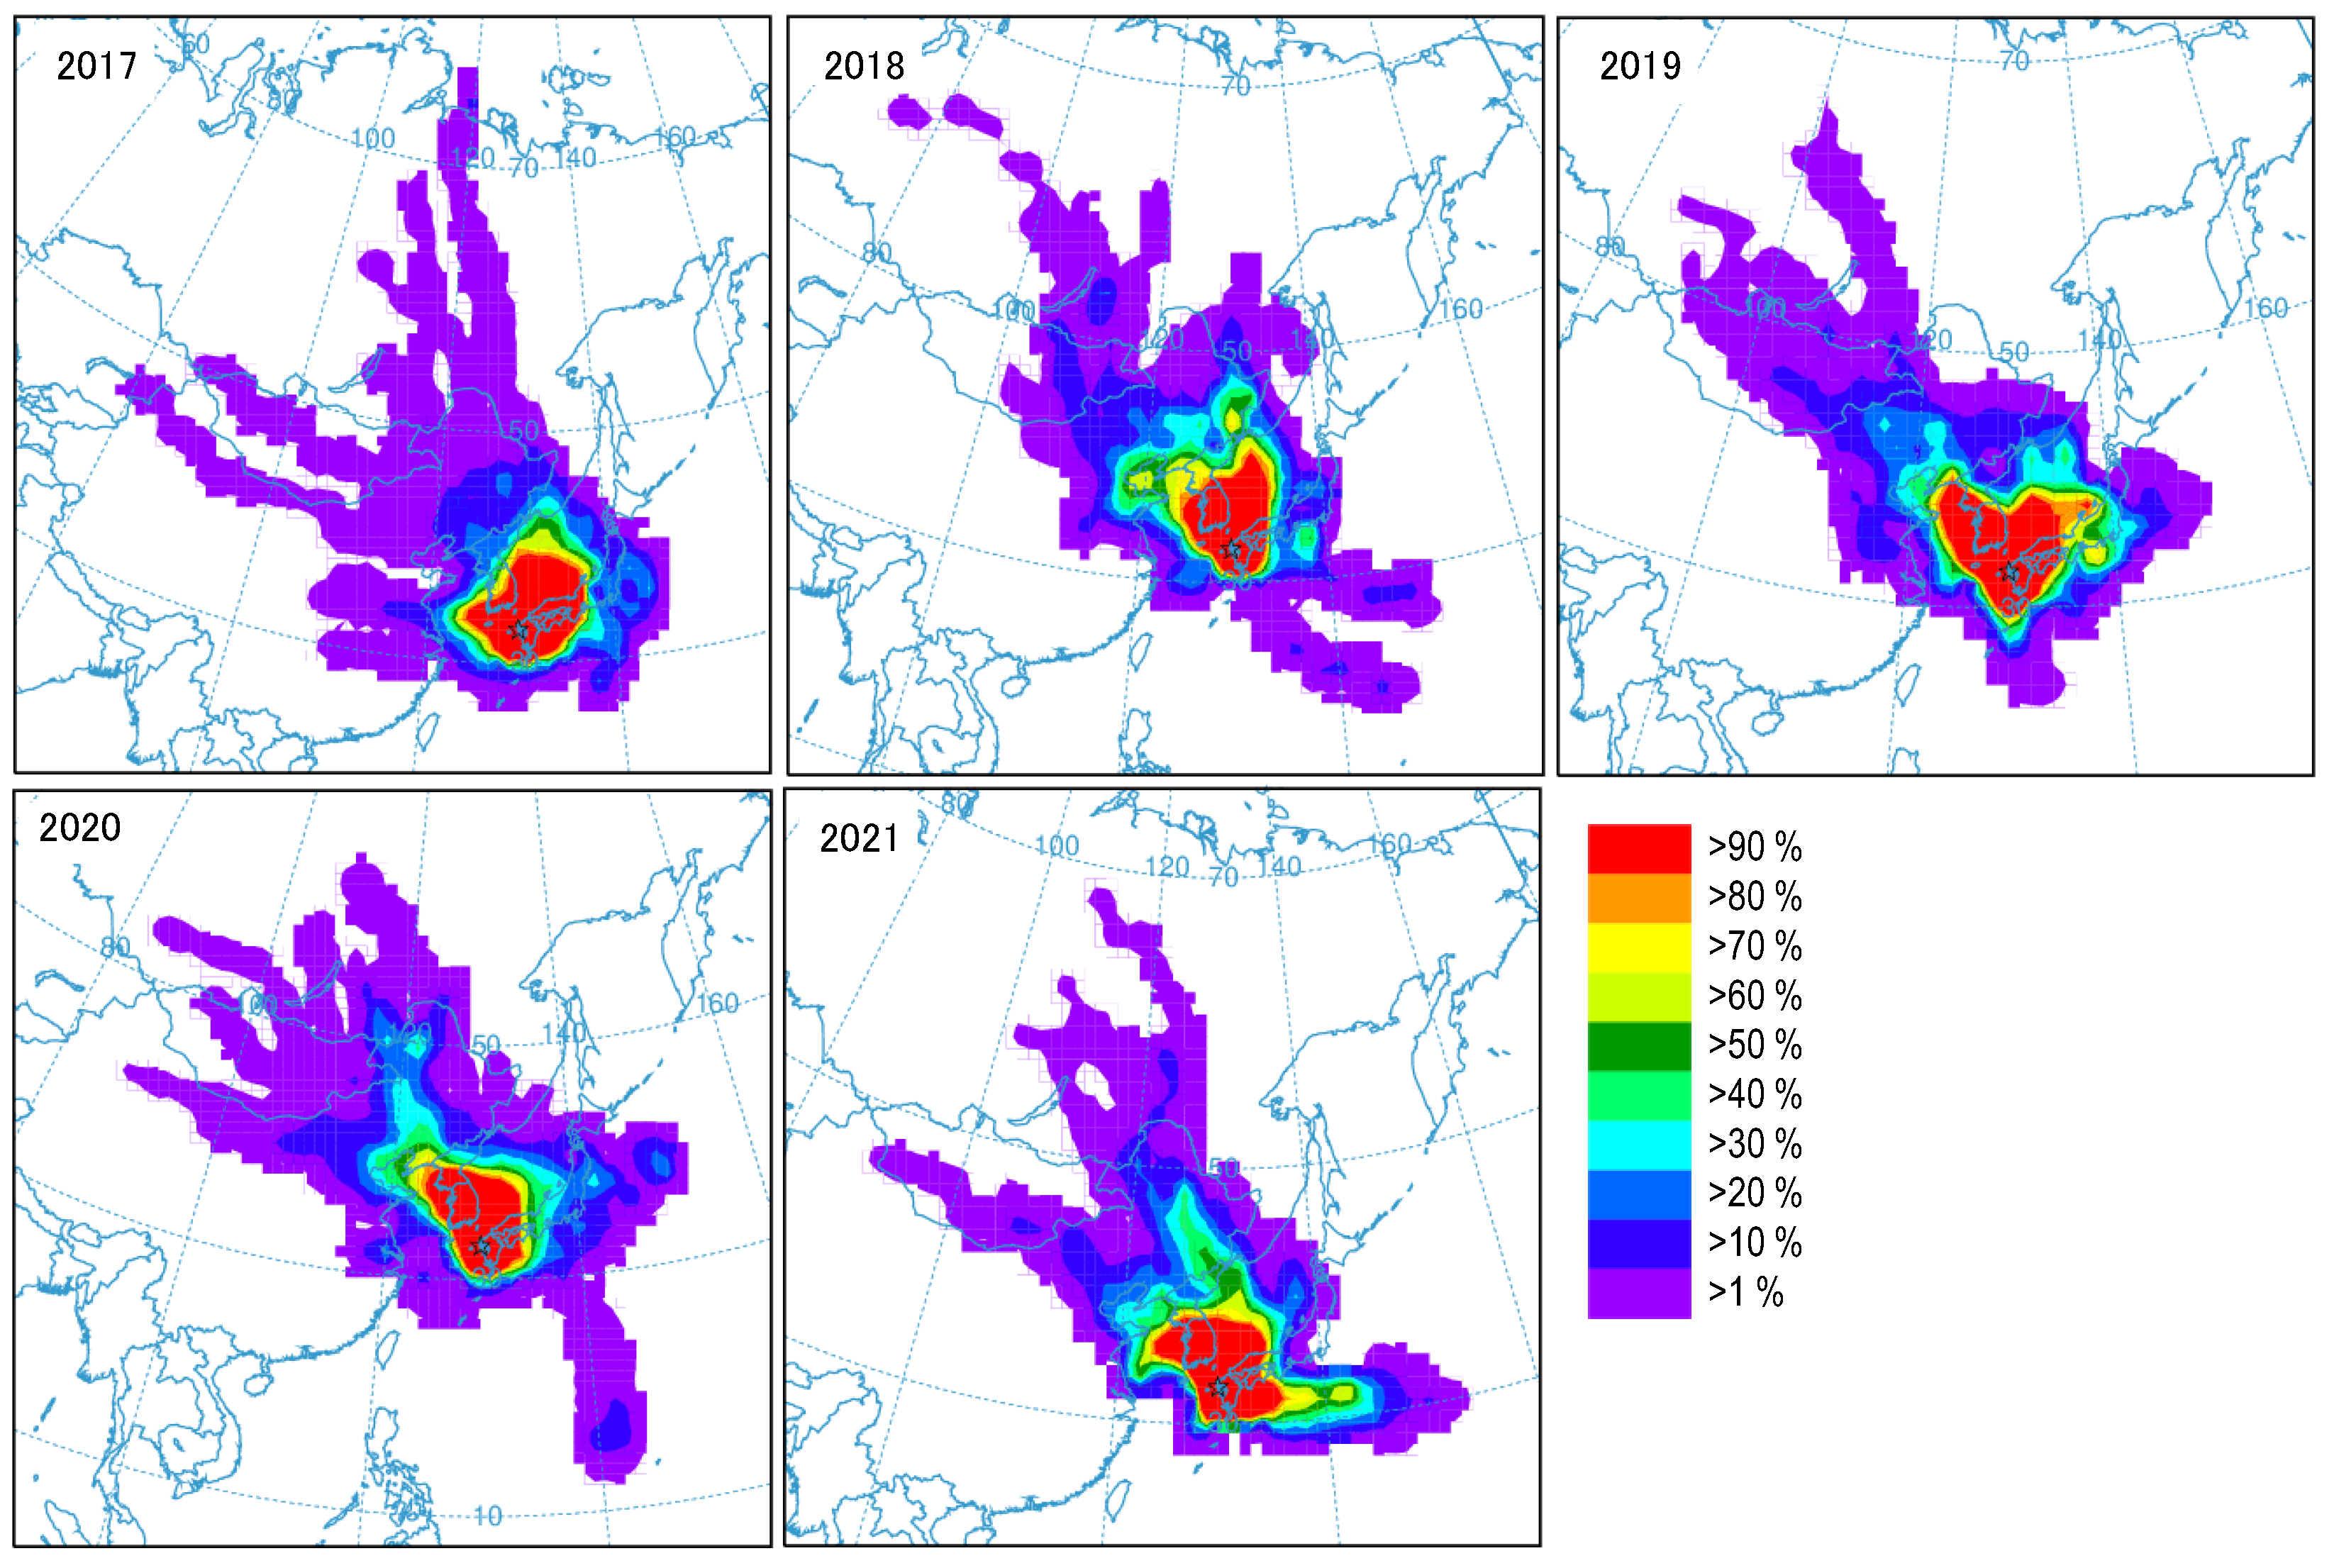
2.3. Back Trajectory Analysis

Back trajectory analysis was performed with HYSPLIT Model-Trajectory Frequencies of the National Oceanic and Atmospheric Administration, USA [20,21] in order to grasp the long-range transport of air masses. The results from this model show the frequency that the trajectory passed over a grid cell taking into account residence time. The main analysis conditions were the same as the previous report [19].

3. Results and Discussion

3.1. Back Trajectory Analysis

Figure 2, Figure 3, Figure 4 and Figure 5 show back trajectory analysis results for the forest site for each season during the study period. Figure 2 shows the frequency of back trajectories in winter. In all years, the back trajectories were drawn more frequently in the northwest direction of Nagasaki, indicating that advection from the northwest was predominant in winter. In other words, in winter, there were many cases in which air masses that passed through cold continental regions such as northeastern China and the Korean peninsula reached Nagasaki. Figure 3 shows the frequency of back trajectories in spring. Although advection from the northwest direction of Nagasaki was also common in spring, advection from directions other than the northwest, including the Pacific side, was increasing compared to winter. Figure 4 shows the frequency of back trajectories in summer. There was less advection from the continental direction in summer. Advection from the Pacific and other oceanic regions, where there was less land and less anthropogenic activity, was dominant. Figure 5 shows the frequency of back trajectories in autumn. As in spring, advection from the northwest of Nagasaki was common in autumn, while advection from directions other than the northwest was increasing compared to winter. These results were almost the same as those of the previous study [19].

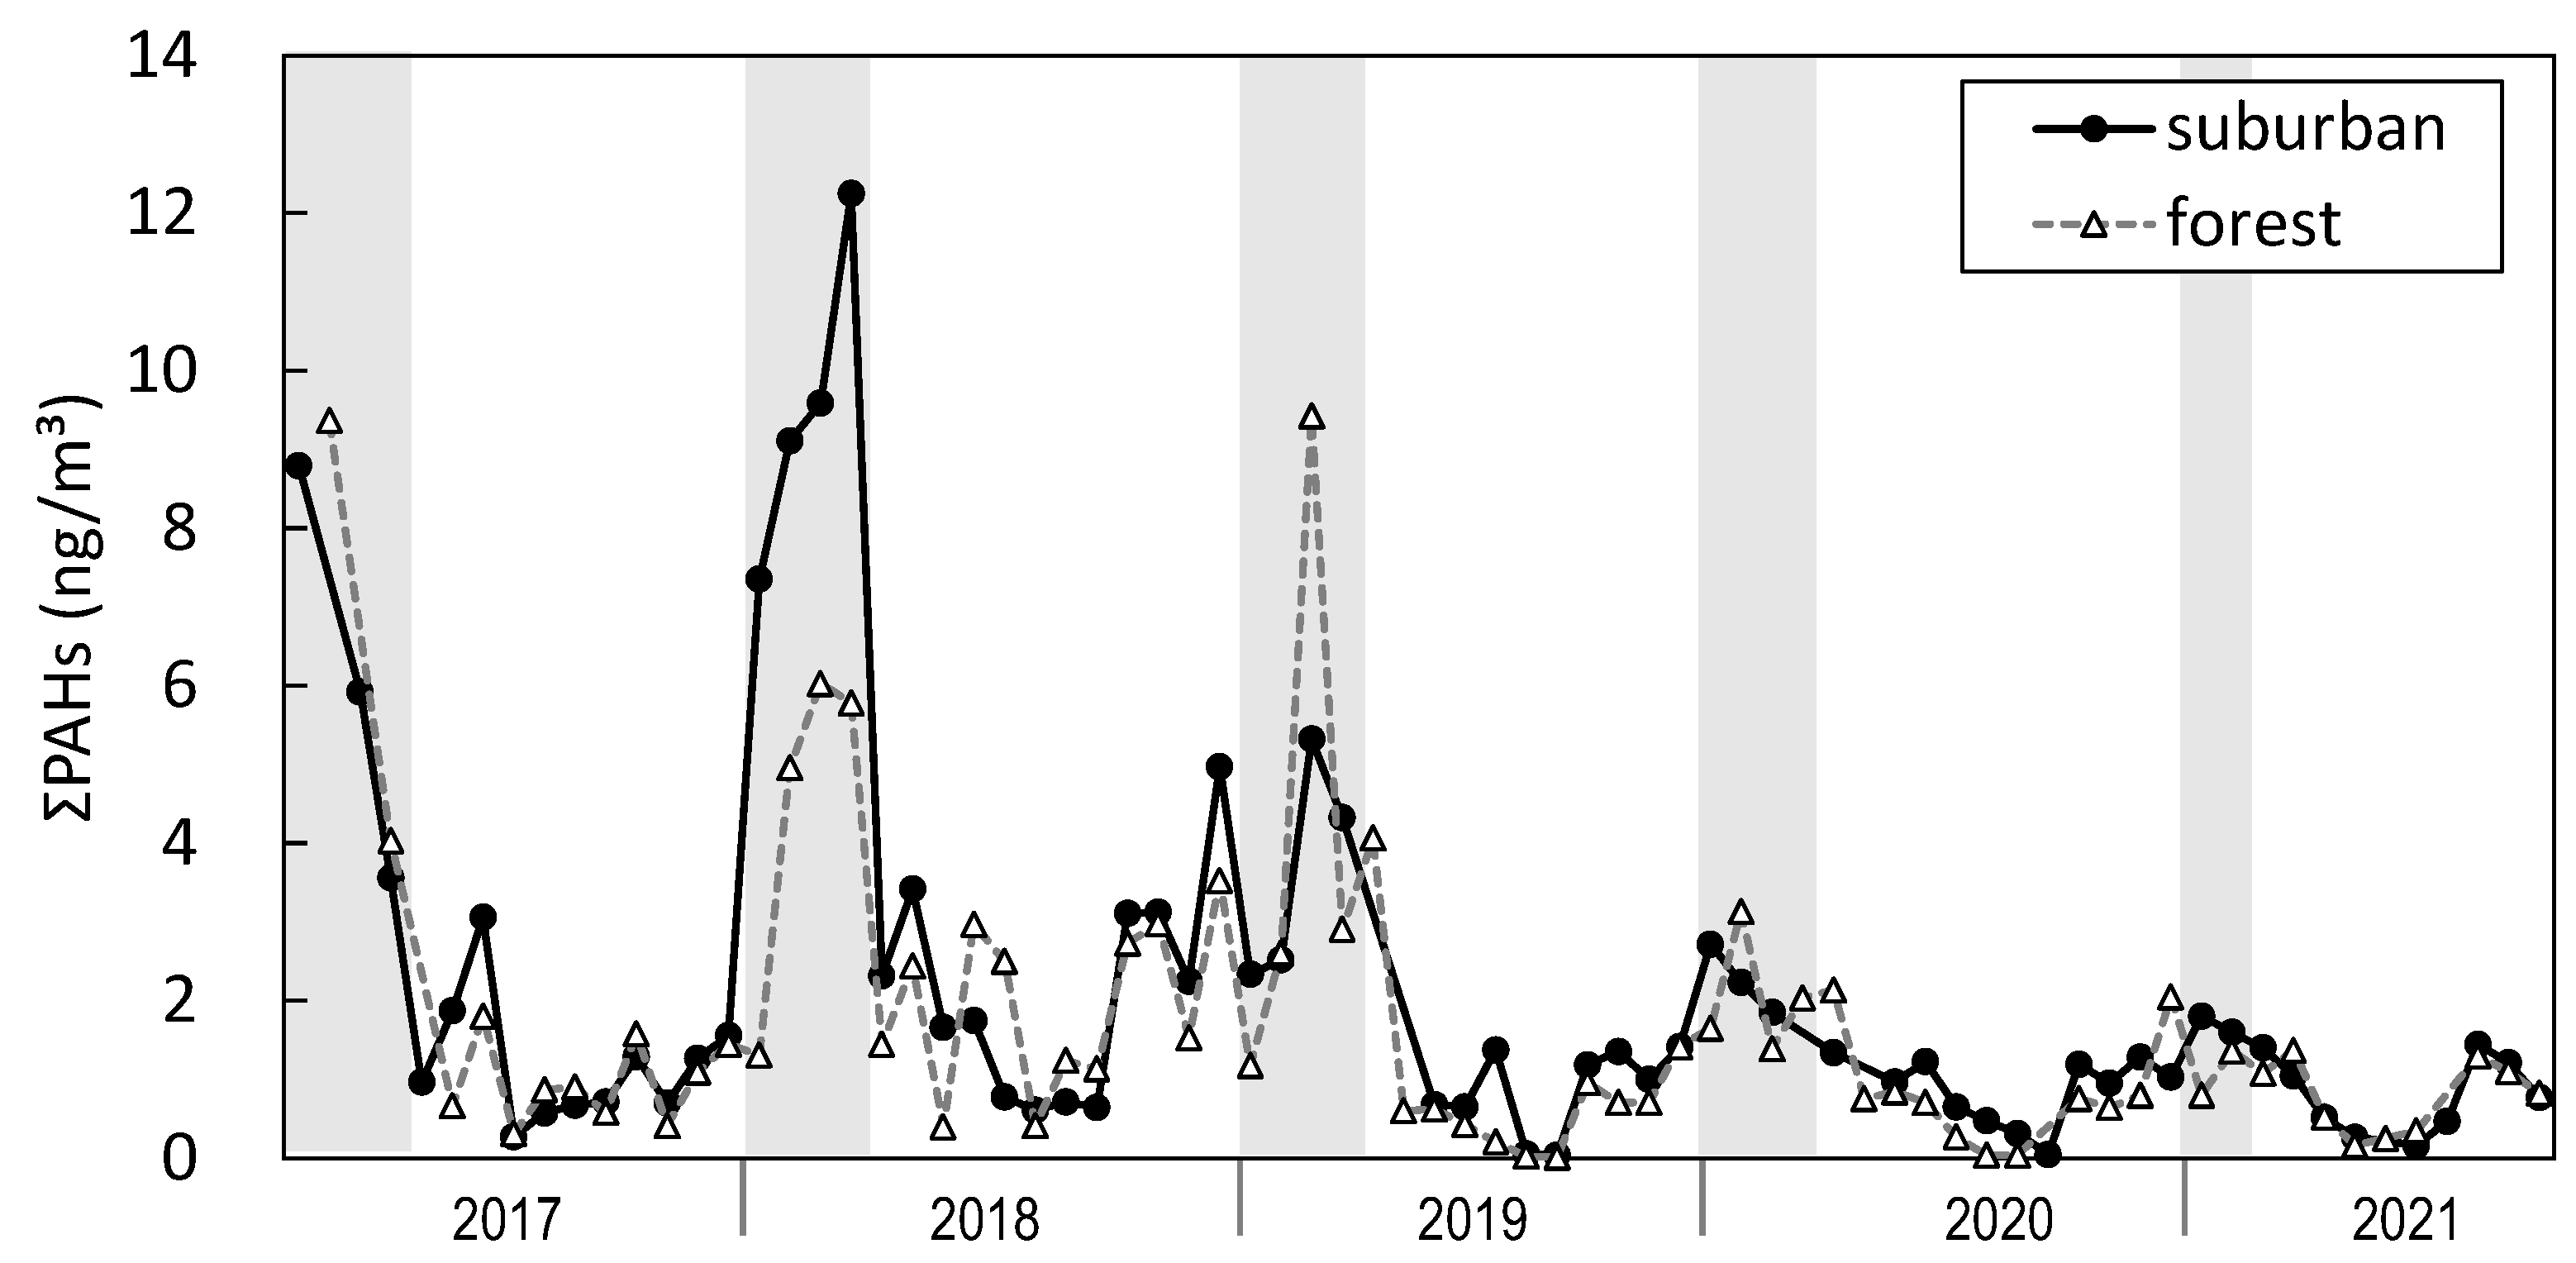
3.2. Behaviors in PAH Concentrations and Their Causes

The total concentrations of the target PAHs (ΣPAHs) measured in the suburban and forest sites in Nagasaki from 2017 to 2021 are shown in Figure 6. The individual PAH concentrations are shown in Tables S1 and S2. The ΣPAH values ranged from 0.039 to 12.2 ng/m3 and 0.012 to 9.43 ng/m3 in the suburban and forest sites, respectively. The mean value of the suburban site was 2.12 ng/m3, which was 1.25 times greater than that of the forest site (1.69 ng/m3). In addition to wide-area pollution, including transboundary pollution, suburban site was likely affected by local automobile emissions and other factors. Conversely, there were a few cases in which PAH concentrations were higher at the forest site even though there were no nearby pollution sources. This is presumably because they do not capture exactly the same air mass due to the shift in wind direction and the slight deviation in the sampling period. As observed in previous studies, PAH concentrations were higher in winter and lower in summer [19,22,23]. The reasons for the high PAH concentration in winter at this study area according to the previous report are (1) an increase in the burning of coal and biomass for thermal heating, especially in the cold northern parts of China; (2) the prevailing winter wind from the northwest from the stable atmospheric pressure chart pattern; (3) a lower altitude for mixing of atmospheric zones in winter; (4) a decreased decomposition of chemical substances due to low temperatures and weak sunshine in winter; and (5) less breakthrough of PAHs with high vapor pressure from the particulate phase to the gas phase due to low temperatures [19].
The average values for each year are shown in Figure 7 to clarify the changes over time. There was an overall decreasing behavior, although ΣPAHs increased from 2017 to 2018 at both sites. During the entire period, ΣPAHs decreased by 60% in suburban site and by 57% in forest site. There are few reports on atmospheric PAH concentrations during the same period as this study. Zhang et al. reported a 40–50% decrease in atmospheric PAH concentrations in Wajima, Japan, during the COVID-19 outbreak period compared to the same period of the previous year [24]. Although the study period was different, the results of this study were similar to the report.
To understand this downward behavior, Figure 8 shows the results aggregated by season. The winter value changed more markedly than the other seasons, with a decrease of 72% in suburban site and 84% in forest site. Since the items (2) to (5) which are the reasons for the high PAH concentration in winter listed above would not have changed during this period, it is assumed that the results were due to an alteration in relation to item (1). Within China, measures are being taken to convert the domestic coal used for heating and cooking to natural gas, and renewable energy is being used extensively. In addition, according to Cao et al., PAH emissions from 2016 to 2020 from domestic coal across China have been nearly halved [25]. Thus, considering also the results of the back trajectory analysis, one of the main reasons for the markedly downward behavior in winter values is thought to be the decrease in the amount of biomass and coal burned for heating and other operations in cold continental regions such as northern China. The ΣPAH values in the suburban and forest sites decreased by 37% and 49% in 2020, and by 53% and 73% in 2021, respectively, compared to 2019. One reason for this may be the frequent curtailment of industrial activities in China, such as the factory shutdowns that occurred for several months beginning in January 2020, as China’s novel coronavirus outbreak led to lockdowns throughout the country, which suspended economic activities. In 2021, community-acquired infections still occurred frequently in China, and factory operations were suspended each time. As a result, the concentration of PAHs emitted in China decreased, which is presumed to have affected the overall decrease in the concentration of PAHs in Nagasaki in 2020 and 2021.
In spring, PAHs decreased by 50% in suburban site and by 20% in forest site, but with a smaller range than that observed in winter. This may be due to more air mass advection in spring from directions other than northeastern China, and the reduced amount of coal and biomass burning for heating compared to that in winter. Similarly, the autumn PAH concentrations did not decrease significantly during this period.
In summer, the concentrations decreased by 60% in suburban site and by 62% in forest site. One of the main reasons for this may be the decrease in emissions from sources in the vicinity of Japan because of the predominance of air masses originating from the Pacific Ocean in summer. In particular, for 2020 and 2021, movement restrictions in Japan could cause a decrease in PAH emissions from automobiles, aircraft, ships, etc. However, because concentrations are much lower in summer than in other seasons, the effect of this decrease on the annual mean is small.
Overall, the recent declining behavior in PAH concentrations in Nagasaki is considered to be mainly due to less PAHs originating from cold continental regions, such as northern China. The decline in total PAH emissions in China could be influenced by the replacement of residential coal with natural gas, widespread use of new energy sources such as solar and wind energy, and efforts to improve air quality in China including sophistication of exhaust gas treatment technology. In addition, restrictions on economic activities in response to COVID-19 may have impacted these values. It is speculated that these energy transitions and infectious disease countermeasures in China have affected the decrease in atmospheric PAH concentrations in Nagasaki, which is located downstream of the monsoon.

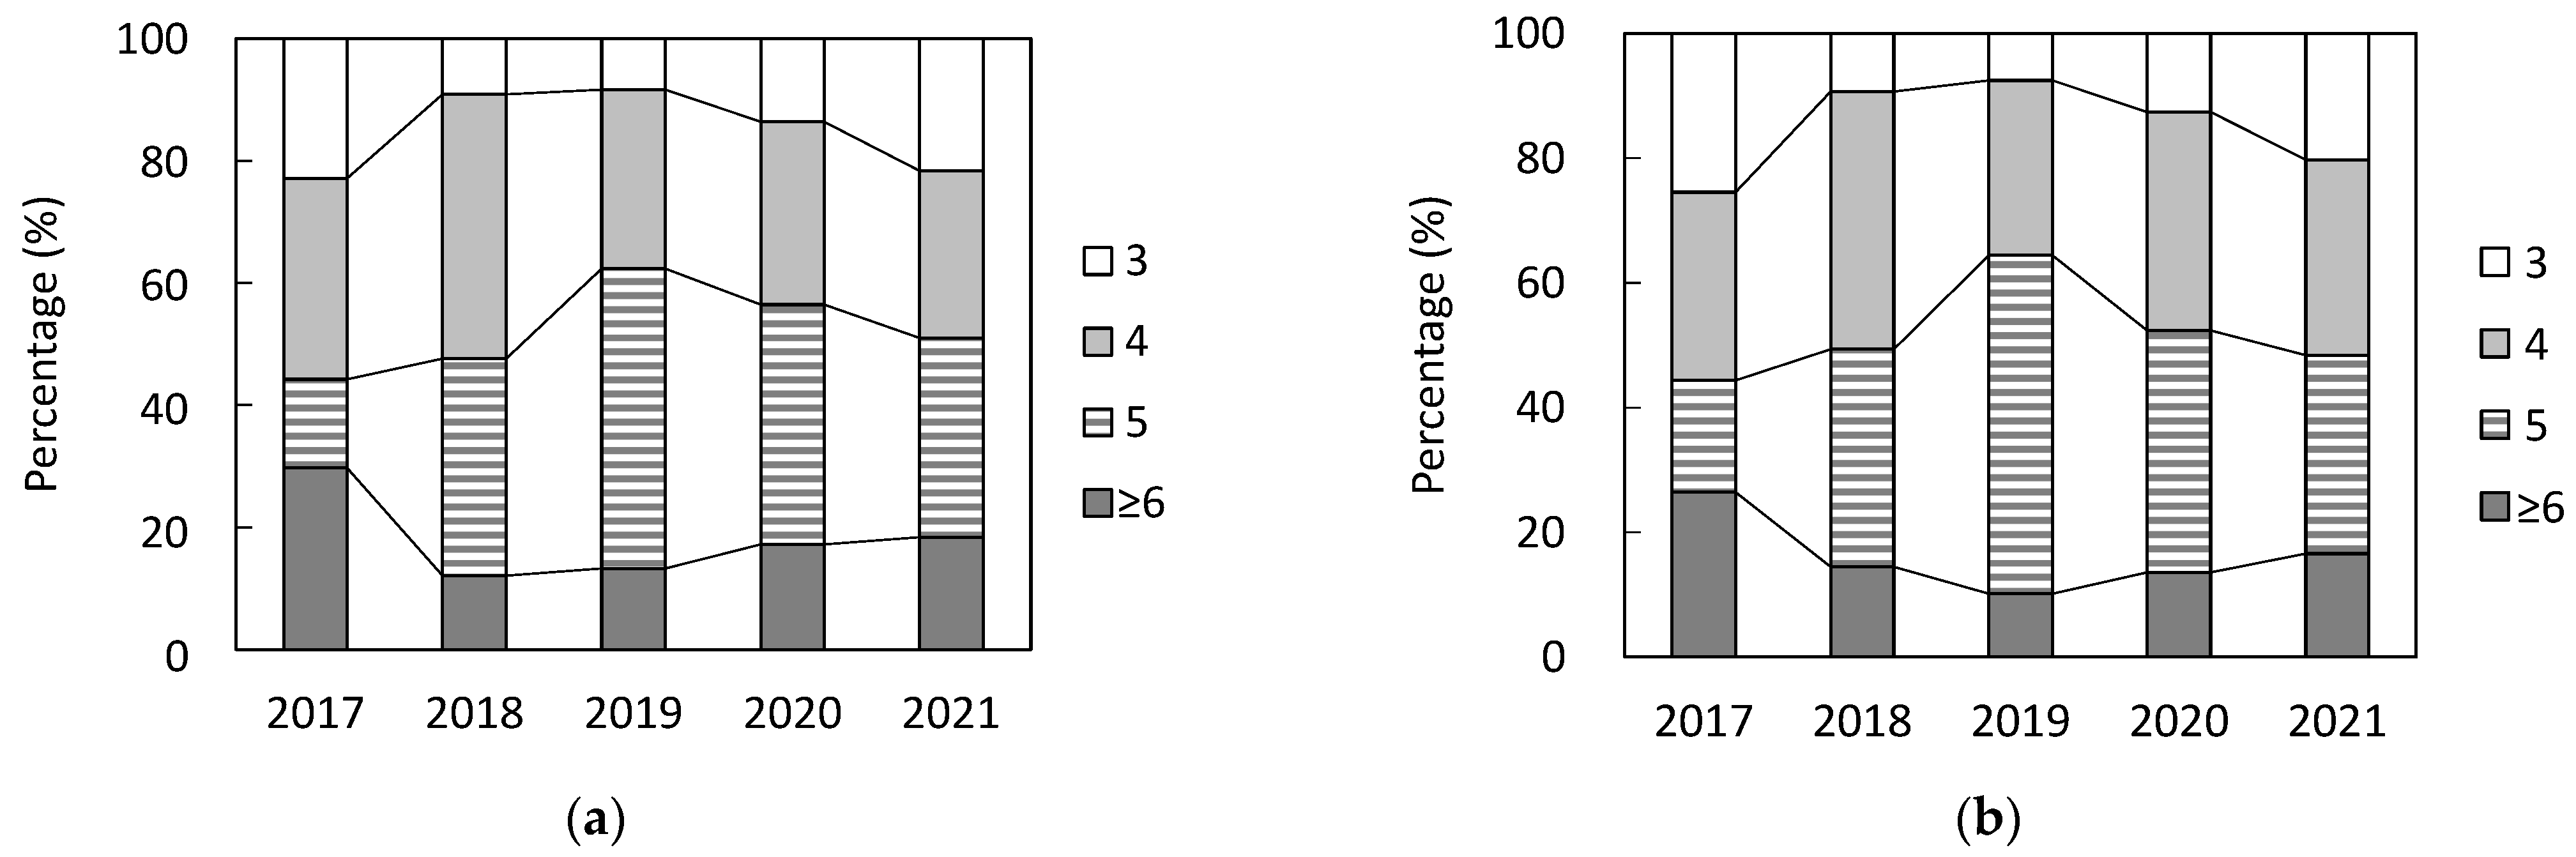
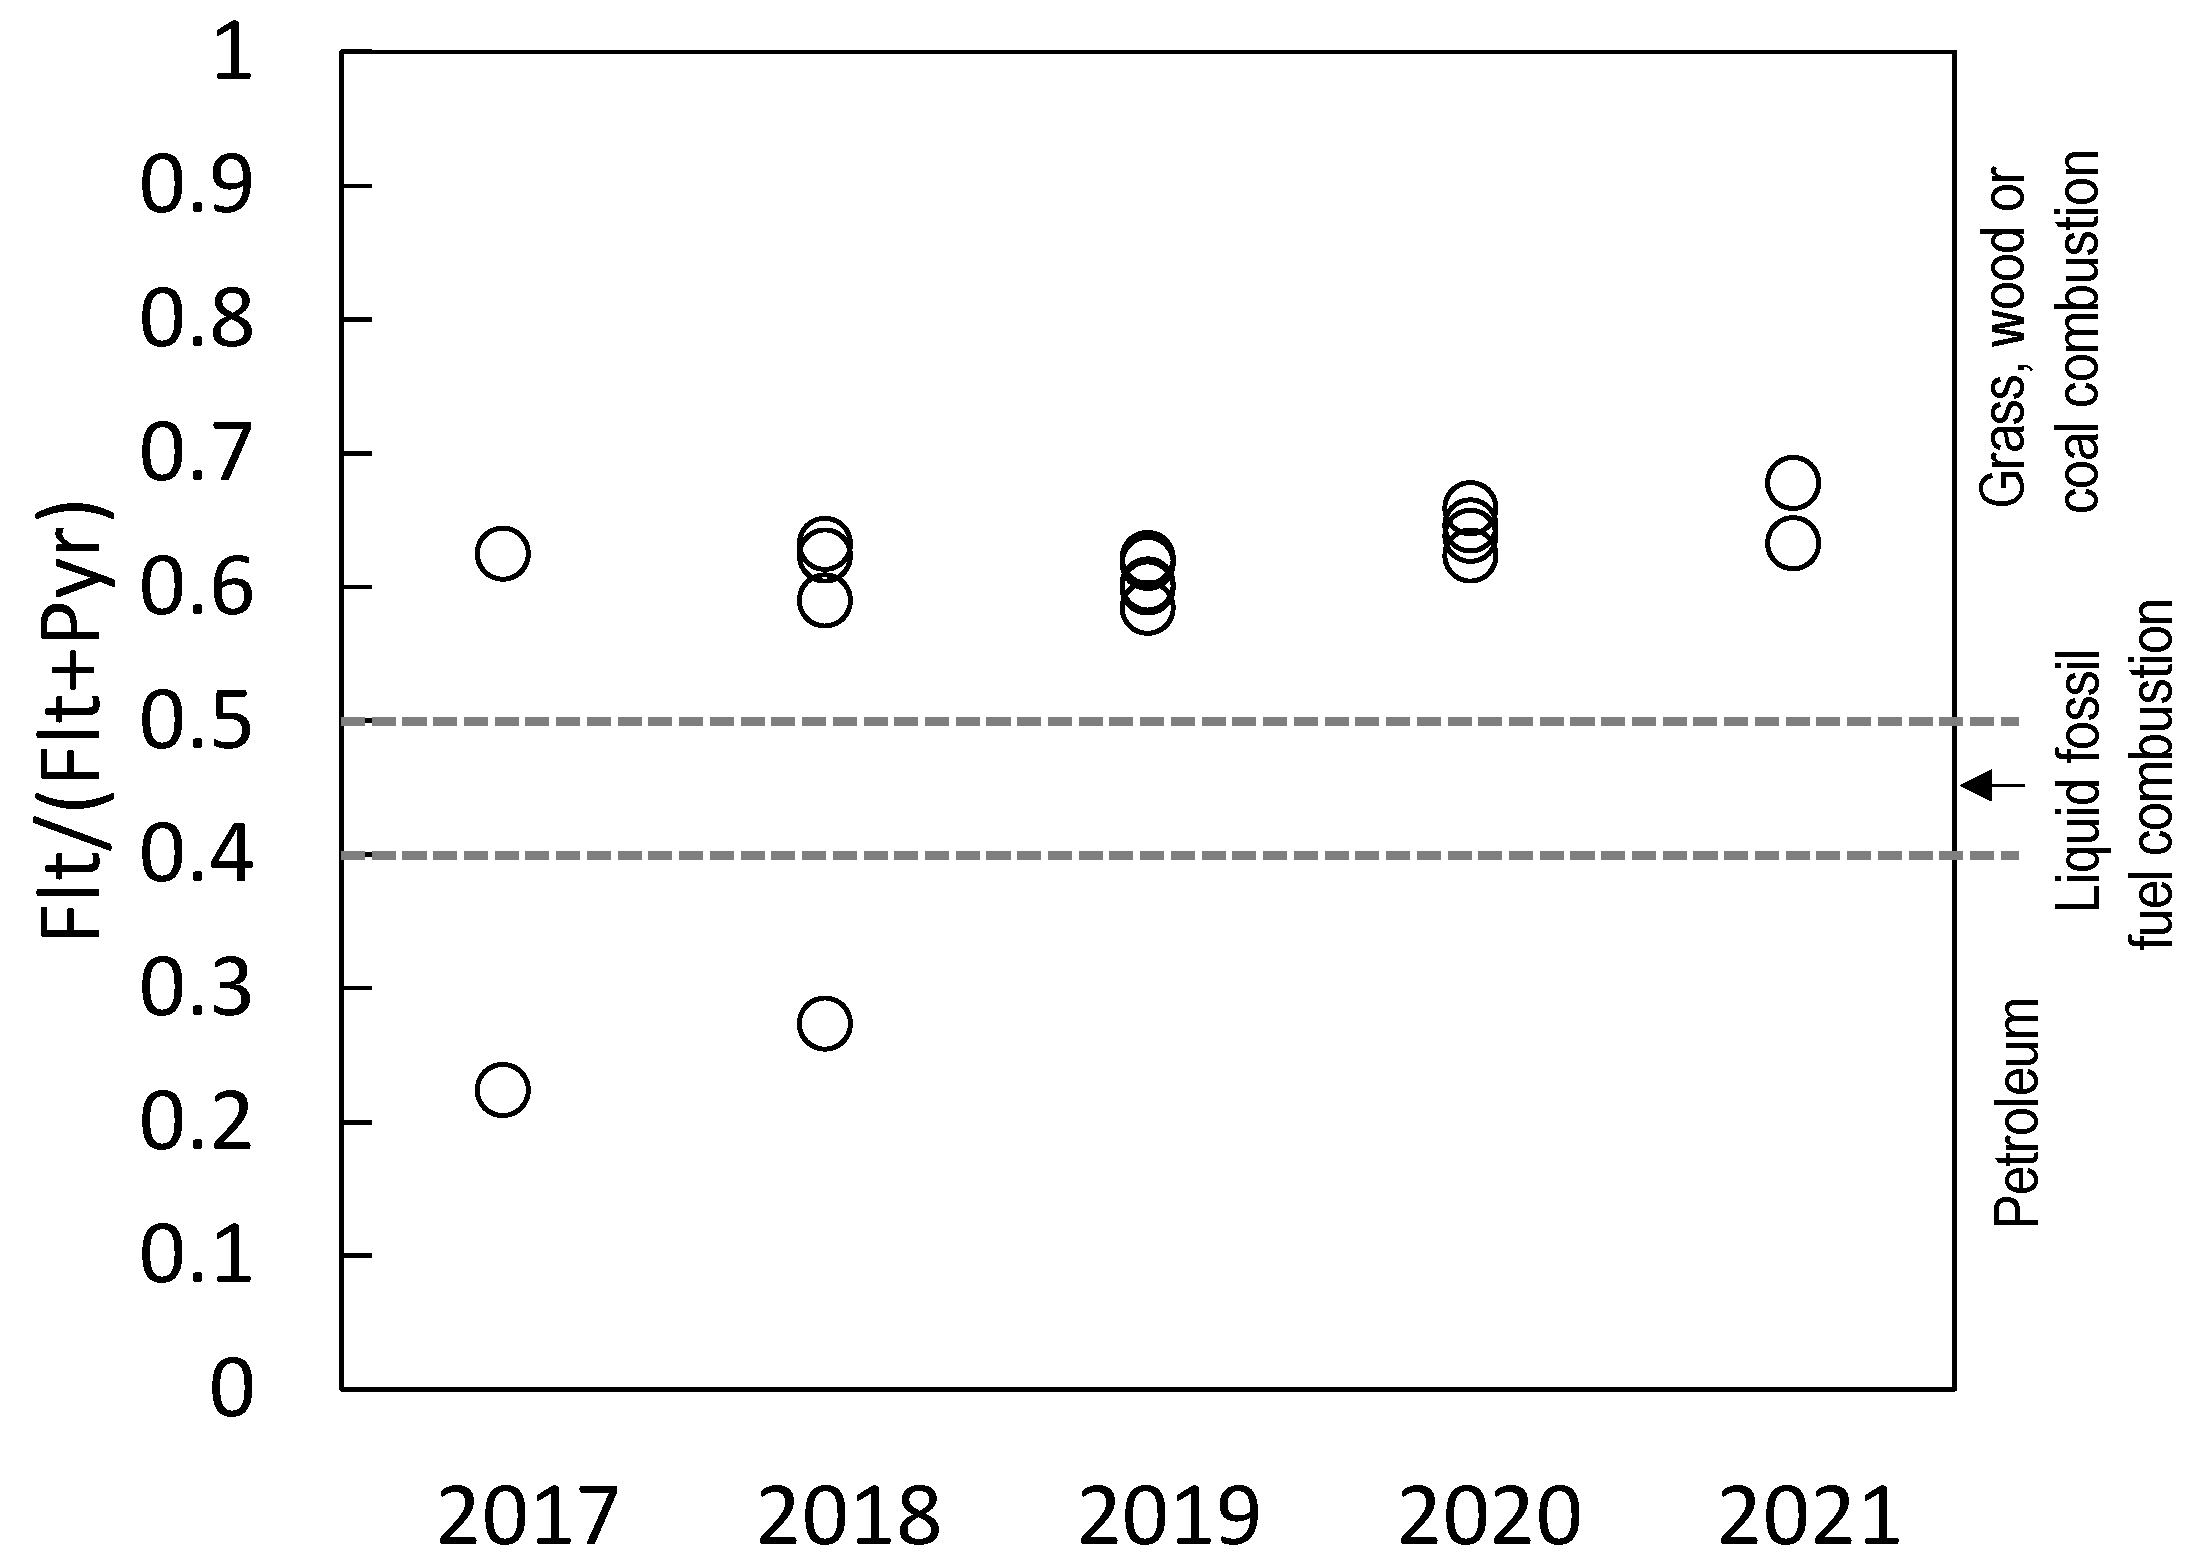
3.3. Characteristics of PAHs in Each Year

Figure 9 shows the results arranged by the ring number of PAHs to investigate whether there is a behavior in the general types of PAHs for each research year. The suburban and forest sites yielded similar results, which supports the idea that they were influenced by similar sources. In the last 4 years, 4- and 5-ring PAHs have been abundant, while few 3-, 6-, and higher-ring PAHs have been reported. This behavior is similar to that observed in a long-term survey report in Japan [24,26]. There was no clear relationship between the number of rings and the recent decreasing behavior in PAH concentrations in Nagasaki. Although the results are not shown, there was no clear relationship between the number of rings and decreasing concentrations of PAHs in the seasonal analysis.
Source characteristics were estimated from the diagnostic ratios of the PAHs because of the possible relationship between the source type and PAH composition. Various diagnostic ratios have been proposed for this estimation [27,28,29]. In this study, Flt/(Flt + Pyr) was selected as an indicator that can distinguish three types of sources: petroleum, oil combustion, and biomass/coal combustion, using four-ring PAHs with relatively high abundance (Figure 9). For example, Flt/(Flt + Pyr) values of less than 0.4 are considered to originate from petroleum; 0.4–0.5 from liquid fossil fuel combustion; and >0.5 from biomass/coal combustion [29,30,31]. Figure 10 shows behaviors in the diagnostic ratio using all data from forest site that were less susceptible to local pollution. The results showed that the source category was “grass, wood, or coal combustion,” although there was some variation. These results are consistent with those of previous studies [19,24,32]. These results were determined by collectively calculating the data for one year under various conditions, such as wind direction and temperature; the winter values were extracted and analyzed in the next paragraph.
Figure 11 is a graph plotting each year by extracting and calculating only winter values, when PAH concentrations were higher. Figure 11 shows that the source category was sometimes “petroleum” in 2017 and 2018, but overall, as in Figure 10, the source category would be “grass, wood, or coal combustion” even when looking at winter alone. This could relate to the less advanced environmental measures in 2017 and 2018, whereby there were contributions from a variety of sources, including “petroleum”, but from 2019 onward, contributions from such sources decreased. It also shows that biomass combustion and coal combustion remain considerable despite the advancements in recent years. Overall, the concentration of PAHs has decreased in Nagasaki in recent years, but the Flt/(Flt + Pyr) index indicates that there was no significant change in the attributes of the sources. This result is consistent with that of previous studies [19,24,32].

4. Conclusions

In conclusion, the total atmospheric PAH concentrations measured at the suburban and forest sites of Nagasaki from 2017 to 2021 decreased considerably. The declines in suburban and forest sites were similar, at 60% and 57%, respectively. When analyzed by season, the percentage of decrease in winter was markedly greater, suggesting that the main reasons for this decline related to energy conversion and air quality improvement measures in China, along with the suppression of industrial activities in response to measures against novel coronavirus infections. Therefore, we were able to show that environmental measures in China could have a significant positive impact on neighboring Japan. In this study, we found that there was no clear relationship between the decrease in PAH concentration and the number of PAH rings. In addition, regarding the Flt/(Flt + Pyr) index, no significant changes in the attributes of the sources of PAHs were noted during this period.
Improving air quality at sites affected by transboundary pollution is difficult because local measures alone are insufficient. In this study, we were able to capture a significant downward behavior in atmospheric PAH concentrations in Nagasaki and consider the relevance of changes in the environmental situation in China. This result could contribute to the management of atmospheric PAH concentrations in Japan (e.g., by setting target concentrations and emission limits). It is expected that environmental improvements in China will continue to progress in the future; therefore, it will be necessary to continue monitoring air pollutants in Japan.

Supplementary Materials

The following supporting information can be downloaded at: https://0-www-mdpi-com.brum.beds.ac.uk/article/10.3390/app122110963/s1, Table S1: PAH concentrations in the suburban site of Nagasaki from 2017 to 2021; Table S2: PAH concentrations in the forest site of Nagasaki from 2017 to 2021.

Author Contributions

Conceptualization, Y.T., M.N. and T.K.; methodology, Y.T. and M.N.; validation, Y.T.; formal analysis, Y.T. and T.K.; investigation, Y.T. and W.B.; resources, Y.T., M.N. and T.K.; data curation, Y.T. and T.K.; writing—original draft preparation, Y.T., T.K. and W.B.; writing—review and editing, Y.T. and T.K.; visualization, Y.T. and T.K.; supervision, Y.T.; project administration, Y.T. All authors have read and agreed to the published version of the manuscript.

Funding

This research received no external funding.

Institutional Review Board Statement

Not applicable.

Informed Consent Statement

Not applicable.

Data Availability Statement

The authors confirm that all data of this study are available within the article.

Acknowledgments

The authors gratefully acknowledge the NOAA Air Resources Laboratory (ARL) for the provision of the HYSPLIT transport and dispersion model and/or READY website (https://www.ready.noaa.gov) used in this publication. The authors want to acknowledge all members of Faculty of Environmental Science, Nagasaki University, Japan involved in this study.

Conflicts of Interest

The authors declare no conflict of interest.

References

  1. IARC Working Group on the Evaluation of Carcinogenic Risks to Humans. IARC Monographs on the Evaluation of Carcinogenic Risks to Humans; International Agency for Research on Cancer: Lyon, France, 2010; Volume 92. [Google Scholar]
  2. Albinet, A.; Leoz-Garziandia, E.; Budzinski, H.; ViIlenave, E. Polycyclic aromatic hydrocarbons (PAHs), nitrated PAHs and oxygenated PAHs in ambient air of the Marseilles area (South of France): Concentrations and sources. Sci. Total Environ. 2007, 384, 280–292. [Google Scholar] [CrossRef] [PubMed] [Green Version]
  3. Borrás, E.; Tortajada-Genaro, L.A.; Vázquez, M.; Zielinska, B. Polycyclic aromatic hydrocarbon exhaust emissions from different reformulated diesel fuels and engine operating conditions. Atmos. Environ. 2009, 43, 5944–5952. [Google Scholar] [CrossRef]
  4. Yang, L.; Suzuki, G.; Zhang, L.; Zhou, Q.; Zhang, X.; Xing, W.; Shima, M.; Yoda, Y.; Nakatsubo, R.; Hiraki, T.; et al. The Characteristics of Polycyclic Aromatic Hydrocarbons in Different Emission Source Areas in Shenyang, China. Int. J. Environ. Res. Public Health 2019, 16, 2817. [Google Scholar] [CrossRef] [PubMed] [Green Version]
  5. Shi, Z.; Tao, S.; Pan, B.; Fan, W.; He, X.C.; Zuo, Q.; Wu, S.P.; Li, B.G.; Cao, J.; Liu, W.X.; et al. Contamination of rivers in Tianjin, China by polycyclic aromatic hydrocarbons. Environ. Pollut. 2005, 134, 97–111. [Google Scholar] [CrossRef]
  6. Qi, W.; Liu, H.; Pernet-Coudrier, B.; Qu, J. Polycyclic aromatic hydrocarbons in wastewater, WWTPs effluents and in the recipient waters of Beijing, China. Environ. Sci. Pollut. Res. 2013, 20, 4254–4260. [Google Scholar] [CrossRef]
  7. Wang, Y.; Zhang, S.; Cui, W.; Meng, X.; Tang, X. Polycyclic aromatic hydrocarbons and organochlorine pesticides in surface water from the Yongding River basin, China: Seasonal distribution, source apportionment, and potential risk assessment. Sci. Total Environ. 2018, 618, 419–429. [Google Scholar] [CrossRef]
  8. Bucheli, T.D.; Blum, F.; Desaules, A.; Gustafsson, Ö. Polycyclic aromatic hydrocarbons, black carbon, and molecular markers in soils of Switzerland. Chemosphere 2004, 56, 1061–1076. [Google Scholar] [CrossRef]
  9. Peng, C.; Chen, W.; Liao, X.; Wang, M.; Ouyang, Z.; Jiao, W.; Bai, Y. Polycyclic aromatic hydrocarbons in urban soils of Beijing: Status, sources, distribution and potential risk. Environ. Pollut. 2011, 159, 802–808. [Google Scholar] [CrossRef]
  10. Gereslassie, T.; Workineh, A.; Liu, X.; Yan, X.; Wang, J. Occurrence and Ecological and Human Health Risk Assessment of Polycyclic Aromatic Hydrocarbons in Soils from Wuhan, Central China. Int. J. Environ. Res. Public Health 2018, 15, 2751. [Google Scholar] [CrossRef] [Green Version]
  11. Vestenius, M.; Leppänen, S.; Anttila, P.; Kyllönen, K.; Hatakka, J.; Hellén, H.; Hyvärinen, A.-P.; Hakola, H. Background concentrations and source apportionment of polycyclic aromatic hydrocarbons in south-eastern Finland. Atmos. Environ. 2011, 45, 3391–3399. [Google Scholar] [CrossRef]
  12. Chen, Y.-C.; Chiang, H.-C.; Hsu, C.-Y.; Yang, T.-T.; Lin, T.-Y.; Chen, M.-J.; Chen, N.-T.; Wu, Y.-S. Ambient PM2.5-bound polycyclic aromatic hydrocarbons (PAHs) in Changhua County, central Taiwan: Seasonal variation, source apportionment and cancer risk assessment. Environ. Pollut. 2016, 218, 372–382. [Google Scholar] [CrossRef] [PubMed]
  13. Yang, L.; Tang, N.; Matsuki, A.; Takami, A.; Hatakeyama, S.; Kaneyasu, N.; Nagato, E.G.; Sato, K.; Yoshino, A.; Hayakawa, K. A Comparison of Particulate-Bound Polycyclic Aromatic Hydrocarbons Long-Range Transported from the Asian Continent to the Noto Peninsula and Fukue Island, Japan. Asian J. Atmos. Environ. 2018, 12, 369–376. [Google Scholar] [CrossRef]
  14. National Bureau of Statistics. Available online: http://www.stats.gov.cn/search/s?tab=all&siteCode=bm36000002&qt=GDP (accessed on 30 August 2022). (In Chinese)
  15. China Statistical Yearbook 2021. Available online: http://www.stats.gov.cn/tjsj/ndsj/2021/indexeh.htm (accessed on 30 August 2022).
  16. Ministry of the Environment_Press Release_19 March 2019. Available online: https://www.env.go.jp/press/106597-print.html (accessed on 30 August 2022). (In Japanese)
  17. Tian, H.; Liu, Y.; Li, Y.; Wu, C.-H.; Chen, B.; Kraemer, M.U.G.; Li, B.; Cai, J.; Xu, B.; Yang, Q.; et al. An investigation of transmission control measures during the first 50 days of the COVID-19 epidemic in China. Science 2020, 368, 638–642. [Google Scholar] [CrossRef] [PubMed] [Green Version]
  18. Lv, Z.; Wang, X.; Deng, F.; Ying, Q.; Archibald, A.T.; Jones, R.L.; Ding, Y.; Cheng, Y.; Fu, M.; Liu, Y.; et al. Source–Receptor Relationship Revealed by the Halted Traffic and Aggravated Haze in Beijing during the COVID-19 Lockdown. Environ. Sci. Technol. 2020, 54, 15660–15670. [Google Scholar] [CrossRef] [PubMed]
  19. Kubo, T.; Bai, W.; Nagae, M.; Takao, Y. Seasonal Fluctuation of Polycyclic Aromatic Hydrocarbons and Aerosol Genotoxicity in Long-Range Transported Air Mass Observed at the Western End of Japan. Int. J. Environ. Res. Public Health 2020, 17, 1210. [Google Scholar] [CrossRef] [Green Version]
  20. Stein, A.F.; Draxler, R.R.; Rolph, G.D.; Stunder, B.J.B.; Cohen, M.D.; Ngan, F. NOAA’s HYSPLIT Atmospheric Transport and Dispersion Modeling System. Bull. Am. Meteorol. Soc. 2015, 96, 2059–2077. [Google Scholar] [CrossRef]
  21. Rolph, G.; Stein, A.; Stunder, B. Real-time Environmental Applications and Display System: READY. Environ. Model. Softw. 2017, 95, 210–228. [Google Scholar] [CrossRef]
  22. Kim, J.Y.; Lee, J.Y.; Kim, Y.P.; Lee, S.-B.; Jin, H.C.; Bae, G.-N. Seasonal characteristics of the gaseous and particulate PAHs at a roadside station in Seoul, Korea. Atmos. Res. 2012, 116, 142–150. [Google Scholar] [CrossRef]
  23. Wang, Y.; Zhang, H.; Zhang, X.; Bai, P.; Neroda, A.; Mishukov, V.F.; Zhang, L.; Hayakawa, K.; Nagao, S.; Tang, N. PM-Bound Polycyclic Aromatic Hydrocarbons and Nitro-Polycyclic Aromatic Hydrocarbons in the Ambient Air of Vladivostok: Seasonal Variation, Sources, Health Risk Assessment and Long-Term Variability. Int. J. Environ. Res. Public Health 2022, 19, 2878. [Google Scholar] [CrossRef]
  24. Zhang, L.; Yang, L.; Zhou, Q.; Zhang, X.; Xing, W.; Zhang, H.; Toriba, A.; Hayakawa, K.; Tang, N. Impact of the COVID-19 Outbreak on the Long-range Transport of Particulate PAHs in East Asia. Aerosol Air Qual. Res. 2020, 20, 2035–2046. [Google Scholar] [CrossRef]
  25. Cao, X.; Huo, S.; Zhang, H.; Zhao, X.; Guo, W.; He, Z.; Ma, C.; Zheng, J.; Song, S. Polycyclic Aromatic Hydrocarbons in China: Will Decoupling of Their Emissions and Socioeconomic Growth Emerge? Earth’s Future 2022, 10, e2021EF002360. [Google Scholar] [CrossRef]
  26. Suzuki, G.; Morikawa, T.; Kashiwakura, K.; Tang, N.; Toriba, A.; Hayakawa, K. Variation of polycyclic aromatic hydrocarbons and nitropolycyclic aromatic hydrocarbons in airborne particulates collected in Japanese capital area J. Jpn. Soc. Atmos. Environ. 2015, 50, 117–122. (In Japanese) [Google Scholar]
  27. Yunker, M.B.; Macdonald, R.W.; Vingarzan, R.; Mitchell, R.H.; Goyette, D.; Sylvestre, S. PAHs in the Fraser River basin: A critical appraisal of PAH ratios as indicators of PAH source and composition. Org. Geochem. 2002, 33, 489–515. [Google Scholar] [CrossRef]
  28. Zhang, X.L.; Tao, S.; Liu, W.X.; Yang, Y.; Zuo, Q.; Liu, S.Z. Source Diagnostics of Polycyclic Aromatic Hydrocarbons Based on Species Ratios: A Multimedia Approach. Environ. Sci. Technol. 2005, 39, 9109–9114. [Google Scholar] [CrossRef] [PubMed]
  29. Tobiszewski, M.; Namieśnik, J. PAH diagnostic ratios for the identification of pollution emission sources. Environ. Pollut. 2012, 162, 110–119. [Google Scholar] [CrossRef]
  30. Jiang, Y.; Hu, X.; Yves, U.J.; Zhan, H.; Wu, Y. Status, source and health risk assessment of polycyclic aromatic hydrocarbons in street dust of an industrial city, NW China. Ecotoxicol. Environ. Saf. 2014, 106, 11–18. [Google Scholar] [CrossRef]
  31. Liu, J.; Man, R.; Ma, S.; Li, J.; Wu, Q.; Peng, J. Atmospheric levels and health risk of polycyclic aromatic hydrocarbons (PAHs) bound to PM2.5 in Guangzhou, China. Mar. Pollut. Bull. 2015, 100, 134–143. [Google Scholar] [CrossRef]
  32. Ambade, B.; Kurwadkar, S.; Sankar, T.K.; Kumar, A. Emission reduction of black carbon and polycyclic aromatic hydrocarbons during COVID-19 pandemic lockdown. Air Qual. Atmos. Health 2021, 14, 1081–1095. [Google Scholar] [CrossRef]
Figure 1. Location of the sampling sites. Suburban site: 32°47′07.9″ N, 129°51′52.6″ E; Forest site: 32°54′32.4″ N, 129°44′33.5″ E.
Applsci 12 10963 g001
Figure 2. Frequency of residence of back trajectories in a grid cell in winter calculated by HYSPLIT Model of the National Oceanic and Atmospheric Administration, USA. The analysis period was set from 30 December–3 February in each year.
Applsci 12 10963 g002
Figure 3. Frequency of residence of back trajectories in a grid cell in spring calculated by HYSPLIT Model of the National Oceanic and Atmospheric Administration, USA. The analysis period was set from 29 March to 3 May in each year.
Applsci 12 10963 g003
Figure 4. Frequency of residence of back trajectories in a grid cell in summer calculated by HYSPLIT Model of the National Oceanic and Atmospheric Administration, USA. The analysis period was set from 29 June to 3 August in each year.
Applsci 12 10963 g004
Figure 5. Frequency of residence of back trajectories in a grid cell in autumn calculated by HYSPLIT Model of the National Oceanic and Atmospheric Administration, USA. The analysis period was set from 29 September to 3 November in each year.
Applsci 12 10963 g005
Figure 6. Total PAH concentrations (ΣPAHs) in the suburban and forest sites of Nagasaki from 2017 to 2021. The gray areas indicate winter data.
Applsci 12 10963 g006
Figure 7. Behaviors in the annual average of total PAH concentrations in the suburban and forest sites of Nagasaki from 2017 to 2021. The error bars indicate the magnitude of the standard error.
Applsci 12 10963 g007
Figure 8. Behaviors in seasonal averages of total PAH concentrations in the suburban and forest sites of Nagasaki each year from 2017 to 2021: (a) winter; (b) spring; (c) summer; (d) autumn.
Applsci 12 10963 g008
Figure 9. Behaviors in composition of PAHs by ring number: (a) suburban site; (b) forest site.
Applsci 12 10963 g009
Figure 10. Behaviors in the diagnostic ratio of the forest site using all data of each year. The bar graphs represent the median values.
Applsci 12 10963 g010
Figure 11. Behaviors in the diagnostic ratio of the forest site using winter data of each year.
Applsci 12 10963 g011
Publisher’s Note: MDPI stays neutral with regard to jurisdictional claims in published maps and institutional affiliations.

