Article

Emotional Stress Recognition Using Electroencephalogram Signals Based on a Three-Dimensional Convolutional Gated Self-Attention Deep Neural Network

1
Department of Electronic Convergence Engineering, Kwangwoon University, 20 Gwangun-ro, Nowon-gu, Seoul 01897, Korea
2
Department of ICT Convergence System Engineering, Chonnam National University, 77 Yongbong-ro, Buk-gu, Gwangju 61186, Korea
*
Authors to whom correspondence should be addressed.
Submission received: 27 September 2022 / Revised: 21 October 2022 / Accepted: 1 November 2022 / Published: 4 November 2022
(This article belongs to the Special Issue Deep Learning for Electroencephalography(EEG) Data Analysis)

Abstract

:
The brain is more sensitive to stress than other organs and can develop many diseases under excessive stress. In this study, we developed a method to improve the accuracy of emotional stress recognition using multi-channel electroencephalogram (EEG) signals. The method combines a three-dimensional (3D) convolutional neural network with an attention mechanism to build a 3D convolutional gated self-attention neural network. Initially, the EEG signal is decomposed into four frequency bands, and a 3D convolutional block is applied to each frequency band to obtain EEG spatiotemporal information. Subsequently, long-range dependencies and global information are learned by capturing prominent information from each frequency band via a gated self-attention mechanism block. Using frequency band mapping, complementary features are learned by connecting vectors from different frequency bands, which is reflected in the final attentional representation for stress recognition. Experiments conducted on three benchmark datasets for assessing the performance of emotional stress recognition indicate that the proposed method outperforms other conventional methods. The performance analysis of proposed methods confirms that EEG pattern analysis can be used for studying human brain activity and can accurately distinguish the state of stress.

1. Introduction

Stress refers to challenging stimuli that can cause mental, physical, and emotional tension in individuals. Although moderate stress can improve physical and mental vitality, accumulated unresolved chronic stress can adversely affect health, leading to problems such as insomnia, stroke, cardiovascular diseases, cognitive problems, and depression [1]. Therefore, it is essential to detect mental stress before it becomes chronic. To this end, various methods have been developed to evaluate early levels of stress.
The most common method for evaluating stress involves answering subjective self-report questionnaires, such as cognitive stress scales. However, this method is time-consuming and may yield inaccurate results depending on the user’s understanding of the questionnaire. Stress can be estimated by quantifying hormones [2,3] extracted from blood or urine, but these methods are expensive and do not determine the stress state in real time. Recently, methods that estimate the stress state instantaneously from bio-signal information have attracted attention. Bio-signal information can be extracted from electromyography [4], electrocardiogram [4], electrodermal activity [5], electroencephalography (EEG) [6], blood pressure [7], pupil size [8], and autonomous nervous system respiration [9] measurements. Among these, signals involving the brain are more sensitive to stress. In addition, multi-channel EEG signals are widely used in the field of emotional stress recognition, particularly for pain recognition, because they provide high spatial and temporal resolution for brain signal activity.
Several recent studies have used machine learning and deep learning algorithms on EEG data to detect and recognize stress. Liao et al. [10] proposed an emotional stress detection method using EEG signals and deep learning technologies to predict a subject’s stress while listening to music. Jebelli et al. [11] developed a framework for recognizing the stress of construction workers by applying two deep neural network (DNN) structures, namely convolutional DNN and fully connected DNN to EEG. Baumgartl et al. [12] performed a two-level classification of chronic stress by replacing 5 standard EEG bands with 99 fine-band spectra, and applying them to the random forest algorithm. Subhani et al. [13] identified stress levels using a multi-level machine learning framework. First, each of four stress levels was compared to an initial control level; then, every stress level was compared to each control level; finally, each stress level was compared to all other stress levels.
Psychological studies have reported that negative emotions, such as anger and disgust, generate long-lasting stress hormones, whereas positive emotions, including joy and immersion, generate beneficial hormones. Therefore, reducing negative emotions is fundamental to neutralizing stress. Research on recognizing emotions using EEG has been conducted, and recently, deep neural networks combined with attention mechanisms have been widely used for EEG-based emotion recognition, producing remarkable results. Chen et al. [14] presented an attention-based hierarchical bidirectional gated recursive unit (BGRU) model, focusing on significant features of important samples and epochs corresponding to emotion classes, in order to learn prominent contextual representations of EEG sequences. Wang et al. [15] introduced a method for recognizing emotions by hierarchically learning discriminative spatial information from the electrode level to the brain area level using a transformer-based model [16]. In particular, Li et al. [17] proposed a method to improve emotion-specific classification performance by applying a convolutional self-attention neural network to the intra-frequency bands of multi-channel EEG signals to capture the emotional response at each electrode position, and integrating spatial and frequency domain information through inter-frequency band mapping.
This study focused on improving stress prediction performance by applying a three-dimensional (3D) convolutional gated self-attention deep neural network (3DCGSA) to the spatiotemporal frequency distribution of emotional multi-channel EEG signals evoked by audiovisual stimuli. This study makes the following primary contributions:
  • A 3D convolutional self-attention DNN is developed that integrates features learned from the spatiotemporal and frequency domains of multi-channel EEG signals to significantly improve emotional stress recognition performance.
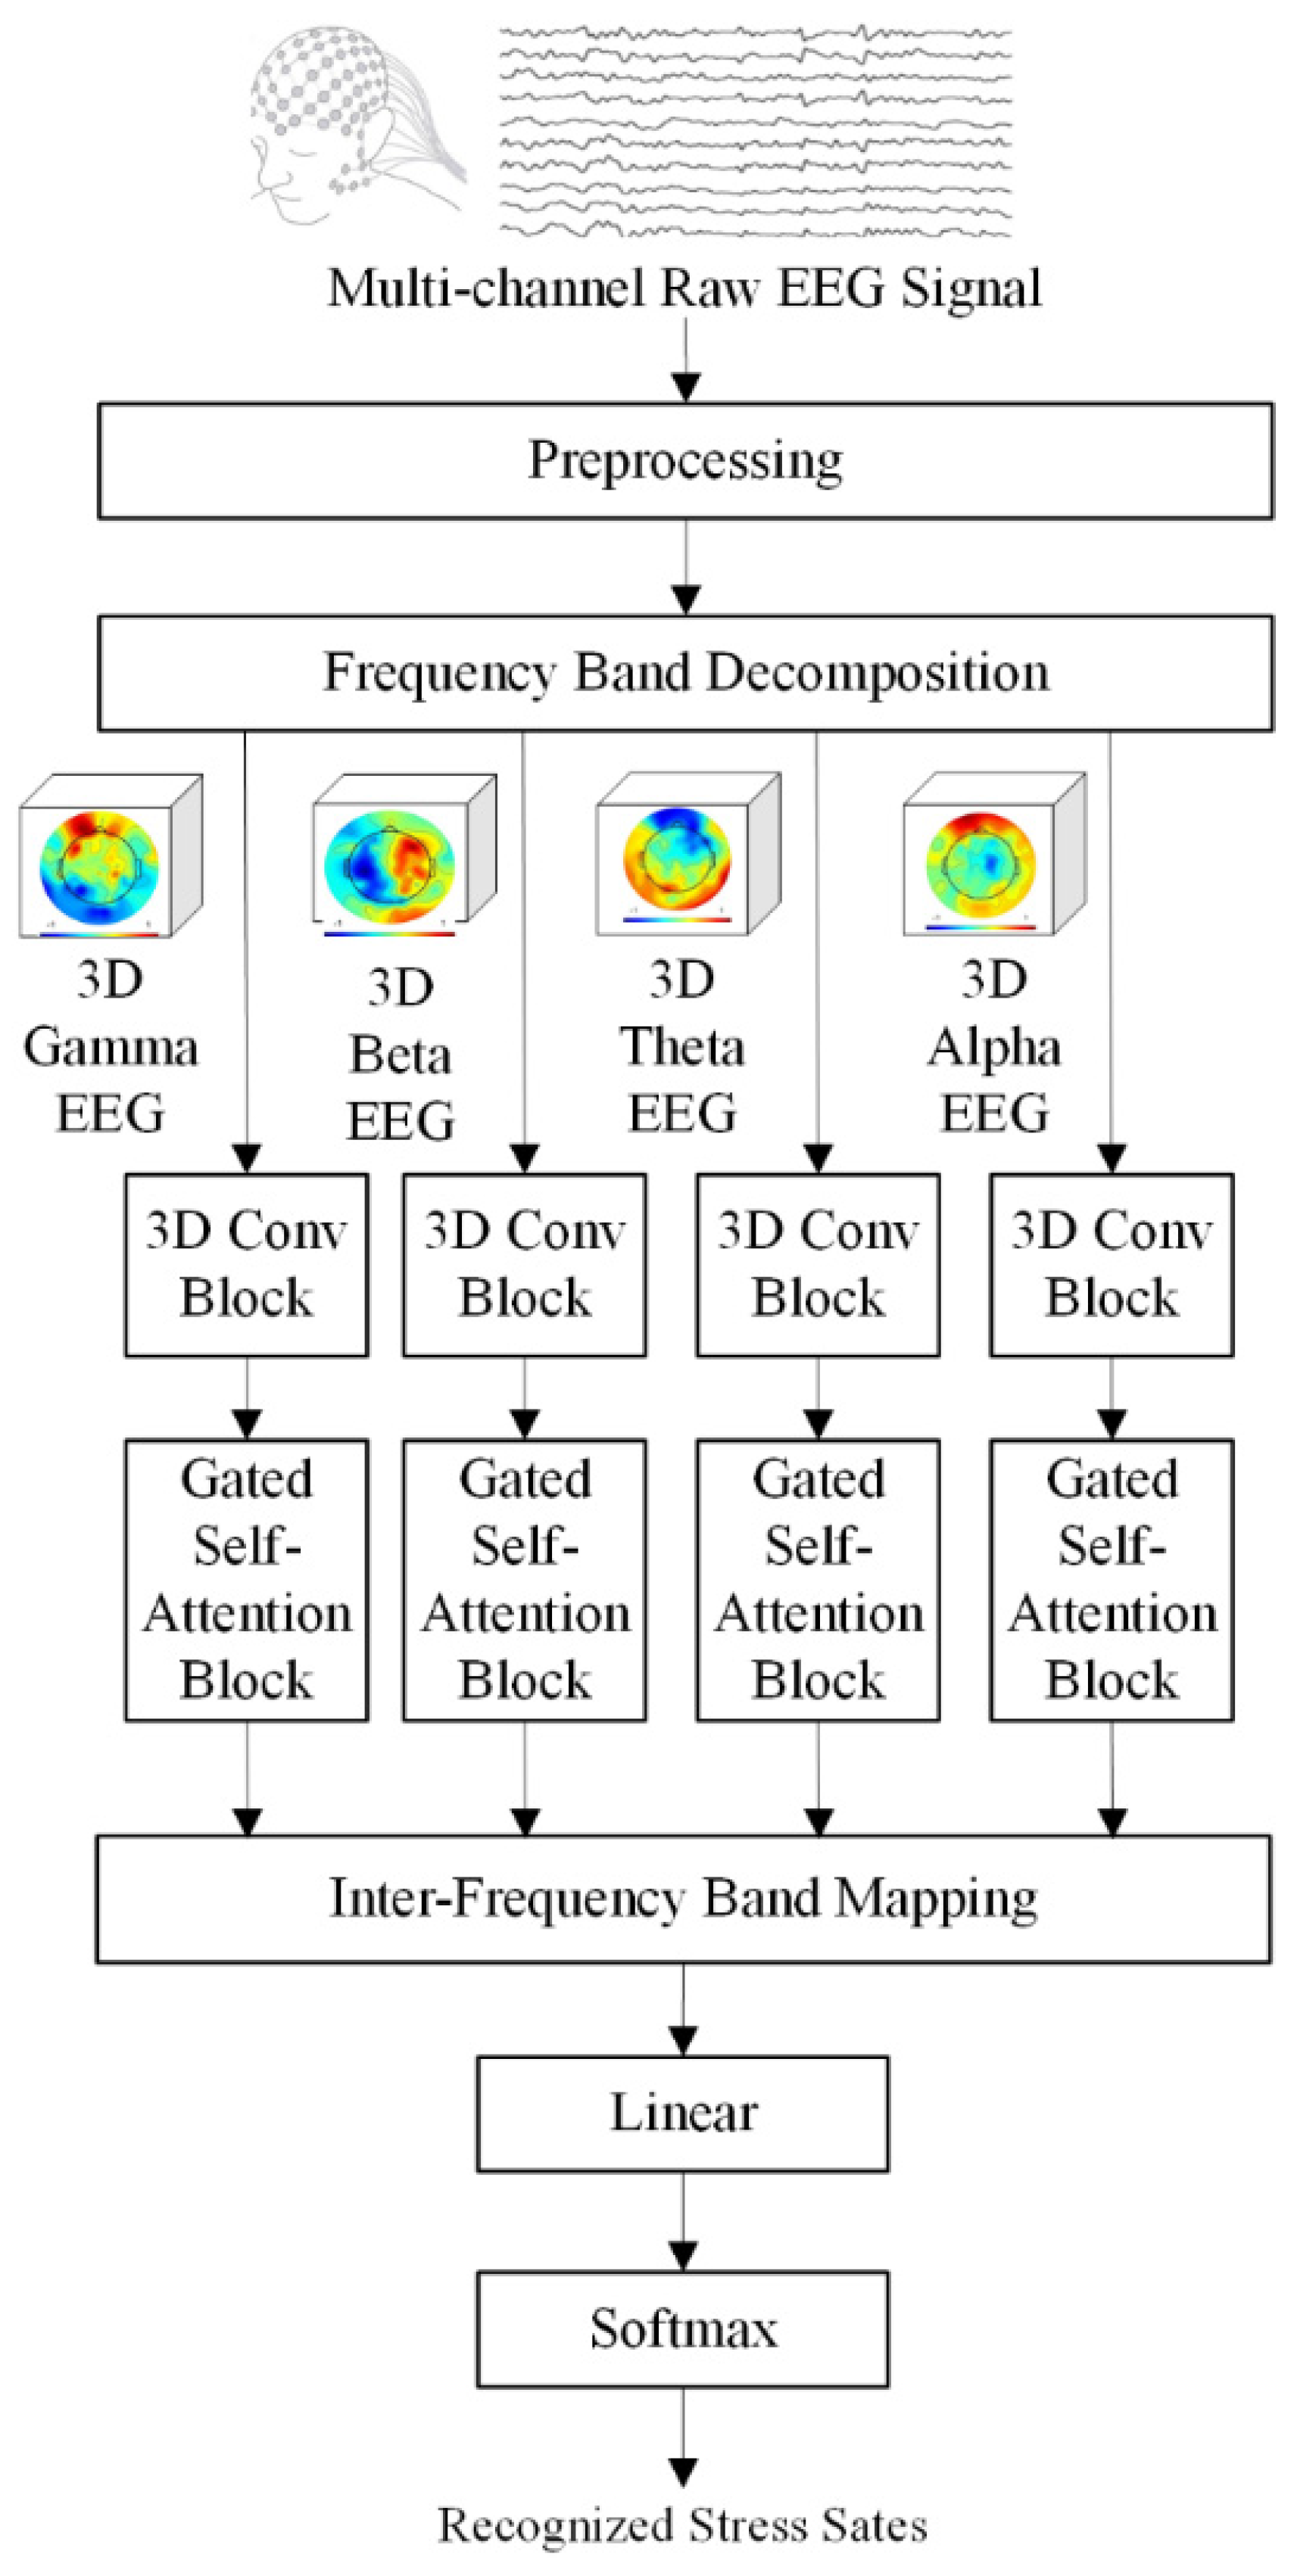
  • The proposed 3D convolutional self-attention neural network is comprised of a 3D convolutional block (3DConvB) and a gated self-attention block. 3DConvB is applied to each frequency band individually, rather than to the entire frequency bands, to capture internal variation in the spatiotemporal relationship between electrodes within each frequency band. Additionally, nonlocal operations are performed using a gated self-attention block to reliably extract both long-distance dependencies and global information.
  • We combine the inter-electrode correlation information according to the emotional stress response extracted from each frequency band of the EEG signal using inter-frequency mapping. This allows us to additionally learn complementary and interconnected information between frequency bands, as well as to model the internal dependencies between salient EEG features related to emotional stress.
The rest of this paper is organized as follows: Section 2 presents the details of the proposed method. Section 3 introduces the experimental data and results, and Section 4 summarizes the conclusions of the study and future research directions.

2. Proposed Methods

Since brain waves vibrate in highly complex patterns, power spectrum analysis, which classifies waves according to their frequency, is commonly used to observe brain waves. To improve stress recognition rate, it is necessary to divide the signal into frequency bands, extract feature information from each band, and connect it to entire frequency bands to generate more accurate synthetic features.
Figure 1 illustrates the process flow of the proposed emotional stress recognition system with multi-channel EEG signals. As shown in the figure, the input multi-channel EEG signal is decomposed into four frequency bands after preprocessing. For each frequency band, the EEG signal is converted into a 3D cuboid representation containing the EEG variation topography according to spectral powers at multi-electrode positions. Herein, correlations between different EEG channels, activated according to the time in each frequency domain, are preserved. After applying 3DConvB to each frequency band to extract EEG features with local spatiotemporal information from the 3D cuboid representation, a gated self-attention block is used to capture spatial information with salient emotional stress responses and learn their long-term dependencies and global information. Subsequently, the final attention feature information obtained through inter-frequency band mapping is input to a linear layer. Then, the probabilities for two state classes, namely states of being calm and stressed, are calculated using the softmax function before recognizing whether the subject is stressed or not.

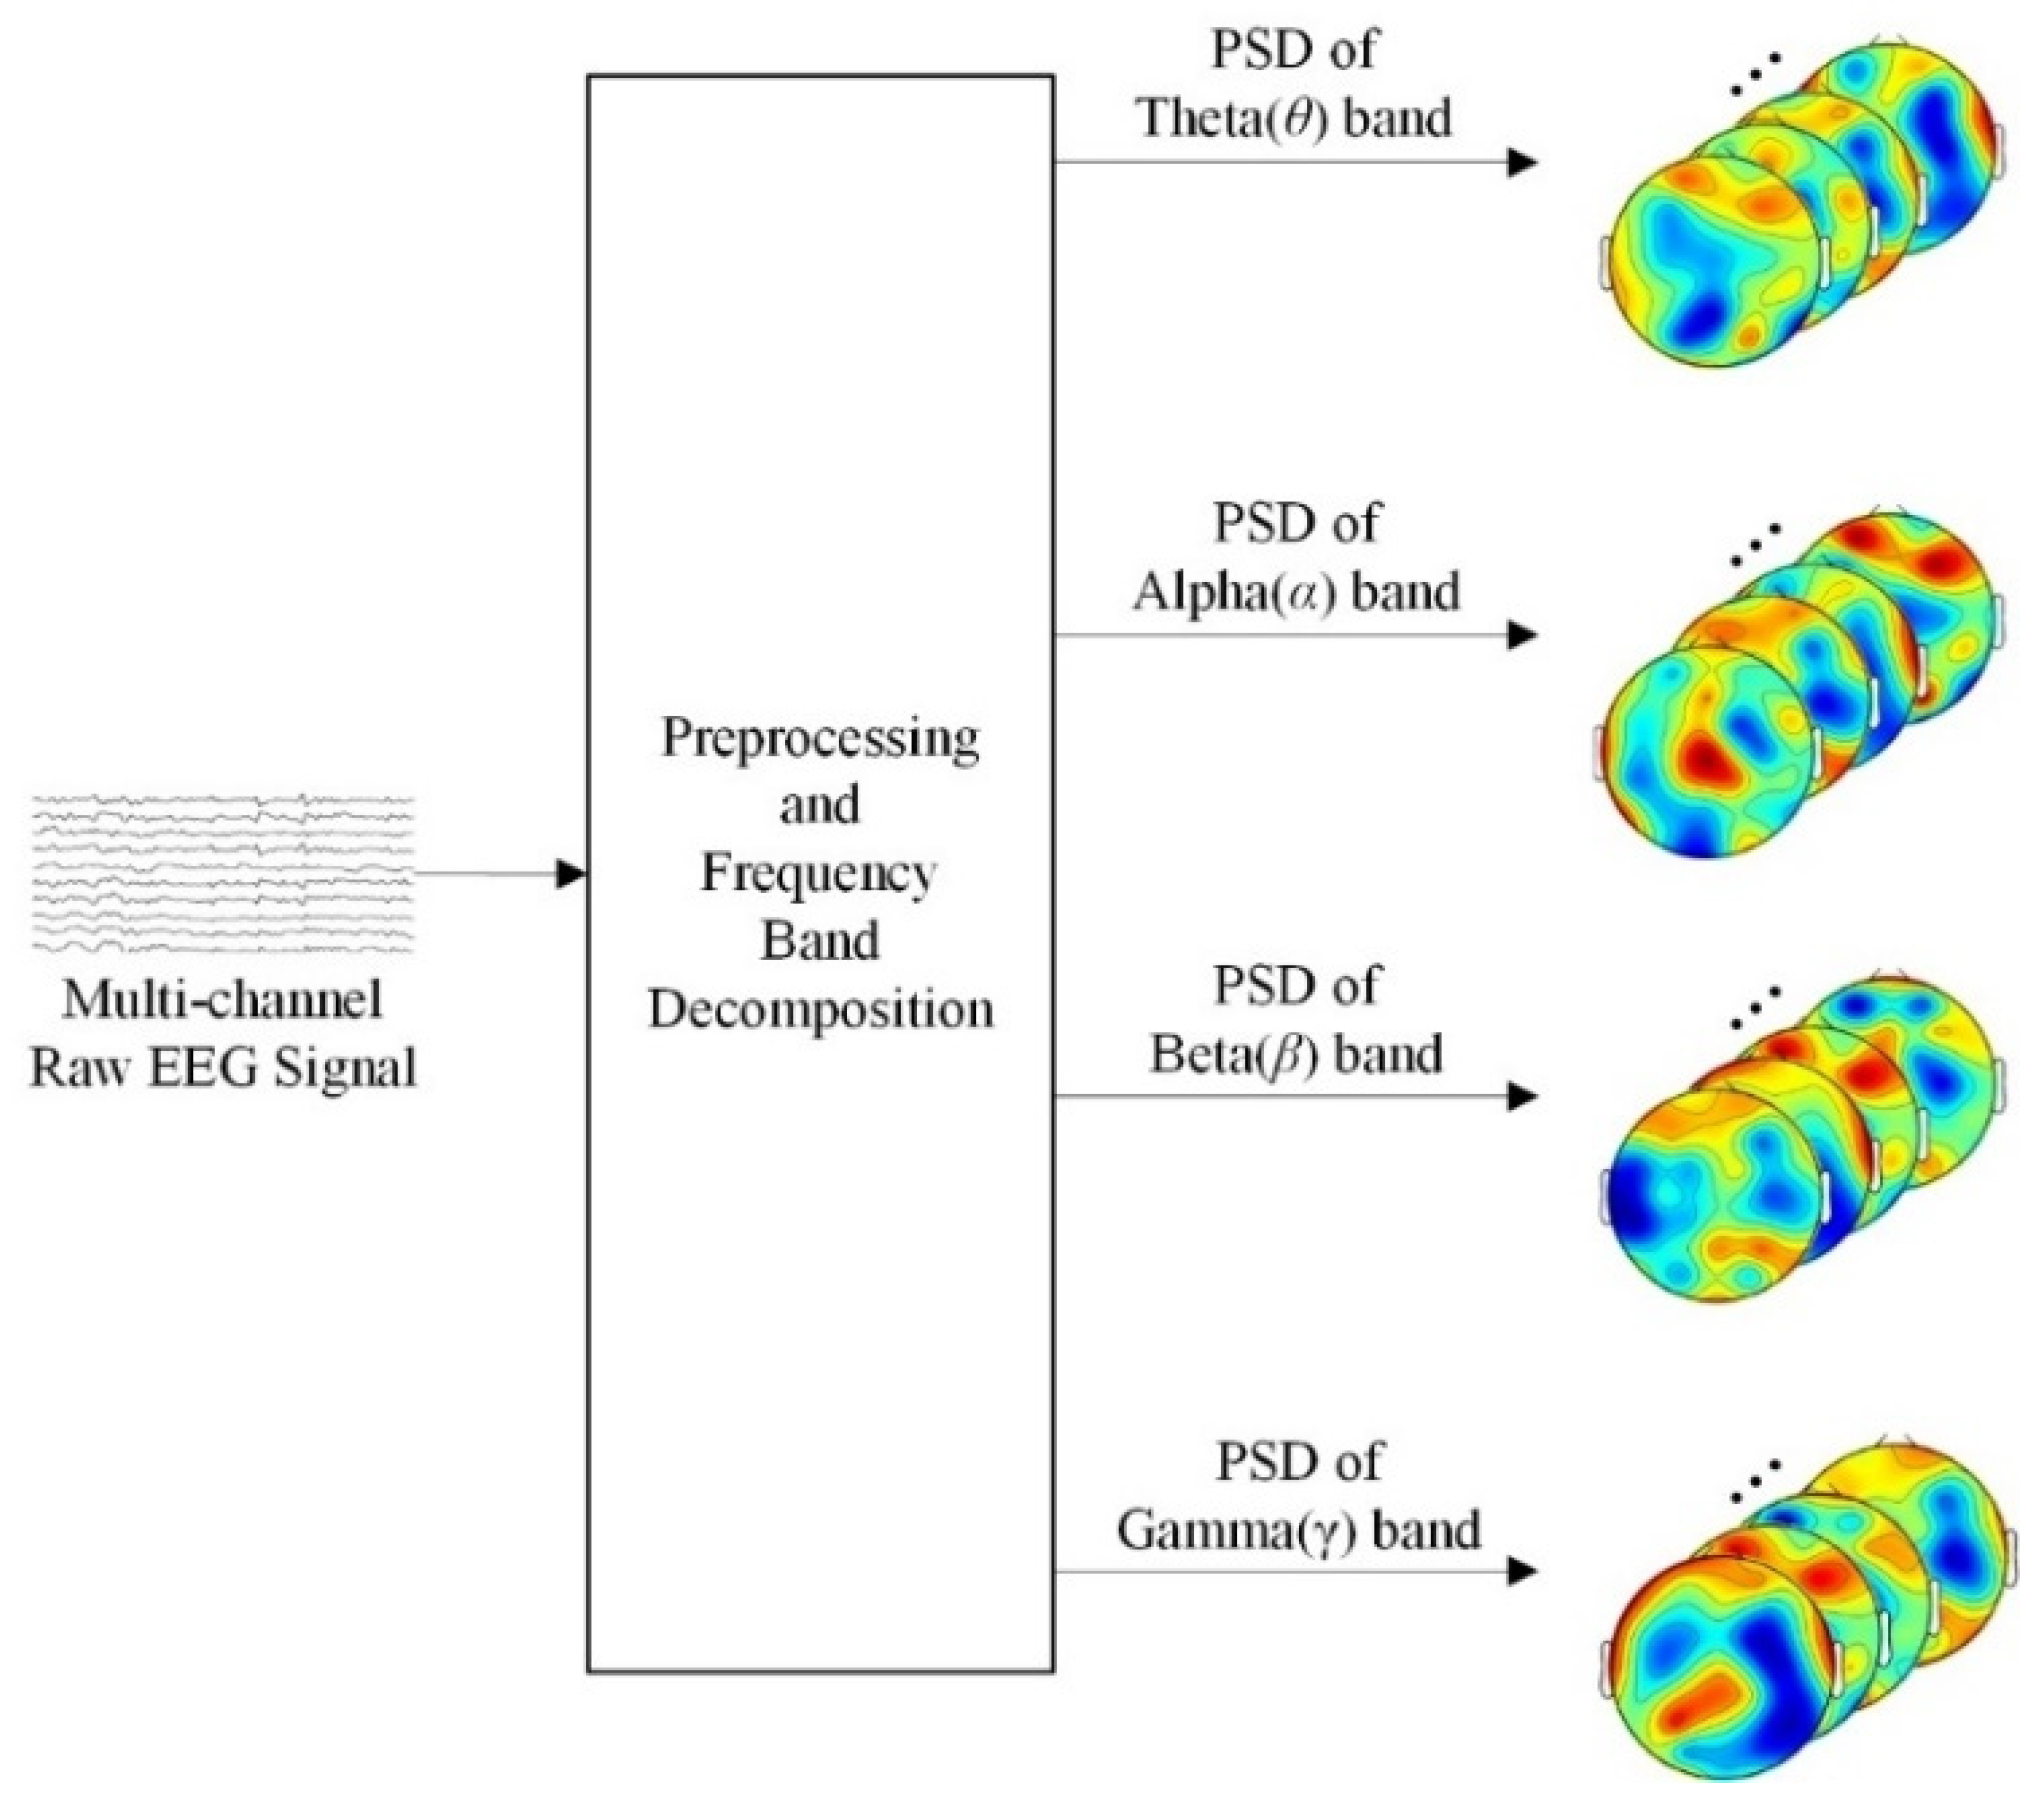
2.1. Preprocessing and Frequency Band Decomposition

EEG signals, which reflect the stress caused by audiovisual stimulation, are recorded using noninvasive multichannel electrodes, preprocessed, and analyzed spectrally. An EEG signal is a fine electrical signal tens to hundreds of microvolts (µV) in magnitude and includes various noise components along with signals generated in the actual brain. As shown in Figure 2, preprocessing consists of four steps and is used to remove noise from EEG signals to facilitate subsequent sentiment analysis. During preprocessing, high- and low-frequency noises are first removed by applying a 4 to 47 Hz bandpass filter to the EEG data. The EEG data is then downsampled to 200 Hz, and ocular artifacts are removed using deep learning-based stacked sparse autoencoder [18]. Subsequently, the spatial difference of the original signal is improved, and temporal information is maintained through the spatial filter [19] to which the eigen decomposition is applied.
EEG signals have the potential to reveal human neurological change processes because they indirectly measure the electrical activities of nerve cells that make up the brain via electrodes installed in the scalp. These neurological change processes are reflected in different EEG signal frequency bands. For this reason, the preprocessed EEG signals are decomposed into four types, namely θ (4 to 7 Hz), α (8 to 12 Hz), β (13 to 30 Hz), and γ (31 to 50 Hz) [20], depending on the specific frequency and amplitude of the power spectrum acquired by the short-time Fourier transform. The delta (δ) band with a frequency range below 4 Hz was excluded in this study because this brainwave is commonly associated with the deep sleep state and is not expected to be highly active under stressful conditions [21]. Additionally, the gamma (γ) band was limited to 50 Hz because the stress state analysis was performed over a frequency domain (0 Hz to 50 Hz) having a relative power of EEG [6]. The power distribution within each frequency band in individual channels is averaged to calculate the dynamic power spectral density (PSD). In a single trial, the EEG signal in each frequency band is divided into a three-second nonoverlapping Hanning window, and the PSD characteristics of the k-electrode are extracted from each clip to produce a 4 k-dimensional characteristic vector in all four frequency bands. To effectively extract the stress features corresponding to audio-visual stimuli in each frequency band, the entire multi-channel EEG signal is restructured into a 3D cuboid representing the topographical distribution according to the PSD variation of EEG electrodes, as shown in Figure 3. In this 3D cuboid representation, all PSD relationships between channels, according to the total trials in each decomposed frequency band, are preserved.
To extract and learn salient features in the stress response from EEG signals, the 3D representation of each acquired frequency band is input into a 3D gated self-attention DNN comprising a 3DConvB and a gated self-attention block. Figure 4 depicts the detailed architecture of the 3D gated self-attention deep neural network.

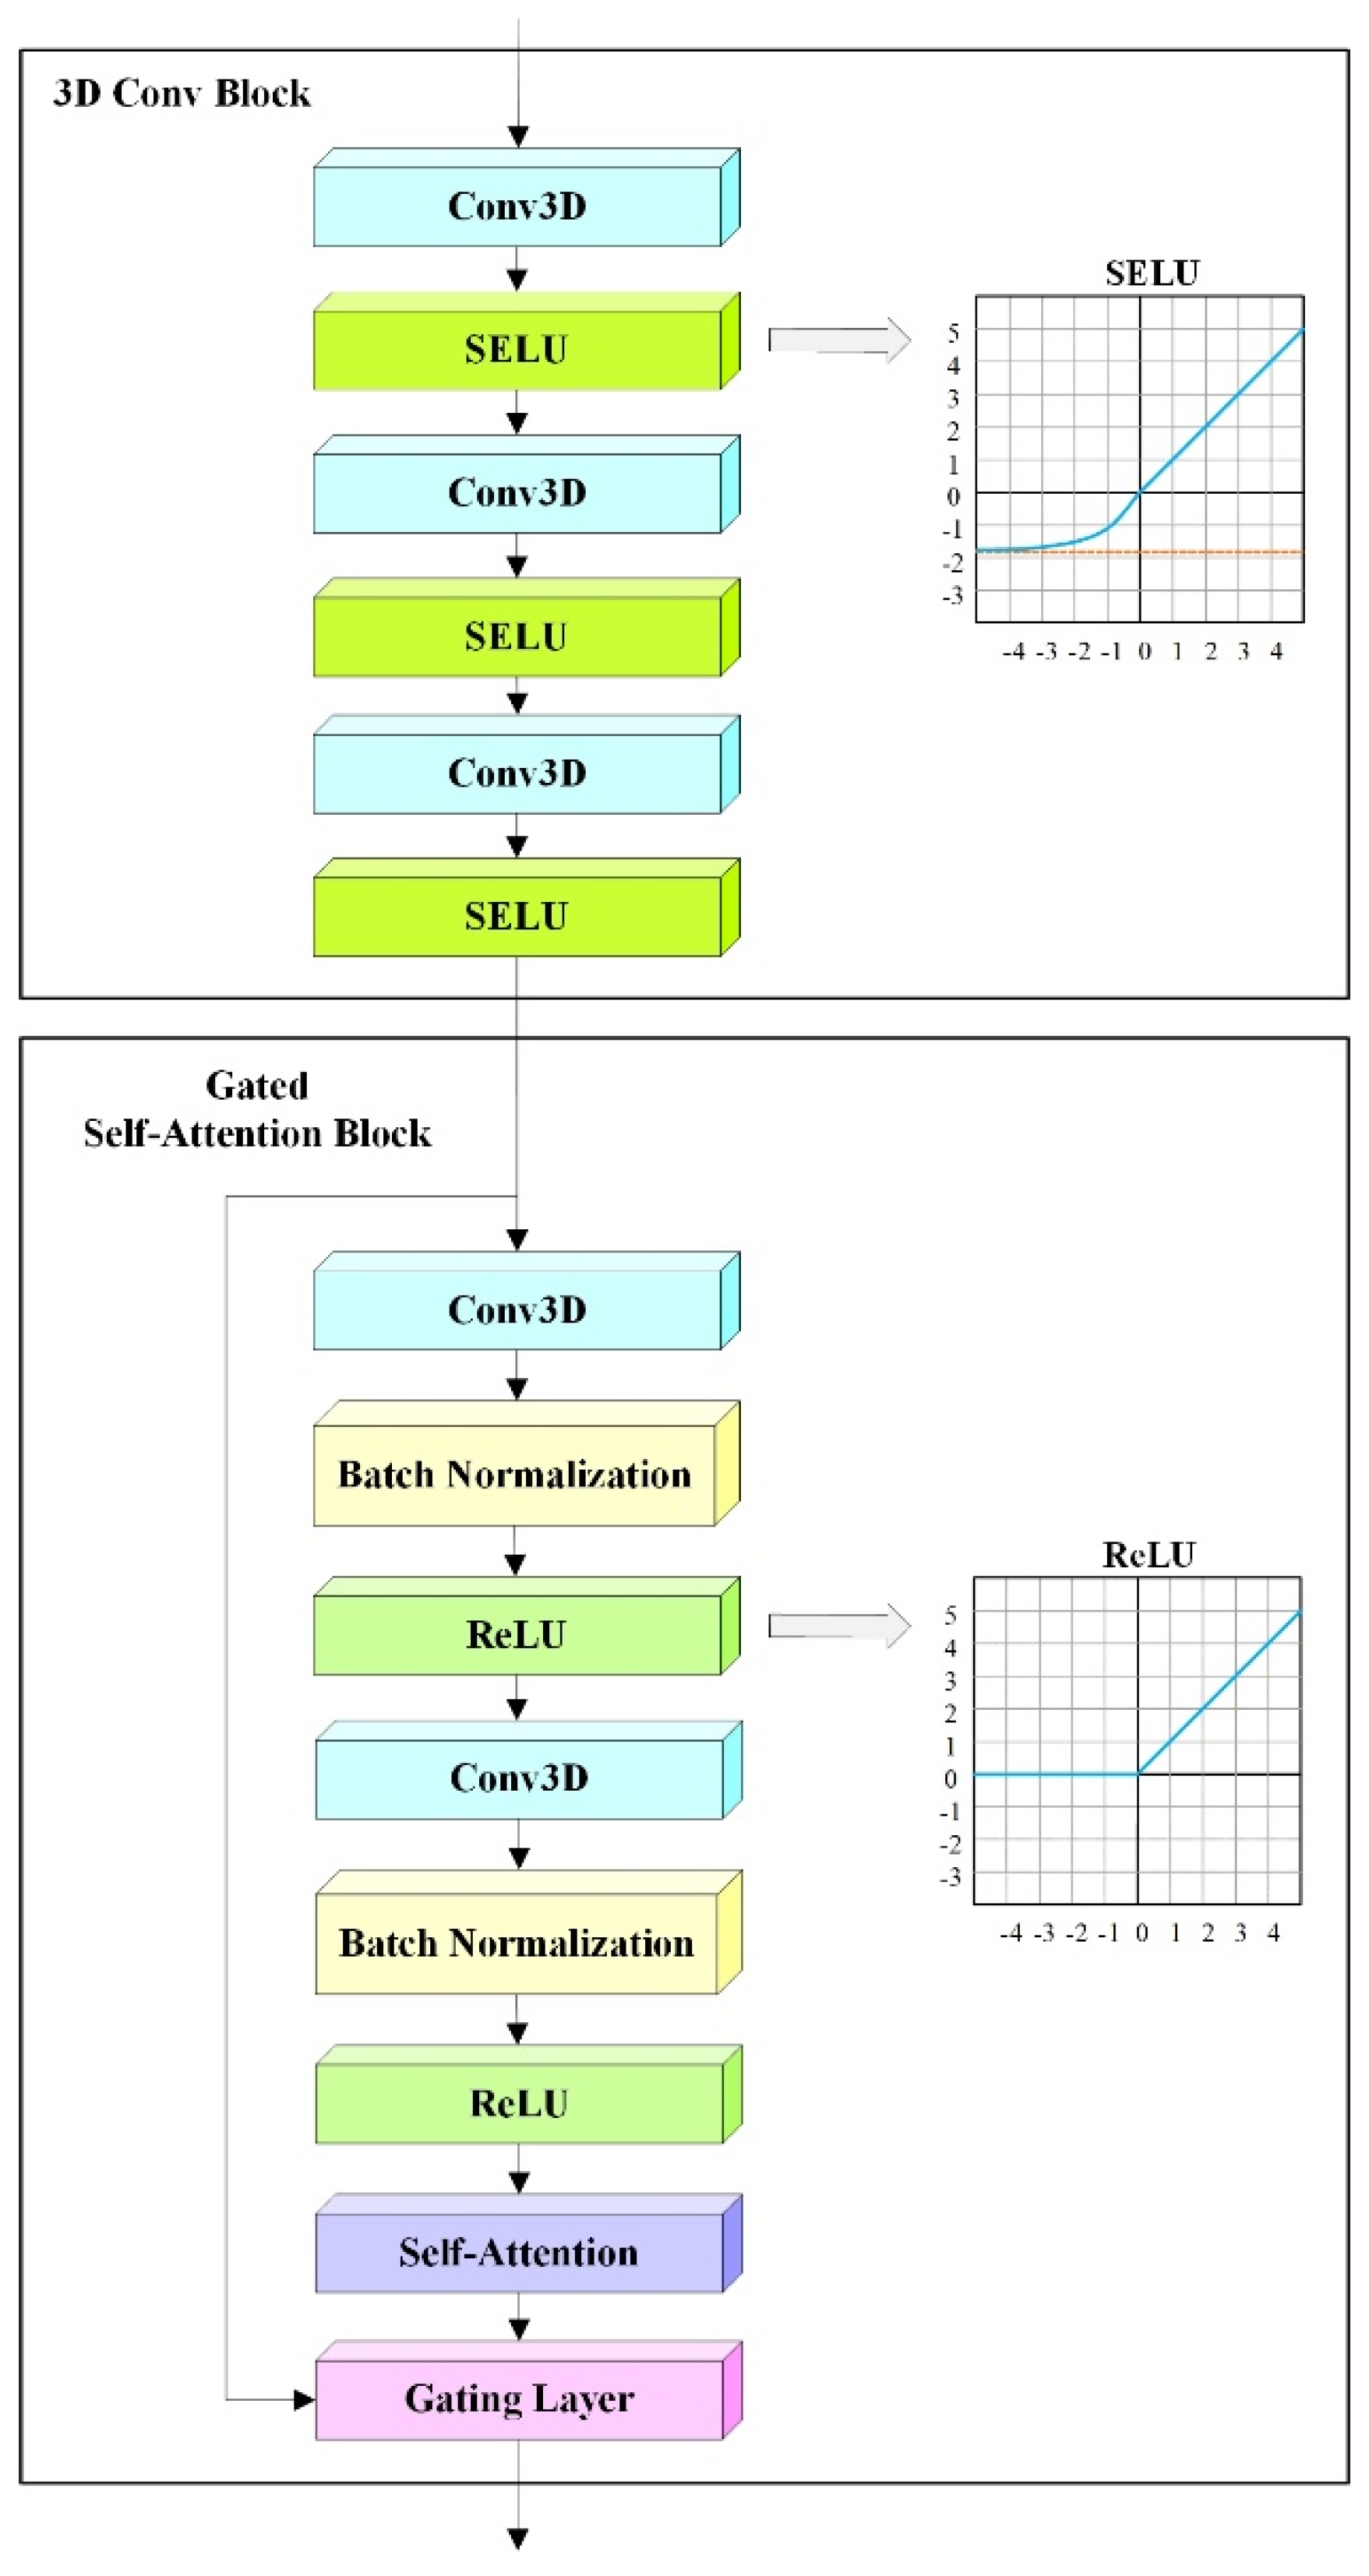
2.2. 3D Convolutional Neural Network for Spatiotemporal Encoding

Typically, two-dimensional (2D) CNNs use 2D convolution blocks to process static images [22]. Similarly, the 3D convolution (Conv3D) block applies 3D filters to 3D EEG cuboid representations of each frequency band, and these filters move in the x, y, and z directions to compute low-level feature representations of output shapes as 3D volume spaces. The 3DConv block directly extracts spatiotemporal relationships among the multi-channel EEG feature sequences from a 3D cuboid representation (Cb), comprising PSD (Xb) in each specific frequency band, where b θ ,   α ,   β ,   γ denotes one of the four frequency bands. In other words, 3DConvB can encode 3D spatiotemporal information for all multi-channel electrodes in each frequency band b as F b = 3 DConvB C b to reflect spatiotemporal electrode variations in different brain regions, while considering the strong correlations between different electrodes. Here, F b R p × d b , where p is the number of convolutional channels, and d b represents the dimension of the EEG feature vector in the frequency band b, which matches the number of electrodes.
The proposed method includes a 3DConv block with three Conv3D layers and three scaled exponential linear units (SELUs) [23] for EEG-based stress recognition. Each Conv3D layer comprises a Conv3D filter with a kernel size of 3 × 3 × 3, which exhibits significant potential to detect stress features in spatiotemporal information. The first layer includes 64 kernels, and the number of kernels is doubled in the subsequent layer. After the convolution operation, the SELU function is used as the activation function instead of the rectified linear unit (ReLU) function. When ReLU is applied to the hidden layer, if the value of the neuron is 0 or negative, the neuron does not fire; thus, only a few neurons are activated. This results in a dying ReLU problem, because these neuron weights and biases are not updated during backpropagation. By contrast, SELU induces self-normalization properties like variance stabilization to avoid exploding and vanishing gradients, resulting in better performance than that achieved by applying ReLU [24]. In Figure 4, the shapes of SELU and ReLU functions are compared.

2.3. Gated Self-Attention Block

After detecting local spatiotemporal patterns from 3D EEG cuboid representations of each frequency band using the 3D Conv block, a gated self-attention block is applied to obtain salient EEG features related to stress response and to capture both long-range dependencies and global information using nonlocal operations. Typically, the attention mechanism [25] is used for identifying important patterns in the input using a weight matrix. Long short-term memory (LSTM) and GRU have been used, but recently, they are being replaced by transformers.
In deep learning, the self-attention mechanism is a key component of the transformer that can be applied to an entire sequence. This helps generate better sequence representations by learning task-specific relationships between different elements of a specific sequence. The self-attention module computes attention weights by generating three linear projections (Key, Value, and Query) of an input sequence, and mapping those weights to the input sequence [26]. Key and Value are the characteristics of the 3D representation extracted from each convolution block, whereas Query determines the value to be focused on during the learning process. In this study, Key, Query, and Value are converted into vectors using a 1 × 1 × 1 convolution filter and are expressed as k(x), q(x), and v(x), respectively.
K e y :           k x = W k x ,  
Q u e r y :     q x = W q x ,  
V a l u e :     v x = W v x ,  
where x R U × N denotes the feature of the previous layer, U indicates the number of channels, and N represents the number of feature positions in the previous layer; Wk, Wq, and Wv denote the 1 × 1 × 1 convolution filters.
Based on the similarity between Key and Query, the self-attention map ai,j representing the attention weight is calculated as
a i , j = exp ( k ( x i ) T q x j ) i = 1 n exp ( k ( x i ) T q x j ) ,  
where ai,j denotes the weight of the week representing the relative interest between each domain i and all other domains, j indicates the index of the output position, and c c 1 ,   c 2 , ,   c j R U × N represents the output of the attention layer, computed as:
c j = W c ( i = 1 N a i , j v x i ) ,
In Equation (5), a 1 × 1 × 1 convolution filter (Wc) is used to keep the number of channels identical to that of the original input and ensure memory efficiency, thereby reducing the number of channels in the final output. However, this attention mechanism suppresses unnecessary information to learn and focus on important areas from the entire 3D representation, which results in total information loss. To address this problem, a residual connection is added. Typically, residual connections solve the gradient decay/explosion problem by easing the propagation of the gradient as the network becomes deeper.
The residual network [27] is built out of modules called residual blocks, which can be formulated as
y = F b + R F b ,
where y denotes the output of the residual module, Fb indicates the input, and R(Fb) represents the output obtained by applying residual concatenation to the input sequence Fb. This module is comprised of two 3DConvBs with a 3 × 3 × 3 Conv3D layer, 3D batch normalization, and ReLU.
At the end of this original residual module, a self-attention layer is introduced to ensure that global information can be efficiently captured without being limited to local residual learning. Accordingly, the output of the residual attention (RA) block can be expressed as
y = F b + R F b + γ A R F b ,
where A(R(Fb)) indicates the output of the self-attention map, and γ denotes a learnable parameter. By default, γ is set to 0 to ensure that the network can only rely on signals from local neighbors. As γ increases, the model effectively learns the context between signals by giving increasingly greater weight to global information than to local information.
As a more advanced structure, we apply GRU [28] instead of the additive operations used in existing residual connections to reliably learn the long-term dependencies of important global and local information.
y = G R U F b , A R F b
The internal structure of the GRU model is shown in Figure 5. In general, GRU is designed to dynamically memorize and forget information flows using reset (r) and update (z) gates, respectively, to solve the gradient problem that disappears into a structure better than that of an LSTM neural network [29].
In the proposed model, the lth gating layer G l ( F b , A R F b ) is calculated using GRU as follows:
r = σ W r l A R F b + L r l F b ,
z = σ W z l A R F b + L z l F b + b z l ,
h ^ = tanh W h l A R F b + L h l r F b ,
G l F b , A R F b = z h ^ + 1 z F b ,
where σ(.) denotes the element-wise sigmoid function; W, L, and b indicate the learnable weights and biases, defined as r, z, and h, respectively; h ^ R d ; and d represents the size of the hidden dimension.

2.4. Inter-Frequency Band Mapping

General machine learning principles prescribe that the recognition unit should be modeled to recognize an object, after which the search step uses the model to identify the connection information of the recognition units to identify the best object. However, in this case, the recognition unit cannot be expressed effectively regardless of modeling efficiency. Therefore, mapping was introduced to correlate objects and add details that could not be handled by modeling alone. An advantage of mapping is that it can rearrange a series of objects to express the phenomena created by the relationship between objects. Inter-frequency band mapping is used to calculate EEG feature sequences in multiple-frequency bands, which generates more effective attention representations because the complementary and interconnective information is learned from other EEG feature representation subspaces, unlike intra-frequency attention mechanisms.
In this study, the EEG signal is split into 4 frequency bands, which are then utilized for inter-frequency band mapping. The model can be trained to extract emotion and stress-related features from each frequency band and improve spatial complementary information through frequency-to-frequency mapping. This configuration makes it easy to detect abnormalities in the overall brain function. Without inter-frequency band mapping, when there is a region in the α band lower than normal, the θ, β, and γ bands should be checked individually to see which wave increases as the α wave in this region decreases. However, combining the EEG features of inter-frequency bands allows us to apply complementary and interconnected internal dependencies between frequency bands. In other words, it can be immediately confirmed that if the θ wave increases in the area where the α wave is reduced, the nerve cell activity in the area decreases, and if the β wave or γ wave increases, the nerve cells in the area are overactive.
The inter-frequency band mapping maps all feature vectors to one-dimensional (1D) vectors using a fully connected layer after flatten and concat operations, as seen below:
O m = c o n c a t b a n d θ , b a n d α , b a n d β , b a n d γ W .
where b a n d b = f l a t t e n G b l , G b l denotes the intra-frequency gating layer output of the current frequency band b, W represents a weight matrix of inter-frequency band mapping, and m indicates the entire frequency range from 4 Hz to 50 Hz, which is the sum of each frequency domain corresponding to θ, α, β, and γ. The flatten operation converts a multidimensional input into a 1D vector, and the vector concatenation between different frequency bands is made by the concat operation.

3. Experiment and Results

In this section, we discuss the performance of the proposed stress recognition method using 3DCGSA. In this study, experiments are performed in a subject-dependent manner, where the stress state model is trained for each subject and the stress state is classified. The accuracy for each subject is then calculated using 10-fold cross-validation, and the final classification accuracy for one stress dimension is the average of all subjects’ classification accuracies. The 10-fold cross-validation evaluation means that 90% of the EEG data were randomly selected for training. The remaining 10% were used for testing, and this process was iterated ten times. Ten sets of results were finally averaged. The initial value of the learning rate was 0.0001, and it was dynamically adjusted according to the performance of the training set. This experiment performed 50 iterations with a batch size of 128. Furthermore, extensive experiments were conducted on three benchmark datasets to validate the superiority of the proposed 3DCGSA.

3.1. Evaluation Datasets

The performance of the proposed stress recognition method was evaluated using three datasets obtained from EEG signals generated by audio-visual stimuli.
  • The database for emotion analysis using physiological signals (DEAP) [30] is a publicly available dataset for emotional classification. It comprises multiple physiological signals collected from 32 participants, aged between 19 and 37 years, who watched 40 music videos for 60 s each. Among the different signals, there were EEG signals collected at a sample rate of 512 Hz from participants using 32 channels/electrodes, which were positioned according to the international 10–20 system. The collected EEG signals were downsampled to 128 Hz; electrooculogram (EOG) artefacts and noises were preprocessed; the data were then averaged as a common reference. The self-assessment manikin (SAM) scale, provided by DEAP for measuring the valence and arousal based on Russell’s model for emotional representation, was included for each music video. The valance, arousal, dominance, and preference were scored in 4 dimensions, each ranging from 1 to 10. The emotional state was labeled based on the arousal and valence of the SAM scale. Low arousal and high valence are considered to constitute a state of calm. Conversely, a stress state is when the valence is low and the arousal is high. A total of twenty-four participants from this dataset were screened and their annotated valence and arousal values were applied to (14) and (15) [31] to classify the EEG signals into two state classes, those of calm and stress.
Calm = ( arousal < 4 ) ( 4 < valence < 6 ) ,
Stress = arousal > 5 ( valence < 3 ) .
  • The virtual reality environment (VRE) dataset was obtained from a climbing virtual reality system, comprising periods of stressful climbing over rugged mountain and periods of rest (or calm) between the climbs. The virtual reality system was designed to enable participants to receive and respond to audiovisual feedback through an Oculus Rift, which included EEG caps. Twelve participants, including 6 males and 6 females aged between 20 and 30 years, wore an Oculus Rift with built-in displays and lenses and experienced the VRE, and EEG signals were recorded for 10 min from each participant at a sampling rate of 512 Hz using an EEG cap with 32 channels/electrodes.
  • The EEG dataset for the emotional stress recognition (EDESC) is a dataset containing EEG signals obtained from 20 participants, including 10 males and 10 females aged between 18 and 30 years. The EDESC recorded data at a sampling rate of 256 Hz in two stages, before and after an activity, using a four-channel EEG headband. In the preactivity phase, EEG data were collected for 3 min from participants sitting in a comfortable position in a quiet room with their eyes open. In the postactivity phase, EEG data were collected for 3 min from the participants sitting in the measurement room after they performed the activity. The perceived stress scale (PSS) questionnaire was used to classify the EEG signals as stressed or nonstressed. If the PSS score was 20 or higher, the subject was classified as stressed, whereas the subject was classified as nonstressed if the score was less than 20. The authors who created the database compared the pre- and postactivity phases, and reported that the preactivity phase was more accurate for identifying stress. Therefore, we applied the preactivity phase data to our experiments by dividing them into two classes (stressed and nonstressed) and three classes (stress-free, mild, and stressed).

3.2. Experimental Methods

To evaluate the stress recognition performance of the proposed method, other existing techniques were applied for comparison to 3DCGSA:
  • Support vector machines using entropy features (EF-SVM) [32]: In this method, entropy-based features were extracted from EEG signals decomposed using stationary wavelet transforms to detect mental stress; the obtained signals were then applied to SVMs.
  • Random forest algorithm with fine-grained EEG spectra (RF-FS) [12]: After decomposing the EEG signals into 99 fine sub-bands rather than 5 EEG sub-bands, the PSD was obtained, and it was then applied to the RF algorithm for stress recognition.
  • 2D AlexNet-CNN (2D-AlexNet) [33]: Multi-channel EEG signals were converted into 2D spectral images and applied to AlexNet, which comprised five convolutional layers, three max-pooling layers, three fully connected layers, and two dropout layers involved in recognizing the stress state.
  • Convolutional recurrent neural network (CRNN) [34]: This is a hybrid neural network that combines a CNN and RNN, with the former encoding a high-level representation of an EEG signal and the latter exploring the temporal dynamics of the EEG signal. CRNN was composed of two convolutional layers, one sub-sampling layer, two fully connected recurrent layers, and one output layer.
  • Pre-layer-norm transformer (PLNTF) [28]: To learn the long-term temporal dependence of multi-channel EEG signals, layer-norm was used before applying the multi-head attention mechanism. Subsequently, the residual connection was applied, and the layer-norm, feedforward, and residual connection were sequentially re-performed.
  • Gated transformer (GTR) [28]: A gating mechanism was used to stabilize the training process, using GRU instead of the addition operation in the residual connections of the PLNTF structure.
  • Hierarchical bidirectional gated recurrent unit model with attention (HBGRUA) [14]: HBGRUA comprised two layers, wherein the first layer encoded the local correlation between signal samples of one epoch of the EEG signal and the second layer recognized stress by encoding the temporal correlation between the EEG sequences. The bidirectional GRU and attention mechanism were used at both sample and epoch levels.
  • Spatial frequency convolutional self-attention network (SFCSAN) [17]: In this method, the EEG signal was decomposed into four frequency bands, and a convolutional self-attention network was applied to the time–frequency entropy values obtained from each frequency band. Furthermore, band mapping was performed between frequencies, and the stress states were recognized using the softmax layer.
  • 3D residual attention deep neural network (3DRADNN) [35]: A 3D residual attention neural network was combined with a 3D CNN and a residual attention deep neural network (RADNN). Additionally, RADNN was implemented to improve stress recognition performance and capture local, global, and spatial information.
  • Spatial frequency 3D convolutional neural network (SF3DCNN): In this method, the EEG signal was decomposed into four frequency bands and a 3D convolution block was applied to the time–frequency power spectrum value obtained in each frequency band to extract the stress state spatiotemporal features. Thereafter, band mapping between frequencies was performed, and the stress state was recognized using the softmax layer.
  • Spatial frequency 3D convolutional residual-attention deep neural network (SF3DCRA): This method uses 3D convolutional block and residual-attention block (using additive operations) in each frequency band to capture the spatiotemporal features corresponding to the stress state, and inputs the final attention characteristic information obtained through inter-frequency band mapping into a linear layer. Then, the stress state is recognized through the softmax function.
Except for RF-FS and EF-SVM, all the listed methods involve deep learning; RF-FS and EF-SVM, however, only involve machine learning. HBGRUA, PLNTF, GTR, 3DRADNN, SFCSAN, SF3DCRA, and 3DCGSA combine deep neural networks and attention mechanisms. Among them, PLNTF, GTR, 3DRADNN, SFCSAN, SF3DCRA, and 3DCGSA apply the self-attention method of the transformer. Particularly, the self-attention method was applied throughout the frequency in PLNTF, GTR, and 3DRADNN, whereas it was applied to each frequency band in SFCSAN, SF3DCRA, and 3DCGSA. Both SF3DCNN and SF3DCRA sequentially confirm the role of each part of the proposed 3DCGSA network.
Recognition performance was evaluated based on commonly used standard metrics, including recognition accuracy, F-measure, precision, and recall. These metrics can be defined as
p r e c i s i o n = T P T P + F P
r e c a l l = T P T P + F N
F m e a s u r e = 2 p r e c i s i o n r e c a l l p r e c i s i o n + r e c a l l
where TP, FP, TN, and FN denote the total number of true positives, false positives, true negatives, and false negatives, respectively. Additionally, recognition accuracy was used as an overall measure for classification.
a c c u r a c y = T P + T N T P + T N + F P + F N

3.3. Results

Table 1, Table 2, Table 3 and Table 4 summarize the average EEG emotional stress state recognition performance results of the different methods. The proposed 3DCGSA method achieved the highest recognition rate on all datasets, with accuracies of 96.68% for DEAP, 95.64% for VRE, 91.52% for two-level EDESC, and 90.12% for three-level EDESC. Although the recognition accuracies of SF3DCRA and SFCSAN were lower than that of 3DCGSA, it was superior to the other nine methods. This indicates that the methods applying the attention mechanism to each frequency band, primarily associated with EEG activity, resulted in a more effective recognition performance than the methods applying the attention mechanism to the raw EEG signal. HBGRUA, PLNTF, GTR, and 3DRADNN, which combine deep neural networks and attention mechanisms, exhibited better recognition accuracy than EF-SVM and RF-FS, verifying that attention mechanisms positively and strongly affect deep neural networks. However, although the attention mechanism was reflected in the case of HBGRUA, the recognition accuracy was slightly lower than that of CRNN. RF-FS had the lowest recognition accuracy. In addition to recognition accuracy, the proposed 3DCGSA provides the best performance in terms of precision and F1-measure. This confirms that the extraction of the discriminative EEG features of multiple frequency bands through a 3D convolutional gated self-attention network in order to map them onto the final attention representation, and that the learning of global frequency band information to yield better results, are valid methods of analysis.
The stress recognition rate, precision, and F1-measure in VRE were lower than those in DEAP because some participants were likely distracted and not entirely immersed in the virtual environment. Additionally, a comparison of the recognition rates, precisions, and F1-measures of the three datasets indicated that the EDESC dataset contained more sensitive data for stress recognition than the DEAP or VRE datasets. Moreover, the recognition rate, precision, and F1-measure were lower in three-level EDESC than those in two-level EDESC; this is attributed to recognition errors that occurred between the two classes, wherein nonstressed and mildly stressed states were not easily distinguished.
Detailed experiments were conducted to investigate the effect of intra-frequency self-attention and inter-frequency band mapping on emotional stress recognition in the 3DCGSA method. Intra-frequency self-attention is a method of applying 3DCGSA to only one frequency band instead of a combination of frequency bands. Equations (7) and (8) were applied, and the experimental results are presented in Table 5.
The main characteristics of the simulation can be described as follows:
  • In the case of intra-frequency self-attention, the γ band had superior accuracy than other frequency bands. This experimental result is consistent with psychological studies [36] that reported that γ band activity is closely related to memory, learning, reminiscence, selective concentration, and high-level cognitive processing.
  • When comparing the results of the inter-frequency band mapping model with those of the intra-frequency self-attention method, the advantages of this framework could be clearly seen. Combining EEG features of all frequency bands, (θ, α, β, γ), resulted in much better recognition performance compared to using only one frequency band. This means that combinations of frequency bands help to achieve the best results by making the most of complementary information.
  • When applying the RA method, using GRU instead of additive connection showed improved results in both intra-frequency self-attention and inter-frequency band mapping.

4. Conclusions

A method to improve stress state recognition performance is proposed. First, multi-channel EEG signals are decomposed into four frequency bands, then 3DCGSA is applied to each frequency band, and finally complementary information is learned through inter-frequency mapping. Experiments performed using DEAP, VRE, and EDESC datasets demonstrated that the proposed method can effectively recognize stress states when compared to conventional methods. However, our approach has some limitations. Sufficient data are needed to support abundant parameterization to perform deep learning. Since learning and reasoning are time-consuming, and methods to reduce computation are required. Future studies will focus on improving the proposed method by reducing the computational burden while maintaining the recognition accuracy. Furthermore, the developed method is intended to be applied to the study of human brain activity in the purchasing decision-making process and sleepiness detection based on EEG pattern analysis. Furthermore, the proposed method can be applied to study human brain activity through EEG pattern analysis. To this end, we plan to use EEG cortical scans to track where stress occurs in the brain, and cross-validate the results with respect to neuroscience.

Author Contributions

Conceptualization, H.-G.K. and J.-Y.K.; Methodology, H.-G.K.; Software, D.-K.J.; Investigation, D.-K.J.; Resources, J.-Y.K.; Data Curation, D.-K.J.; Writing—Original Draft Preparation, H.-G.K.; Writing—Review and Editing, J.-Y.K.; Visualization, D.-K.J.; Project Administration, H.-G.K. and J.-Y.K.; Funding Acquisition, H.-G.K. and J.-Y.K. All authors have read and agreed to the published version of the manuscript.

Funding

This work was partly supported by Institute of Information & communications Technology Planning & Evaluation (IITP) grant funded by the Korea government (MSIT) (No. 2021-0-02068, Artificial Intelligence Innovation Hub).

Institutional Review Board Statement

Not applicable.

Informed Consent Statement

Not applicable.

Data Availability Statement

The DEAP dataset can be found at https://www.eecs.qmul.ac.uk/mmv/datasets/deap/ (accessed on 26 September 2022). Raw EEG data of VRE and EDESC datasets can be obtained by writing a formal email to Dong-Ki Jeong.

Acknowledgments

The work reported in this paper was conducted during the sabbatical year of Kwangwoon University in 2022.

Conflicts of Interest

The authors declare no conflict of interest.

References

  1. Sharma, N.; Gedeon, T. Objective measures, sensors and computational techniques for stress recognition: A survey. Comput. Meth. Programs Biomed. 2012, 108, 1287–1301. [Google Scholar] [CrossRef] [PubMed]
  2. Burke, H.M.; Davis, M.C.; Otte, C.; Mohr, D.C. Depression and cortisol responses to psychological stress: A meta-analysis. Psychoneuroendocrinology 2005, 30, 846–856. [Google Scholar] [CrossRef] [PubMed]
  3. Ahn, M.H. Analysis on The Reflection Degree of Worker’s Stress by Brain-waves based Anti-Stress Quotient. J. Korea Acad.-Ind. Coop. Soc. 2010, 11, 3833–3838. [Google Scholar]
  4. Pourmohammadi, S.; Maleki, A. Stress detection using ECG and EMG signals: A comprehensive study. Comput. Meth. Programs Biomed. 2020, 193, 105482. [Google Scholar] [CrossRef]
  5. Liu, Y.; Du, S. Psychological stress level detection based on electrodermal activity. Behav. Brain Res. 2018, 341, 50–53. [Google Scholar] [CrossRef]
  6. Katmah, R.; Al-Shargie, F.; Tariq, U.; Babiloni, F.; Al-Mughairbi, F.; Al-Nashash, H. A Review on Mental Stress Assessment Methods Using EEG Signals. Sensors 2021, 21, 5043. [Google Scholar] [CrossRef]
  7. Steptoe, A.; Marmot, M. Impaired cardiovascular recovery following stress predicts 3-year increases in blood pressure. J. Hypertens. 2005, 23, 529–536. [Google Scholar] [CrossRef] [Green Version]
  8. Pedrotti, M.; Mirzaei, M.A.; Tedesco, A.; Chardonnet, J.R.; Mérienne, F.; Benedetto, S.; Baccino, T. Automatic Stress Classification with Pupil Diameter Analysis. Int. J. Hum.-Comput. Interact. 2014, 30, 220–236. [Google Scholar] [CrossRef] [Green Version]
  9. Lee, M.; Moon, J.; Cheon, D.; Lee, J.; Lee, K. Respiration signal based two layer stress recognition across non-verbal and verbal situations. In Proceedings of the 35th Annual ACM Symposium on Applied Computing, Brno, Czech Republic, 30 March–3 April 2020; pp. 638–645. [Google Scholar]
  10. Liao, C.Y.; Chen, R.C.; Tai, S.K. Emotion stress detection using EEG signal and deep learning technologies. In Proceedings of the 2018 IEEE International Conference on Applied System Invention (ICASI), Chiba, Japan, 13–17 April 2018; pp. 90–93. [Google Scholar]
  11. Jebelli, H.; Khalili, M.M.; Lee, S. Mobile EEG-based workers’ stress recognition by applying deep neural network. In Advances in Informatics and Computing in Civil and Construction Engineering; Springer: Cham, Switzerland, 2019; pp. 173–180. [Google Scholar]
  12. Baumgartl, H.; Fezer, E.; Buettner, R. Two-level classification of chronic stress using machine learning on resting-state EEG recordings. In Proceedings of the 25th Americas Conference on Information Systems (AMCIS), Virtual Conference, 12–16 August 2020. [Google Scholar]
  13. Subhani, A.R.; Mumtaz, W.; Saad, M.N.B.M.; Kamel, N.; Malik, A.S. Machine learning framework for the detection of mental stress at multiple levels. IEEE Access 2017, 5, 13545–13556. [Google Scholar] [CrossRef]
  14. Chen, J.X.; Jiang, D.M.; Zhang, Y.N. A hierarchical bidirectional GRU model with attention for EEG-based emotion classification. IEEE Access 2019, 7, 118530–118540. [Google Scholar] [CrossRef]
  15. Wang, Z.; Wang, Y.; Hu, C.; Yin, Z.; Song, Y. Transformers for eeg-based emotion recognition: A hierarchical spatial information learning model. IEEE Sens. J. 2022, 22, 4359–4368. [Google Scholar] [CrossRef]
  16. Vaswani, A.; Shazeer, N.; Parmar, N.; Uszkoreit, J.; Jones, L.; Gomez, A.N.; Kaiser, Ł.; Polosukhin, I. Attention is all you need. In Advances in Neural Information Processing Systems 30 (NIPS 2017); Curran Associates, Inc.: Red Hook, NY, USA, 2017; Volume 30. [Google Scholar]
  17. Li, D.; Xie, L.; Chai, B.; Wang, Z.; Yang, H. Spatial-frequency convolutional self-attention network for EEG emotion recognition. Appl. Soft Comput. 2022, 122, 108740. [Google Scholar] [CrossRef]
  18. Issa, S.; Peng, Q.; You, X.; Shah, W.A. Emotion Assessment Using EEG Brain Signals and Stacked Sparse Autoencoder. J. Inf. Assur. Secur. 2019, 14, 20–29. [Google Scholar]
  19. Song, Y.; Jia, X.; Yang, L.; Xie, L. Transformer-based spatial-temporal feature learning for eeg decoding. arXiv 2021, arXiv:2106.11170. [Google Scholar]
  20. Newson, J.J.; Thiagarajan, T.C. EEG frequency bands in psychiatric disorders: A review of resting state studies. Front. Hum. Neurosci. 2019, 12, 521. [Google Scholar] [CrossRef] [Green Version]
  21. Wen, T.Y.; Bani, N.A.; Muhammad-Sukki, F.; Aris, S.A.M. Electroencephalogram (EEG) human stress level classification based on Theta/Beta ratio. Int. J. Integr. Eng. 2020, 12, 174–180. [Google Scholar] [CrossRef]
  22. Jun, T.J.; Nguyen, H.M.; Kang, D.; Kim, D.; Kim, D.; Kim, Y.H. ECG arrhythmia classification using a 2-D convolutional neural network. arXiv 2018, arXiv:1804.06812. [Google Scholar]
  23. Salama, E.S.; El-Khoribi, R.A.; Shoman, M.E.; Shalaby, M.A.W. EEG-based emotion recognition using 3D convolutional neural networks. Int. J. Adv. Comput. Sci. Appl. 2018, 9, 329–337. [Google Scholar] [CrossRef] [Green Version]
  24. Nguyen, A.; Pham, K.; Ngo, D.; Ngo, T.; Pham, L. An analysis of state-of-the-art activation functions for supervised deep neural network. In Proceedings of the 2021 International Conference on System Science and Engineering (ICSSE), Ho Chi Minh City, Vietnam, 26–28 August 2021; pp. 215–220. [Google Scholar]
  25. Niu, Z.; Zhong, G.; Yu, H. A review on the attention mechanism of deep learning. Neurocomputing 2021, 452, 48–62. [Google Scholar] [CrossRef]
  26. Tao, W.; Li, C.; Song, R.; Cheng, J.; Liu, Y.; Wan, F.; Chen, X. EEG-based emotion recognition via channel-wise attention and self attention. IEEE Trans. Affect. Comput. 2020. [Google Scholar] [CrossRef]
  27. He, K.; Zhang, X.; Ren, S.; Sun, J. Deep residual learning for image recognition. In Proceedings of the IEEE Conference on Computer Vision and Pattern Recognition (CVPR), Las Vegas, NV, USA, 27–30 June 2016; pp. 770–778. [Google Scholar]
  28. Tao, Y.; Sun, T.; Muhamed, A.; Genc, S.; Jackson, D.; Arsanjani, A.; Kumar, P. Gated transformer for decoding human brain eeg signals. In Proceedings of the 2021 43rd Annual International Conference of the IEEE Engineering in Medicine & Biology Society (EMBC), Guadalajara, Mexico, 1–5 November 2021; pp. 125–130. [Google Scholar]
  29. Yang, J.; Huang, X.; Wu, H.; Yang, X. EEG-based emotion classification based on bidirectional long short-term memory network. Procedia Comput. Sci. 2020, 174, 491–504. [Google Scholar] [CrossRef]
  30. Koelstra, S.; Muhl, C.; Soleymani, M.; Lee, J.S.; Yazdani, A.; Ebrahimi, T.; Patras, I. DEAP: A database for emotion analysis; using physiological signals. IEEE Trans. Affect. Comput. 2011, 3, 18–31. [Google Scholar] [CrossRef] [Green Version]
  31. Hag, A.; Handayani, D.; Altalhi, M.; Pillai, T.; Mantoro, T.; Kit, M.H.; Al-Shargie, F. Enhancing EEG-Based Mental Stress State Recognition Using an Improved Hybrid Feature Selection Algorithm. Sensors 2021, 21, 8370. [Google Scholar] [CrossRef] [PubMed]
  32. Candra, H.; Yuwono, M.; Chai, R.; Handojoseno, A.; Elamvazuthi, I.; Nguyen, H.T.; Su, S. Investigation of window size in classification of EEG-emotion signal with wavelet entropy and support vector machine. In Proceedings of the 2015 37th Annual International Conference of the IEEE Engineering in Medicine and Biology Society (EMBC), Milan, Italy, 25–29 August 2015; pp. 7250–7253. [Google Scholar]
  33. Nogay, H.S.; Adeli, H. Detection of epileptic seizure using pretrained deep convolutional neural network and transfer learning. Eur. Neurol. 2020, 83, 602–614. [Google Scholar] [CrossRef]
  34. Li, X.; Song, D.; Zhang, P.; Yu, G.; Hou, Y.; Hu, B. Emotion recognition from multi-channel EEG data through convolutional recurrent neural network. In Proceedings of the 2016 IEEE International Conference on Bioinformatics and Biomedicine (BIBM), Shenzhen, China, 15–18 December 2016; pp. 352–359. [Google Scholar]
  35. Zhang, X.; Han, L.; Zhu, W.; Sun, L.; Zhang, D. An explainable 3D residual self-attention deep neural network for joint atrophy localization and Alzheimer’s disease diagnosis using structural MRI. IEEE J. Biomed. Health Inform. 2021. [Google Scholar] [CrossRef] [PubMed]
  36. Matsumoto, A.; Ichikawa, Y.; Kanayama, N.; Ohira, H.; Iidaka, T. Gamma band activity and its synchronization reflect the dysfunctional emotional processing in alexithymic persons. Psychophysiology 2006, 43, 533–540. [Google Scholar] [CrossRef]
Figure 1. Structure and procedure of the proposed method.
Applsci 12 11162 g001
Figure 2. Preprocessing for noise and artifact removal from EEG.
Applsci 12 11162 g002
Figure 3. 3D cuboid representation of the entire multi-channel EEG in each frequency band. PSD distributions of multiple EEG electrodes constitute a topographic map. The PSD variation of EEG electrodes over time forms depth.
Applsci 12 11162 g003
Figure 4. Architecture of the 3D convolutional gated self-attention deep neural network.
Applsci 12 11162 g004
Figure 5. Internal computing structure of GRU.
Applsci 12 11162 g005
Table 1. Stress recognition results using the DEAP dataset.
MethodAccuracyPrecisionF-Measure
RF-FS79.8475.6476.03
EF-SVM81.4581.3181.07
2D-AlexNet81.8383.5182.11
HBGRUA84.6284.5283.94
CRNN86.7786.5886.16
SF3DCNN87.1386.9486.52
PLNTF88.4286.8986.75
GTR89.6789.7788.65
3DRADNN91.4691.2790.85
SFCSAN92.8392.7692.15
SF3DCRA94.5294.6293.50
3DCGSA96.6896.7796.39
Table 2. Stress recognition results using the VRE dataset.
MethodAccuracyPrecisionF-Measure
RF-FS75.7977.4777.09
EF-SVM77.7877.6476.40
2D-AlexNet79.5779.3878.96
HBGRUA81.7880.2580.11
CRNN83.9285.6085.22
SF3DCNN85.6385.5684.96
PLNTF86.5386.6286.24
GTR87.9787.8787.29
3DRADNN89.5991.2790.89
SFCSAN92.7492.5592.13
SF3DCRA93.6194.993.91
3DCGSA95.6495.5794.96
Table 3. Stress recognition results using the two-level EDESC dataset.
MethodAccuracyPrecisionF-Measure
RF-FS74.5277.6076.20
EF-SVM76.1377.8177.43
2D-AlexNet78.5678.6578.27
HBGRUA80.1380.0379.45
CRNN81.0382.7182.33
SF3DCNN82.1282.0581.44
PLNTF83.1783.2682.88
GTR84.3484.483.66
3DRADNN86.2584.7284.58
SFCSAN87.4787.2886.86
SF3DCRA89.4889.5789.19
3DCGSA91.5293.2092.82
Table 4. Stress recognition results using the three-level EDESC dataset.
MethodAccuracyPrecisionF-Measure
RF-FS71.4773.1572.77
EF-SVM73.2173.3072.92
2D-AlexNet75.3977.0776.69
HBGRUA77.2477.3376.95
CRNN79.5379.4678.85
SF3DCNN80.6280.7280.60
PLNTF81.2482.9282.54
GTR83.3283.2582.64
3DRADNN85.0484.8584.43
SFCSAN86.6786.5385.29
SF3DCRA88.1588.2587.13
3DCGSA90.1290.2189.83
Table 5. Performance comparison between intra-frequency self-attention and inter-frequency band mapping based on the DEAP dataset.
MethodRecognition Accuracy (%)
RAGRU-RA
θ84.9587.06
α86.5388.55
β88.5490.72
γ90.0792.33
(θ, α, β, γ)93.9996.68
Publisher’s Note: MDPI stays neutral with regard to jurisdictional claims in published maps and institutional affiliations.

