


Prediction of Prospecting Target Based on ResNet Convolutional Neural Network
1
Faculty of Intelligent Manufacturing, Wuyi University, Jiangmen 529000, China
2
State Key Laboratory of Environmental Criteria and Risk Assessment, Chinese Research Academy of Environmental Sciences, Beijing 100012, China
3
Faculty of Social Sciences, Lingnan University, Hongkong 999077, China
*
Author to whom correspondence should be addressed.
Appl. Sci. 2022, 12(22), 11433; https://0-doi-org.brum.beds.ac.uk/10.3390/app122211433
Submission received: 11 September 2022
/
Revised: 10 October 2022
/
Accepted: 13 October 2022
/
Published: 11 November 2022
(This article belongs to the Topic Machine and Deep Learning)
Abstract
:In recent years, with the development of geological prospecting from shallow ore to deep and hidden ore, the difficulty of prospecting is increasing day by day, so the application of computer technology and new methods of geological and mineral exploration is paid more and more attention. The mining and prediction of geological prospecting information based on deep learning have become the frontier field of earth science. However, as a deep artificial intelligence algorithm, deep learning still has many problems to be solved in the big data mining and prediction of geological prospecting, such as the small number of training samples of geological and mineral images, the difficulty of building deep learning network models, and the universal applicability of deep learning models. In this paper, the training samples and convolutional neural network models suitable for geochemical element data mining are constructed to solve the above problems, and the model is successfully applied to the prediction research of gold, silver, lead and zinc polymetallic metallogenic areas in South China. Taking the Pangxidong research area in the west of Guangdong Province as an example, this paper carries out prospecting target prediction research based on a 1:50000 stream sediment survey original data. Firstly, the support vector machine (SVM) model and statistical method were used to determine the ore-related geochemical element assemblage. Secondly, the experimental data of geochemical elements were augmented and a dataset was established. Finally, ResNet-50 neural network model is used for data training and prediction research. The experimental results show that the areas numbered 9, 29, 38, 40, 95, 111, 114, 124, 144 have great metallogenic potential, and this method would be a promising tool for metallogenic prediction. By applying the ResNet-50 neural network in metallogenic prediction, it can provide a new idea for the future exploration of mineral resources. In order to verify the generality of the research method in this paper, we conducted experimental tests on the geochemical dataset of B area, another deposit research area in South China. The results show that 100% of the prediction area obtained by using the proposed method covers the known ore deposit area. This model also provides method support for further delineating the prospecting target area in study area B.
1. Introduction
Geological and mineral exploration is the core work of geologists to provide resources and an energy guarantee for the stable development of society, and its main task is to use scientific and technological methods to carry out reasonable metallogenic prediction, and to discover and increase the reserves of resources [1]. In recent years, with the decrease in surface ore and shallow ore, the difficulty of prospecting is increasing. Geological prospecting and exploration work is gradually developing towards deep ore and hidden ore. At present, the difficulties of geological and mineral exploration are mainly reflected in the complex geological overlay, deep deposit burial resulting in weak prospecting information, complex deposit preservation environment factors, multi-stage mineralization resulting in complex metallogenic information and so on. In order to solve the above problems, geological experts and scholars pay more and more attention to the application of computer technology and new methods in geological and mineral exploration research [2,3,4,5,6,7]. In recent years, with the rapid development and gradual maturity of computer technology and artificial intelligence technology, it has become possible to introduce computer technology and deep learning methods into the field of geological prospecting and exploration.
The mining and prediction of geological prospecting information based on deep learning have become a hot research field in earth science. As a deep artificial intelligence algorithm, deep learning has been actively applied in the field of earth science research and has made many innovative achievements [8,9,10,11,12,13]. The authors of [14] summarized the achievements of artificial intelligence and big data technology in the field of earth science in the past, and proposed that artificial intelligence and big data technology would be the main development direction of earth science research in the future. The authors of [15] used deep learning technology to predict the baseline map of geological disasters in Australia, and the algorithm model obtained can provide technical support for related fields. In [16], the authors established the HPC cluster platform, which provided platform support for the application of deep learning technology in geosciences scientific data. The authors of [17] used the deep learning algorithm and big data analysis to draw the mineral prospect map, and the prediction results showed that the drawn prospect area had a strong spatial relationship with the known mineralization location. The authors of [18] used machine learning models and geostatistical methods to predict the geochemical concentration of iron in the iron ore research area in southern Cameroon. The results showed that random forest was the algorithm of choice for predicting Fe geochemical concentrations. The authors of [19] compared the application of multiple deep learning methods in intelligent mineral identification of different data types, and proposed that transfer learning can effectively solve the problems of insufficient geological data samples and class imbalance. The authors of [20] used deep learning methods to perform intelligent recognition of polarizing microscopic images of five minerals and obtained good recognition results. The authors of [21] used principal component analysis, cluster analysis and partial least squares dimensionality reduction method to conduct targeted prospecting prediction for stream sediment geochemical survey data. The analysis results have a high degree of coupling with known geological conditions of ore deposits, which can provide reliable data support for further prospecting in this area. In [22], the authors used the random forest algorithm to identify geochemical anomalies and delineate three-dimensional metallogenic prospects. The authors of [23] used the convolutional neural network to predict lead-zinc deposits in Anhui Province and successfully delineated three prospecting targets. The authors of [24] used the AlexNet network to predict sedimentary manganese deposits and delineated a total of four metallogenic potential areas, with a high probability of undiscovered deposits in the predicted area. It can be seen that computer technology and deep learning methods are of great significance in the field of earth science research, which can effectively predict the target areas of geological and mineral exploration to a certain extent.
However, deep learning methods are still in the exploration stage in geological prospecting and metallogenic prediction, and there are still many problems to be solved. There are a series of common problems, such as the small number of training samples of geological and mineral images, the difficulty of building deep learning network models, and the universal applicability of deep learning models. Aiming at the above problems, this paper takes the stream sediment geochemical data in the Pangxidong research area, Guangdong Province as the research object, constructs the training samples and ResNet-50 convolutional neural network model suitable for geochemical element data mining, and compares the effect of this model with other deep learning models. We used the trained model to predict the artificial intelligence mineral target area in the study area. In order to verify the generality of the research method in this paper, we also conducted experimental model testing and data analysis on the geochemical dataset of B area, another ore deposit research area in South China. Based on this, we discuss the significance of the research method in this paper to provide technical support for the geological prospecting target area.
2. Study Area and Data
2.1. Geological Setting
The study area is located in the Pangxidong area of Guangdong Province, on the southwestern edge of the Yunkai metamorphic body of a key metallogenic belt in China, the southern part of the Qinhang metallogenic belt (combination zone) (Figure 1) [25]. The Qin-Hang metallogenic belt is formed by the collision and splicing of the Yangtze plate and the Cathaysia plate. It runs through eastern Hunan and central Jiangxi, winding in the northeast direction with a length of about 2000 km and a width of about 70–130 km. Hundreds of large- and medium-sized deposits have been proven in this metallogenic belt. What is more, the Pangxidong area has developed into one of the most important silver–gold polymetallic ore-producing areas in South China and even in China, with excellent metallogenic geological conditions and great prospecting potential.
The study area has experienced the tectonic evolution history of the Jining movement, the Caledonian movement and the Indosinian Yanshanian movement [26]. Tectonically, it belongs to the southern margin of the Yunkai uplift area in western Guangdong. It has been a long-term uplift area since the late Paleozoic, with complete stratigraphic outfall pairs, complex structure and frequent magmatic activity [27]. There are three groups of deep and large faults in the area according to the direction, including the NE-NE Bobai–Cenxi fault zone, the Xinyi–Lianjiang fault zone, the Lianjiang–Yangjiang fault zone and the Luoding–Guangning fault zone. There is a close relationship between gold and silver mineralization and deep faults in the Pangxidong area, which is controlled by a certain tectonic system. The intrusive rocks are widely developed and mainly exposed in the west and north of the study area.
2.2. Geochemical Data
In this study, the sampling area of stream sediment is 1,694 km2, and the average sampling density is about 4.27 sample/km2. A total of 7234 samples, including sixteen chemical elements, such As Cu, Pb, Zn, Mn, Sn, W, Ag, Au, B, Sb, Bi, Mo, Hg, F, Ba, were analyzed and measured. Among them, Au was analyzed by chemical spectrometry; B, Sn and Ag were analyzed by spectral quantitative method; Cu was analyzed by atomic absorption method; Ba, Mn, Pb and Zn were analyzed by full spectrum spectrometry; As, Sb, Bi and Hg were analyzed by atomic fluorescence method; and F was analyzed by ion electrode method. The Mo and W elements were analyzed by catalytic polarography.
3. Study Method
3.1. Convolutional Neural Networks
The convolutional neural network (CNN) is currently one of the representative neural networks in the field of deep learning technology [28] This theory was originally proposed by Yann et al. and has only been rapidly developed and applied in recent years [29]. CNN design originates from the research of visual neuroscience on simple cells and complex cells of animal brain visual cortex, and constructs the neural network model by simulating the processing process of cell visual information. CNN includes input, convolutional, normalization, activation pooling, full connection, softmax output and other operations. LeNet marked the official display of CNN, followed by AlexNet [30,31] and VGG [32,33], and now ResNet [34,35] is widely used, CNN has been continuously improved and well applied in various fields [36,37,38,39].
3.1.1. Convolutional Layer
The convolution layer of the convolutional neural network has two dimensions of height and width, so it is most commonly used for two-dimensional convolution operations. Generally, the convolution operation is realized by correlation operation, that is, a two-dimensional kernel array (also called convolution kernel) is applied to the input data to obtain new two-dimensional data. Then, the convolution kernel moves on the input data through a certain step, and each move is a convolution operation. Through continuous convolution operations on the input data, the features of the input data are extracted from each convolution nuclear to extract one feature of the data, and N convolution nuclear to extract N features.
3.1.2. Normalization Layer and Activation Function
Batch data are normalized before output, and normalized layers are placed between each layer of the whole network, which can make the intermediate output of the whole network stable in numerical terms, and prevent the gradient disappearance or gradient explosion in the backpropagation of the neural network, so that the training is more stable.
The activation function can increase the nonlinearity of the neural network and strengthen the learning ability of the neural network, such as the Rule activation function, the Sigmoid activation function, the Tanh activation function and so on. The Rule activation function only keeps positive data and clears negative data to 0, and the derivative of positive data is 1 during reverse propagation, which solves the problem of gradient disappearance and has good operation efficiency. The Sigmoid activation function limits the value range of the output to between (0, 1), making the data smoother and easier to take the derivative. However, it is easy to lose the gradient when the derivative value is (0, 0.25). Tanh activation function limits the value range of the output to between (−1, 1), and the derivative range is between (0, 1). Compared with the Sigmoid activation function, the problem of gradient disappearance is alleviated.
3.1.3. Pooling Layer
Pooling operation is mainly used for feature dimension reduction to reduce the number of parameters, and reduce the fitting situation, as well as improve the fault tolerance of the models at the same time. The common pooling operations include maximum pooling and average pooling, and the operation is similar to the convolution operation, which continuously moves the input data through a two-dimensional array and takes the maximum or average value of the data in the two-dimensional array.
3.1.4. Full Connection Layer
After continuous feature extraction, the neural network will eventually access a full connection layer. The full connection layer is connected with the nodes of the upper layer; however, in order to solve the overfitting problem of the neural network model, the discard method is generally used to discard the extracted features with a certain probability. The full connection layer can increase the nonlinearity of the neural network, reduce network parameters and obtain the final mapping result.
3.2. ResNet Neural Network
The ResNet neural network was proposed in Geosciences by authors [35]. A direct channel is established through ResNet neural network, which combines input and output, effectively alleviates the loss and loss of geoscience information caused by convolution operation and, also plays a positive role in solving the problem of gradient disappearance or explosion in the deep network. As shown in the network structure in Figure 2, the identity block defines three convolution operations and protects the integrity of geoscience information through direct channels. After convolution, the feature map is normalized in batches and processed by the activation function, so as to enhance the ability of the model to simulate synthetic ore prediction. Specifically, first, use 7 × 7 and the maximum pooling layer to extract sample features and reduce dimensions. Then, the geoscience features of the samples are further extracted through four convolution layers containing 3, 4, 6 and 3 identity blocks, respectively. Then, the global average pooling layer is used to further reduce the sample dimension, and finally, the full connection operation is performed to obtain the mineralization prediction. It is worth noting that the input size of W × H × n is obtained by preprocessing the geochemical data, where W denotes width, H denotes height and n denotes the number of geochemical elements. The data preprocessing method is covered in Section 4.1. The output is the probability of mines and without mines.
3.3. Data Input and Softmax Output
The input data is made up of different dimensions, which can vary greatly in value. Therefore, the data needs to be normalized and the value of each dimension value is determined to be in the range of [0, 1]. For the lack of training data, input data is generally augmented. Then, more data can be generated by randomly flipping, translating and clipping the input data. After these processes, the data will be trained as a model of the neural network.
The output of each node in the full connection layer is a numerical value in machine learning; however, a probability is needed to judge the quality of the classification model. Therefore, the softmax function is widely used to evaluate the output of the full connection layer as Equation (1). This function would map the output of the fully connected layer to the interval of [0, 1], and the output result can be regarded as the probability value of each category.
where Zi is the output of the ith node of the full connection layer, K is the number of output nodes of the full connection layer, that is, the number of classification categories.
4. Results and Discussion
4.1. Data Preprocessing
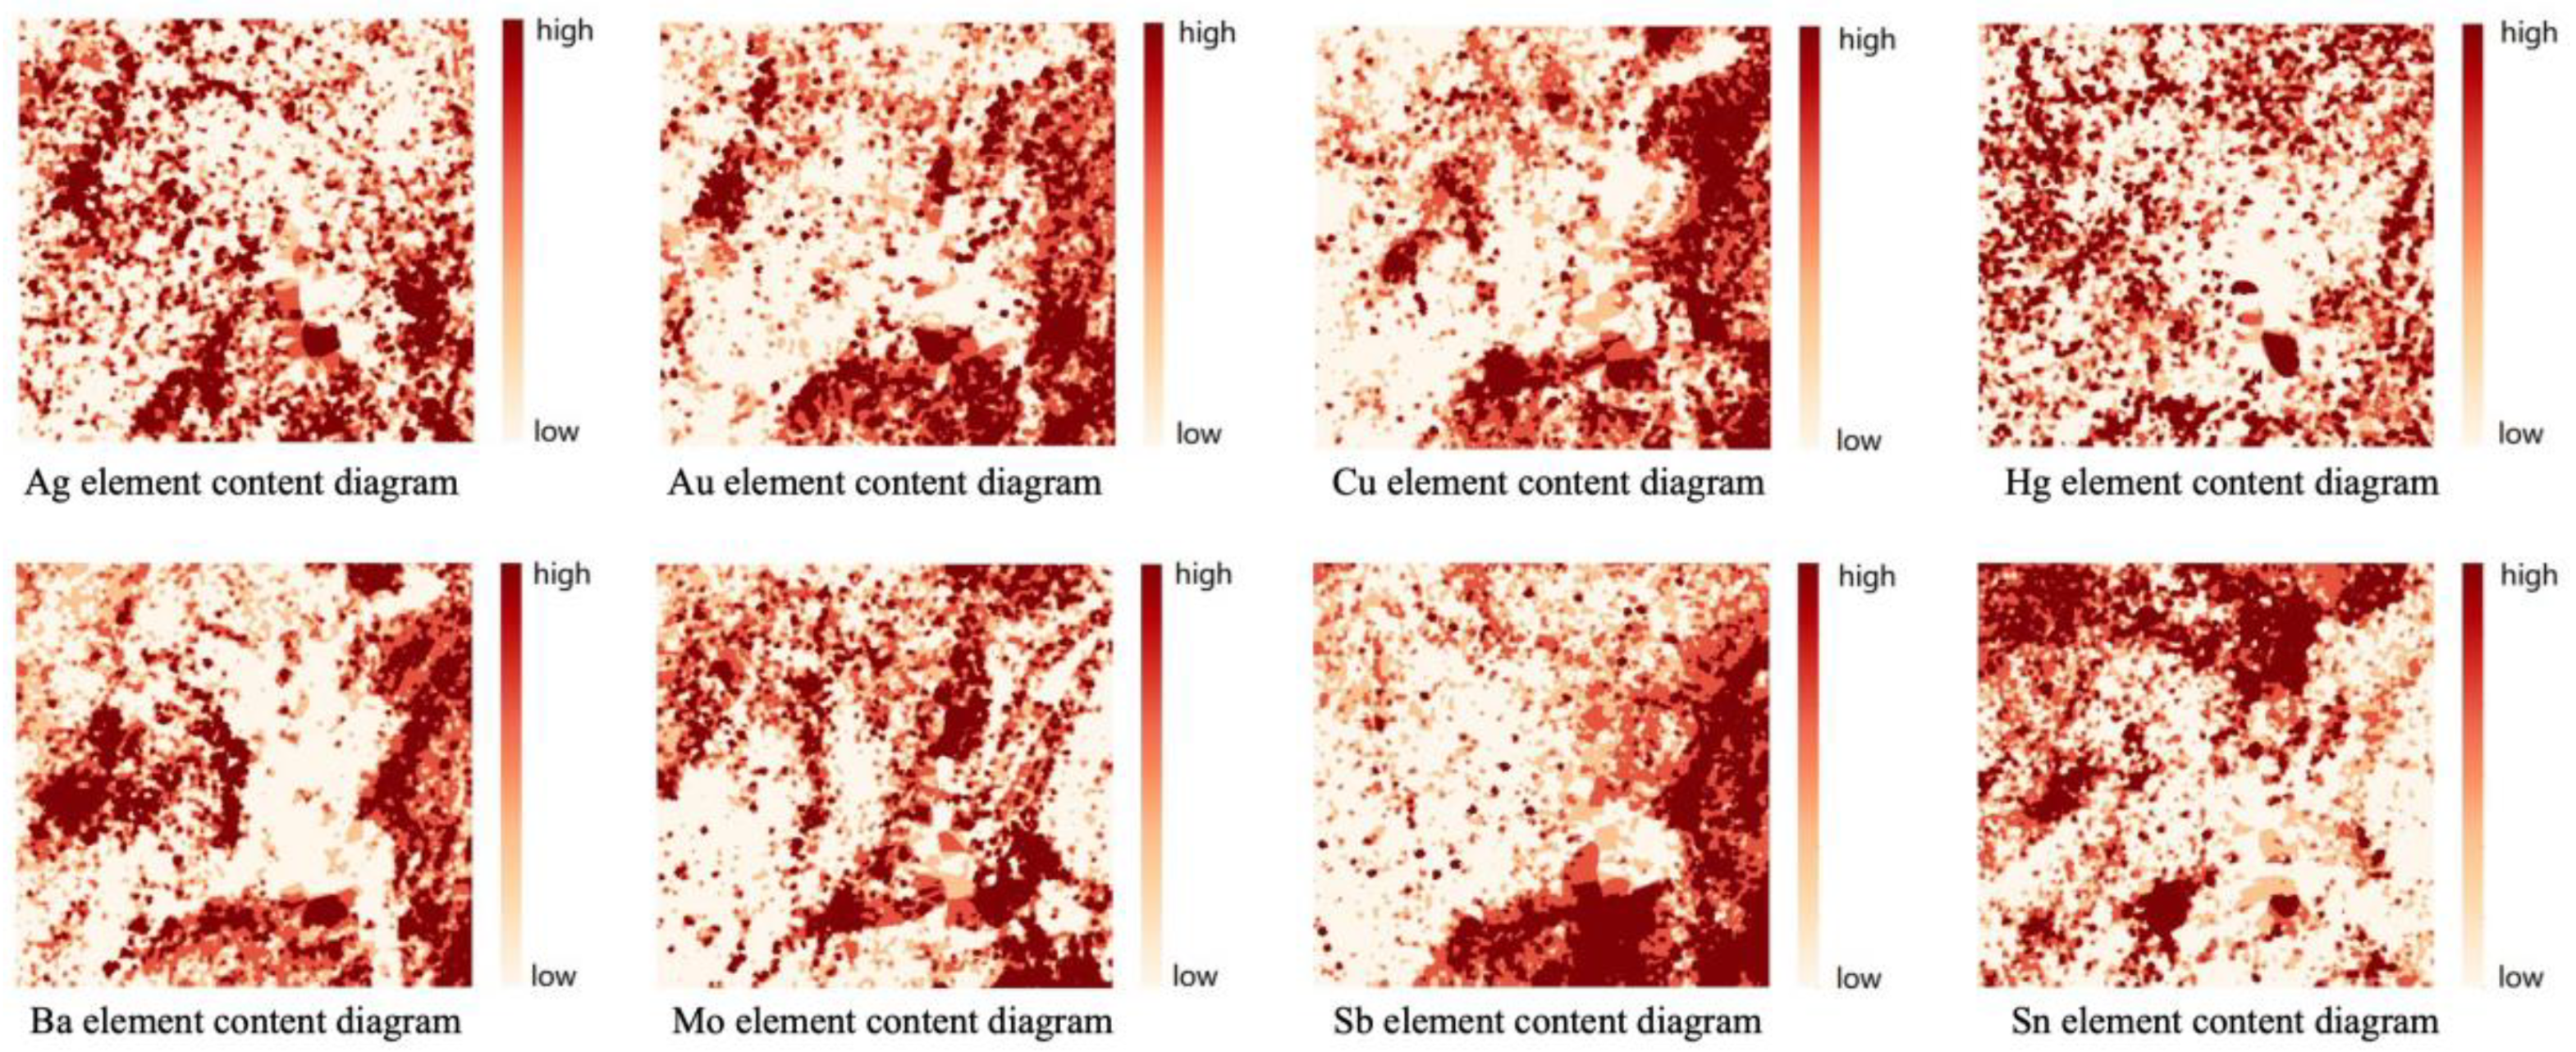
At first, the geochemical data, including the latitude and longitude coordinates of each sampling point and the information on 16 kinds of geochemical elements of sediments, were made into a data set. In this study, inverse distance weighted interpolation was used to process sediment data with 3072 × 3072 grid cells, as displayed in Figure 3. The grid map generated by Au, Ag, Cu and Hg can also be regarded as an element content map. Grid data are normalized to make the mean value as 0 and variance as 1 by following the normalization formula Equation (2).
where is the normalized value, represents the mean value of element data and is the variance of the element data.
In this study, geochemical elements related to mineralization were selected from 16 geochemical elements, and the Area Under Curve (AUC) value and ZAUC value of each element were calculated using the traditional support vector model [40,41]. The theoretical background of the SVM emanates from the principles of empirical risk and structural risk minimization principle [42]. The basic idea of SVM algorithm is to solve the separation hyperplane that can correctly partition the training data set and has the largest geometric interval. The results are shown in Table 1.
The area enclosed by the Receiver Operating Characteristic Curve (ROC) drawn by geochemical data classification is the AUC value, which ranges from (0.5, 1) [41]. The higher the AUC value is, the better the performance of the classification model is. The random variable ZAUC satisfies the standard normal distribution, and the critical value is obtained by comparing the standard normal distribution table to detect whether there is a significant difference between AUC and 0.5. For example, when the significance level is 0.01 and ZAUC = 2.58, it can be considered that there is a 99% probability that the AUC value and 0.5 have a significant difference. The critical value 2.58 was selected as the ZAUC value was greater than the significance level 0.01. In other words, a total of eight elements including Au, Sn, Cu, Ag, Ba, Sb, Hg and Mo were selected as indicative elements for ore target prediction.
4.2. Data Set Construction
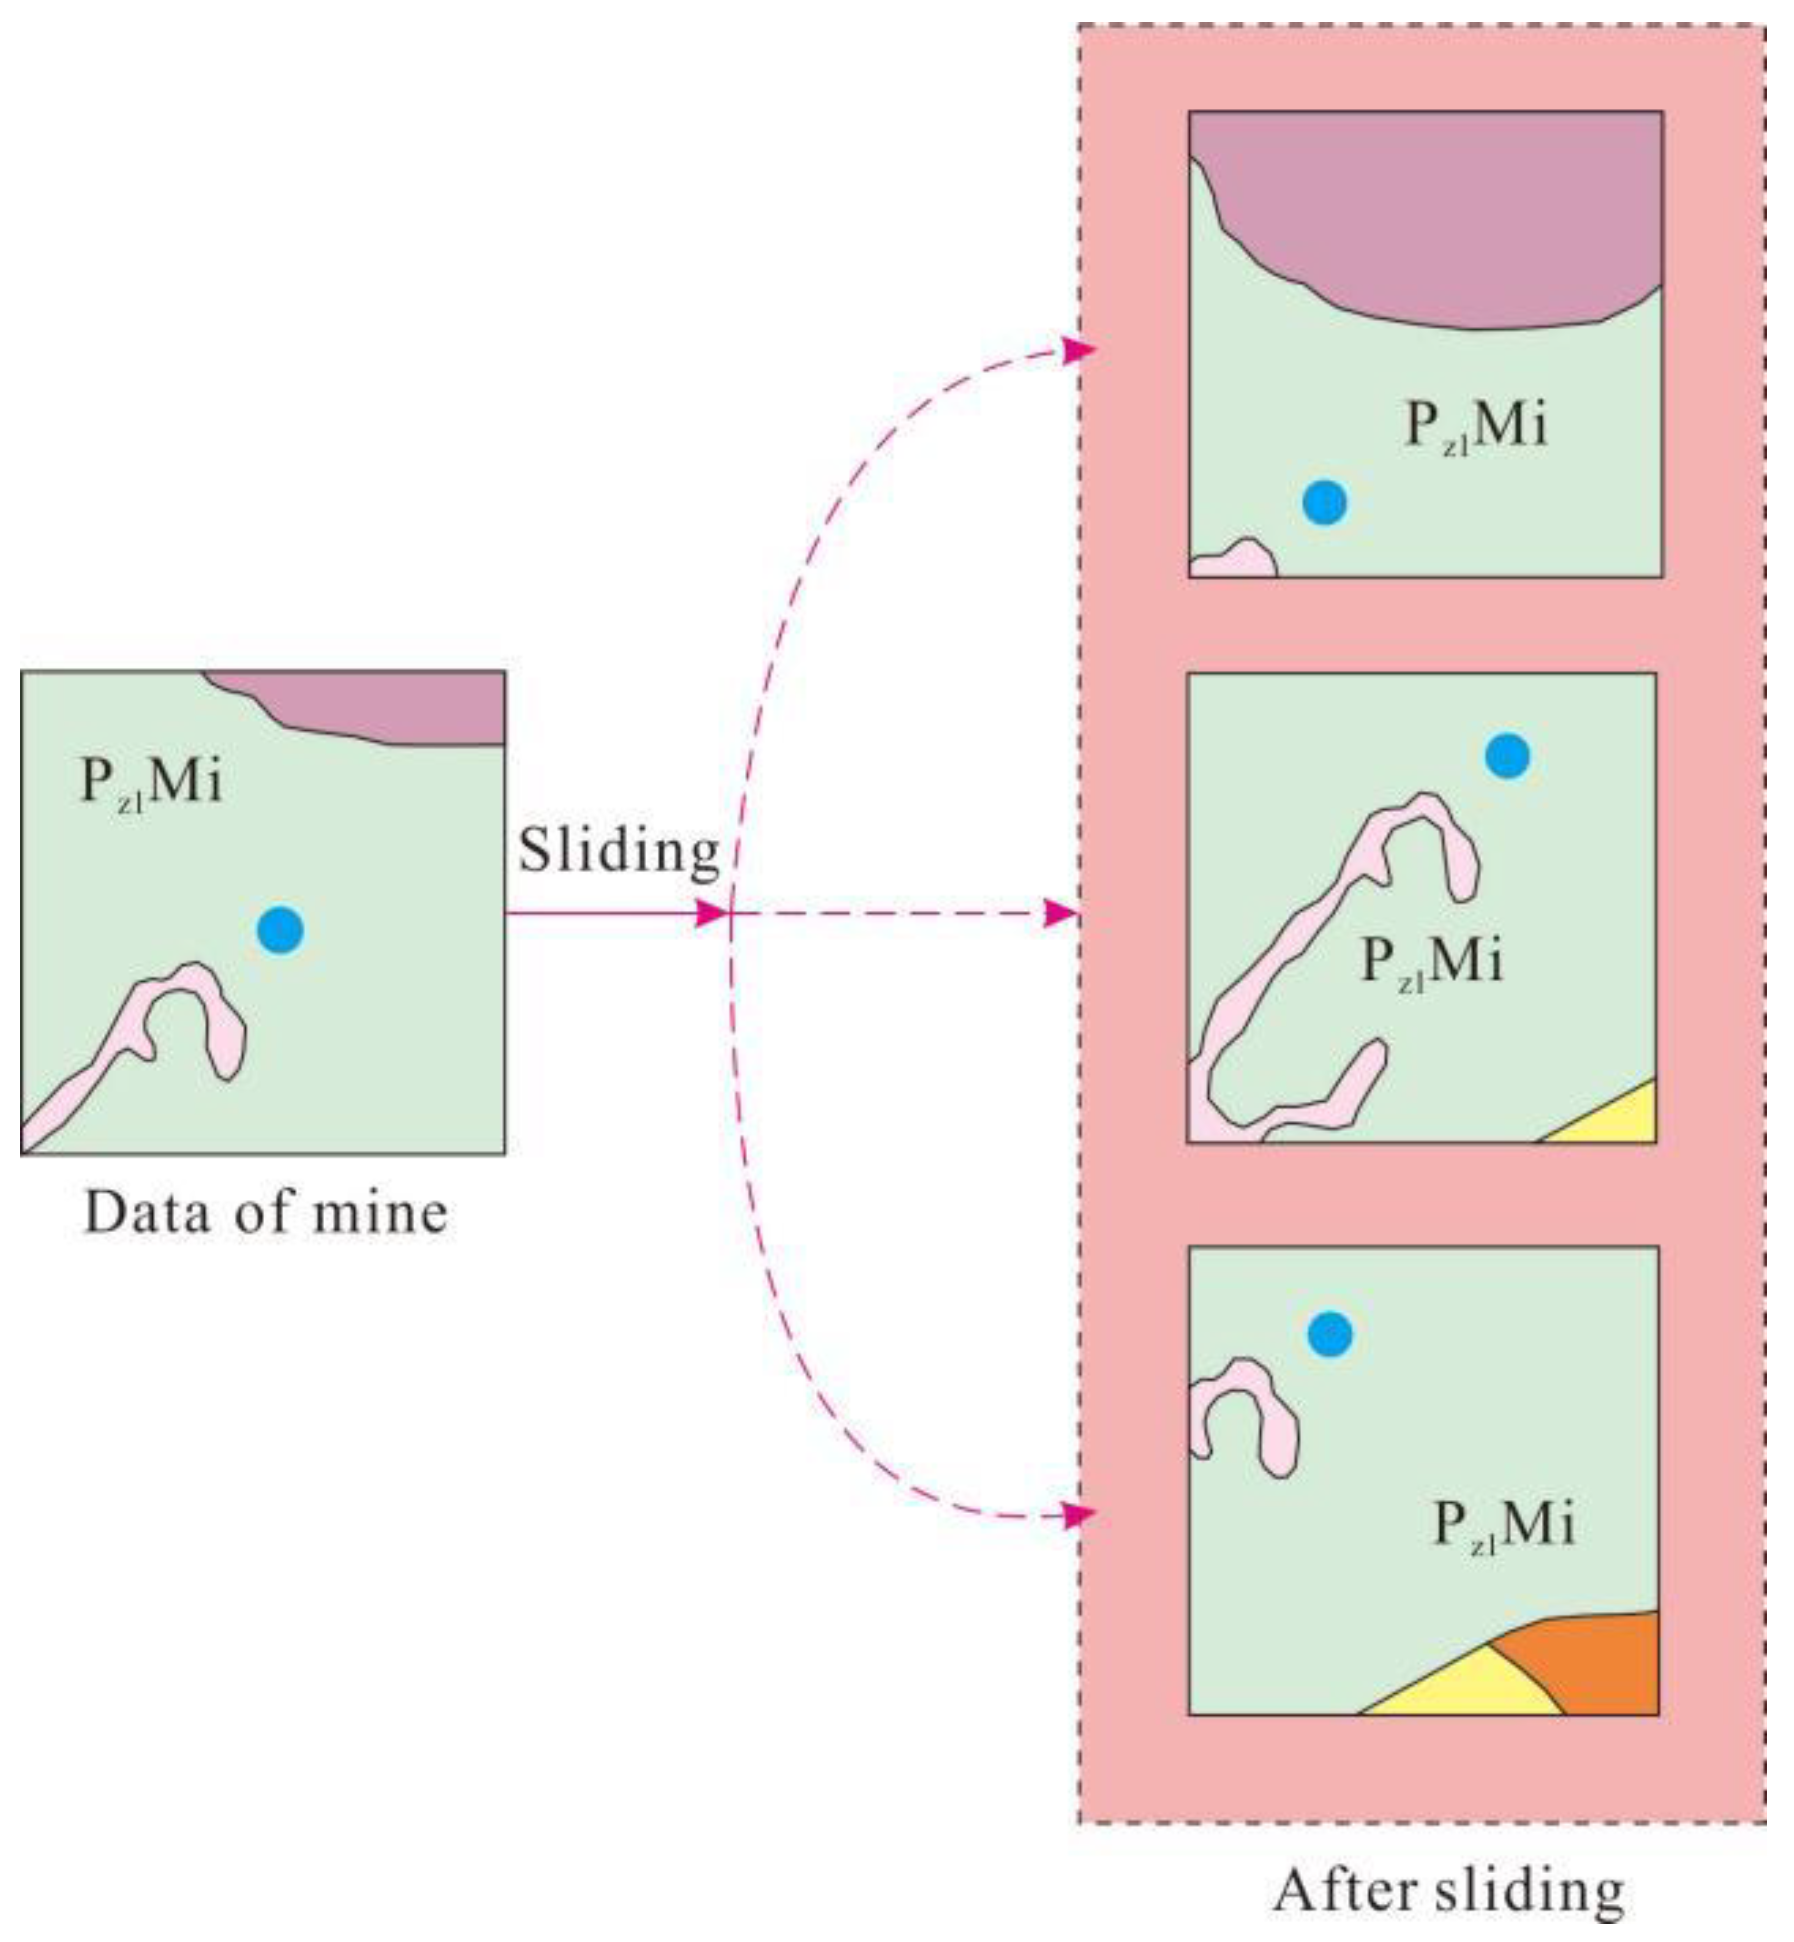
In order to solve the problem of classification imbalance in geochemical data, which has few ‘known ore’ locations and many ‘unknown ore’ locations, the method of data augmentation has been adopted to slide the ore point [43]. As shown in Figure 4, Data were amplified to generate 212 areas with ‘ore’ locations and randomly searched for 225 areas with “no ore”. In this study, the grid graphs generated by eight elements are integrated together to form a data training set consisting of 437 data sets with each data set of 256 × 256 × 8. Before each iteration, the data were randomly flipped horizontally and vertically and trimmed to 224 × 224 as the text input of the neural network.
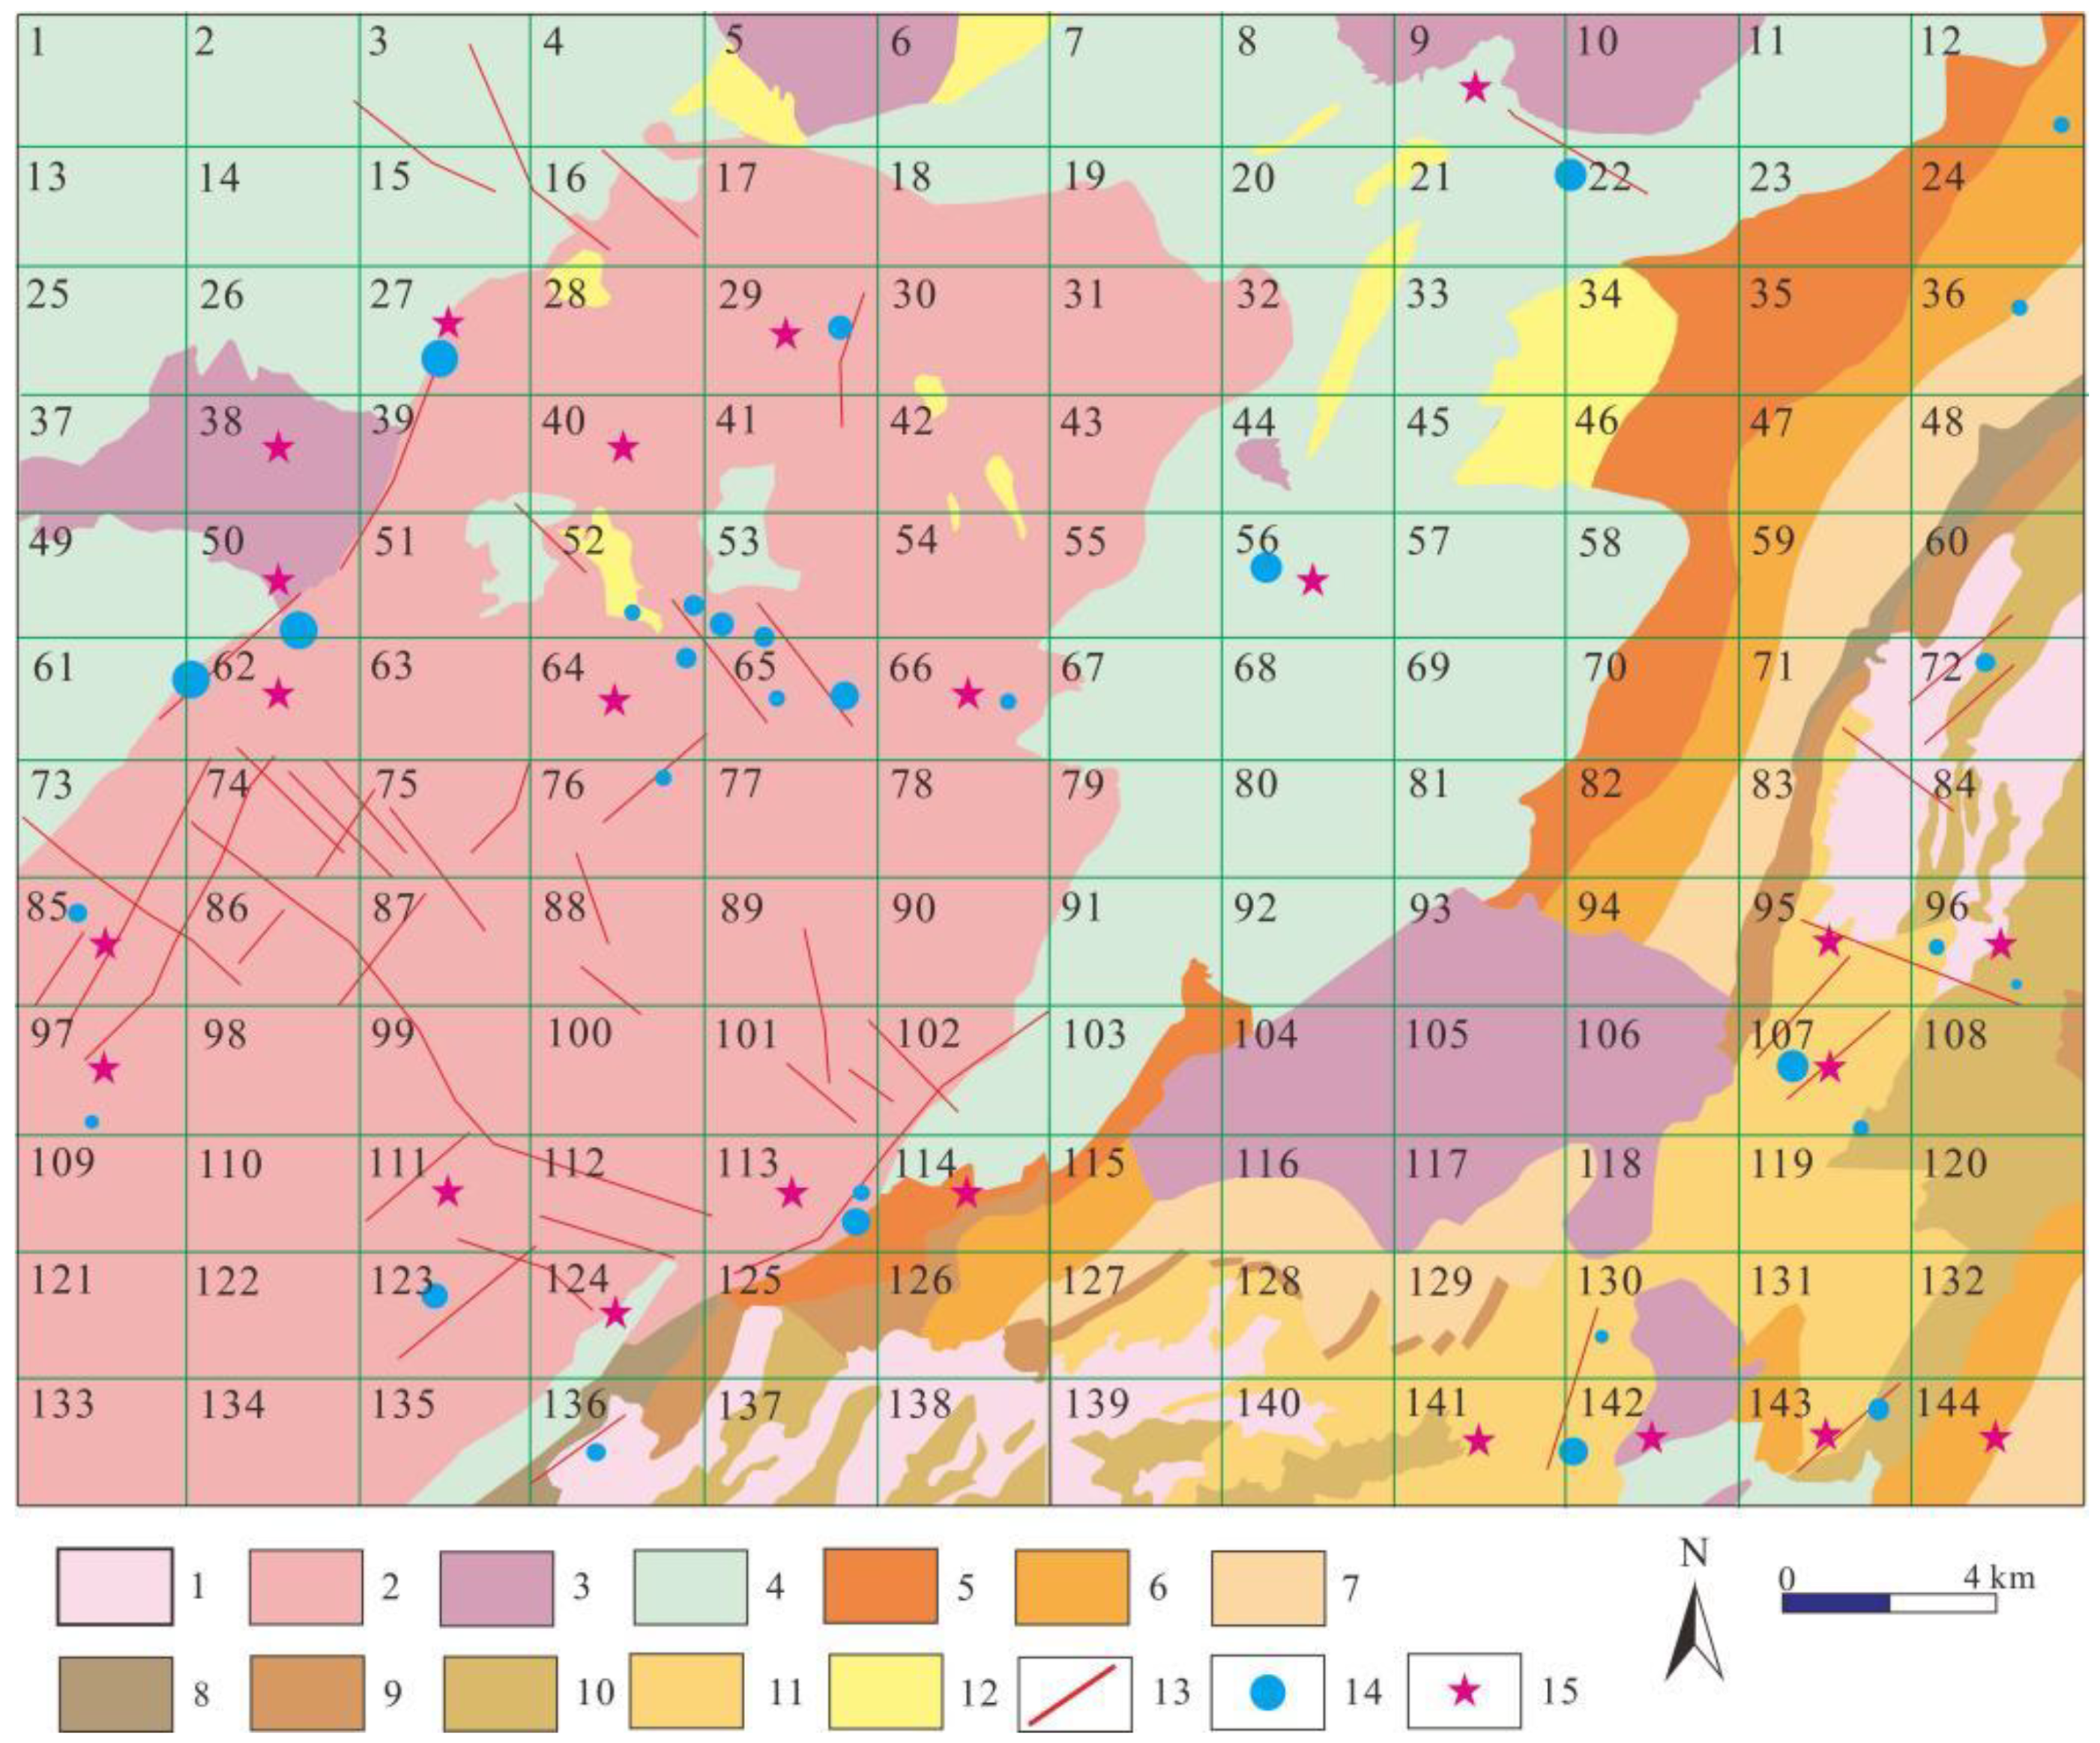
In this study, a grid of 3072 × 3072 was divided and 144 (12 × 12) data were generated. As shown in Figure 5, among them, there are 29 ‘ore’ areas and 115 ‘no ore’ areas, that is, the test set of the study consists of 144 data sets with each contains 256 × 256 × 8 data. The test set was cut into 224 × 224 grids and used as the input of neural network to test the performance of the trained model.
4.3. Experiments Based on ResNet-50
The experimental platform is Tesla V100 32 GB GPU, and the deep learning framework is Pytorch. Accuracy, AUC and F1 values are used to verify the performance of the model.
In this study, the ResNet-50 convolutional neural network was used to train the comprehensive training set, and the SGD optimizer was used for training [44,45]. The momentum is 0.1, the weight decay is 1e-4, the loop iteration is 120 times and the initial learning rate is 0.01, every 30 times. The attenuation is 50%, and the batch size is 32.
Table 2 shows the experimental results of ResNet-50 compared with various popular CNN algorithms. ResNet is superior to other algorithms in Accuracy, AUC and Recall. This proves the effectiveness of using Resnet for prospecting target prediction.
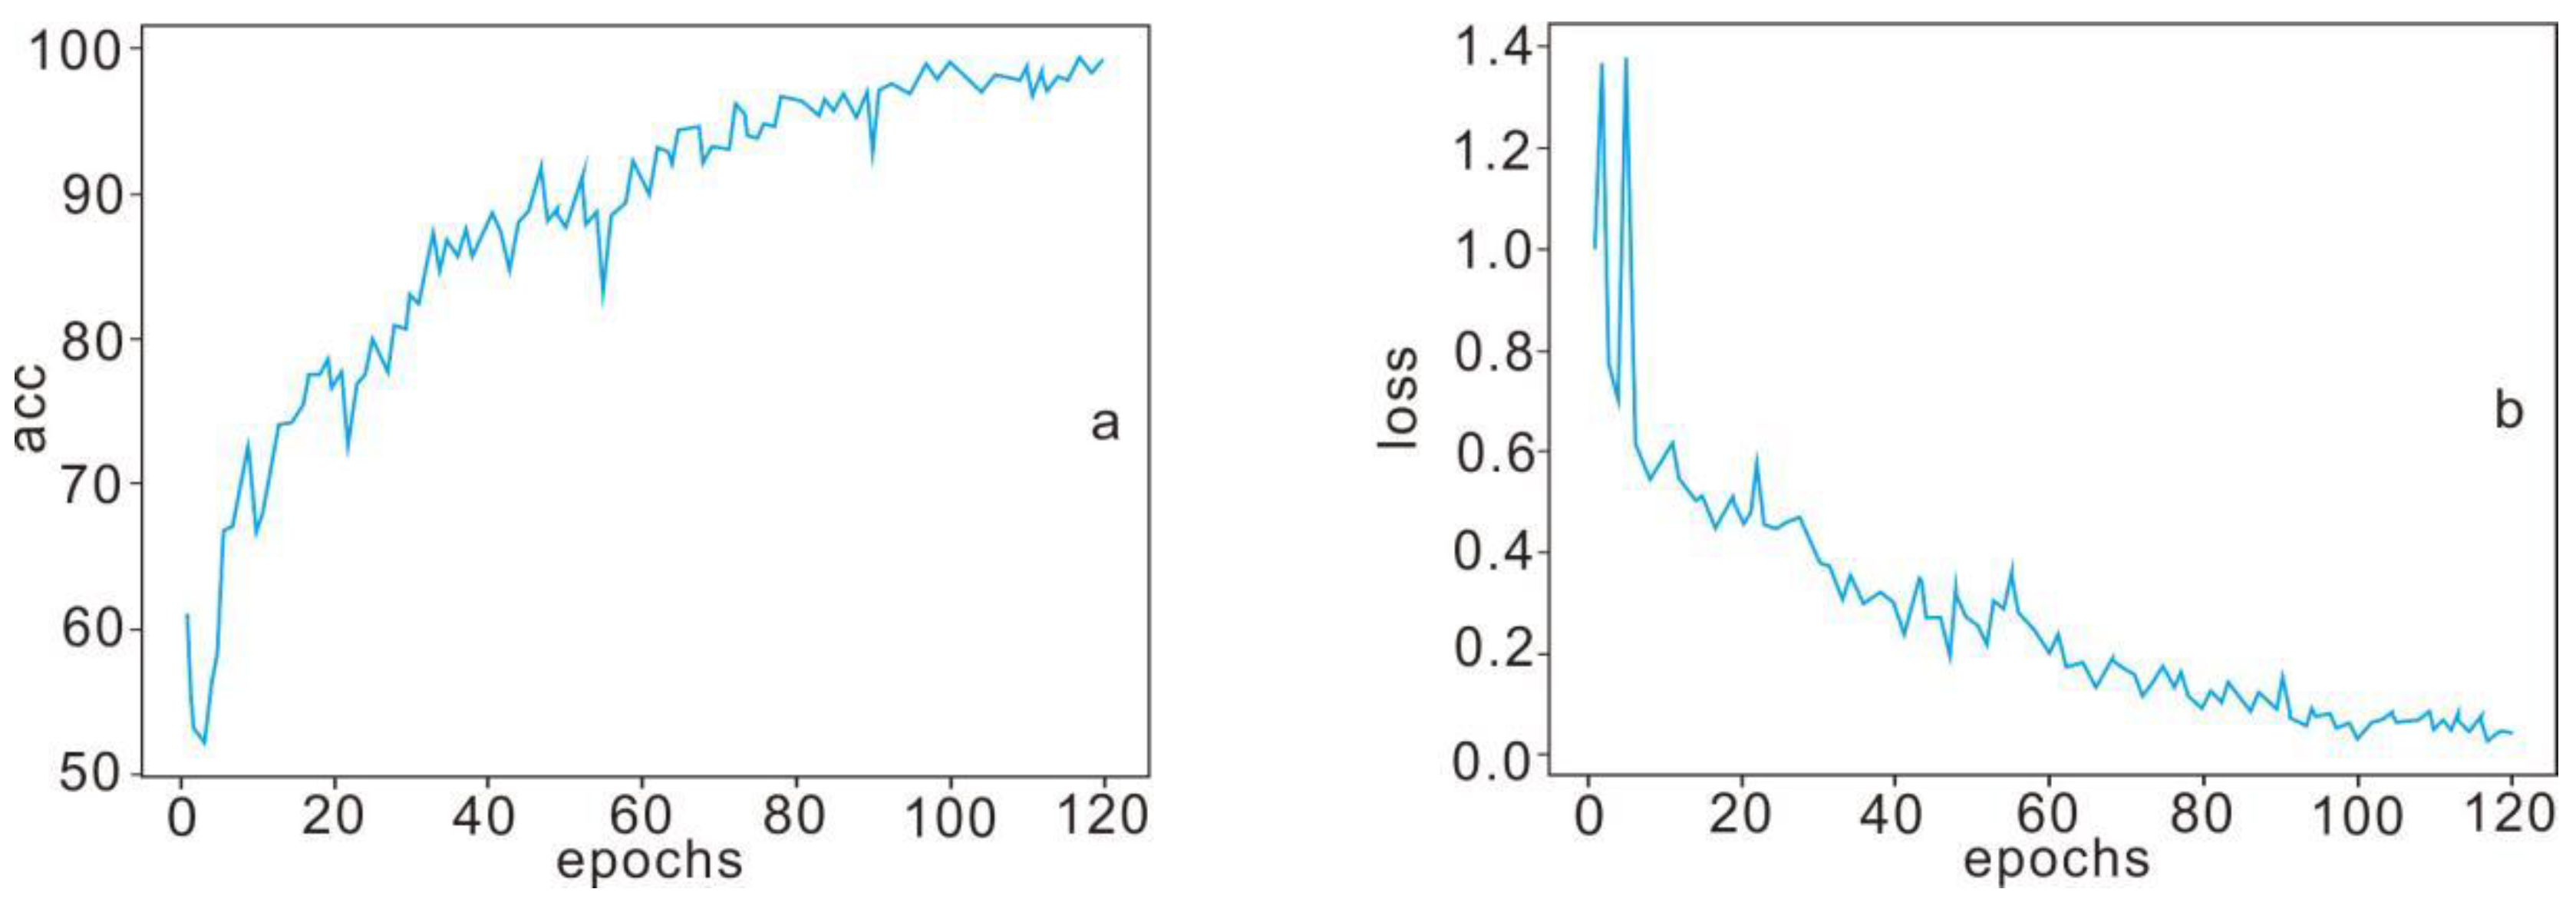
The training results of the experimental training set are shown in Figure 6. With the increase in training times, the loss of cross entropy decreases and the accuracy increases. Figure 6a shows the accuracy of training results. After the 60th iteration, the increase rate of accuracy began to decline until the 95th iteration began to stabilize, the accuracy rate was around 99% and the highest accuracy reached 99.31%. Figure 6b shows the cross-entropy loss image. The cross-entropy loss decreases after 40 iterations and becomes stable after 100 iterations. And the cross-entropy loss is about 0.04 and the lowest cross-entropy loss is 0.02381. The experimental results show that the model can predict the prospecting target area effectively after training.
In this study, accuracy AUC and F1 scores were used as indicators to evaluate the prediction performance of the neural network model. F1 score is an indicator to measure the performance of the binary model. F1 values of each category were calculated and then averaged. The evaluation index of the prediction results of this experiment are with an accuracy of 86.11%, AUC of 0.7454 and F1 score of 0.7653, respectively. The experiment shows that it is effective and reliable to use the existing geochemical data to train the neural network model and use the model to predict the ore target area.
Figure 7 is a visual display of prediction results. For 144 data in the test set, numbered from 1 to 144, a total of 23 regions are predicted to be favorable metallogenic target areas, and 121 regions are general areas. In 23, an advantage, including mining domain, numbers 27, 29, 50, 56, 62, 64, 66, 85, 96, 97, 107, 113, 141, 142, 143 consistent with research in the known ore target area, is given to illustrate the effectiveness of the model prediction results. While the eight regions, including 9, 38, 40, 95, 111, 114, 124, 144, are the metallogenic prospects predicted by this research model, and are not marked as ore area data at present, so it is predicted that these eight regions have great ore-bearing potential.
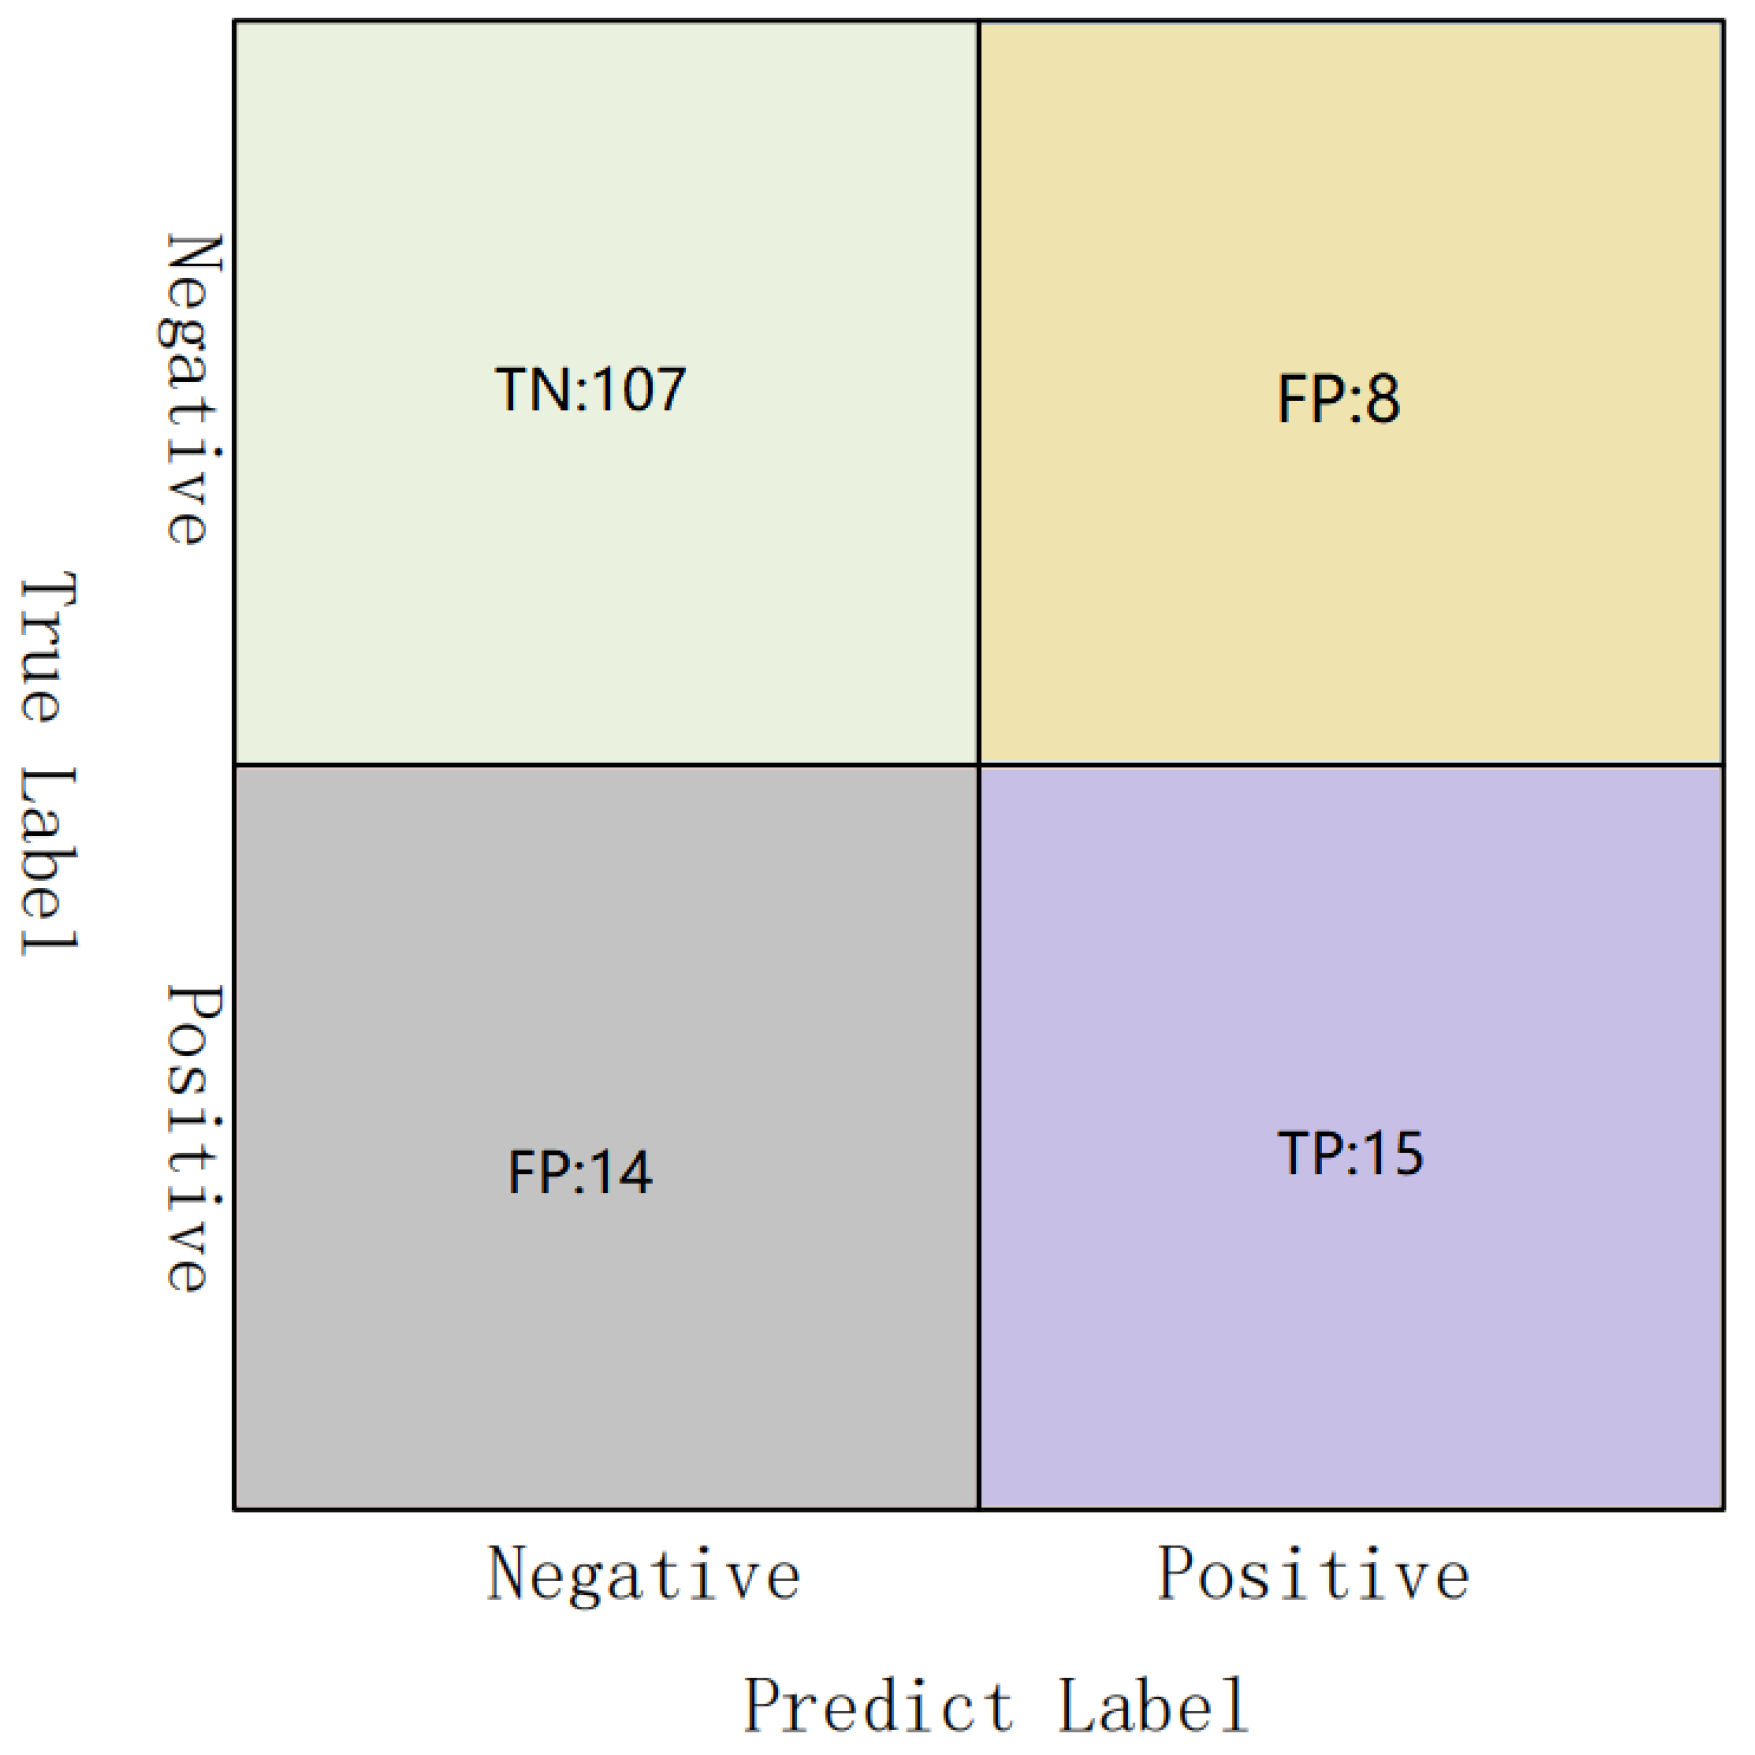
Figure 8 is a confusion matrix, showing the number of True Negative (TN), False Positive (FP), False Negative (FN) and True Positive (TP) samples. From the figure, we can see that TN is the highest, followed by TP. This proves that ResNet-50 can effectively identify samples without mines and has a certain effect on the prospecting target prediction.
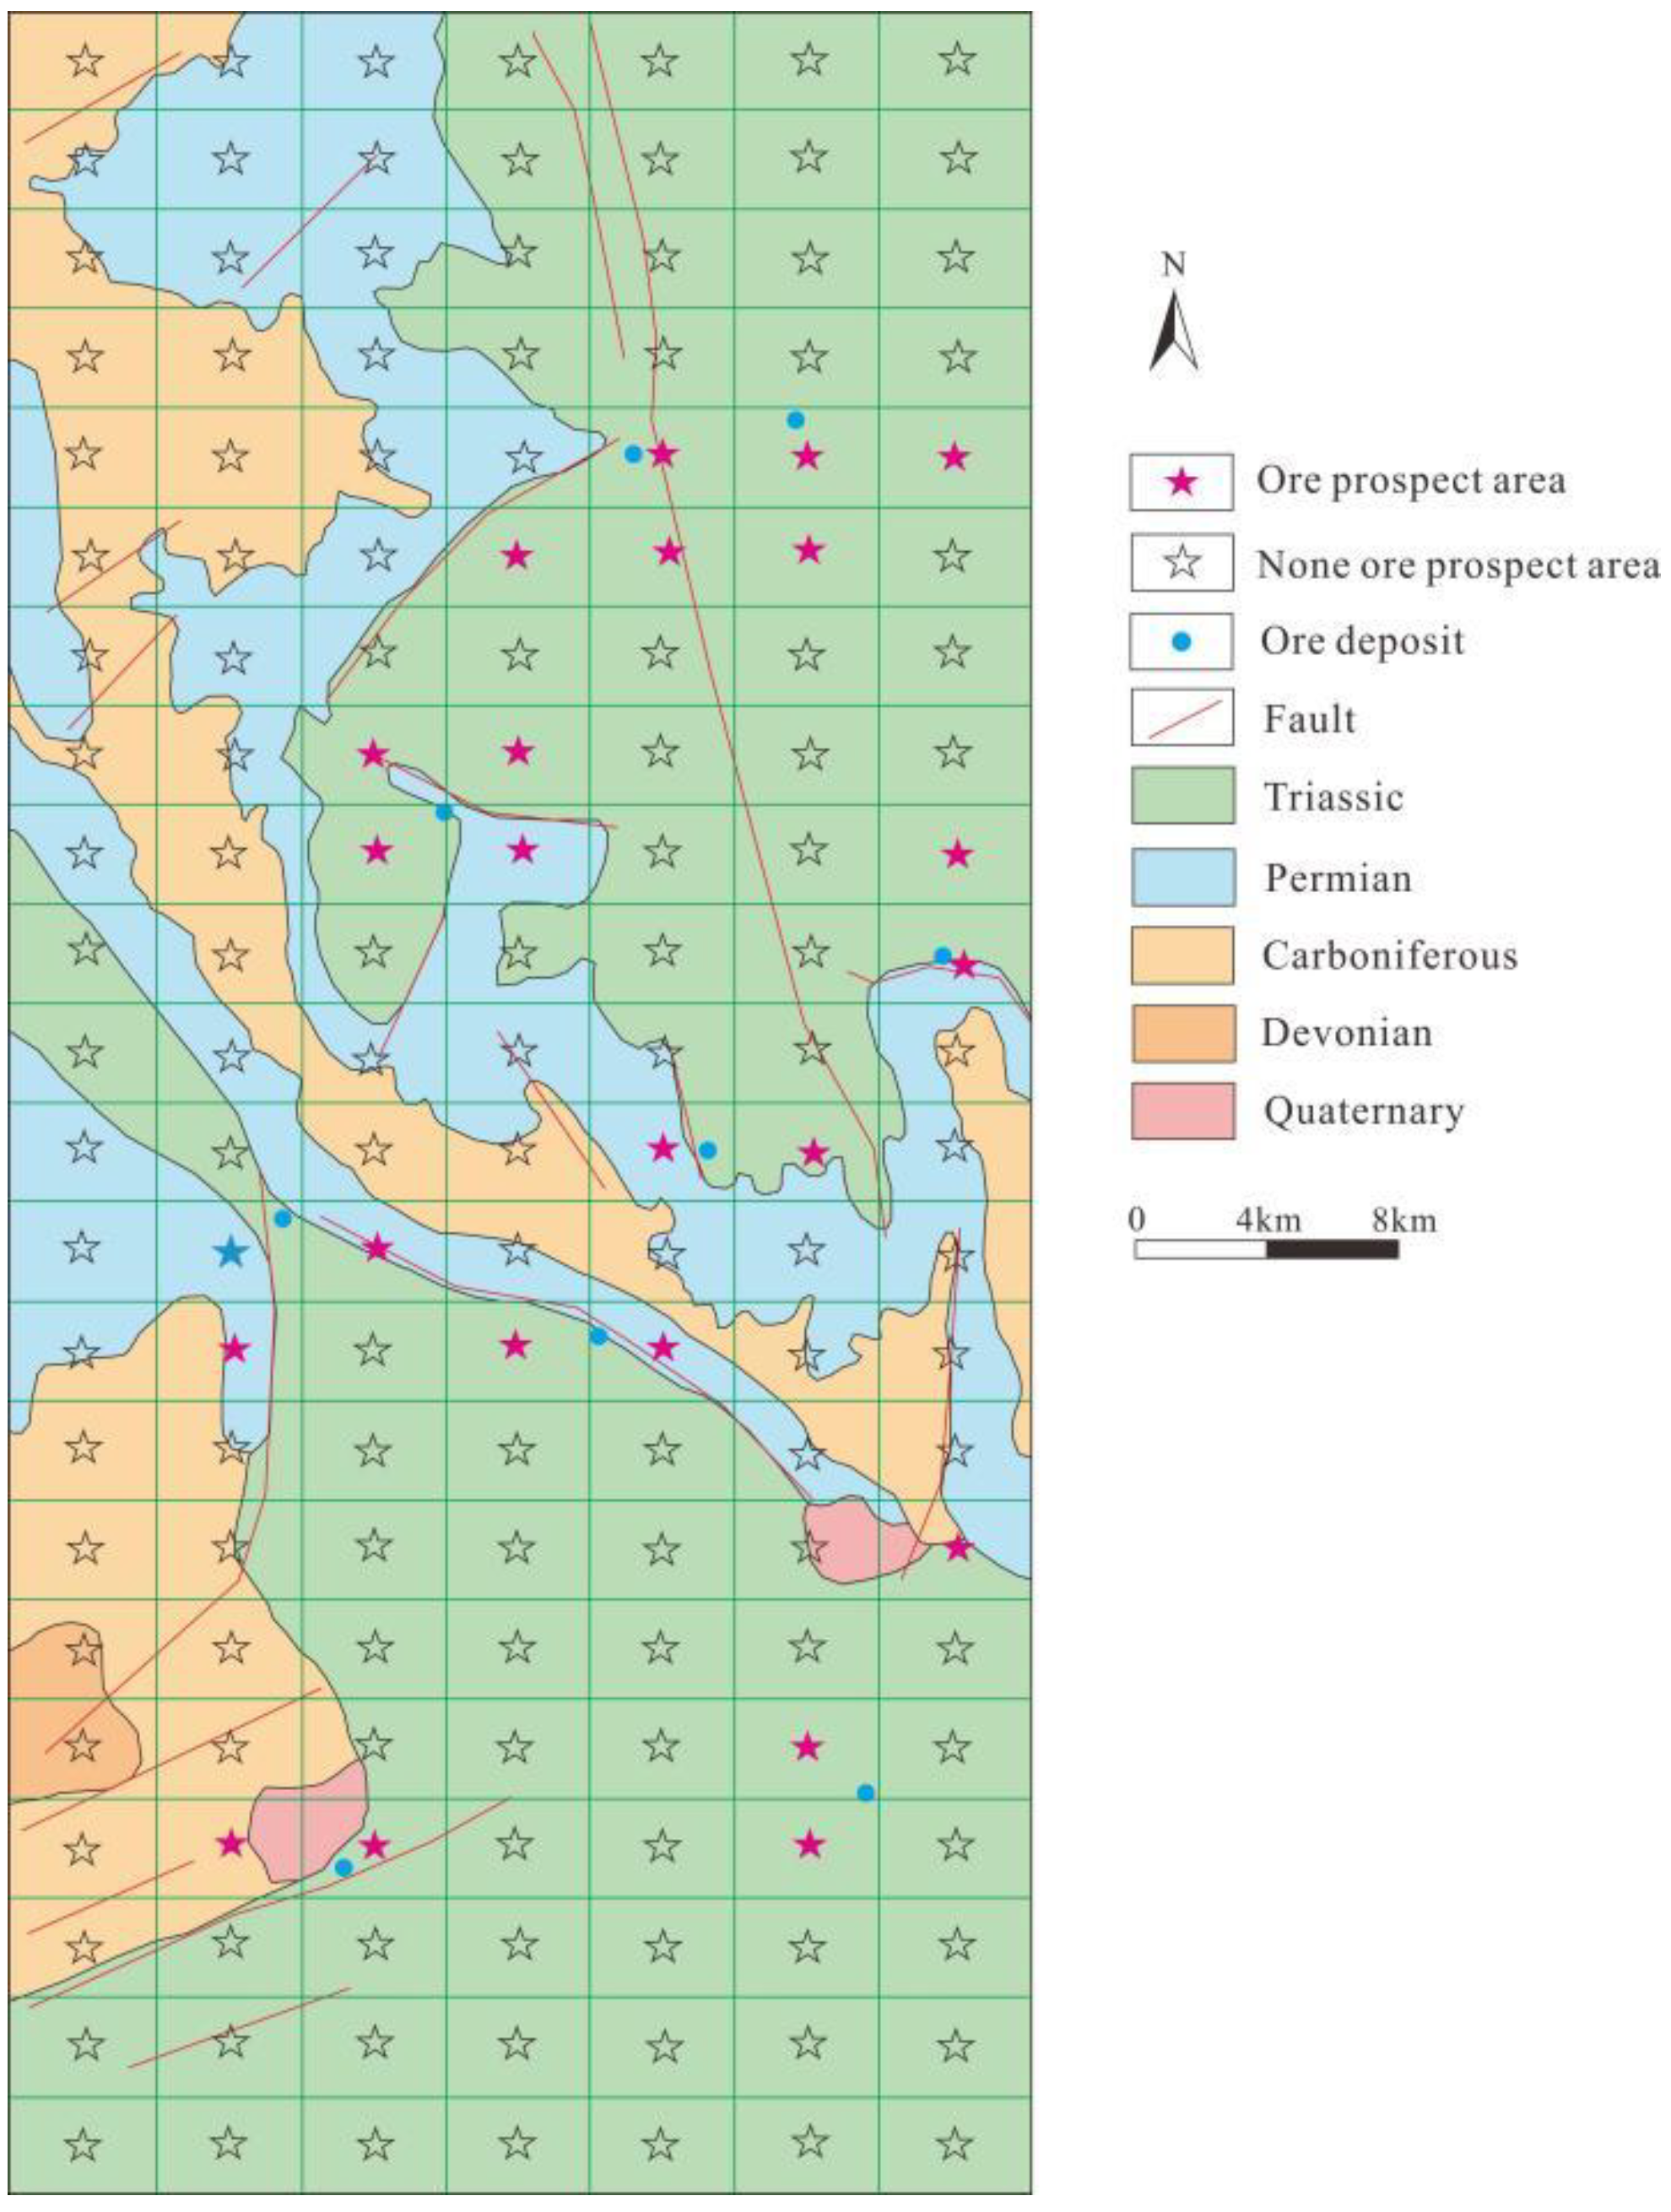
Finally, in order to verify the generality of the research method in this paper, we conducted experimental tests on the geochemical dataset of Area B, another deposit research area in South China. The prediction results are shown in Figure 9. The experimental results show that 100% of the predicted area obtained by the research method in this paper covers the known ore deposit area, and the experimental results also provide indicative significance for further delineating the prospecting target area in study area B.
5. Conclusions
Based on artificial intelligence deep learning, this paper uses the convolutional neural network to learn the spatial distribution relationship between stream sediment geochemical element datasets and known minerals in the Pangxidong research area, Guangdong Province. A variety of machine learning methods were used to construct and test the algorithm model, and metallogenic prediction and delineation of prospecting targets were carried out to explore the possibility of geological and mineral mineralization prediction based on the deep learning algorithm. The main conclusions are as follows:
(1) When the number of training samples of geological and mineral images is small, deep learning is also feasible for metallogenic prediction, which can achieve the goal of automatic data acquisition and metallogenic prediction by computer. In this study, through the ResNet-50 convolutional neural network, the goal of researchers’ input of geochemical and geological data and computer intelligent prediction has been preliminarily achieved.
(2) The support vector machine method was used to process 16 kinds of geochemical data to obtain the AUC value of each element, and then the ZAUC value was calculated by statistical method. The eight elements, Au, Sn, Cu, Ag, Ba, Sb, Hg and Mo, were identified as ore-related elements by comparison with the standard positive gravity distribution table. The influence of unrelated geochemical elements on the experiment is greatly reduced, and the complexity of the neural network model is also reduced.
(3) The convolutional neural network can effectively explore the coupling relationship between surface geochemical element concentration distribution and underground mineral space emplacement. After 95 training times in this study, the accuracy of the ResNet-50 convolutional neural network model is 99%, and the loss entropy is 0.04. We can consider that the neural network model is successfully trained and the accuracy is effective and reliable. The neural network model is scientific and effective in predicting the ore-forming target area in the experimental area.
(4) The study area was divided into 144 subregions (12 × 12), and the two trained models were used for prediction, and the experimental results confirmed each other. The accuracy of the experimental results was 86.11%. Among them, 15 ore-bearing regions coincide with the known ore-bearing regions. In addition, the model of this study predicts that these areas, numbered 9, 38, 40, 95, 111, 114, 124, 144, have a high probability of mineralization, which can be further studied and exploration recommendations can be made for these areas.
(5) In order to verify the generality of the research method in this paper, we conducted experimental tests on the geochemical dataset of study area B of the deposit. The experimental results show that 100% of the prediction area obtained by the research method in this paper covers the known ore deposit area, and the model provides a scientific basis for the prediction of metal ore in study area B, indicating that the model has universal applicability.
Author Contributions
L.G.: Formal analysis, Investigation, Funding management. Y.H.: Model building, Coding, Writing—original draft. Q.L.: Writing—original draft, Formal analysis. X.Z.: Data collection. Z.C.: Text proofreading, Model analysis. All authors have read and agreed to the published version of the manuscript.
Funding
This work was supported by the Wuyi University Youth Research Group Fund grant number (2019td10), Wuyi University Hongkong Macao Joint Research and Development Fund grant number (2019WGALH23) and National Natural Science Foundation of China grant number (U1911202).
Conflicts of Interest
The authors declare that they have no competing financial interests or personal relationships that could have appeared to influence the work reported in this paper.
References
- Zhao, P.; Chen, Y. Digital geology and quantitative mineral exploration. Earth Sci. Front. 2021, 28, 1–5. [Google Scholar] [CrossRef]
- Zhou, Z.H.; Chen, S.F. Neural Network Ensemble. Chin. J. Comput. 2002, 25, 1–8. [Google Scholar]
- Piotrowski, A.P.; Napiorkowski, J.J.; Piotrowska, A.E. Impact of deep learning-based dropout on shallow neural networks applied to stream temperature modelling. Earth-Sci. Rev. 2020, 201, 103076. [Google Scholar] [CrossRef]
- Wang, Y.; Luo, X.B.; Ding, L.; Fu, S.; Wei, X. Detection based visual tracking with convolutional neural network. Knowl.-Based Syst. 2019, 175, 62–71. [Google Scholar] [CrossRef]
- Cheng, Q. What are Mathematical Geosciences and its frontiers? Earth Sci. Front. 2021, 28, 6–25. [Google Scholar] [CrossRef]
- Tao, K.Y.; Xu, Y.P.; Wang, Y.H.; He, D. Source, sink and preservation of organic matter from a machine learning approach of polar lipid tracers in sediments and soils from the Yellow River and Bohai Sea, eastern China. Chem. Geol. 2021, 582, 120441. [Google Scholar] [CrossRef]
- Marzan, I.; Marti, D.; Lobo, A.; Alcalde, J.; Ruiz, M.; Alvarez-Marron, J.; Carbonell, R. Joint interpretation of geophysical data: Applying machine learning to the modeling of an evaporitic sequence in Villar de Cañas (Spain). Eng. Geol. 2021, 288, 106126. [Google Scholar] [CrossRef]
- Hopke, P.K.; Alpert, D.J.; Roscoe, B.A. Fantasia—A program for target transformation factor analysis to apportion sources in environmental samples. Comput. Chem. 1983, 7, 149–155. [Google Scholar] [CrossRef]
- Ma, Z.; Leung, J.Y. A knowledge-based heterogeneity characterization framework for 3D steam- assisted gravity drainage reservoirs. Knowl.-Based Syst. 2020, 192, 105327. [Google Scholar] [CrossRef]
- Xiao, C.; Leeuwenburgh, O.; Lin, H.X.; Heemink, A. Conditioning of deep-learning surrogate models to image data with application to reservoir characterization. Knowl.-Based Syst. 2021, 220, 106956. [Google Scholar] [CrossRef]
- Seers, T.D.; Sheharyar, A.; Tavani, S.; Corradetti, A. Virtual outcrop geology comes of age: The application of consumer- grade virtual reality hardware and software to digital outcrop data analysis. Comput. Geosci. 2022, 159, 105006. [Google Scholar] [CrossRef]
- Zhang, W.G.; Gu, X.; Tang, L.B.; Yin, Y.P.; Liu, D.S.; Zhang, Y.M. Application of machine learning, deep learning and optimization algorithms in geoengineering and geoscience: Comprehensive review and future challenge. Gondwana Res. 2022, 109, 1–17. [Google Scholar] [CrossRef]
- Hoyer, P.A.; Regelous, M.; Adatte, T.; Haase, K.M. Machine learning-based re-classification of the geochemical stratigraphy of the Rajahmundry Trap, India. J. Volcanol. Geotherm. Res. 2022, 428, 107594. [Google Scholar] [CrossRef]
- Zhou, Y.Z.; Zuo, R.G.; Liu, G. The great-leap-forward development of mathematical geoscience during 2010-2019: Big data and artificial intelligence algorithm are changing mathematical geoscience. Bull. Mineral. Petrol. Geochem. 2021, 40, 556–573. [Google Scholar] [CrossRef]
- Jena, R.; Pradhan, B.; Almazroui, M.; Assiri, M.; Park, H.J. Earthquake-induced liquefaction hazard mapping at national-scale in Australia using deep learning techniques. Geosci. Front. 2023, 14, 101460. [Google Scholar] [CrossRef]
- Li, G.H.; Choi, Y.J. HPC cluster-based user-defined data integration platform for deep learning in geoscience applications. Comput. Geosci. 2021, 155, 104868. [Google Scholar] [CrossRef]
- Xiong, Y.H.; Zuo, R.G.; Carranza, E.J.M. Mapping mineral prospectivity through big data analytics and a deep learning algorithm. Ore Geol. Rev. 2018, 102, 811–817. [Google Scholar] [CrossRef]
- Boroh, A.W.; Lawou, S.K.; Mfenjou, M.L.; Ngounouno, I. Comparison of geostatistical and machine learning models for predicting geochemical concentration of iron: Case of the Nkout iron deposit (south Cameroon). J. Afr. Earth Sci. 2022, 195, 104662. [Google Scholar] [CrossRef]
- Hao, H.Z.; Gu, Q.; Hu, X.M. Research advances and prospective in mineral intelligent identification based on machine learning. Earth Sci. 2021, 46, 3091–3106. [Google Scholar] [CrossRef]
- Guo, Y.; Zhou, Z.; Lin, H.; Liu, X.; Chen, D.; Zhu, J.; Wu, J. The mineral intelligence identification method based on deep learning algorithms. Earth Sci. Front. 2020, 27, 39–47. [Google Scholar] [CrossRef]
- Gao, L.; Zhou, Y.Z.; Wang, K.; Zeng, Z.Q.; Lu, Y.T.; Huang, Y.J. Application of partial least square modeling in stream sediment geochemical survey of stratabound lead-zinc mineralization in western Guangdong province. Geotecton. Et Metallog. 2020, 44, 258–266. [Google Scholar] [CrossRef]
- Chen, J.; Mao, X.C.; Liu, Z.K.; Deng, H. Three-dimensional Metallogenic Prediction Based on Random Forest Classification Algorithm for the Dayingezhuang Gold Deposit. Geotecton. Et Metallog. 2020, 44, 231–241. [Google Scholar] [CrossRef]
- Liu, Y.P.; Zhu, L.X.; Zhou, Y.Z. Experimental research on big data mining and intelligent prediction target area-application of convolutional neural network model. Geotecton. Et Metallog. 2020, 44, 192–202. [Google Scholar] [CrossRef]
- Li, S.; Chen, J.P.; Xiang, J. Two- dimensional prospecting prediction based on alexnet network: A case study of sedimentary Mn deposits in Songtao-Huayuan area. Geol. Bull. China 2019, 38, 2022–2032. [Google Scholar]
- Gao, L.; Liu, Q.Y.; Xu, S.T. Three-dimensional geological modeling of deposits and reserve estimation: A case study of the Jingkou ore block of the Fengcun Pb-Zb deposit. Geol. Explor. 2016, 52, 956–965. [Google Scholar] [CrossRef]
- Gao, L.; Lu, Y.T.; Yu, P.P. Three-dimensional visualization and quantitative prediction for mine: A case study in Xiayuandong Pb-Zn ore deposits, Pangxidong region, southern part of Qin-Hang metallogenic belt, China. Acta Petrol. Sin. 2017, 33, 767–778. [Google Scholar]
- Xiao, F.; Wang, K.Q.; Hou, W.S.; Erten, O. Identifying geochemical anomaly through spatially anisotropic singularity mapping: A case study from silver-gold deposit in Pangxidong district, SE China. J. Geochem. Explor. 2020, 210, 106453. [Google Scholar] [CrossRef]
- Palafox, L.F.; Hamilton, C.W. Automated detection of geological landforms on Mars using convolutional neural networks. Comput. Geosci. 2017, 101, 48–56. [Google Scholar] [CrossRef]
- Andresini, G.; Appice, A.; Malerba, D. Nearest cluster-based intrusion detection through convolutional neural networks. Knowl.-Based Syst. 2021, 216, 106798. [Google Scholar] [CrossRef]
- LeCun, Y.; Bottou, L.; Bengio, Y.; Haffner, P. Gradient-based learning applied to document recognition. Proc. IEEE 1998, 86, 2278–2324. [Google Scholar] [CrossRef] [Green Version]
- Zhou, F.Y.; Jin, L.P.; Dong, J. Review of convolutional neural network. Chin. J. Comput. 2017, 40, 1229–1251. [Google Scholar] [CrossRef]
- Krizhevsky, A.; Sutskever, I.; Hinton, G.E. ImageNet classification with deep convolutional neural networks. In Advances in Neural Information Processing Systems 25 (NIPS 2012), Proceedings of the NIPS, Lake Tahoe, NV, USA, 3–8 December 2012; Stanford University Press: Stanford, CA, USA, 2018; pp. 25–36. [Google Scholar]
- Simonyan, K.; Zisserman, A. Very deep convolutional networks for large-scale image recognition. Conference paper at ICLR. arXiv 2018, arXiv:1409.1556v6. [Google Scholar]
- Freeman, J. Content search within large environmental datasets using a convolution neural network. Comput. Geosci. 2020, 139, 104479. [Google Scholar] [CrossRef]
- He, K.M.; Zhang, X.Y.; Ren, S.Q.; Sun, J. Deep residual learning for image recognition. arXiv 2016, arXiv:1512.03385v. [Google Scholar]
- Liu, B.; Liu, Q.; Zhu, Z.Y. MSST- ResNet: Deep multi-scale spatiotemporal features for robust visual object tracking. Knowl. -Based Syst. 2019, 164, 235–252. [Google Scholar] [CrossRef]
- Lawrence, S.; Giles, C.L.; Tsoi, A.C.; Back, A.D. Face recognition: A convolutional neural-network approach. IEEE Trans. Neural Netw. Learn. Syst. 1997, 8, 98–113. [Google Scholar] [CrossRef] [Green Version]
- Long, J.; Shelhamer, E.; Darrell, T.; Berkeley, U. Fully convolutional networks for semantic segmentation. IEEE Trans. Pattern Anal. Mach. Intell. 2017, 39, 640–651. [Google Scholar] [CrossRef] [Green Version]
- Zheng, Z.Y.; Zhao, Q.Y.; Li, T.X.; Qiu, S.L. Comparison of two machine learning algorithms for geochemical anomaly detection. Glob. Geol. 2018, 37, 1288–1294. [Google Scholar] [CrossRef]
- Chen, Y.L.; Wu, W. Application of one-class support vector machine to quickly identify multivariate anomalies from geochemical exploration data. Geochem. Explor. Environ. Anal. 2017, 17, 231–238. [Google Scholar] [CrossRef]
- Lobo, J.M.; Jiménez-Valverde, A.; Real, R. AUC: A misleading measure of the performance of predictive distribution models. Glob. Ecol. Biogeogr. 2008, 17, 145–151. [Google Scholar] [CrossRef]
- Alfian, G.; Syafrudin, M.; Fahrurrozi, I.; Fitriyani, N.L.; Atmaji, F.T.D.; Widodo, T.; Bahiyah, N.; Benes, F.; Rhee, J. Predicting Breast Cancer from Risk Factors Using SVM and Extra-Trees-Based Feature Selection Method. Computers 2022, 11, 136. [Google Scholar] [CrossRef]
- Zuo, R.G.; Peng, Y.; Li, T.; Xiong, Y.H. Challenges of geological prospecting big data mining and integration using deep learning algorithms. Earth Sci. 2021, 46, 350–358. [Google Scholar] [CrossRef]
- Vrbančič, G.; Podgorelec, V. Efficient ensemble for image-based identification of Pneumonia utilizing deep CNN and SGD with warm restarts. Expert Syst. Appl. 2022, 187, 115834. [Google Scholar] [CrossRef]
- Wang, J.Y.; Joshi, G. Cooperative SGD: A Unified Framework for the Design and Analysis of Local-Update SGD Algorithms. J. Mach. Learn. Res. 2021, 22, 1–50. [Google Scholar]
- Sandler, M.; Howard, A.; Zhu, M.L.; Zhmoginov, A.; Chen, L.C. MobileNetV2: Inverted Residuals and Linear Bottlenecks. arXiv 2018, arXiv:1801.04381. [Google Scholar]
- Yang, N.; Zhang, Z.K.; Yang, J.H. A convolutional neural network of GoogLeNet applied in mineral prospectivity prediction based on multi-source geoinformation. Nat. Resour. Res. 2021, 30, 3905–3923. [Google Scholar] [CrossRef]
- Ma, N.N.; Zhang, X.Y.; Zheng, H.T.; Sun, J. ShuffleNet V2: Practical guidelines for efficient CNN architecture design. arXiv 2018, arXiv:1807.11164. [Google Scholar]
Figure 1.
The simple geological map of research area. (1, Quaternary; 2, Early-Yanshanian granite; 3, Late Yanshanian; 4, Upper Proterozoic migmatite; 5, Lower Member of Middle–Upper Proterozoic Fengdongkou Formation; 6, Upper Member of Middle–Upper Proterozoic Fengdongkou Formation; 7, Middle–Upper Proterozoic Lankeng Formation; 8, Devonian Yangxi Formation; 9, Devonian Laohutou Formation; 10, Devonian-Carboniferous Maozifeng Formation; 11, Devonian Xindu Formation; 12, Silurian Liantan Formation; 13, Faults; 14, Deposit).

Figure 2.
The structure chart of Resnet-50.

Figure 3.
The grid map of element concentration.

Figure 4.
The process of sliding the data.

Figure 5.
Test experimental data. (1, Quaternary; 2, Early-Yanshanian granite; 3, Late Yanshanian; 4, Upper Proterozoic migmatite; 5, Lower Member of Middle–Upper Proterozoic Fengdongkou Formation; 6, Upper Member of Middle–Upper Proterozoic Fengdongkou Formation; 7, Middle–Upper Proterozoic Lankeng Formation; 8, Devonian Yangxi Formation; 9, Devonian Laohutou Formation; 10, Devonian–Carboniferous Maozifeng Formation; 11, Devonian Xindu Formation; 12, Silurian Liantan Formation; 13, Faults; 14, Deposit; 15, Test data point).

Figure 6.
The accuracy and entropy loss of experiments.

Figure 7.
The prediction results. (1, Quaternary; 2, Early-Yanshanian granite; 3, Late Yanshanian; 4, Upper Proterozoic migmatite; 5, Lower Member of Middle–Upper Proterozoic Fengdongkou Formation; 6, Upper Member of Middle–Upper Proterozoic Fengdongkou Formation; 7, Middle–Upper Proterozoic Lankeng Formation; 8, Devonian Yangxi Formation; 9, Devonian Laohutou Formation; 10, Devonian–Carboniferous Maozifeng Formation; 11, Devonian Xindu Formation; 12, Silurian Liantan Formation; 13, Faults; 14, Deposit; 15, Predicting area).

Figure 8.
Confusion matrices.

Figure 9.
Mineral prediction results in study area B.


Table 1.
The AUC value and ZAUC value of each element.
| Element | AUC | ZAUC | Element | AUC | ZAUC |
|---|---|---|---|---|---|
| Au | 0.6024 | 2.8395 | B | 0.5901 | 2.4839 |
| Sn | 0.6065 | 2.9595 | Cu | 0.6311 | 3.6977 |
| Ag | 0.6762 | 5.1563 | Ba | 0.6147 | 3.2020 |
| Mn | 0.5573 | 1.5617 | Pb | 0.5778 | 2.1341 |
| Zn | 0.5450 | 1.2232 | As | 0.5655 | 1.7893 |
| Sb | 0.5942 | 2.6017 | Bi | 0.5901 | 2.4839 |
| Hg | 0.6393 | 3.9516 | Mo | 0.5983 | 2.7203 |
| W | 0.5778 | 2.1341 | F | 0.5696 | 1.9037 |
Publisher’s Note: MDPI stays neutral with regard to jurisdictional claims in published maps and institutional affiliations. |
© 2022 by the authors. Licensee MDPI, Basel, Switzerland. This article is an open access article distributed under the terms and conditions of the Creative Commons Attribution (CC BY) license (https://creativecommons.org/licenses/by/4.0/).
Share and Cite
MDPI and ACS Style
Gao, L.; Huang, Y.; Zhang, X.; Liu, Q.; Chen, Z. Prediction of Prospecting Target Based on ResNet Convolutional Neural Network. Appl. Sci. 2022, 12, 11433. https://0-doi-org.brum.beds.ac.uk/10.3390/app122211433
AMA Style
Gao L, Huang Y, Zhang X, Liu Q, Chen Z. Prediction of Prospecting Target Based on ResNet Convolutional Neural Network. Applied Sciences. 2022; 12(22):11433. https://0-doi-org.brum.beds.ac.uk/10.3390/app122211433
Chicago/Turabian StyleGao, Le, Yongjie Huang, Xin Zhang, Qiyuan Liu, and Zequn Chen. 2022. "Prediction of Prospecting Target Based on ResNet Convolutional Neural Network" Applied Sciences 12, no. 22: 11433. https://0-doi-org.brum.beds.ac.uk/10.3390/app122211433
Note that from the first issue of 2016, this journal uses article numbers instead of page numbers. See further details here.