
Numerical Study on the Flow Past Three Cylinders in Equilateral-Triangular Arrangement at Re = 3 × 10⁶

1
Key Laboratory for Mechanics in Fluid Solid Coupling Systems, Institute of Mechanics, Chinese Academy of Sciences, Beijing 100190, China
2
School of Engineering Science, University of Chinese Academy of Sciences, Beijing 100049, China
*
Author to whom correspondence should be addressed.
Appl. Sci. 2022, 12(22), 11835; https://0-doi-org.brum.beds.ac.uk/10.3390/app122211835
Submission received: 29 October 2022
/
Revised: 15 November 2022
/
Accepted: 17 November 2022
/
Published: 21 November 2022
(This article belongs to the Topic Fluid Mechanics)
Abstract
:One of the most common systems in engineering problems is the multi-column system in the form of an equilateral-triangular arrangement. This study used three-dimensional numerical simulations to investigate the flow around three cylinders in this arrangement at the super-critical Reynolds number , concentrating on the influence on the spacing ratio () among cylinders. The instantaneous vortex structures, Strouhal numbers, fluid force coefficients, and pressure distributions are analyzed thoroughly. The present study demonstrated that fluid dynamics is sensitive to , by which five different flow patterns are classified, namely single bluff body flow (), deflected gap flow (), anti-phase flow (), in-phase flow (), and co-shedding flow (). Critical bounds are identified by significant transitions in the flow structure, discontinuous drop and jump of , and force coefficients.
1. Introduction
Manifold cylindrical structures are often used in mechanic practices and industries, such as tower groups, chimneys, and offshore platforms. Flow separation, reattachment, vortex impingement, and flow-induced motion (FIM) may occur in these systems due to the interaction between the flow and cylindrical structures [1]. Particularly, an equilateral-triangular configuration comprising three cylinders is widely encountered in marine and offshore engineering [2,3,4]. While extensive studies on the flow around two cylinders (with side-by-side or tandem arrangement) have been reported, the flow around three cylinders, particularly at high Reynolds numbers, has received less attention. (, where is the velocity of the incoming flow, D is the diameter of the cylinder, and is the kinematic viscosity of the fluid.) In practice, however, turbulent flow is a more frequently encountered situation than laminar flow at low Reynolds numbers, but research on flow past cylinders in the super-critical flow regime is scant. In this study, the fluid forces, spectral characteristics, wake structure and their interactions with three equilateral cylinders are investigated, which support a thorough comprehension of fluid dynamics of flow around cylinders.
The spacing ratio , where L is the separation between the centers of the two cylinders and D is the diameter, can be used to categorize the flow patterns for two cylinders in tandem form [5]. Sumner et al. [6] investigated three flow patterns of the flow around two tandem cylinders for at by particle image velocimetry (PIV). When = , the flow field is comparable to a single bluff body. When = 1.5 and 2, the shear-layer reattachment flow features are noticed. When = 2.5 and 3, the flow feature of each cylinder is similar to that in the case of a single cylinder. For two cylinders arranged side by side, Sumner [7] suggested identifying the flow regimes into three types. When –, the two cylinders act like one bluff body. When ––, a biased flow pattern shows up. When –, cylinders behave more independent and show parallel vortex streets. More details of the wake flow of two cylinders at variable and are summarized by Sumner [7].
For three cylinders in tandem and side-by-side layout, the flow patterns, force coefficients, and pressure distributions have been investigated [8,9,10]. More complicated than a tandem or side-by-side layout is the flow past through three cylinders arranged in a triangle. Sayers [11] measured the drag and lift force coefficients of one of the three cylinders in triangular arrangement at and with various incidence angles (). Only one cylinder was measured, so the interference between the cylinders is not clear. The vortex-shedding-frequency data of three cylinders in an equilateral triangle configuration at and at various incidence angles and were obtained by Lam et al. [12] using a dye-injection approach to visualize the flow. Bi-stable flow characteristics were observed at , and they depend on the starting conditions. The static pressures of each cylinder were individually measured by Tatsuno et al. [13]. The results show that when the spacing ratio is small, the impacts of the flow interference are obvious. By conducting wind tunnel studies, Gu et al. [14] categorized the flow pattern of the three cylinders arranged in an equilateral triangle. It shows that the incidence angle has a huge influence on the pressure distribution on each cylinder and the flow patterns. Four basic levels of interference (small, transition, medium, large spacing) are identified according to the spacing ratio. Furthermore, according to the various incidence angles, the interference type can be identified as proximity effect, shear layer reattachment effect, and wake effect. Pouryoussefi et al. [15] carried out wind tunnel experiments with five subcritical Reynolds numbers at the incidence angle (one cylinder in the upstream and others in the downstream). They showed that as increases, the mean drag coefficient of all cylinders almost increases. When and 2, the downstream cylinders’ drag coefficients reach their lowest value since there is no vortex shedding from them. Bansal et al. [16] investigated the influence of the incidence angle (–) when the and by PIV and laser Doppler velocimetry. They found that large-scale vortexes shed at about downstream from the cylinders for all incidence angles. Yang et al. [17] investigated the effects of (2.8–5.2) and incidence angle (–) on the flow around an equilateral-triangular-arranged three-cylinder cluster at . They classified the flow pattern into two categories, short-spacing ratio shear-layer reattachment regime and big-spacing ratio vortex-shedding regime, respectively. In addition, the influence of the incidence angle is more complex and dependent on the spacing ratio.
Meanwhile, a number of numerical simulations on this three-cylinder configuration have been performed over the past decades. Yan et al. [18] investigated the influence of the spacing ratio (–5) and the incidence angle (, , ) on the flow patterns at by two-dimensional simulation. Yang et al. [19] investigated the characteristic flow regions of three cylinders by the lattice Boltzmann method and fluorescence flow visualization using a laser. They demonstrated that for and , two different types of flow patterns can be distinguished by , where S is the distance between the centers of the cylinders in the upstream and downstream, and T is the distance between the centers of the two cylinders in the downstream. When and , typical steady flow occurs, when and , typical unsteady flow occurs. By using the 2D finite volume approach, Zheng et al. [20] examined the effects of the (1.5–7) and Reynolds number (100–200) on the flow characteristics of three identical cylinders organized in an equilateral-triangular arrangement at incidence angles of and . By using the immersed boundary approach, Chen at al. [21] carefully explored the impact of , Reynolds number, and three-dimensionality on the fluid dynamics of the flow past three circular cylinders arranged in an equilateral-triangular arrangement. Six flow patterns depending on at were observed: single bluff-body flow (), deflected flow (), flip-flopping flow (), anti-phase flow ( and ), in-phase flow ( and ), and fully developed in-phase co-shedding flow (). In addition, some research of the flow configuration in the sub-critical regime were studied by the numerical method. Gao et al. [22] simulated the flow past three circular cylinders with the incidence angle of for and and five flow patterns were identified. The vortex shedding’s three-dimensionality grows stronger as the Reynolds number increases.
From the review of the relevant studies, it can be observed that the majority of the numerical and experimental research works were carried out in the laminar and sub-critical flow regime. Nevertheless, the Reynolds number is often between – in the majority of real circumstances, such as offshore engineering, which correspond to the super-critical regime and post-critical regime, respectively [23]. In this paper, we focus on the super-critical flow regime, the Reynolds number as high as . In super-critical flow, a rapid transition happens from laminar boundary layer to turbulent boundary layer. It is necessary to conduct a more comprehensive investigation into the flow structure and behavior of the three cylinders when they are arranged in an equilateral triangle at high Reynolds numbers. Schewe [24] carried out wind tunnel tests to achieve the force measurements of single cylinder from the Reynolds number to , corresponding to the sub-critical and post-critical regime, respectively. It was observed that the Strouhal number () increased while the value decreased at . Hinsberg [25] measured the unsteady aerodynamic forces and surface pressure of a rough single cylinder at . The results showed that the three-dimensional characteristics of the flow in spanwise direction became strong especially in the critical regime. In addition, the wake width became narrower and the drag coefficient decreased, which was observed by Rodriguez et al. [26], too. As for two tandem cylinders, Okajima [27] measured and by low-speed wind tunnel tests. It was observed that when the Reynolds number came to the super-critical regime, the jump of disappeared at = 3.8 and the effect of on and became weaker. Hu et al. [23] investigated the tandem cylinders’ flow characteristics in the sub-critical and super-critical regimes. When compared to the examples in the sub-critical regime, the vortex shedding frequencies are higher in the super-critical domain. Moreover, the flow separation positions move backward along the cylinder surface, which causes the reattachment position on the back cylinder to shift forward in the super-critical regime.
In summary, few systematic study have been conducted on the flow around three cylinders in equilateral-triangular configuration in the super-critical regime. In the present paper, a three-dimensional numerical simulation of flow past three cylinders in equilateral-triangular arrangement in super-critical regimes () is presented at a spacing ratio of , focusing on how fluctuating forces, flow separation, and vortex shedding frequencies vary with . Five flow patterns are identified by spacing ratio and the characteristics of each pattern are summarized.
2. Numerical Models
2.1. Numerical Method
Detached-eddy simulation (DES) model was first carried out by Spalart [28] to compensate the lack of Reynolds-Averaged Navier–Stokes (RANS) in unsteady turbulence prediction and avoid the heavy demand of grid and computation of Large-Eddy Simulation (LES). Then, for the purpose of solving the modeled stress depletion (MSD), delayed-detached eddy simulation (DDES) was carried out by Spalart [29]. DDES introduces the second length scale of turbulence model in its length scale instead of filter scale of LES. Shur et al. [30] introduced an improved delayed-detached eddy simulation (IDDES), which combines DDES and LES for wall modeling. In the IDDES method, the model stress loss issue from the original DES technique is removed using the DDES length scale, and the boundary layers are predicted using WMLES. In the recent years, this hybrid approach has been widely utilized to examine separated flows which are unstable and geometrically associated [31]. Wang et al. [32] used the IDDES method to perform the reverse flow past an NACA0012 airfoil and had satisfactory results compared to experimental measurements. Moreover, in the field of high-speed train aerodynamics simulations which have complex shapes and usually high Reynolds numbers, the IDDES method is quite popular among scholars due to its capacity of capturing the train wake flow and vortex structures [31,33,34,35]. Hence, IDDES is adopted in the present study.
The key point of IDDES is to modify the dissipation component in the governing equation for the turbulent kinetic energy equation. The governing equations for the kinetic energy k are written as
where ; is the fluid density; is the time; is the velocity; is the position; is the Reynolds stress tensor; is the mean strain rate tensor; is the laminar viscosity coefficient; is model coefficient; is the turbulent eddy viscosity. The IDDES model defines the length scale as
where ; is the distance to the closest wall boundary; represents the maximum of the local grid scales; , is a constant calculated by the blending function
with is 0.61 and is 0.78; is a blending function defined as
with
where is 20 and is the von Karman constant; is elevating function defined as
with
Please consult Shur et al. [30] for more information.
Numerical simulations are carried out by the STAR-CCM+ 13.06, which is based on the finite-volume method (FVM). For the temporal discretization, a second-order implicit scheme is used. Pressure–velocity coupling is based on the density implicit with the SIMPLE method. A second-order upwind scheme is employed for spatial discretization. In this study, 128 CPUs with 24 h for each case are used for simulation.
2.2. Boundary Conditions and Grid System
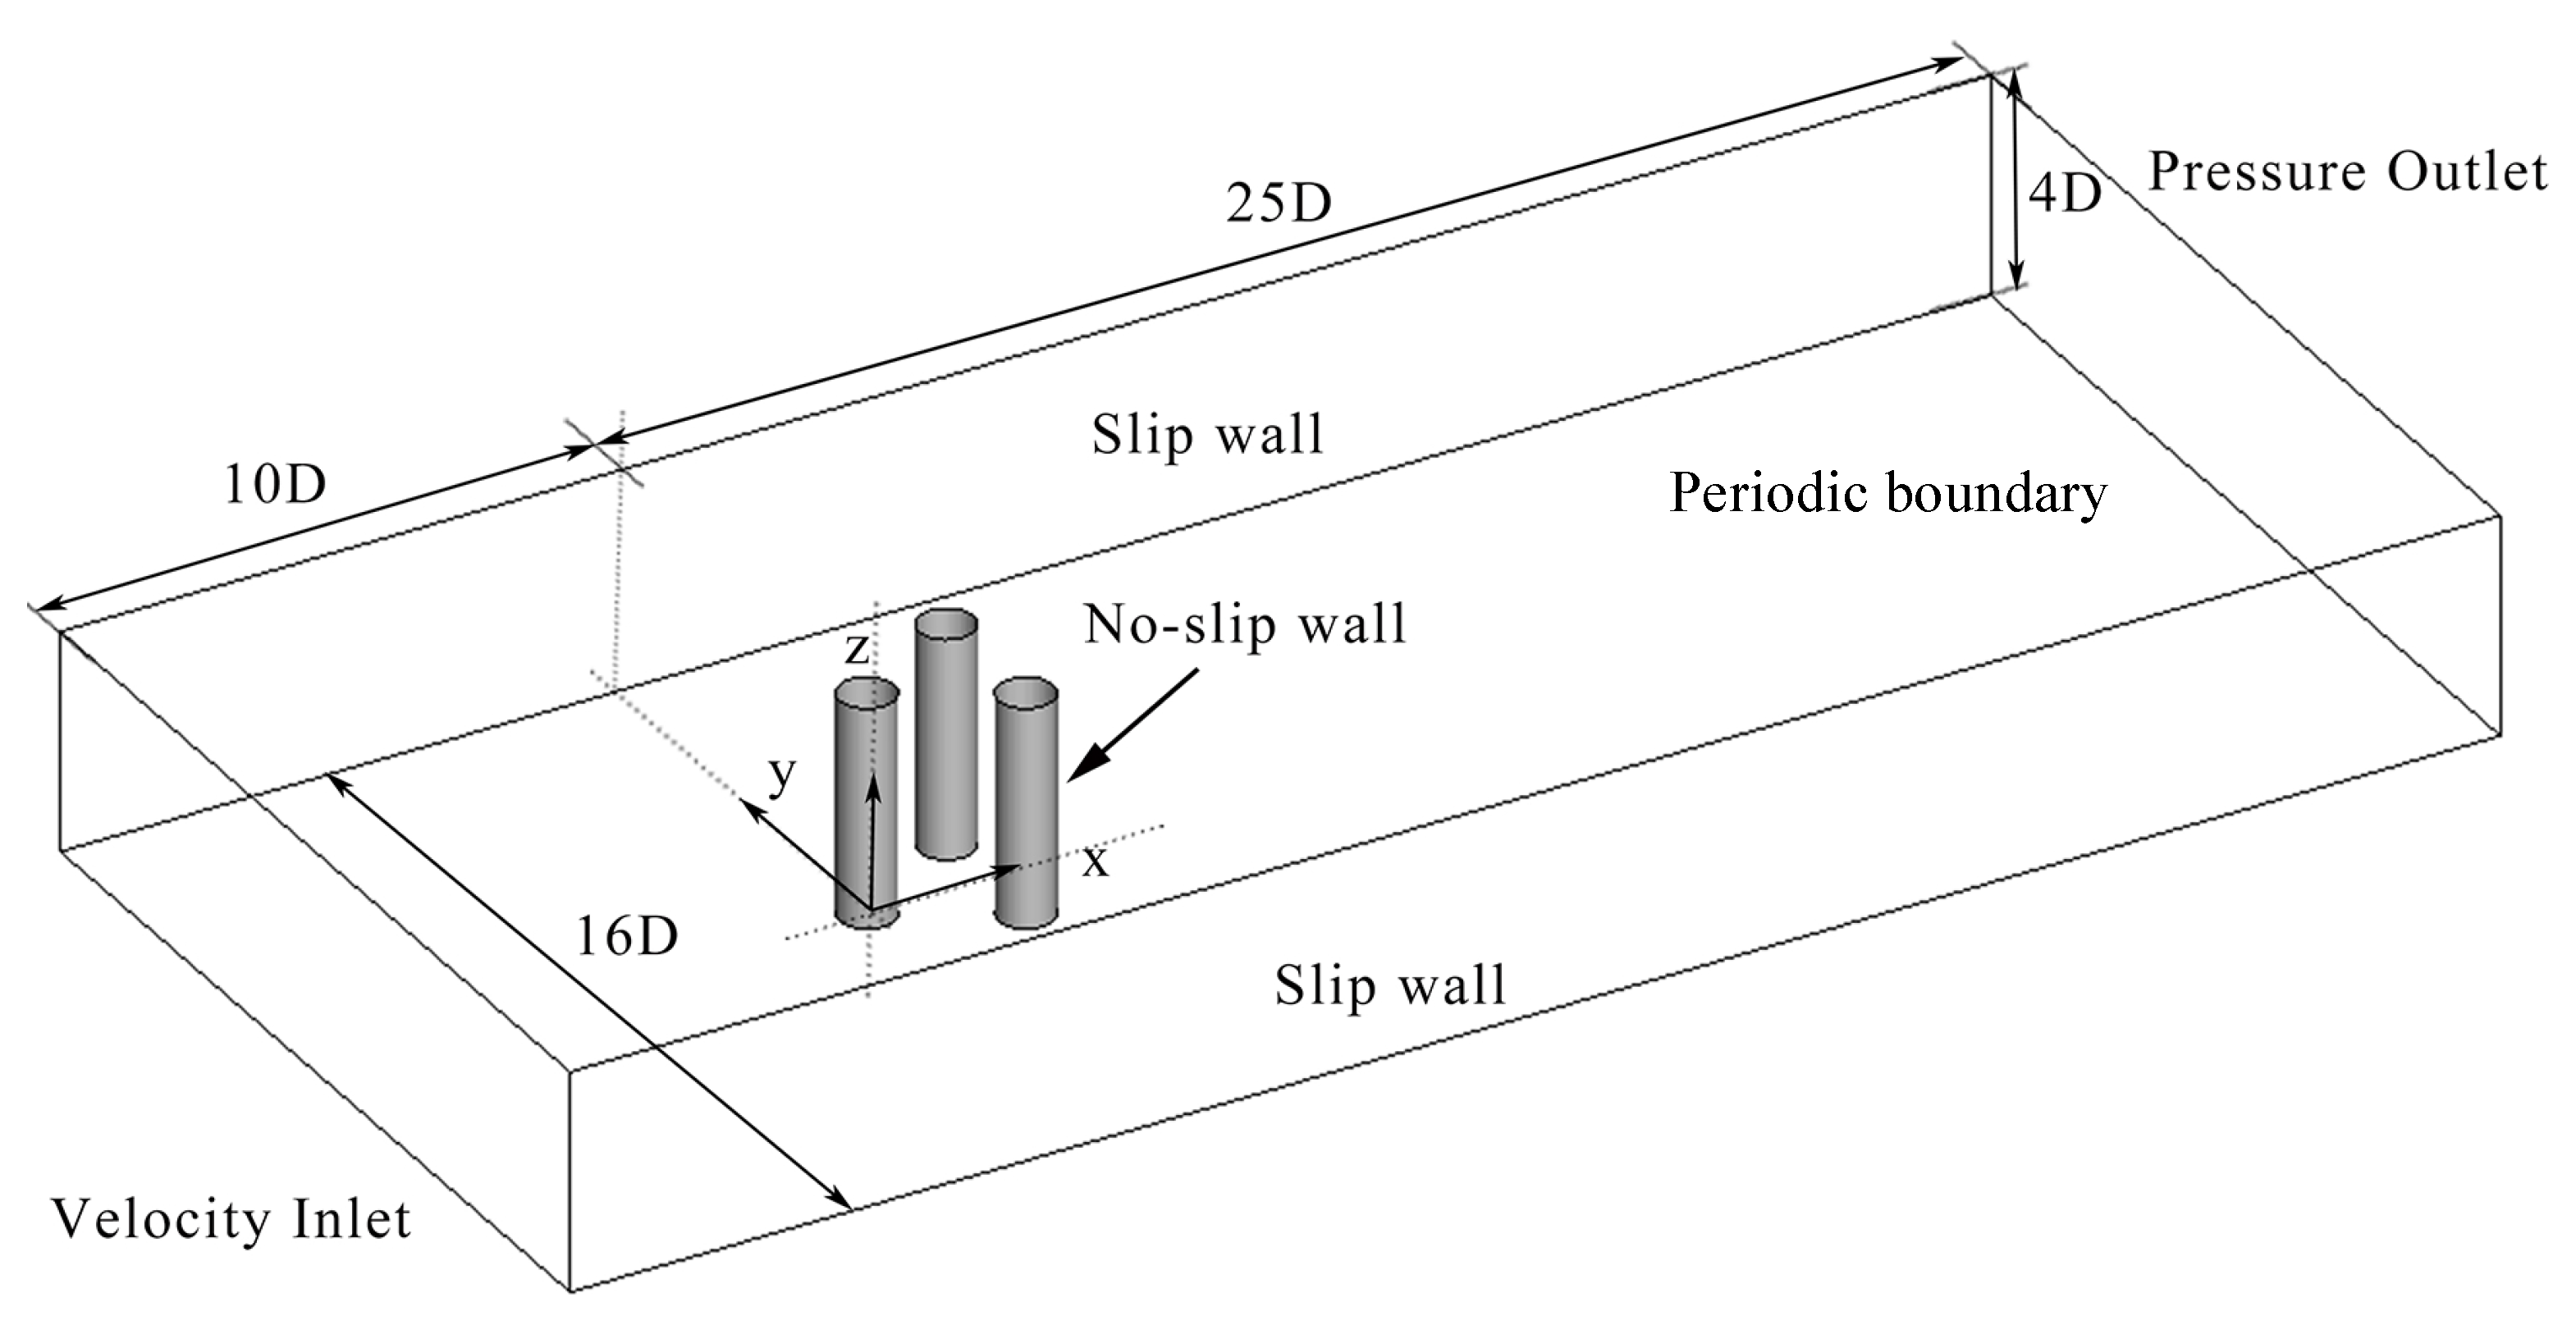
The computational domain and the boundary conditions of the present study are displayed in Figure 1. The simulation is 2.5D. The cylinder in the upstream is named Cylinder A and the cylinder in the downstream is named Cylinder B (+y-direction) and C (−y-direction), as shown in Figure 2a. Cylinder A is located in the middle of the domain in the y-direction, and the distance from inlet boundary to the center of the Cylinder A is . The computation domain is (D is the diameter of the cylinder, which is 1 m in the present paper) in the x-direction and in the y-direction. The size of the domain in the z-direction is , which has been proved long enough to capture the relevant flow structure [36,37]. The inlet boundary condition is set as velocity inlet boundary. The outlet boundary is set as a pressure outlet boundary. Periodic boundary conditions are set at spanwise boundaries (z-direction). As for the inlet boundary, turbulence viscosity is 5 times the molecular viscosity. Because when in the super-critical Reynolds regime, the transition in the boundary layer is turbulent. No-slip wall boundary conditions are set at the cylinder surfaces.
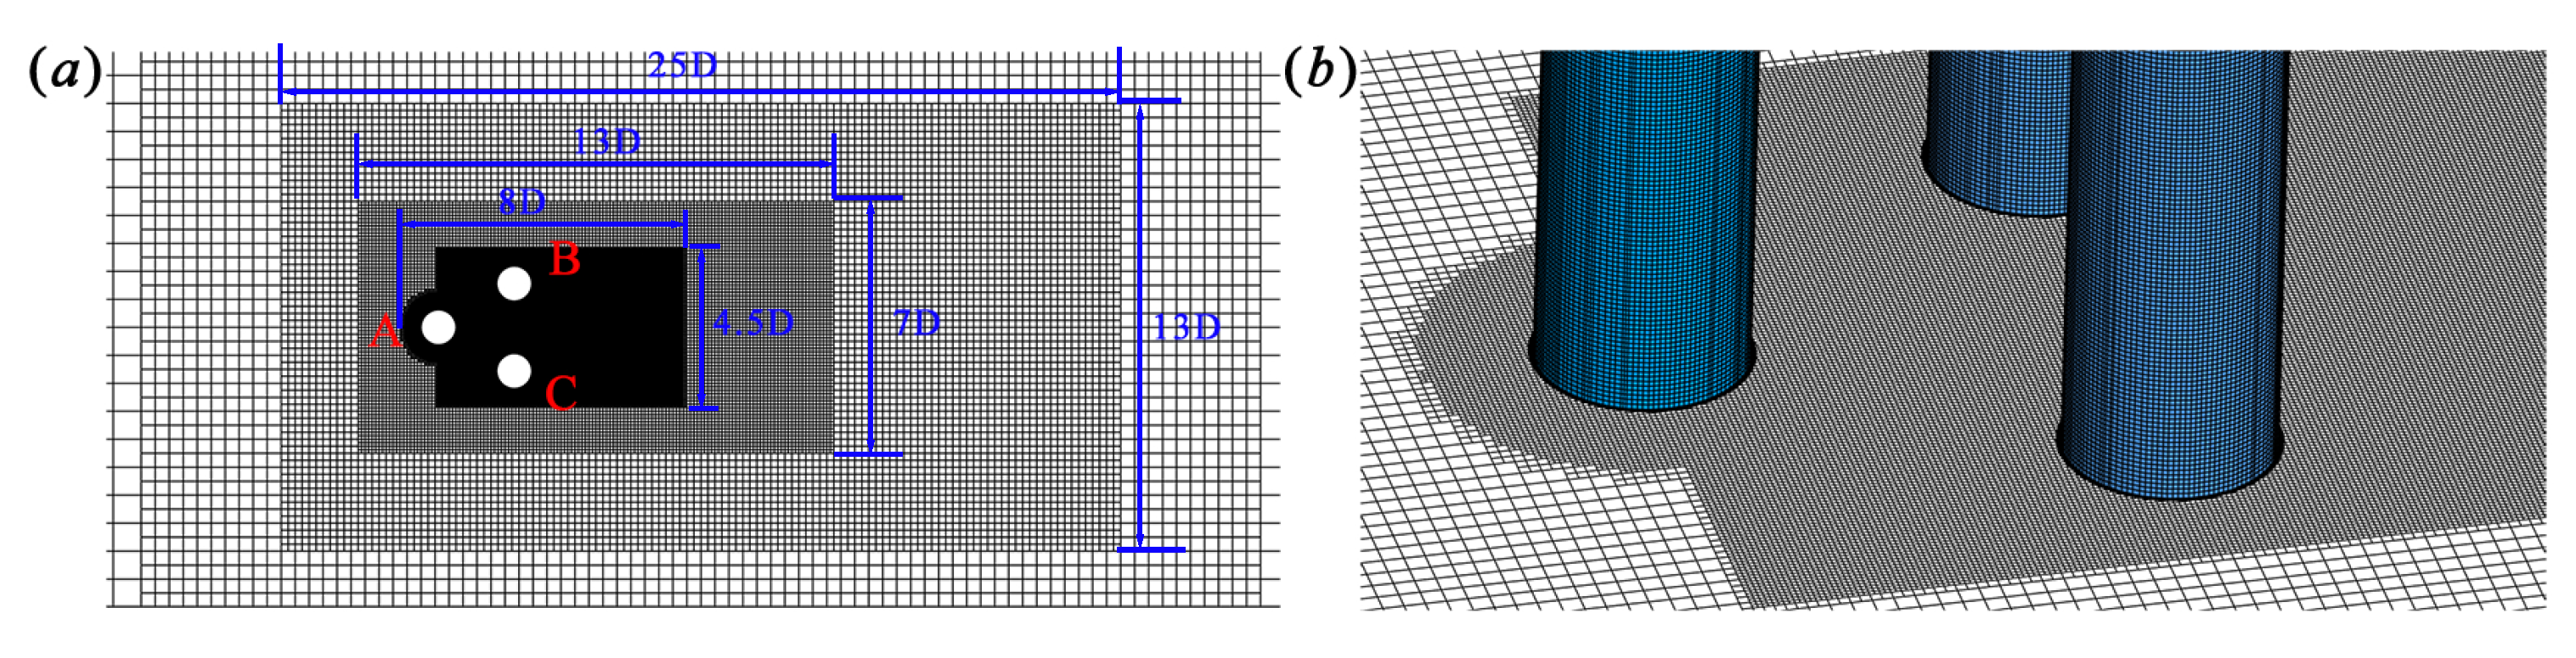
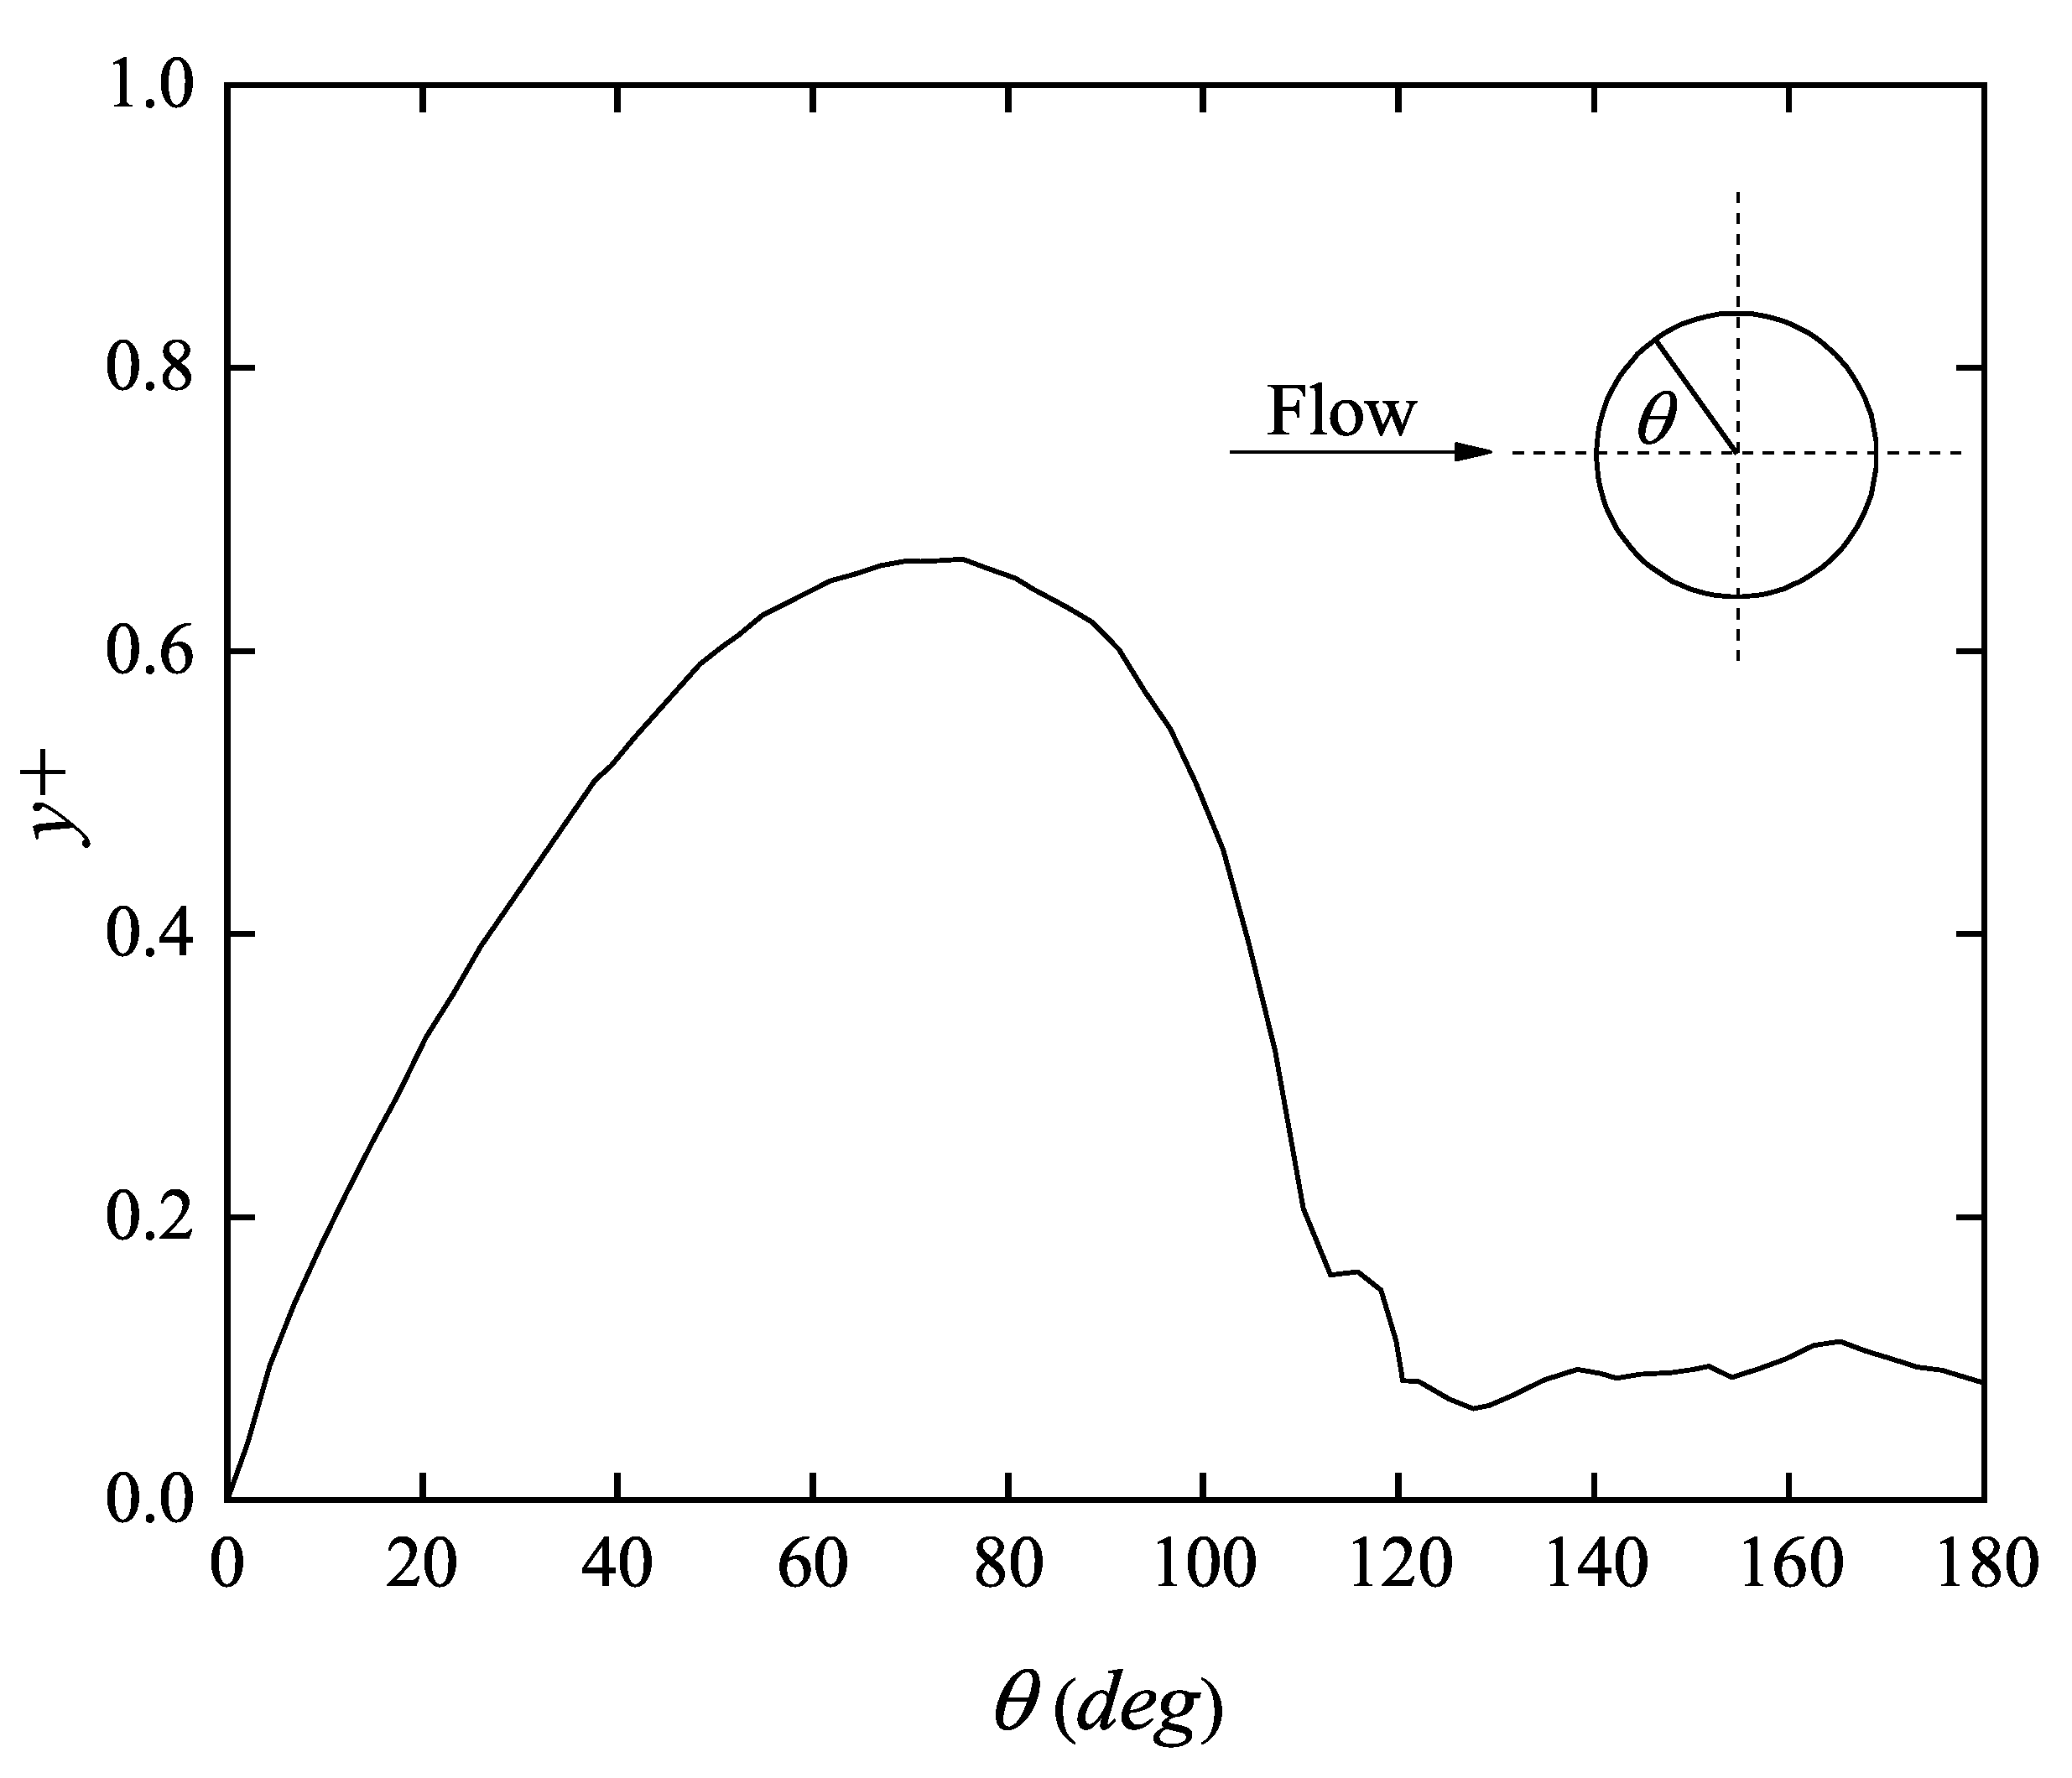
The computing mesh of the case when (L is the distance between the centers of either two cylinders) is shown in Figure 2. A trimmed mesh is adopted in all the cases. The grids are refined in the region near the cylinder system. The size of each refined mesh region is illustrated in Figure 2a. The finest grid size is 0.025D. Grid size increases by a factor of 2. The grid is the same size in x, y, and z-directions. In the spanwise direction, for the finest grid region, there are 160 cells. The boundary layers are set to be 40 layers to keep , as shown in Figure 3. The total number of the cells for is 10 million when . As the increases, the total number of cells increases, too. As for temporal discretization, the time-step is to ensure the maximum Courant number (defined as ) less than 1. Ten internal iterations exist in each time step. In this paper, the diameter of the cylinder (D) is set to 1 m, the flow velocity () is 47.02 m/s, fluid density () is 1.225 kg/m, and the dynamic viscosity () of fluid is 0.0000192 Pa · s.
Figure 1.
The boundary conditions and the schematics of the computing field.

Figure 2.
The computational mesh for : (a) mesh refinement using multiple sub-domains; (b) mesh near the cylinders surface.
Figure 2.
The computational mesh for : (a) mesh refinement using multiple sub-domains; (b) mesh near the cylinders surface.

Figure 3.
The grid resolution near the cylinder wall.

3. Convergence Study and Calculation Validation
A mesh dependency study of a single cylinder is performed at . Three types of meshes (coarse, medium, and fine meshes, respectively) are utilized. The ratio of cell length between coarse mesh and medium mesh, medium mesh and fine mesh is in three space directions, which was recommended by Spalart [38]. The boundary layer mesh remains the same. Representative dynamic force coefficients are calculated to evaluate the mesh convergence. The drag and lift coefficients and are defined as
and the Strouhal number is defined as
where and are the fluid forces on the cylinder in the x-direction and y-direction, respectively; is the velocity of the fluid, H is the length of the cylinder in z-direction, is the frequency of the vortex shedding, which is obtained from the power spectrum density (PSD) of the lift force of the cylinder. The pressure coefficient () is defined as
where represents the reference pressure. is the minimum value of , and is the base pressure coefficient of the cylinder. The overline bar means the time average. The fluctuating lift coefficient is the root-mean-square (RMS) value of . For statistical accuracy, at least 25 vortex shedding cycles are sampled, which means the flow passes through the computational domain more than 3 times in the statistical process.
As shown in Table 1, the results from the coarse mesh differ from those of the medium mesh and fine mesh. of the three sets of meshes are the same. As can be seen, the medium mesh and fine mesh yield insignificant changes of , except for and , but the difference is in an acceptable range. Thus, the medium mesh is considered to be suitable for the following calculations.
In order to validate the present numerical model, Table 2 summarizes the results of the present simulation with previous experimental and numerical calculations of other scholars for a single cylinder at . Regarding the super-critical regime, the outcomes of the earlier experiments showed significant scattering. This may be primarily caused by a variety of experimental challenges, including surface roughness, turbulent intensity of free flow, cylinder end conditions, wind tunnel blockage ratio, and cylinder aspect ratio, which make it challenging to precisely measure flow at high Reynolds numbers [39]. Considering the aforementioned factors, the present simulation results are acceptable.
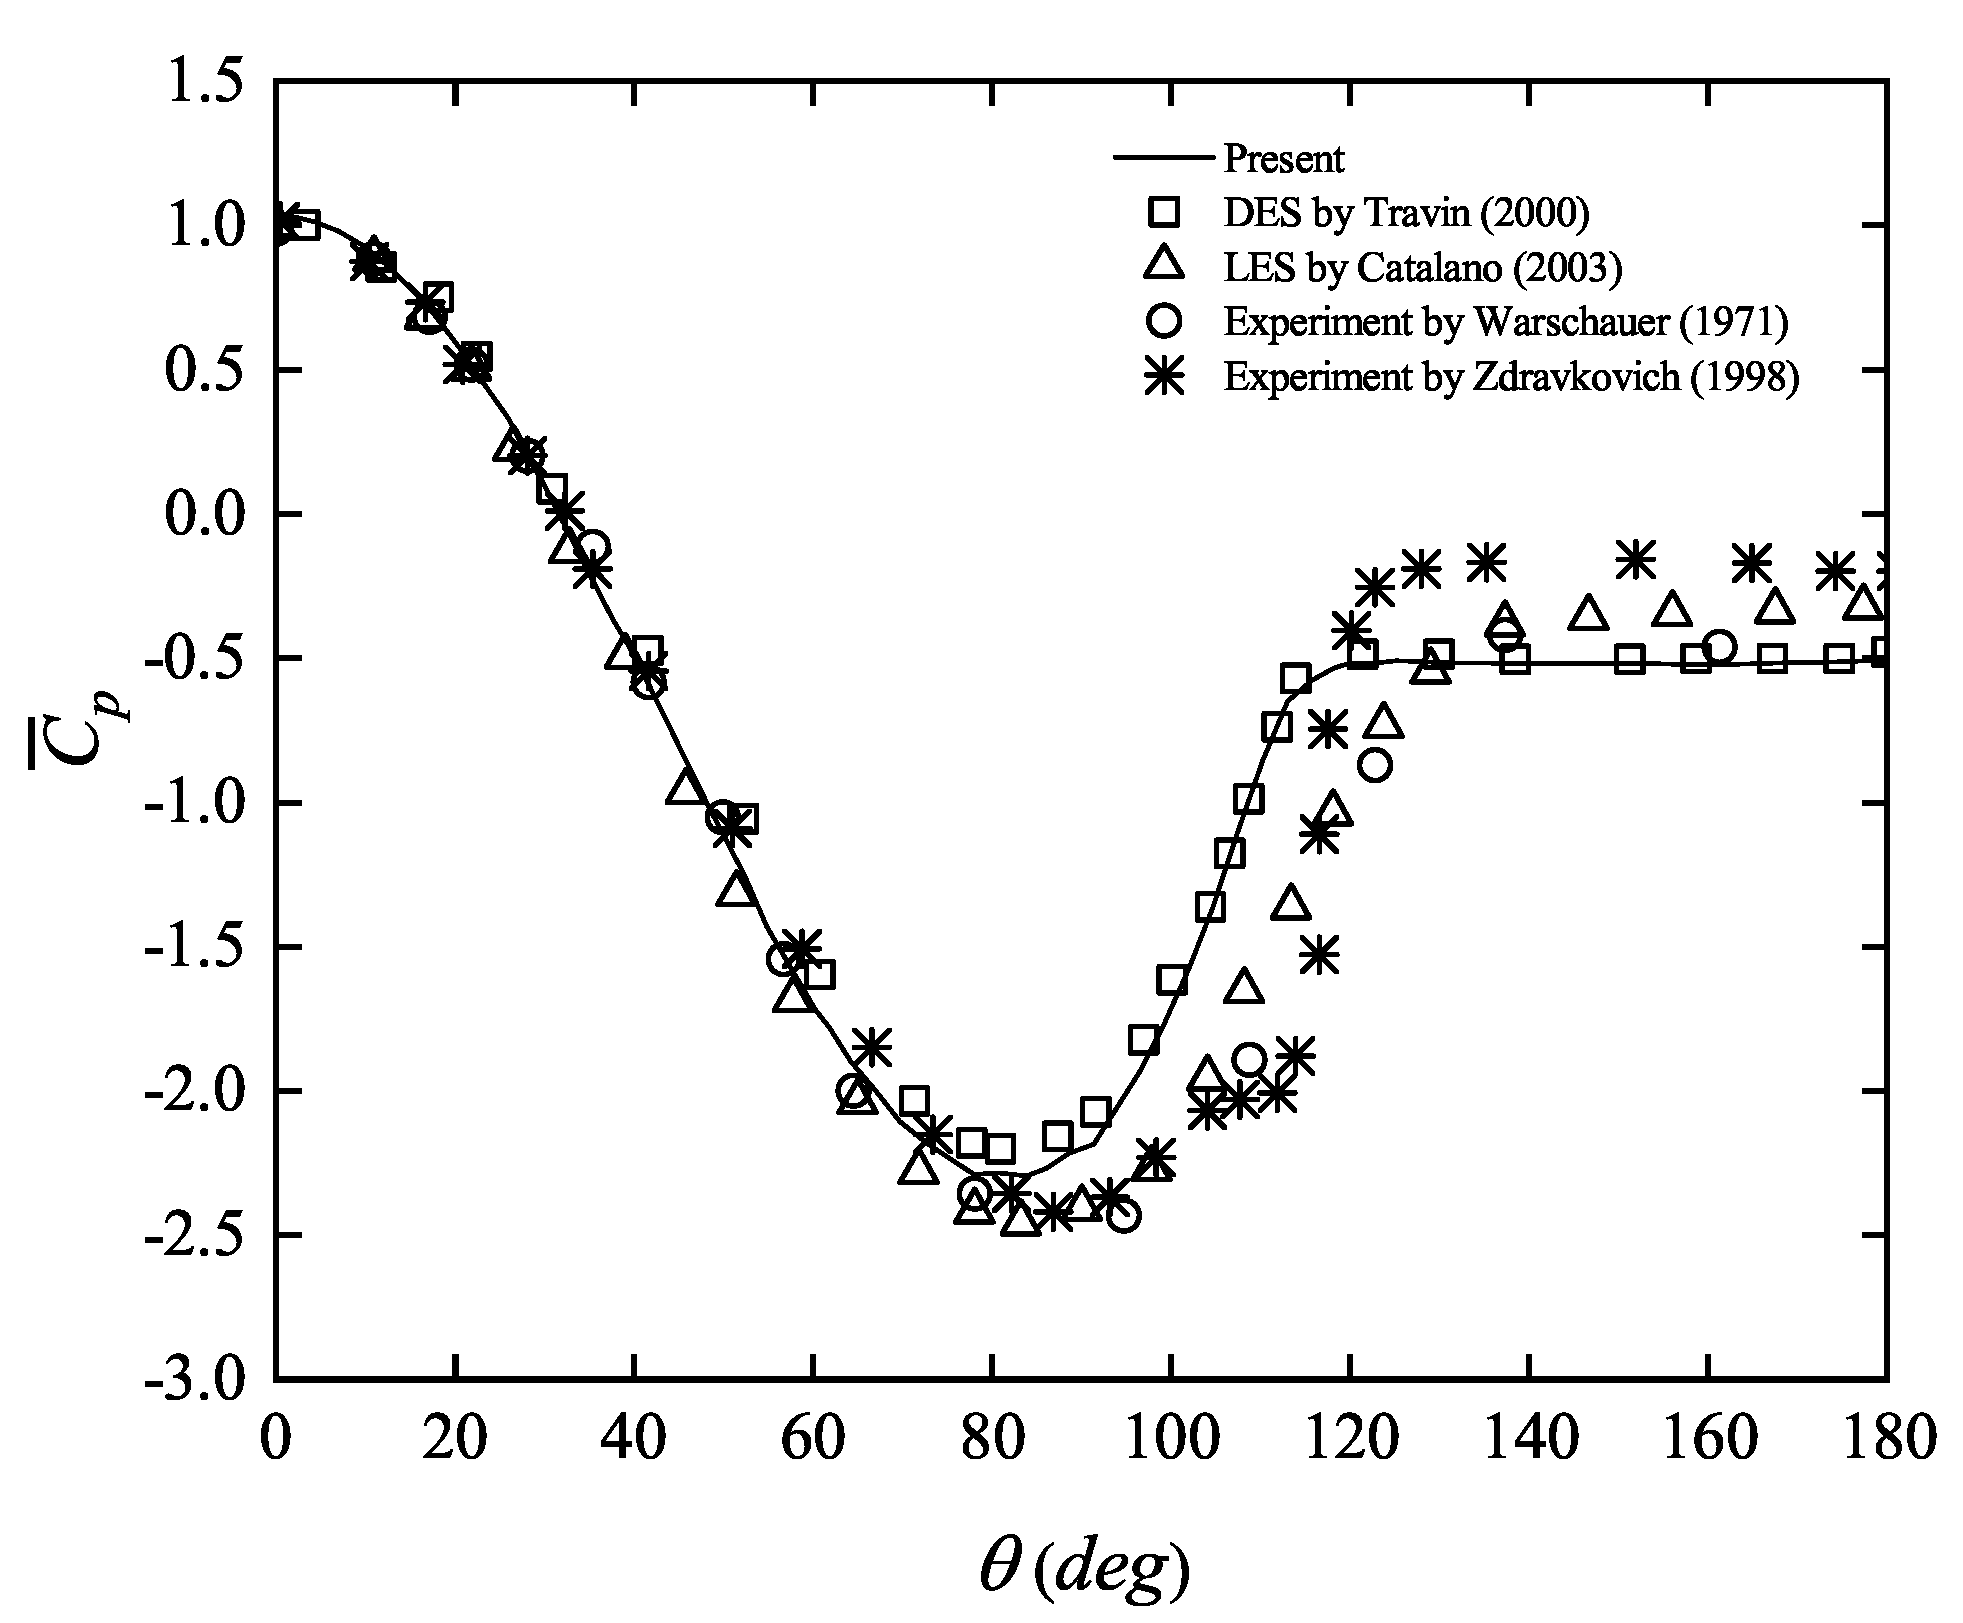
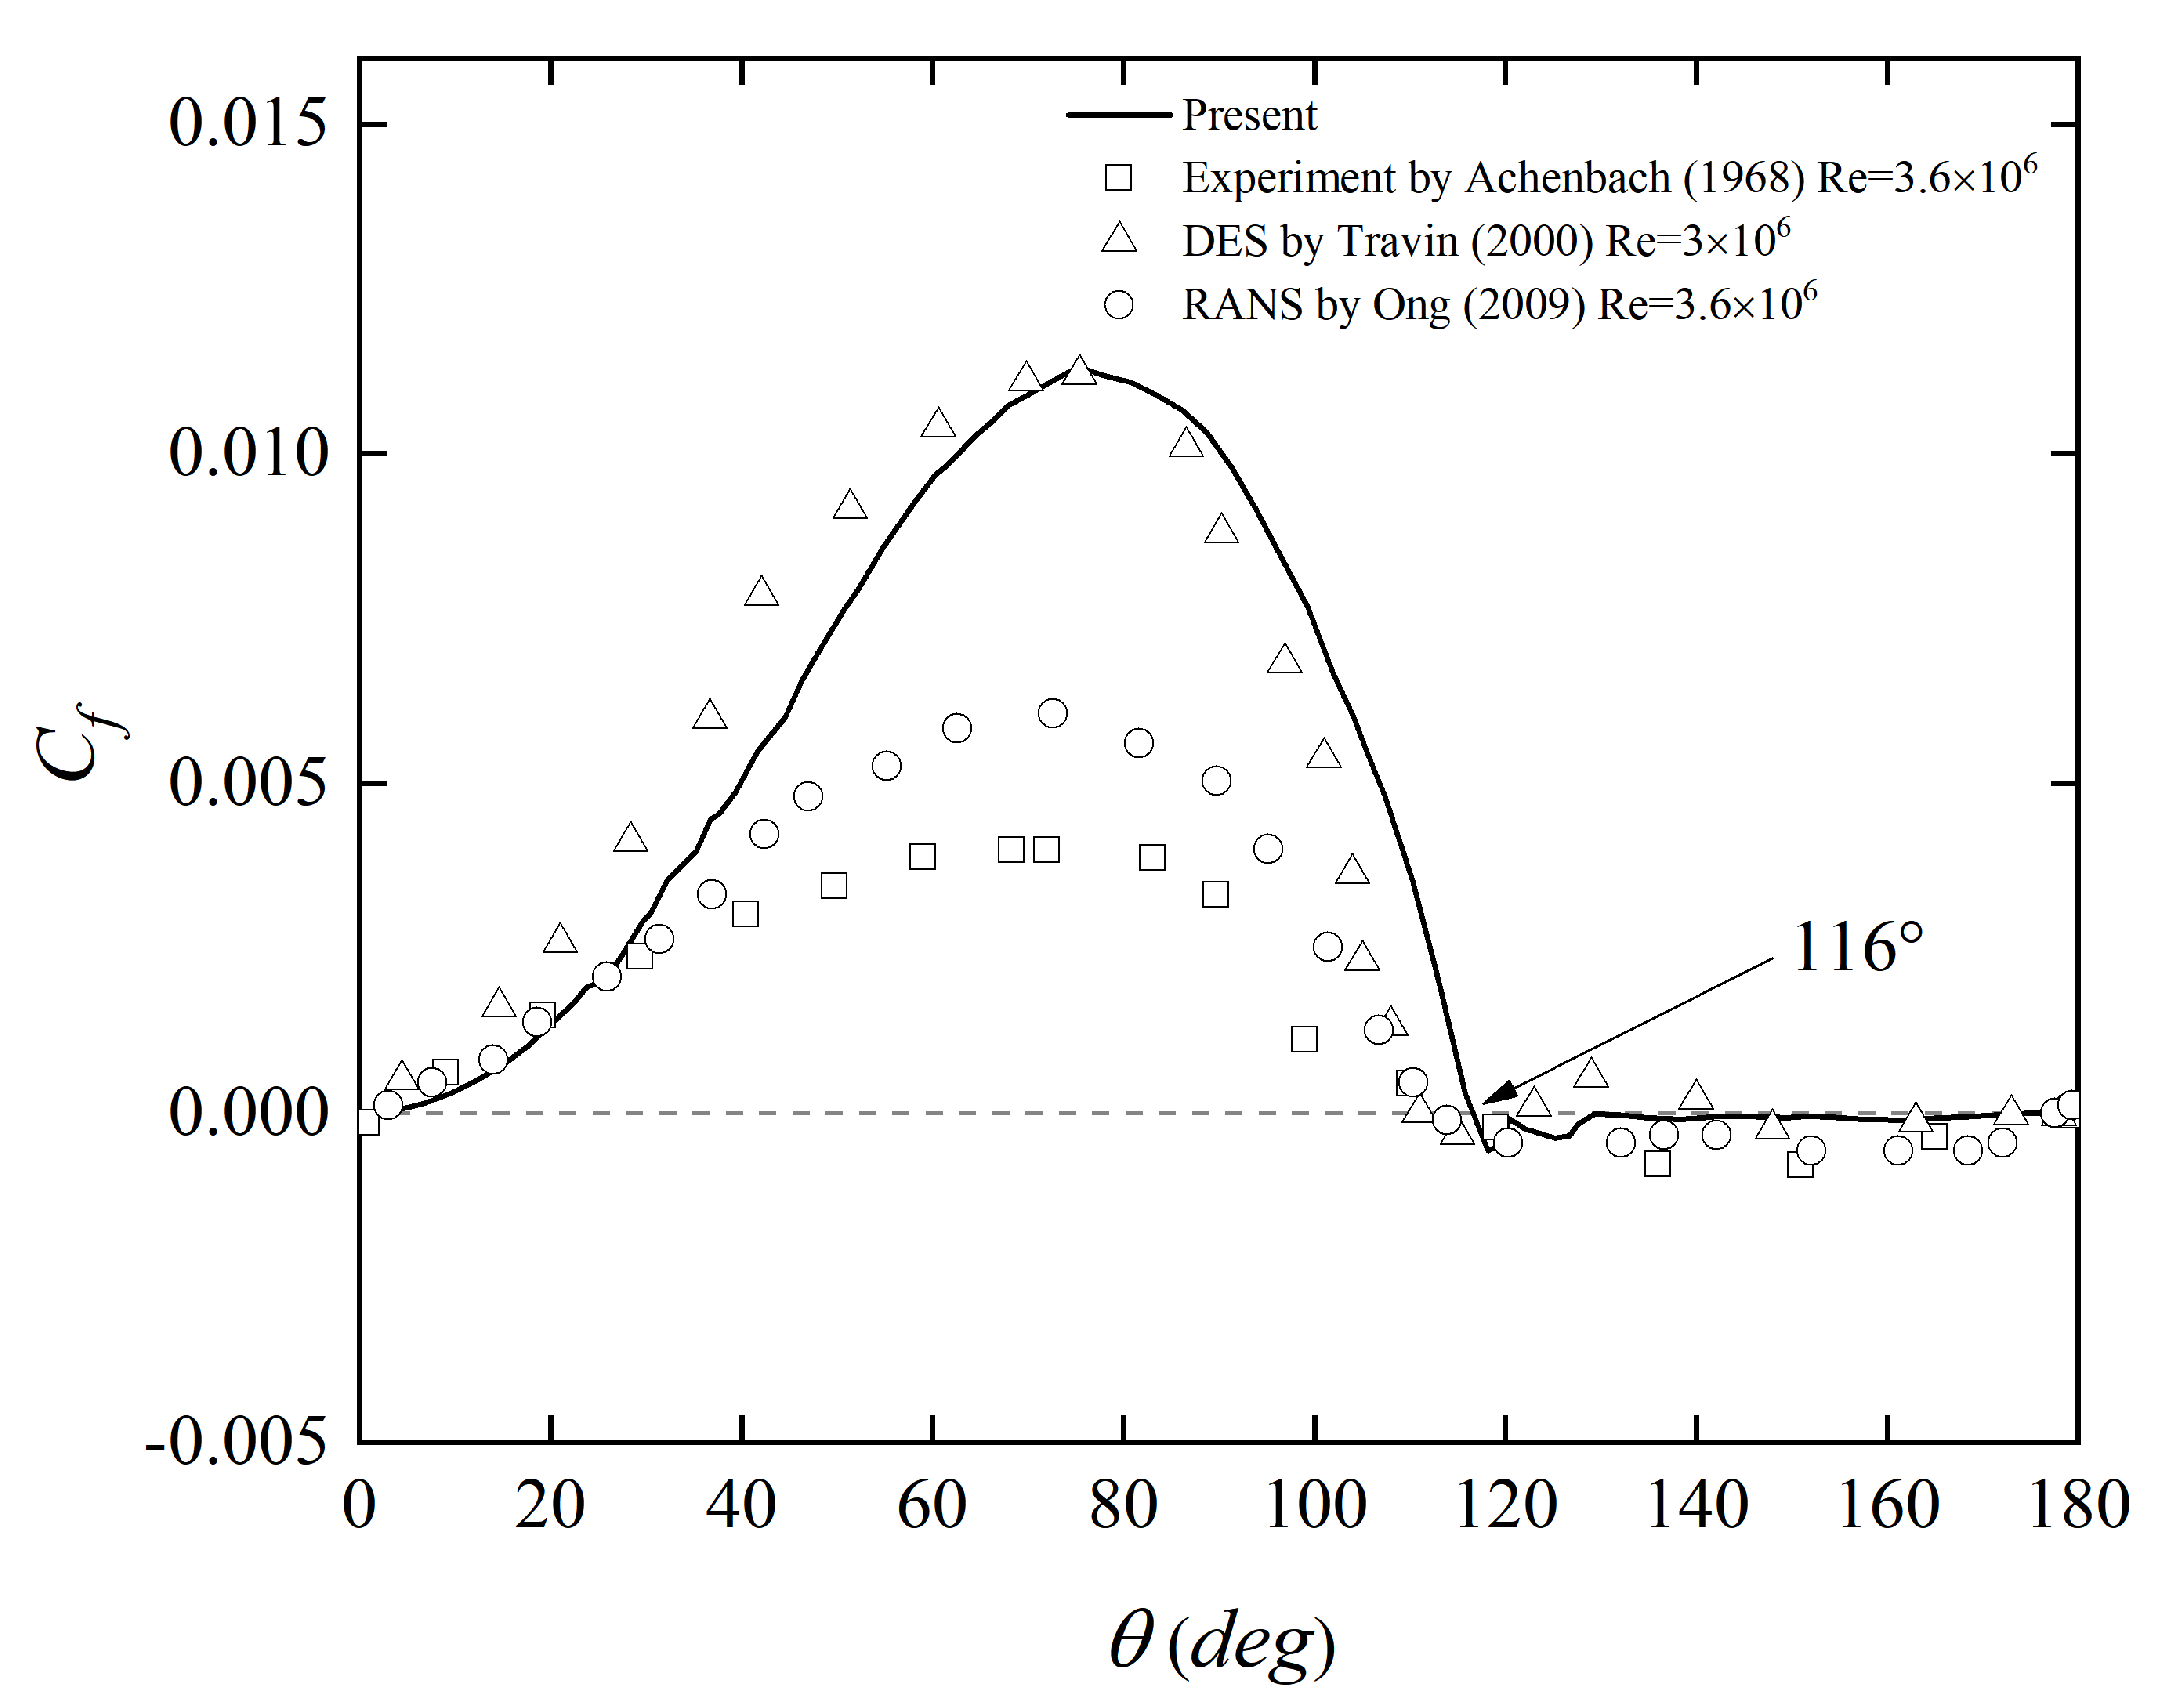
In addition, Figure 4 compares the distribution on a single cylinder with published numerical studies (Travin et al. [44] at and Catalano et al. [45] at ) and experimental studies (Warschauer [47] at and Zdravkovich [48] at ). As shown in Figure 4, the distribution on a single cylinder agrees well with previous results. The skin friction coefficient, , where is the tangential wall shear stress, is presented in Figure 5. The separation point location predicted in the present study agrees well with the previous experimental results [49] and other numerical results [44,46]. The overprediction of for in the present study compared with the experimental values is also observed from other numerical studies which used wall functions [44,45,46]. This results from the wall function method’s assumption of a completely turbulent boundary layer [50].
In general, the present calculation of flow past a single cylinder is in accordance with the outcomes of other published papers. Thus, it is reasonable to assume that the calculation method is also valid for calculating the triangular arrangement of the three cylinders.
4. Results and Discussion
4.1. Flow Patterns
Figure 6, Figure 7, Figure 8, Figure 9 and Figure 10 show the spanwise normalized vorticities diagrams and the time-averaged streamline diagrams at midspan plane for flow past three cylinders arranged in an equilateral-triangle configuration at different spacing ratio at . Clockwise and counterclockwise vorticities are displayed by red and blue colors, respectively. The flow patterns are classified according to based on the careful examination of Figure 6, Figure 7, Figure 8, Figure 9, Figure 10 and Figure 11 and other parameters such as , , and . Five different flow patterns were summarized and categorized. The naming of the flow patterns is partially referenced to Chen [21] who found them at –300. It is worth noting that the specific features and critical spacing ratios are widely divergent according to results from Chen [21], on account of the four-orders-of-magnitude difference in Reynolds number.
The specific characteristics of each flow pattern are as follows.
- Single bluff body flow
When , the shear layers of the upstream cylinder attach to the front surface of the downstream cylinders and pass through the gap between the cylinders, creating an extremely unstable shear flow on the gap-side surface of the downstream cylinders. The free-flow-side of the downstream cylinder has vortex shedding symmetry occurring simultaneously, with the vortex pairs taking a form similar to the typical Karman vortex street. This is unfamiliar with the single bluff body flow at low Reynolds numbers (50–300) [21]. At low Reynolds numbers, the shear layers of the upstream cylinder enclose the downstream cylinders, and when increases, a small amount of fluid will pass through the gap and blend into the shear layers on the free-flow-side of the downstream cylinders and come off together. The critical is 1.4 for low Reynolds numbers [21,51].
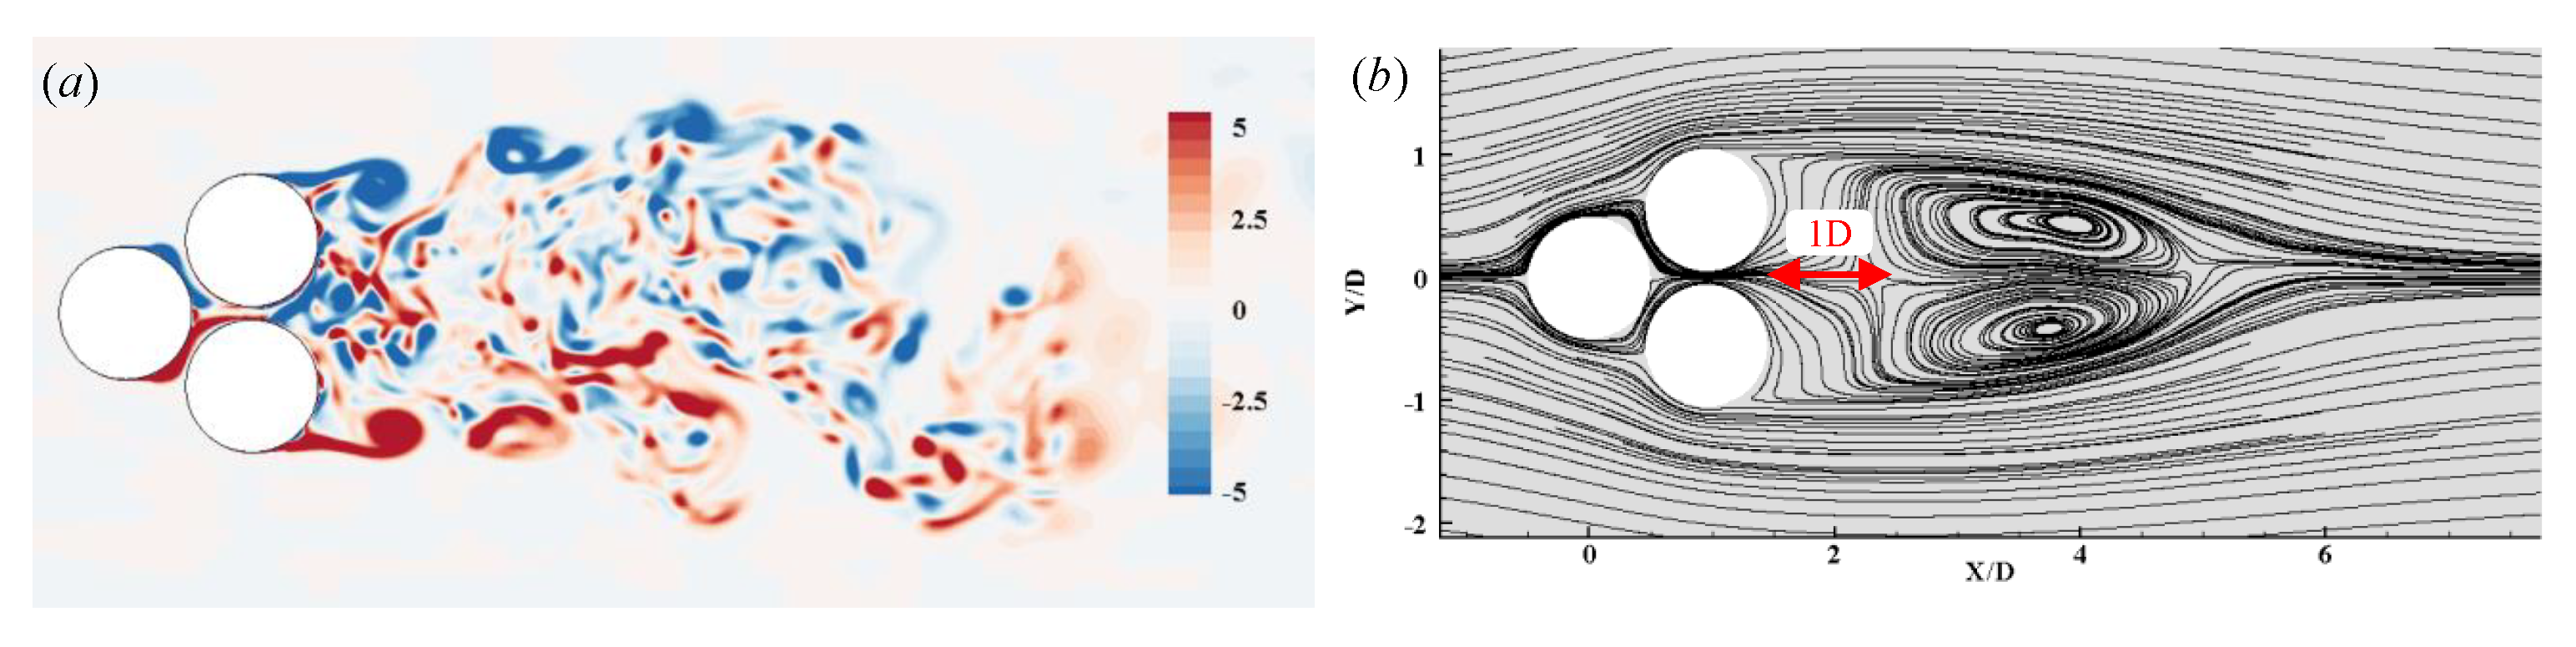
Figure 6a,b shows the contours of normalized instantaneous spanwise vorticities and the time-averaged streamlines for single bluff body flow at the middle plane, respectively. The time-averaged streamlines are symmetric relating to the center line of the wake, which indicates that the statistical range used in this paper is acceptable. Figure 6b shows that the recirculation region behind the three cylinders is longish and begins to occur at about one diameter away behind the downstream cylinders. The flow pattern at this is identical to a flow through a single bluff body, as seen in Figure 6b.
Figure 6.
(a) Normalized spanwise vorticity ; (b) time-averaged streamlines in the plane z = 2 D at .
Figure 6.
(a) Normalized spanwise vorticity ; (b) time-averaged streamlines in the plane z = 2 D at .

- Deflected gap flow
As increases to –, the gap flow is deflected towards one of the downstream cylinders and forms a deflected gap flow pattern. At and , gap flow is deflected towards the downstream cylinder C and produces a narrow wake behind it, and the opposite when . Different computation procedures produce random deflection directions. A switch in the directions of the gap flow is not found throughout the computation process, which is consistent with the findings by Bansal [16] and Chen [21]. As regards double cylinders arranged side by side, nevertheless, Kim [52] and Alam et al. [53] found a shift in the deflection direction of the gap flow. The existence of the upstream cylinder might limit the direction change of the deflection flow.
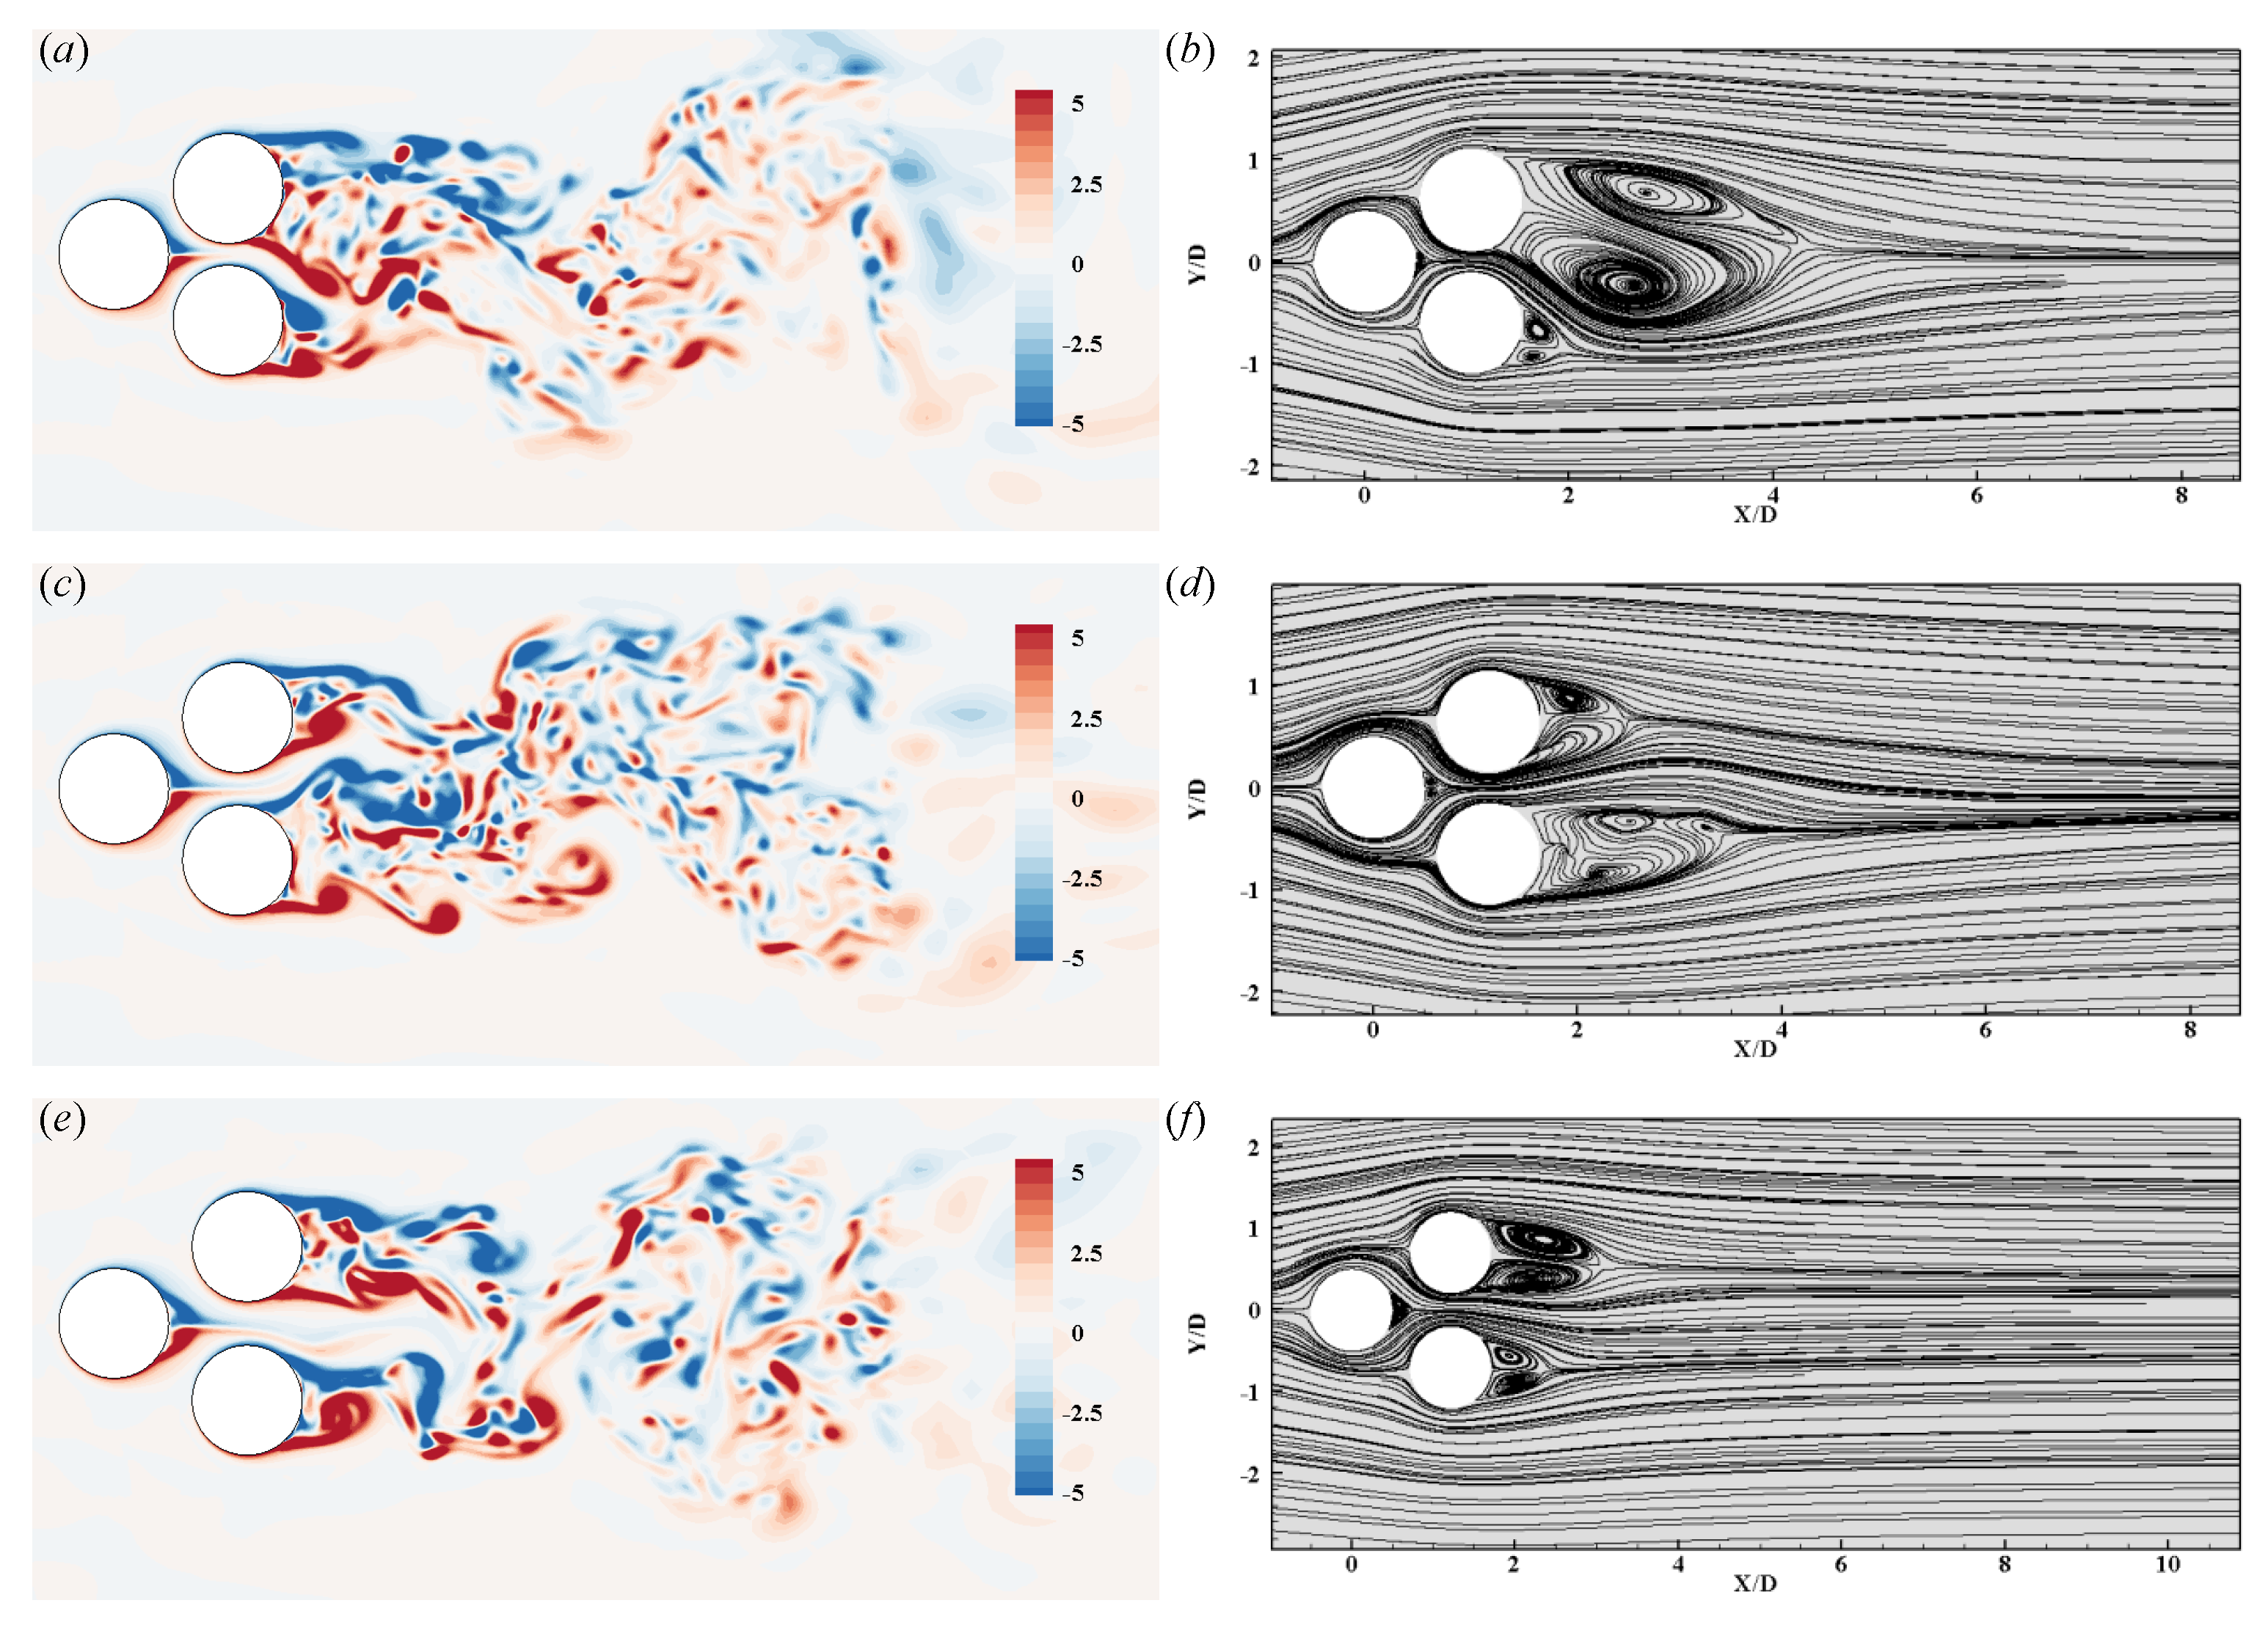
Figure 7 demonstrates that the vortex shedding of the downstream cylinder with the gap flow bias is suppressed. The suppression lessens with the increase of . From the time-mean streamlines in Figure 7b,d,f, it is observed that the recirculating bubble of the wider wake downstream cylinder is longer and broader. The cylinder with a wide wake has a lower drag coefficient compared to the cylinder with narrow wake, which is consistent with the biased gap flow of the two cylinders arranged side by side [7].
Figure 7.
Normalized spanwise vorticity and time-averaged streamlines in the plane z = 2 D at: (a,b) ; (c,d) ; (e,f) .
Figure 7.
Normalized spanwise vorticity and time-averaged streamlines in the plane z = 2 D at: (a,b) ; (c,d) ; (e,f) .

- Anti-phase flow
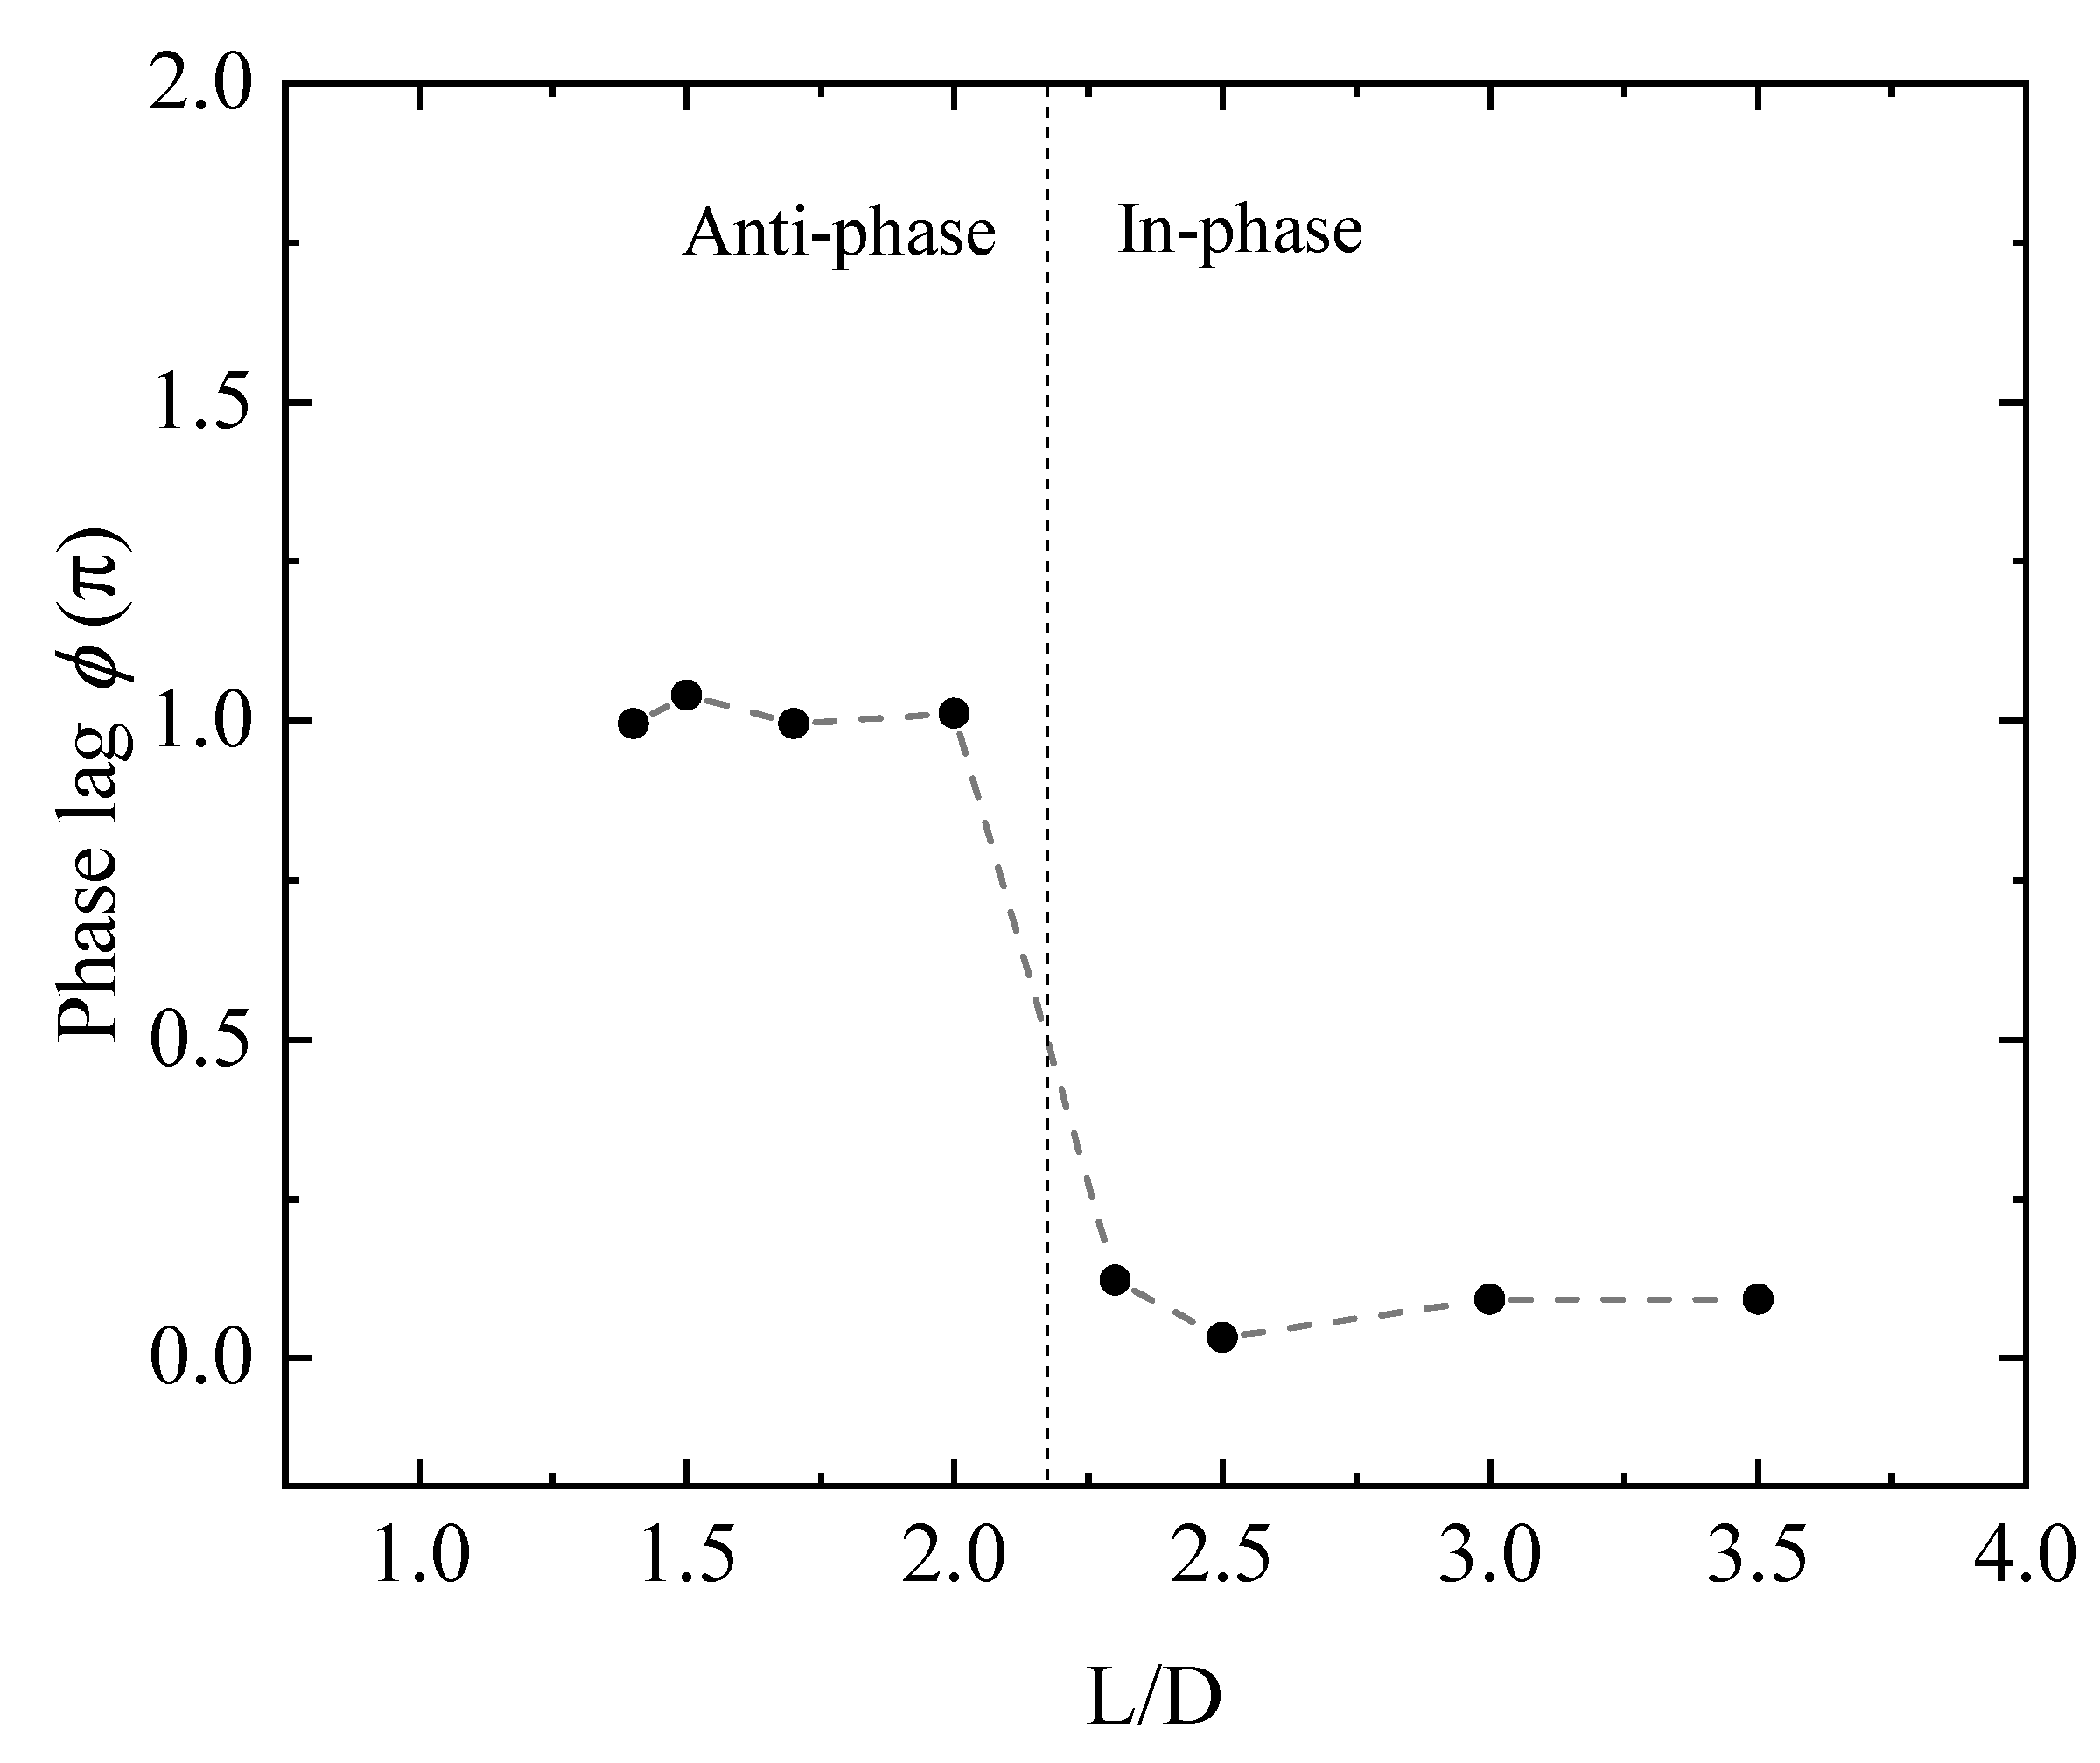
As increases, the flow pattern becomes anti-phase flow. Anti-phase is referred to the occurrence of phase lag in the time history of lift forces between the downstream cylinders. Figure 11 presents the relationship of the phase lag of the downstream cylinders with , which is obtained through the FFT analysis of the of two downstream cylinders. Since there is no significant principal frequency of of the downstream cylinder when , their phase lag data are not shown in the figure.
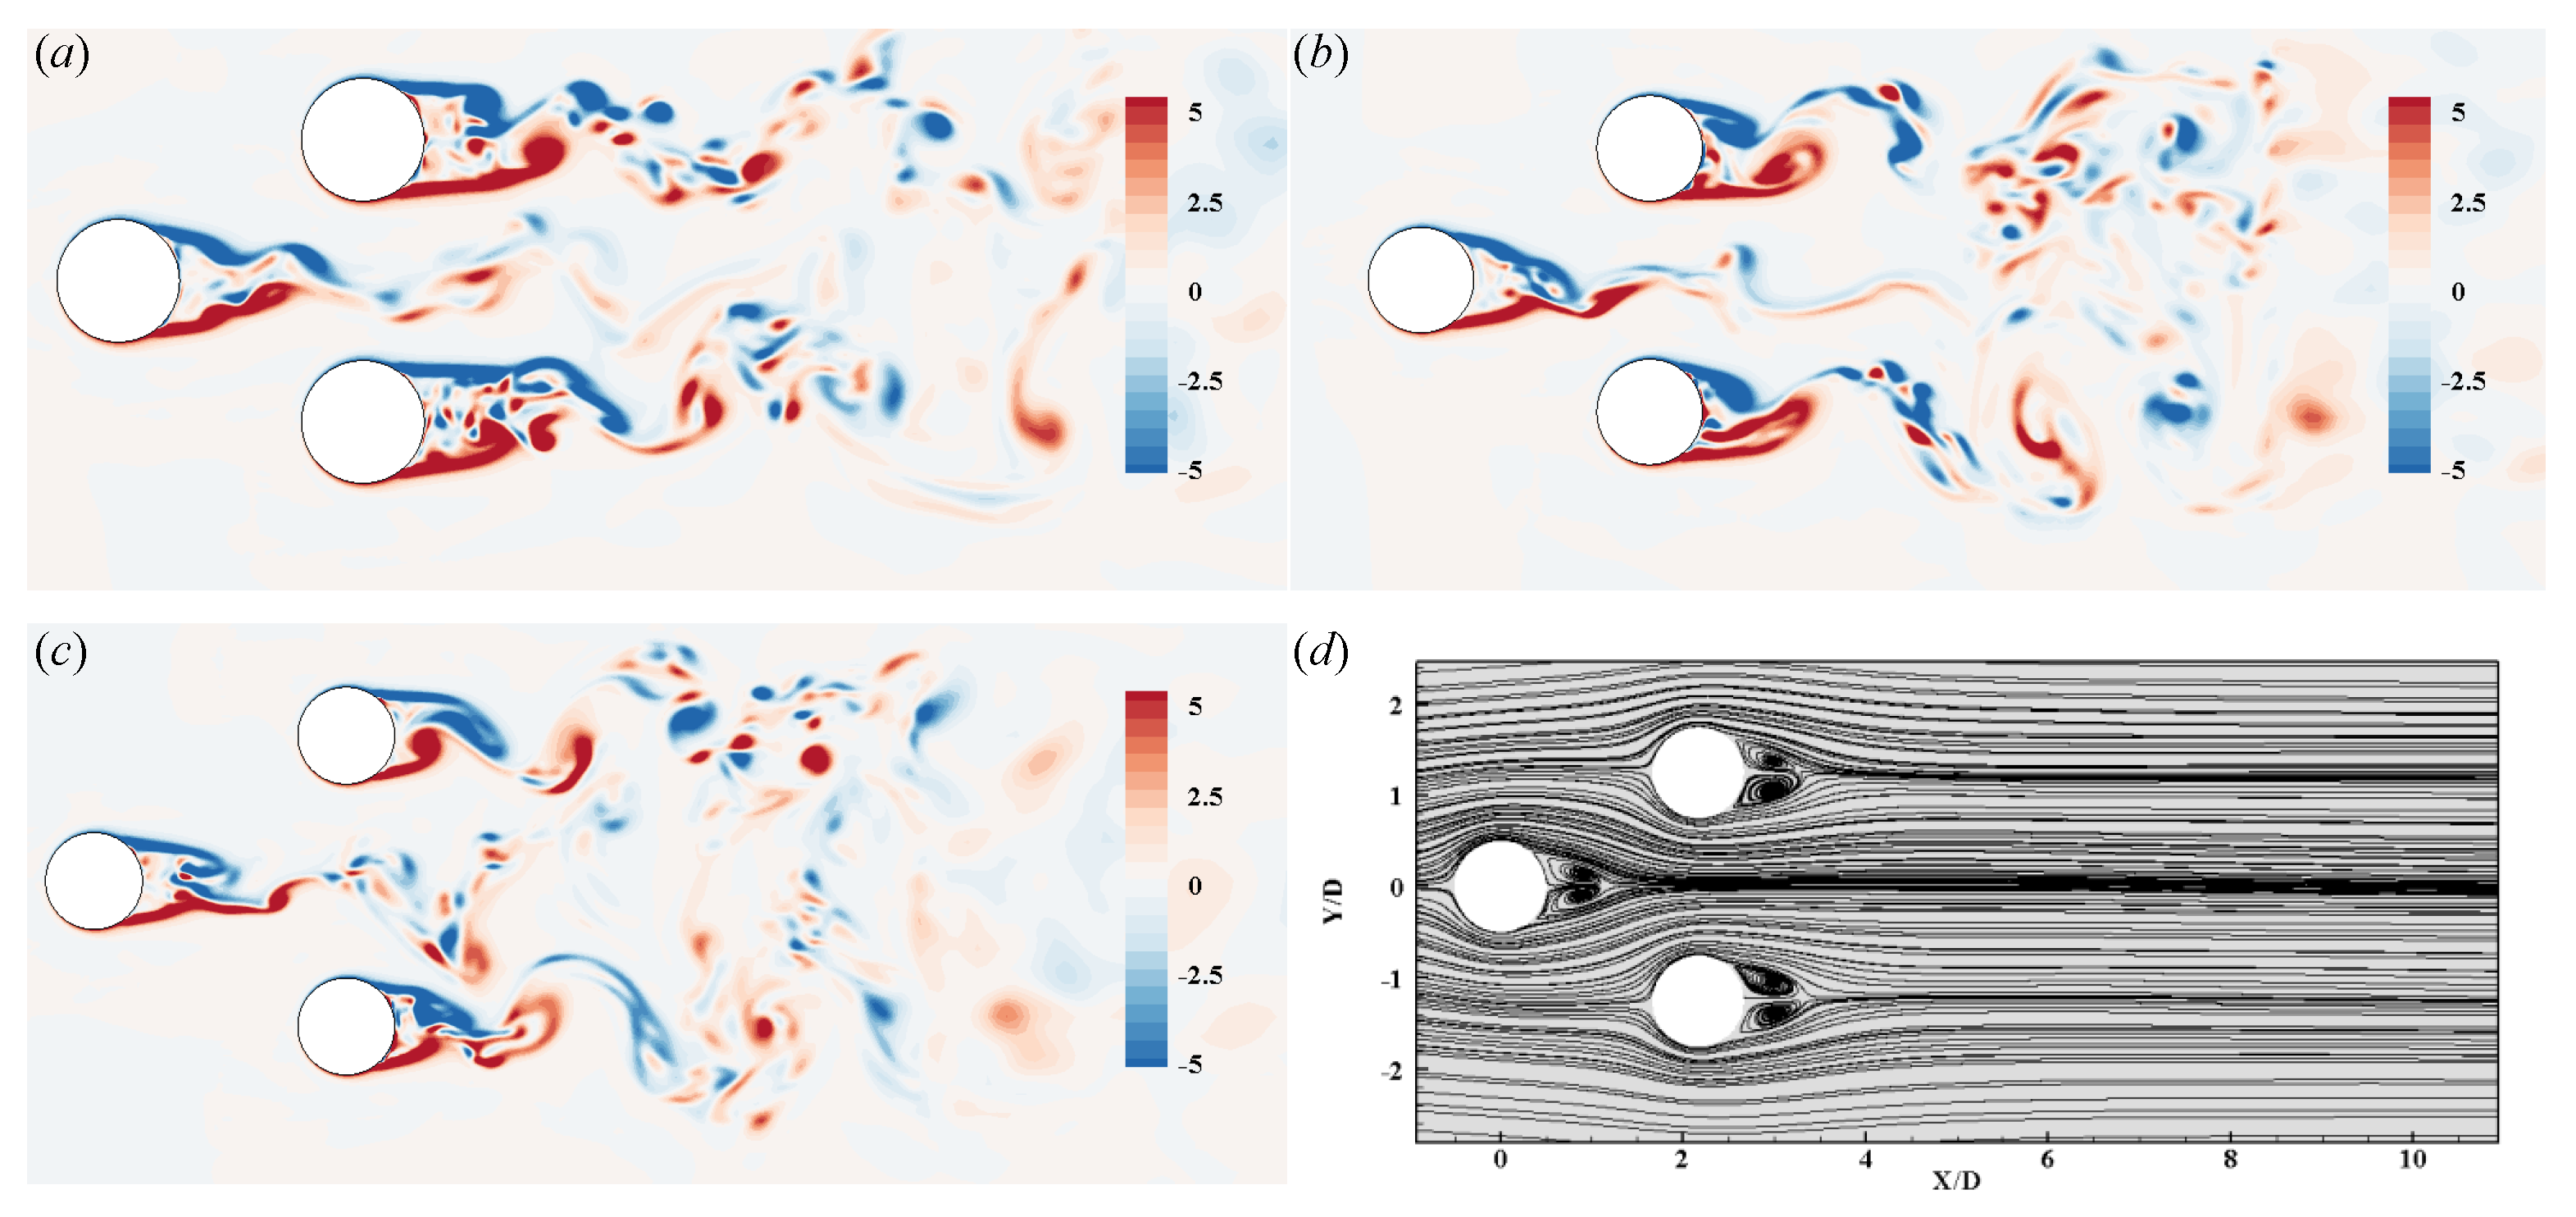
In the anti-phase flow regime, the vortices on the free-flow-side of the downstream cylinder shed simultaneously and are symmetrical relative to the wake center line. The shear layers of the upstream cylinder appear to roll up and produce vortex shedding, with a weaker intensity compared with the downstream cylinders. They are elongated at the gap, and finally pair with the the vortices produced by gap-side downstream cylinders and blend in with the wake flow. The size of the recirculation zone of the upstream cylinder is way smaller than that of the downstream cylinders, as seen in Figure 8d.
Figure 8.
Normalized spanwise vorticity in the plane z = 2 D at: (a) ; (b) ; (c) ; (d) time-averaged streamlines at .
Figure 8.
Normalized spanwise vorticity in the plane z = 2 D at: (a) ; (b) ; (c) ; (d) time-averaged streamlines at .

- In-phase flow
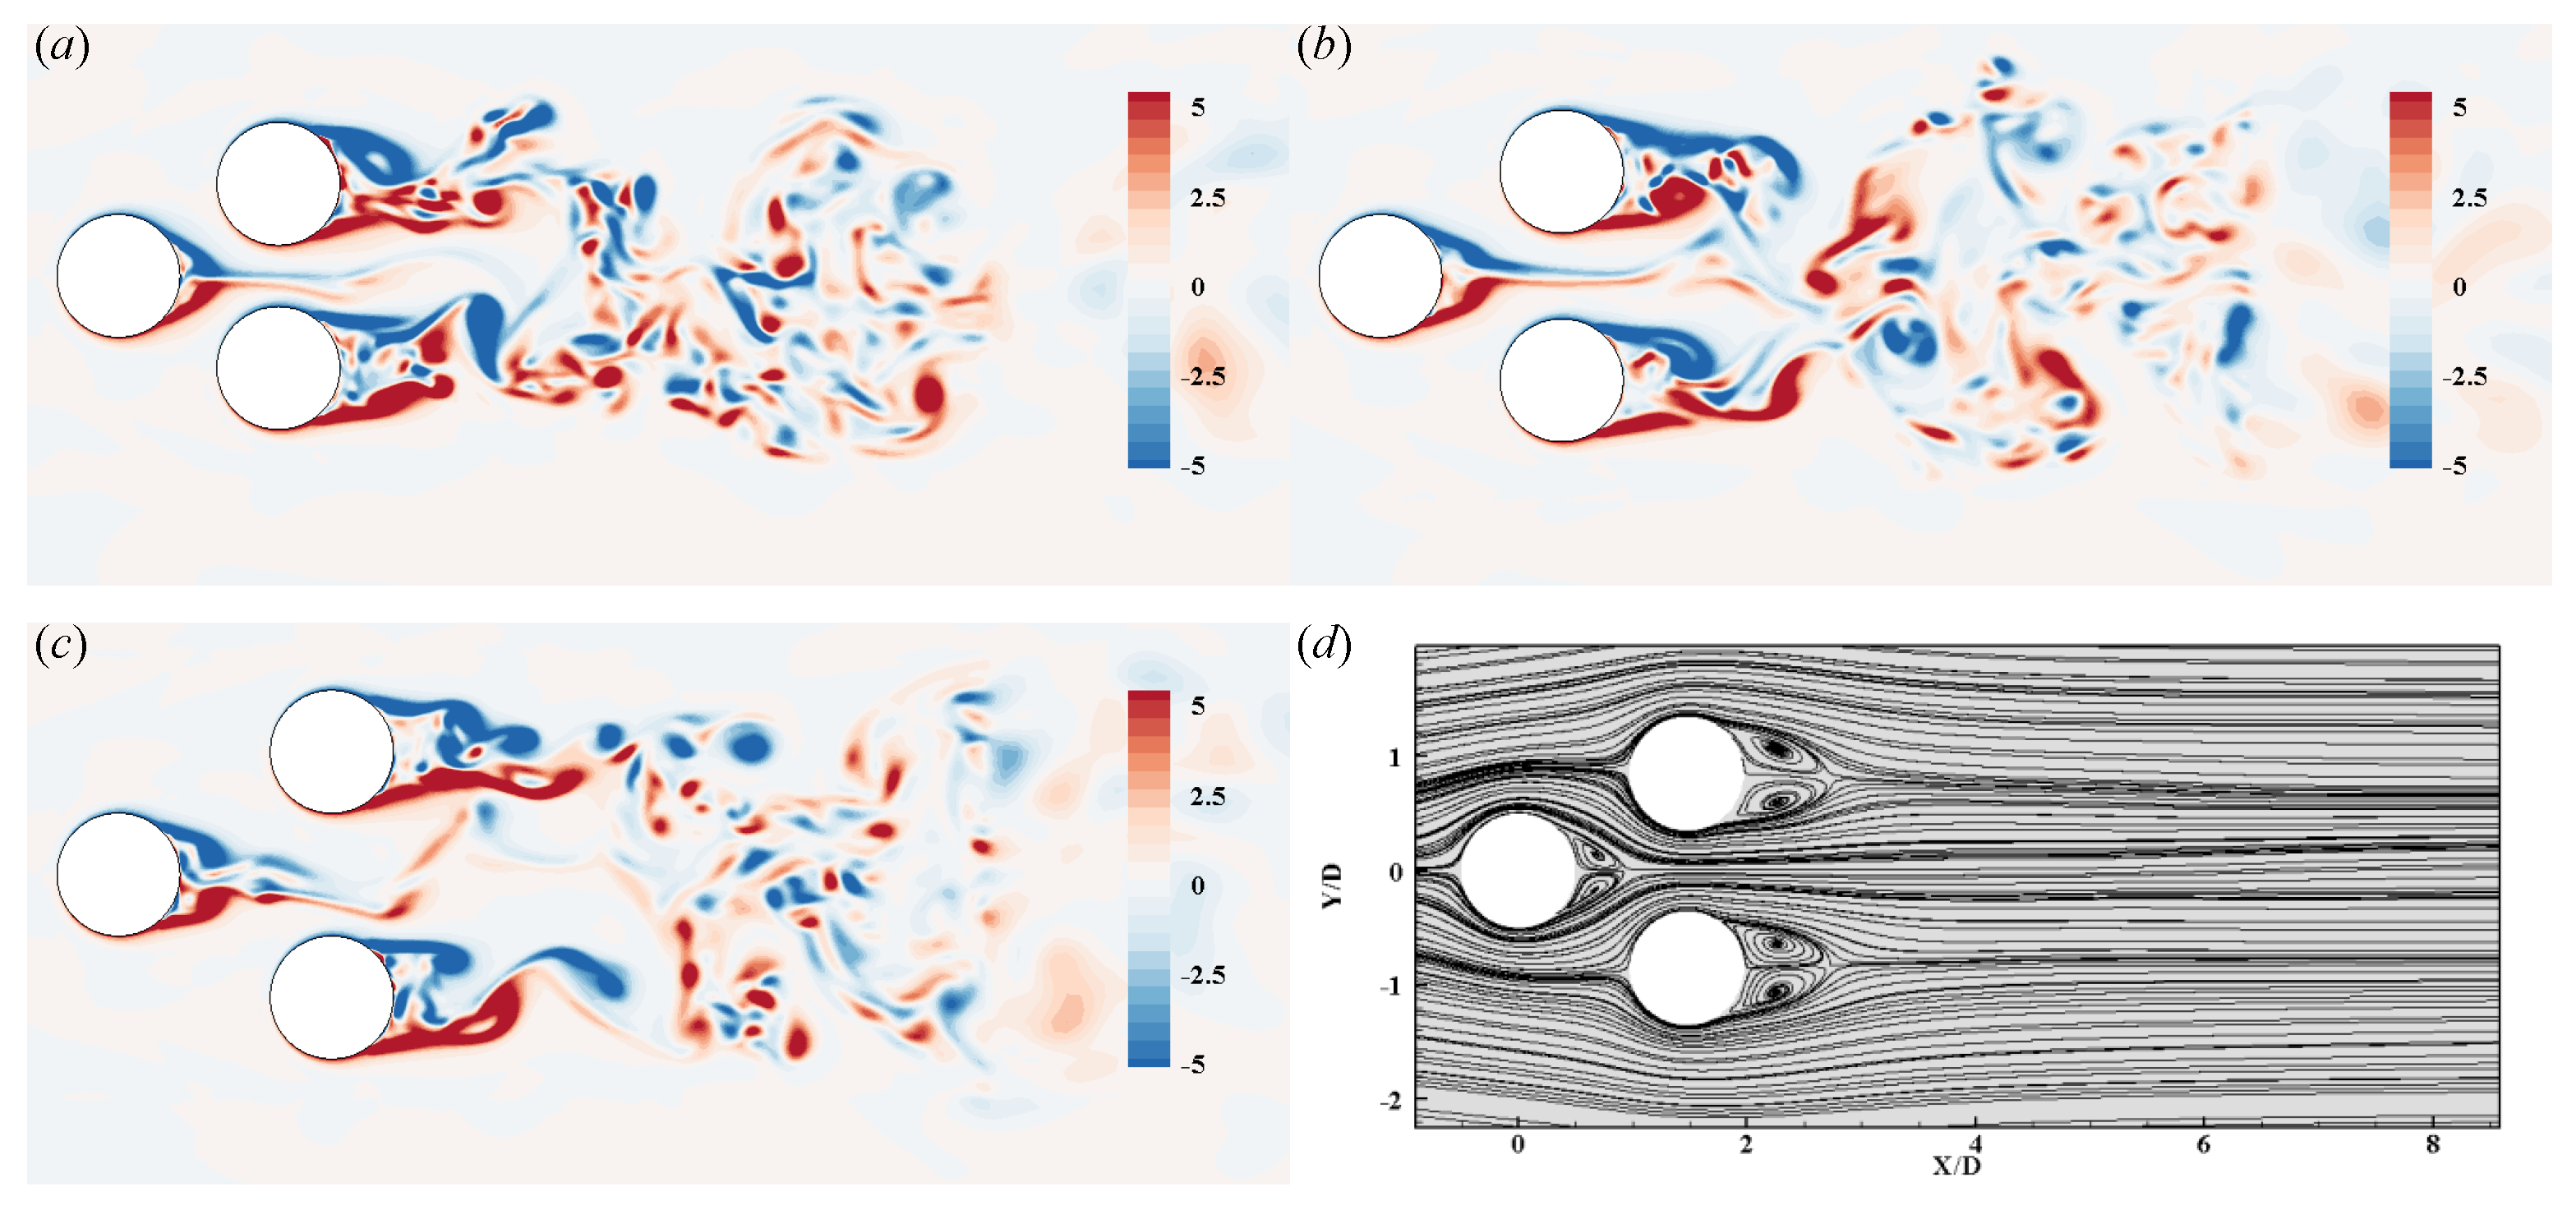
Figure 9a–c shows the vorticity contours at . The flow pattern belongs to in-phase flow, because the vortex shedding of the downstream cylinder presents an in-phase fashion. As shown in Figure 11, the phase lag of the two downstream cylinders is near 0 when . The vortices from free-flow-side shear layers of the cylinder B and the gap-side shear layers of the cylinder C shed synchronously, which is exactly the opposite for anti-phase flow.
The vortex generated from the upstream cylinder is elongated at the gap and interacts with the vortex of the gap-side shear layers of the downstream cylinders. As increases, the vortices shed by the upstream cylinder show an oscillation in the vertical direction in order to pair with the vortex generated from downstream cylinders. These interactions bring on the dissipation of vortices’ energy of the upstream cylinder. Figure 9d only shows the time-averaged streamline for because the difference between each in in-phase flow is insignificant. Figure 9d indicates that the length of the recirculation zone of the upstream cylinder is larger than that of anti-phase flow. Such a phenomenon results from the increased space at the gap, which allows the shear layers of the upstream cylinder to fully develop.
Figure 9.
Normalized spanwise vorticity in the plane z = 2 D at (a) ; (b) ; (c) , (d) time-averaged streamlines at .
Figure 9.
Normalized spanwise vorticity in the plane z = 2 D at (a) ; (b) ; (c) , (d) time-averaged streamlines at .

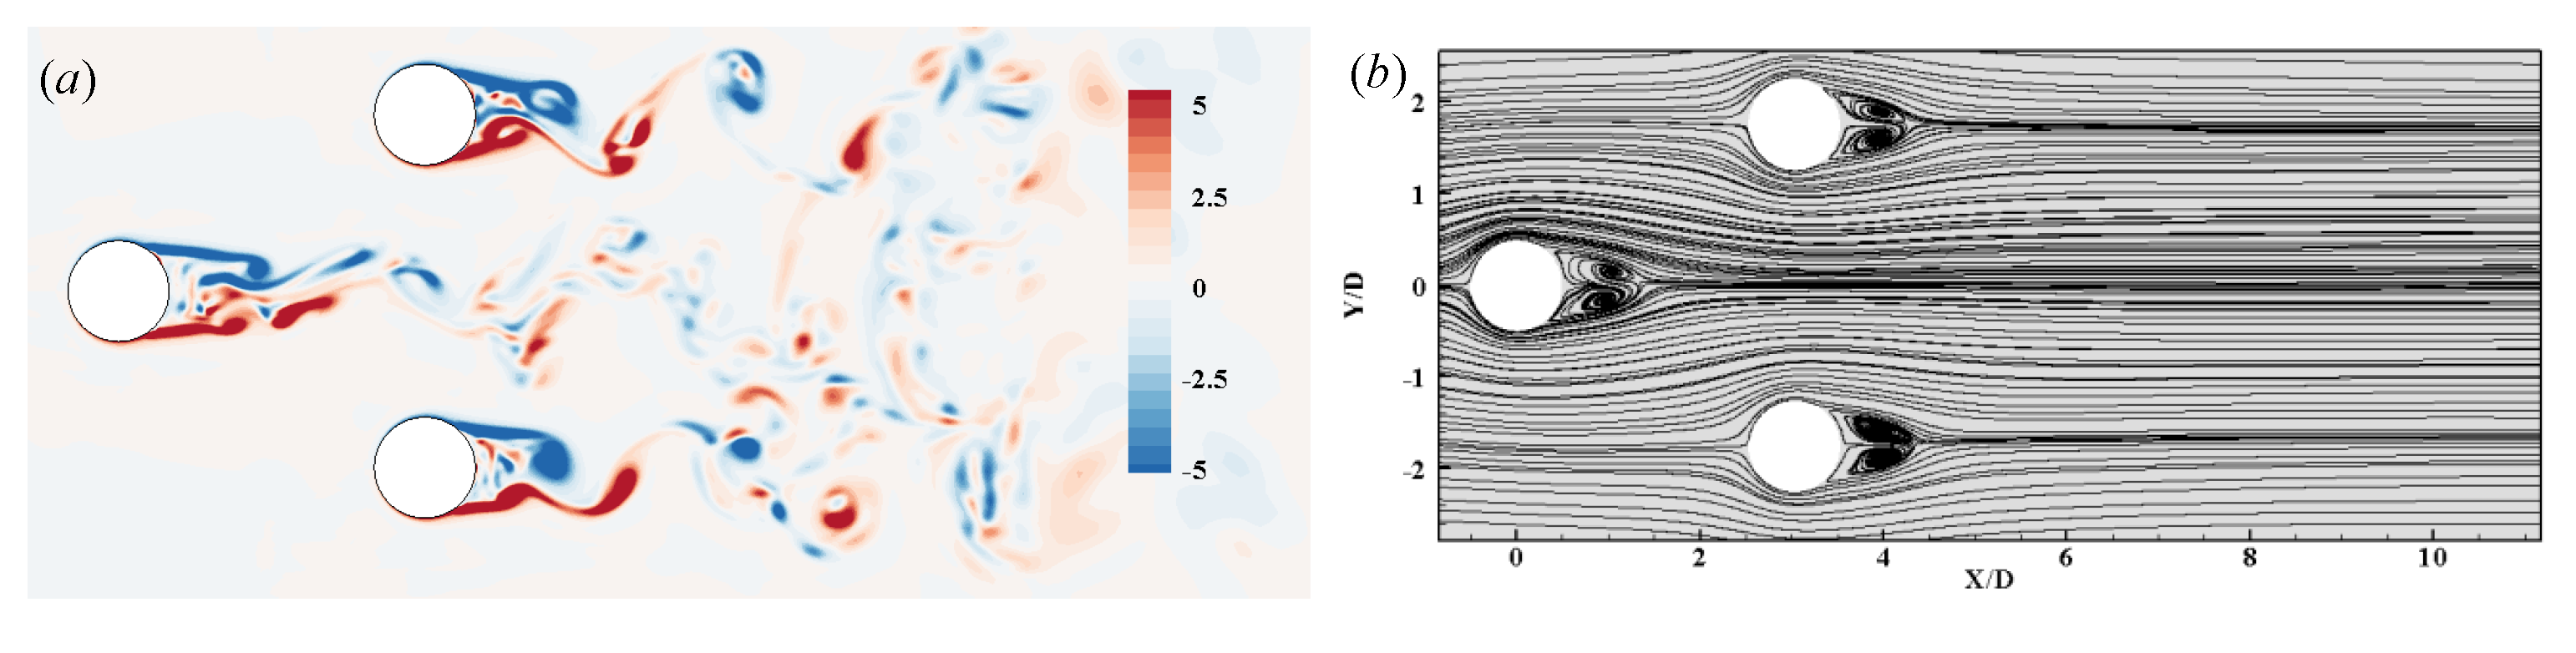
- Co-shedding flow
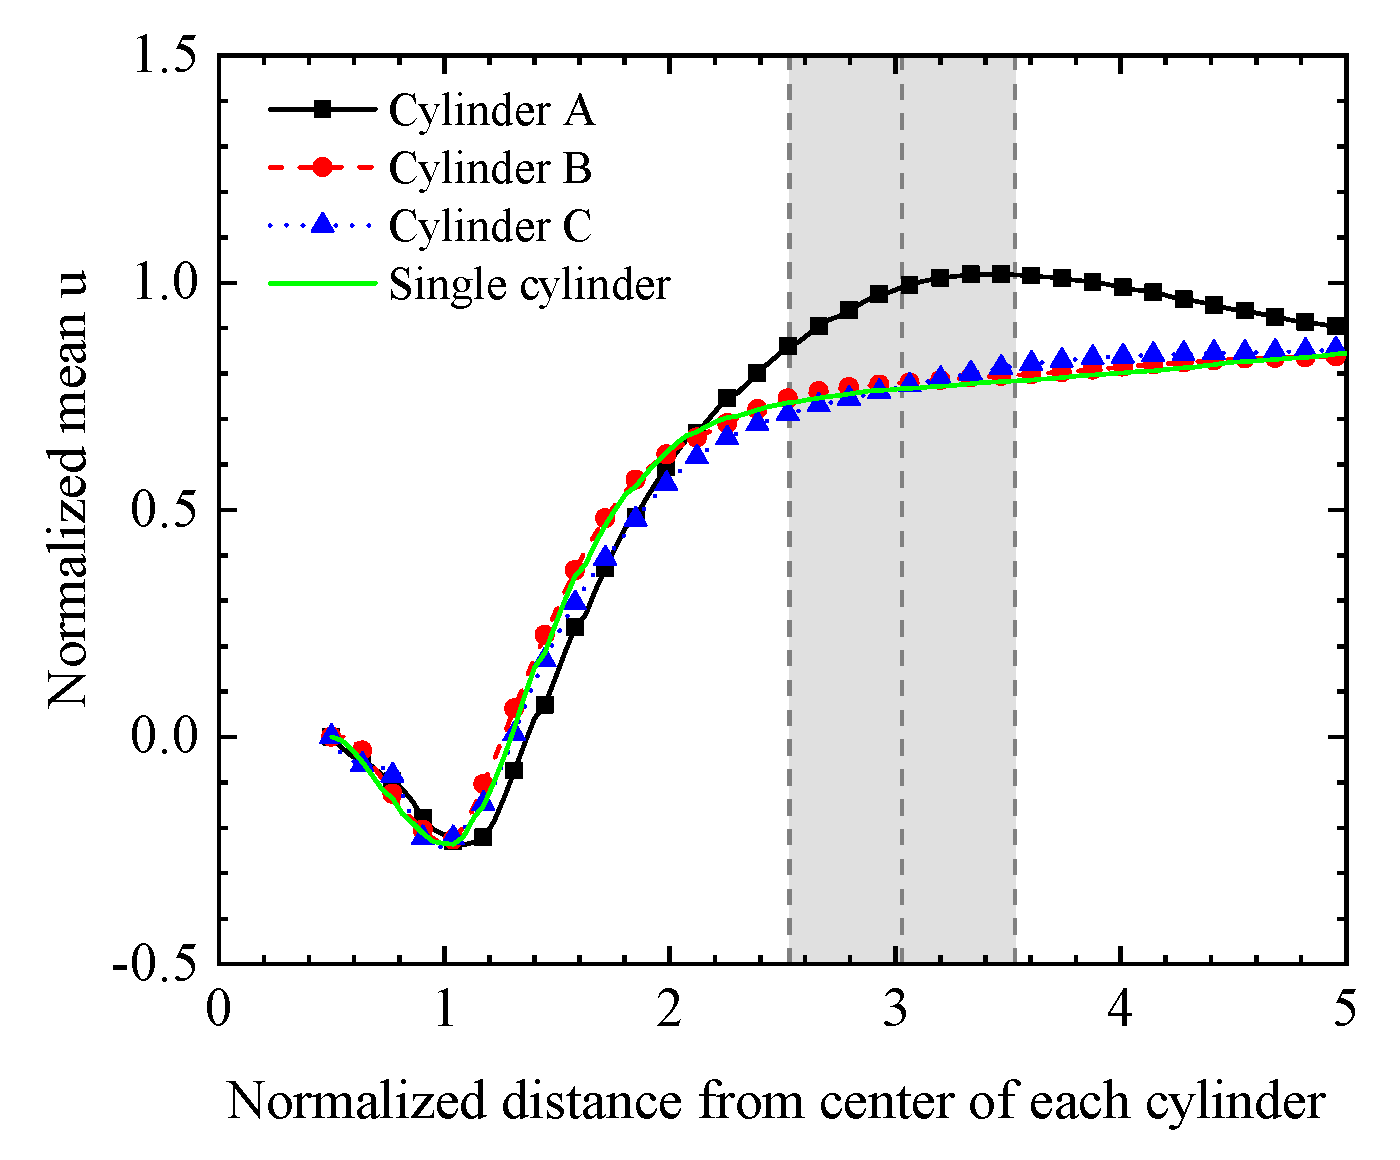
When , the vorticity and time mean streamlines of the three cylinders are shown in Figure 10. Because is large enough, the interaction between the cylinders is relatively small, and the flow pattern around each cylinder approximates the fashion of flow past a single cylinder. However, in fact, it can be seen from the vorticity contour that the vortex shed from the upstream cylinder still has a tendency of pairing with the corresponding downstream vortex when the flow goes through the downstream cylinder. Figure 12 shows the normalized time-averaged x-directional flow velocity in the tail region of the three cylinders, with the x-axis denoting the distance from the center of each cylinder normalized by D. The single cylinder case is also shown for comparison. The wake flow velocity of downstream cylinders is identical to that of a single cylinder. For the upstream cylinder, however, the velocity can be seen to be higher when it passes through the downstream cylinders at about three-quarters of the position, which confirms the vortex-pairing tendency aforementioned. Additionally, the vortex shedding of the downstream cylinders occurs in an in-phase fashion. There is a certain phase lag between the vortex shedding of the upstream cylinder and downstream cylinders, which is determined by .
Figure 10.
(a) Normalized spanwise vorticity ; (b) time-averaged streamlines at .

Figure 11.
Phase lag of lift force history between two downstream cylinders.

Figure 12.
Mean velocity () at the center line of each cylinder at . The three gray dashed lines represent the front edge, center line, and end edge of the downstream cylinders, respectively.
Figure 12.
Mean velocity () at the center line of each cylinder at . The three gray dashed lines represent the front edge, center line, and end edge of the downstream cylinders, respectively.

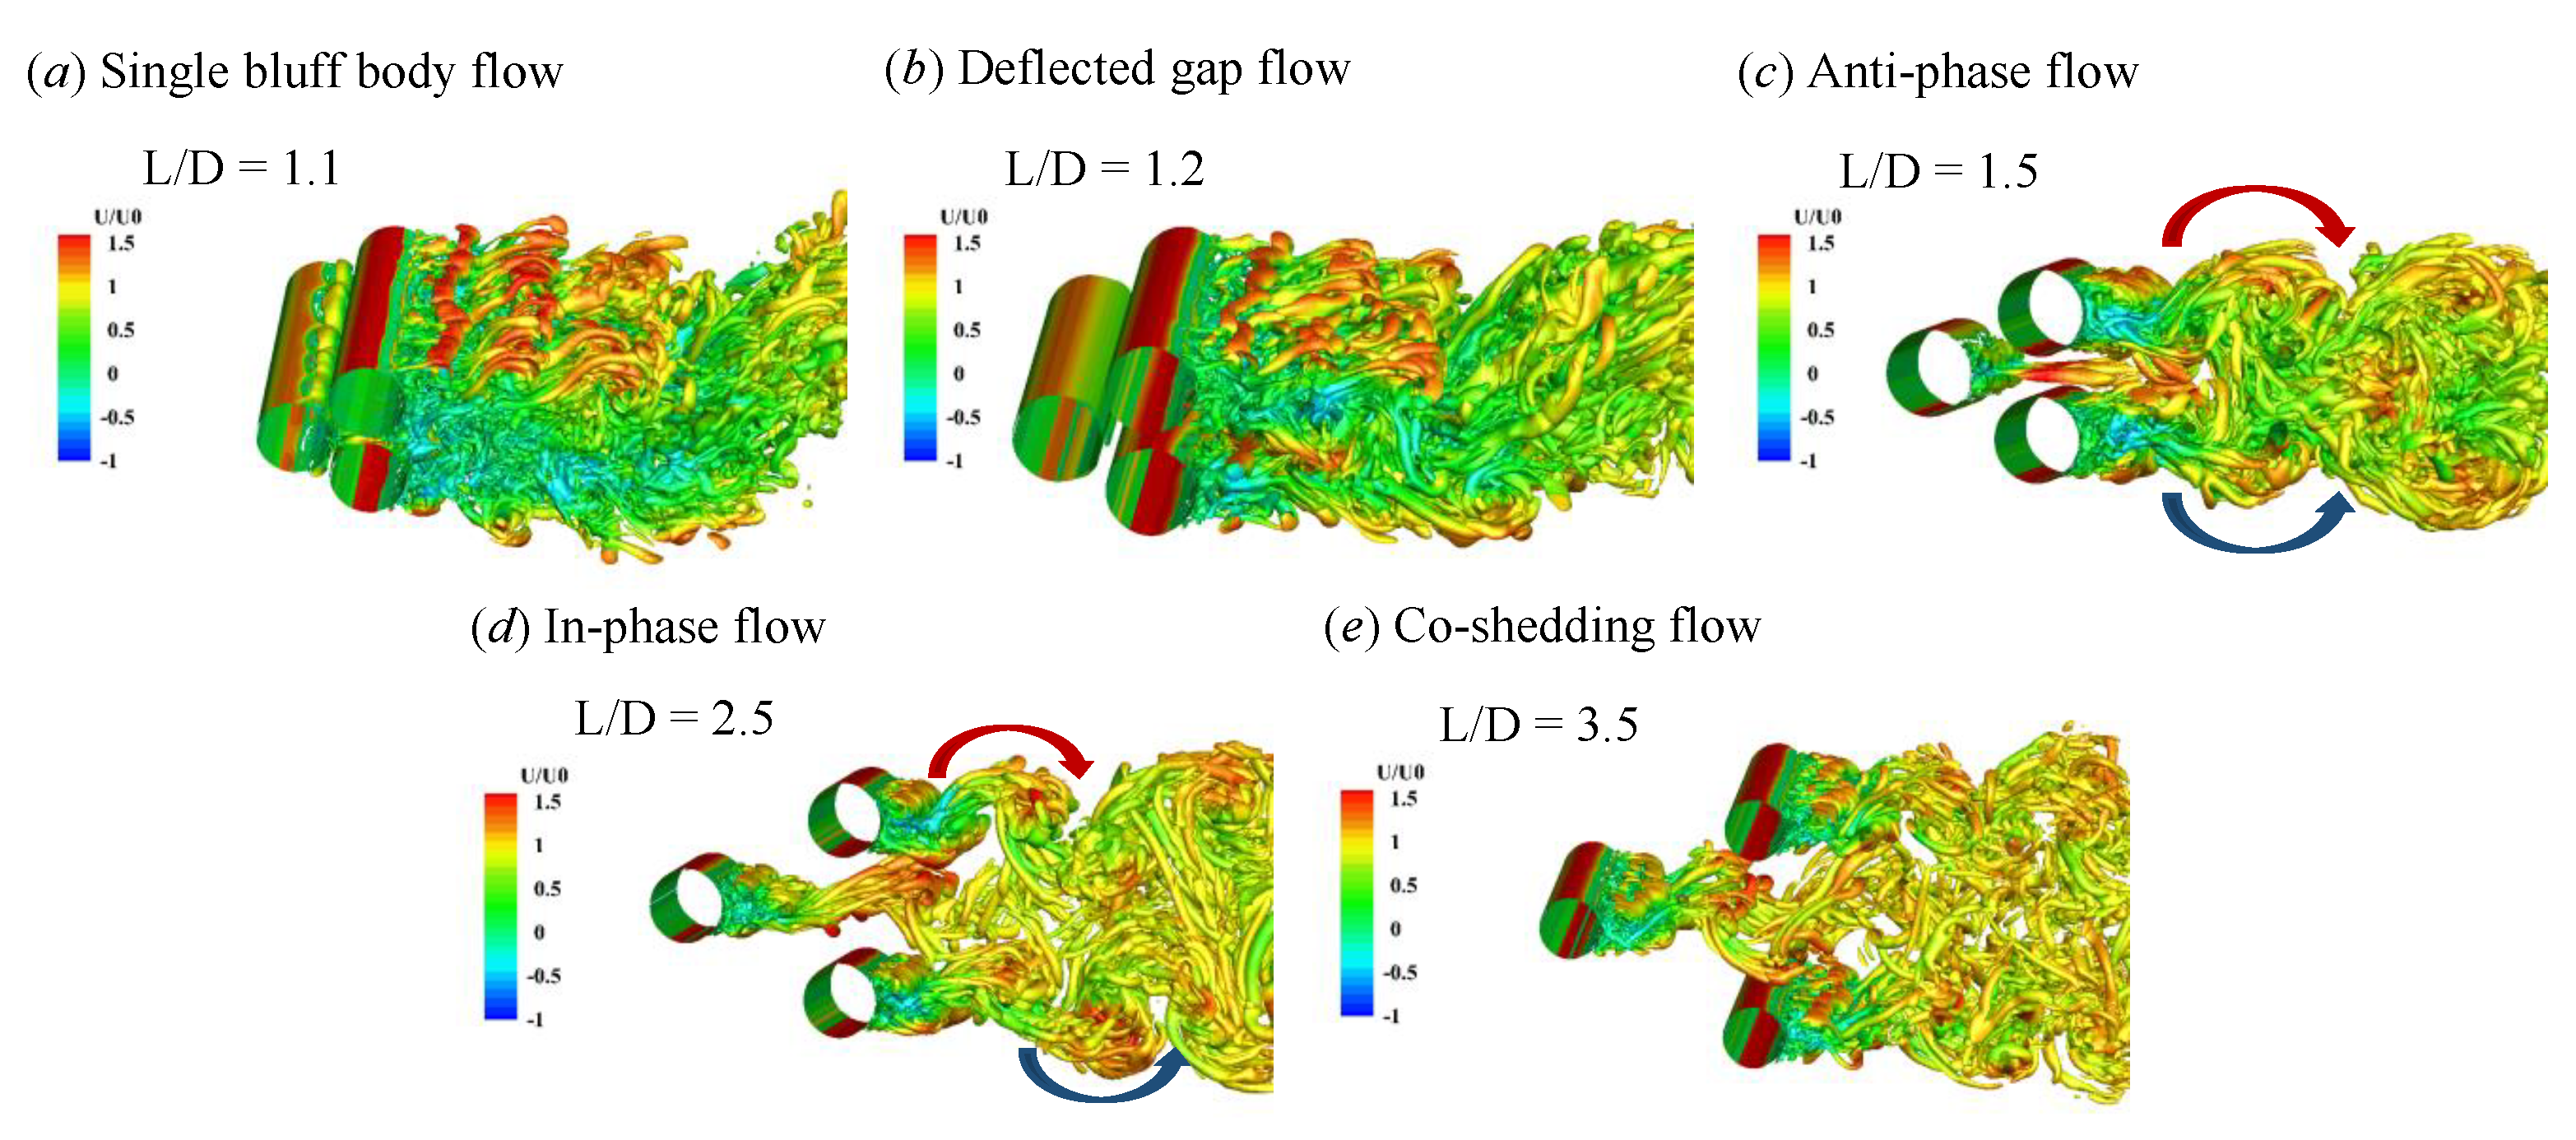
With the purpose of understanding the three-dimensional vortex structures, Figure 13 exhibits the instantaneous Q criterion [54] of each flow pattern, for the sake of brevity, only one is shown at each pattern. Q is defined as
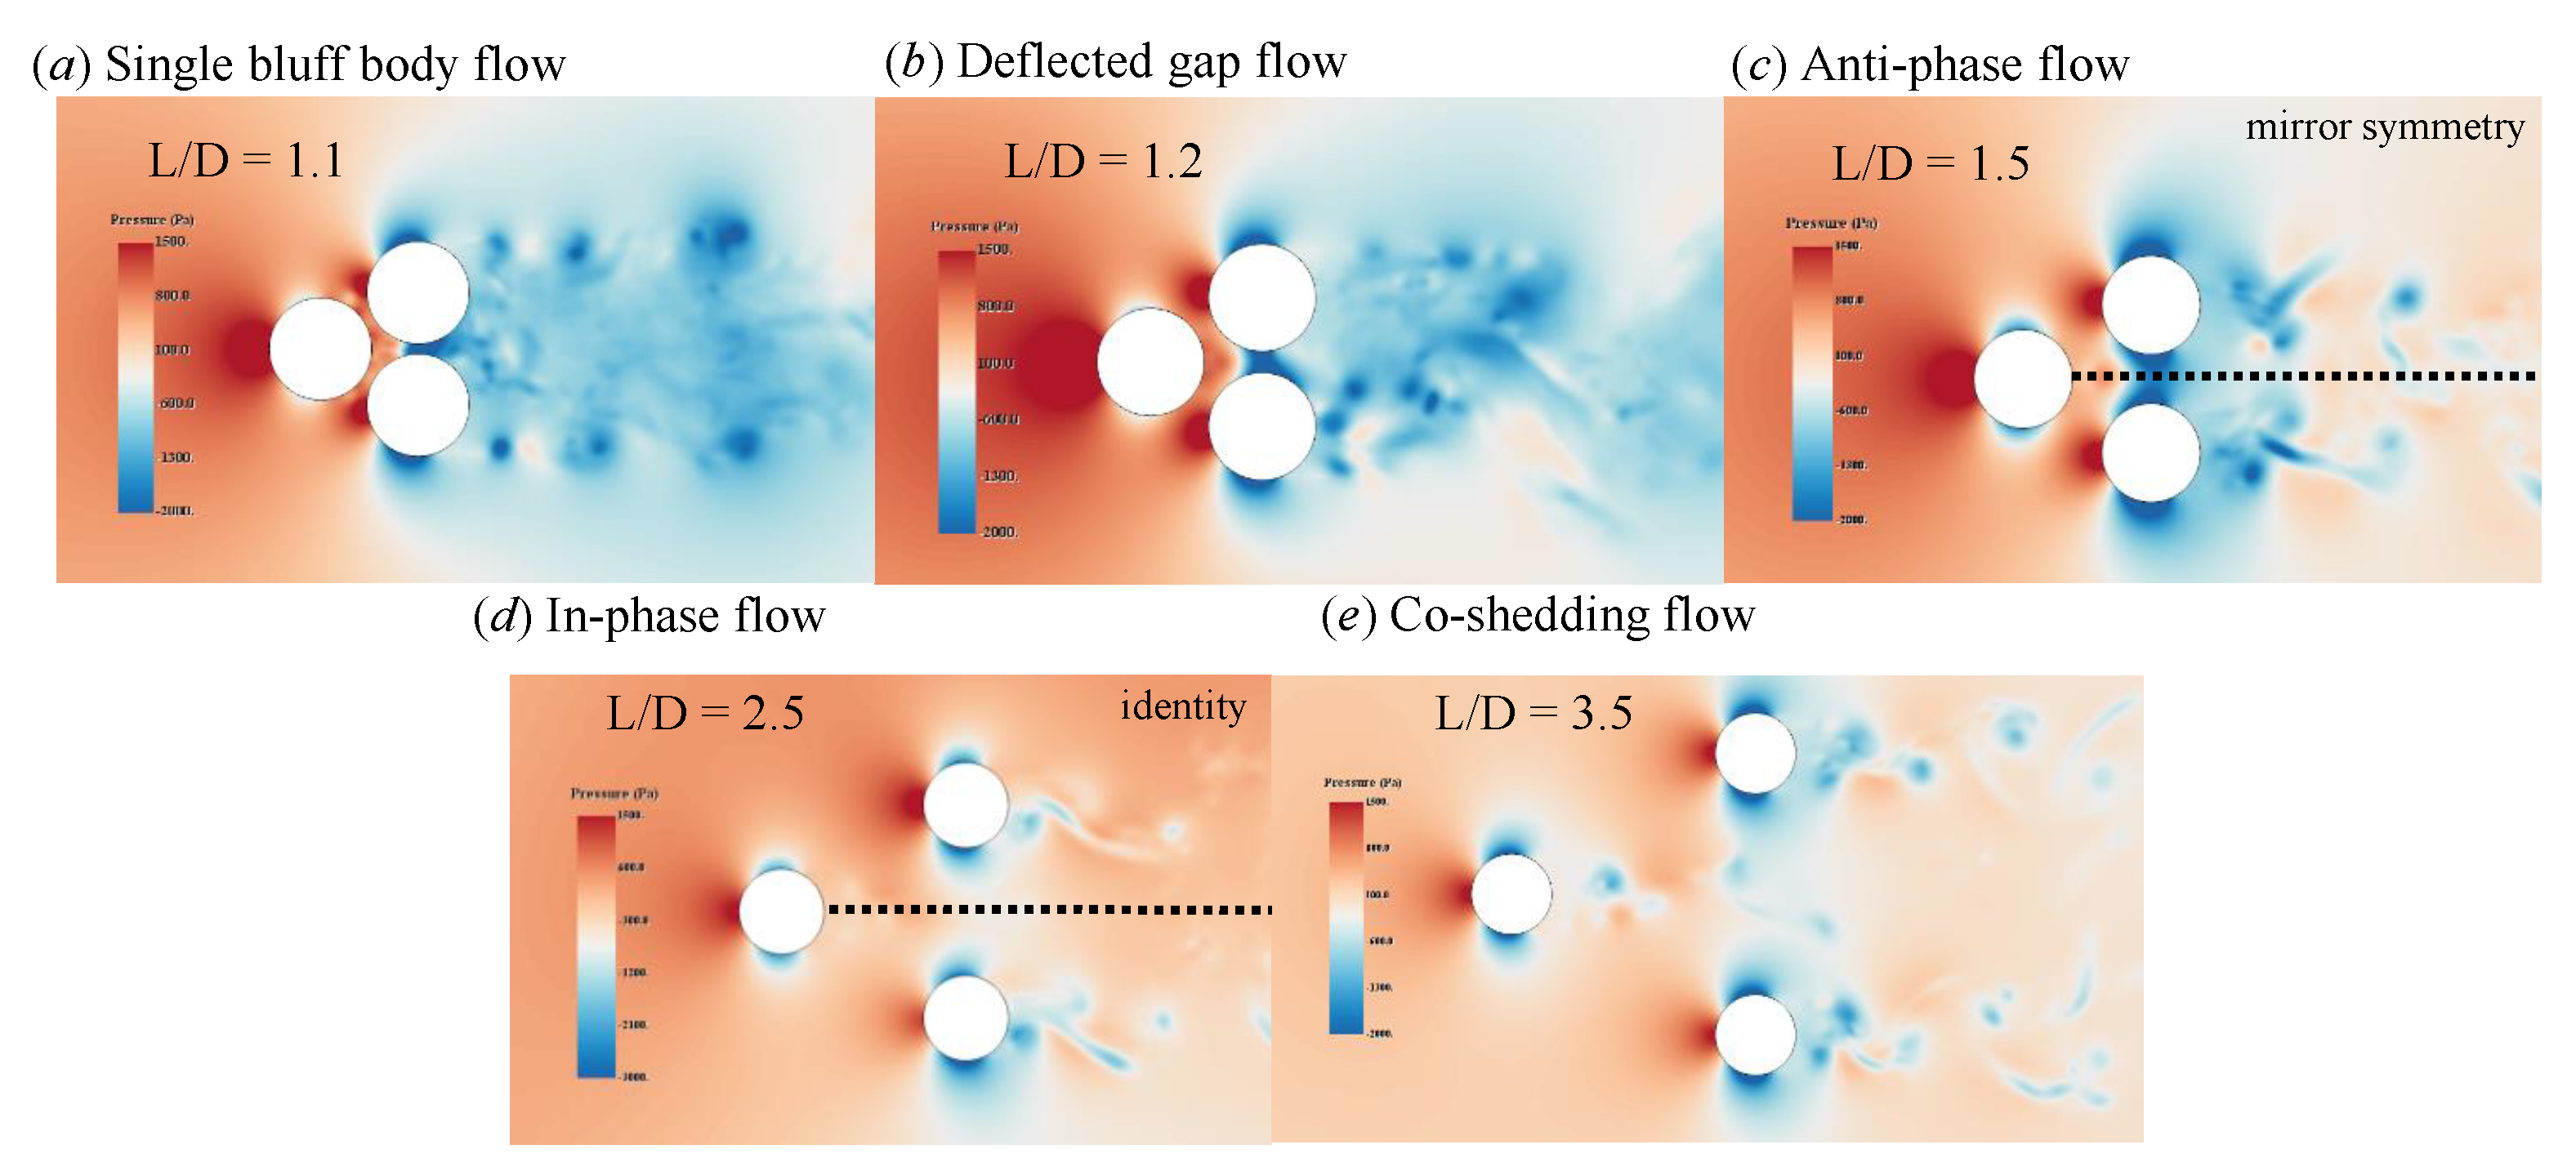
where and represent the strain and rotation tensor, respectively. Significant Kelvin–Helmholtz-type vortex structures are observed. Meantime, instantaneous pressure distributions in the middle section at different flow pattern regimes are shown in Figure 14.
The dotted line indicates the central line behind the front cylinder. It is worth noting that, in anti-phase and in-phase flow regimes, the flow pattern behind the two downstream cylinders shows obvious different characteristics. A mirror symmetry of the vortex with the central line is observed in anti-phase flow, while an almost identical vortex shedding form exists in in-phase flow.
4.2. Fluid Force Coefficients
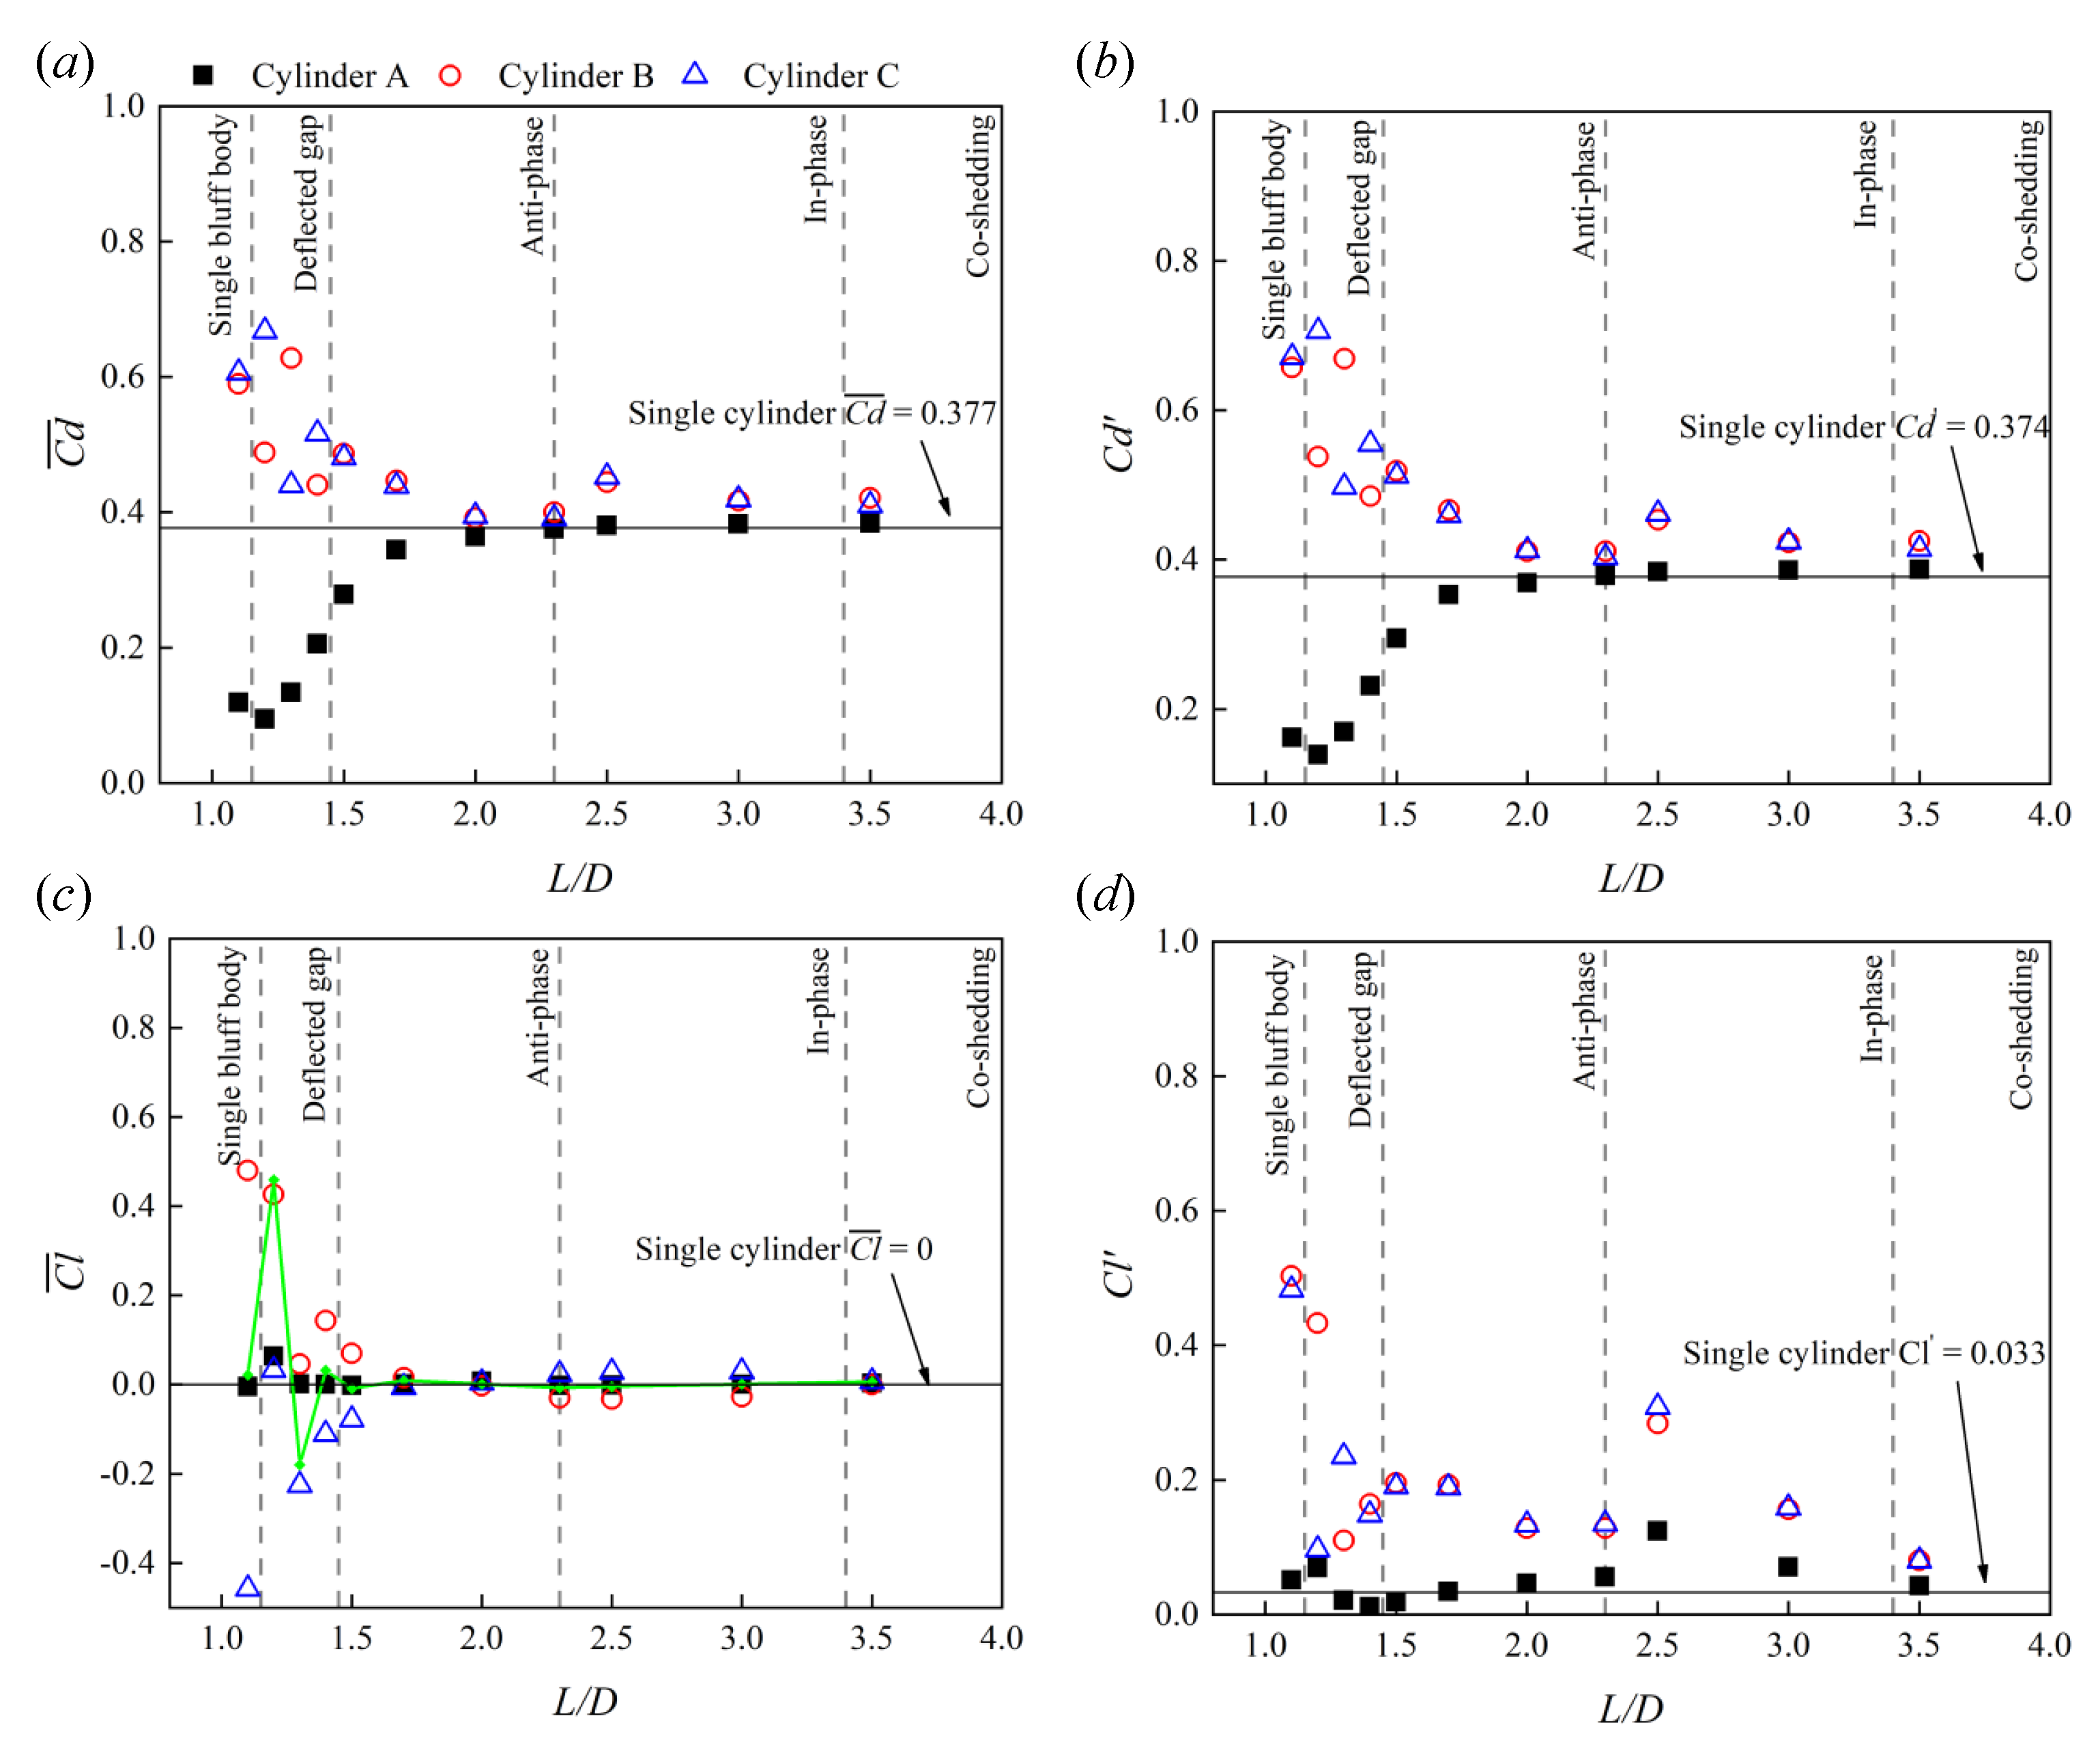
Figure 15a,b shows the mean and fluctuating drag force coefficients of the three cylinders, respectively. When , the drag forces on the downstream cylinders are identical and significantly greater than on the upstream cylinder. When , two distinct drag force coefficients were obtained for downstream cylinders, which suggests that this belongs to the deflected gap flow regime. As increases, the drag coefficients for the downstream cylinders remain identical and slowly converge to the drag coefficient for the flow past the single cylinder. It is worth noting that at , which belongs to the early onset of in-phase flow, the drag coefficient suddenly increases. The shows similar characteristics with as shown in Figure 15b.
Figure 15c,d presents the mean and fluctuating lift force coefficients for different , respectively. At , Figure 15c illustrates that there is a strong repulsive force between the two downstream cylinders. It is due to the existence of a pressure difference between the gap side and free-stream side of the downstream cylinders, which can be shown distinctly in pressure distributions in the middle section of Figure 14a. As shown in Figure 14a, in the case of downstream cylinder B, for example, the negative pressure zone on its free-stream side is shifted forward, while the negative pressure zone on its gap side is shifted back, which results in an upward lift force. When = 1.2–1.4, the sum of two downstream cylinders lift force coefficients, which is presented by the green line, is not zero, and the absolute value of the sum lift coefficient decreases with the increase of . The direction of the sum lift coefficient is opposite to the direction the deflected flow is biased towards. When , there is a weak attractive force between the downstream cylinders. As goes to 3.5, the lift force coefficients of all cylinders is close to zero, which fits the scenario of a single cylinder. As shown in Figure 15d, similarly to the , the downstream cylinders undergo a higher than that of the upstream cylinder. At , of the downstream cylinder reaches a maximum. At = 1.2–1.4, the downstream cylinder with a wider wake has a larger . As increases, of the downstream cylinders decreases. Similarly to the and distributions, of the three cylinders increases abruptly at and then decreases gradually back to be consistent with that of a single cylinder. We regarded that the special phase lag between all three cylinders at causes the higher , , and . A phase lag of occurring at the early period of the in-phase flow regime enriches the shedding of vortices. The observation of fluid coefficients suggests that the interactions among the three cylinders is apparently strong at single bluff body flow, deflected gap flow, and the start of in-phase flow.
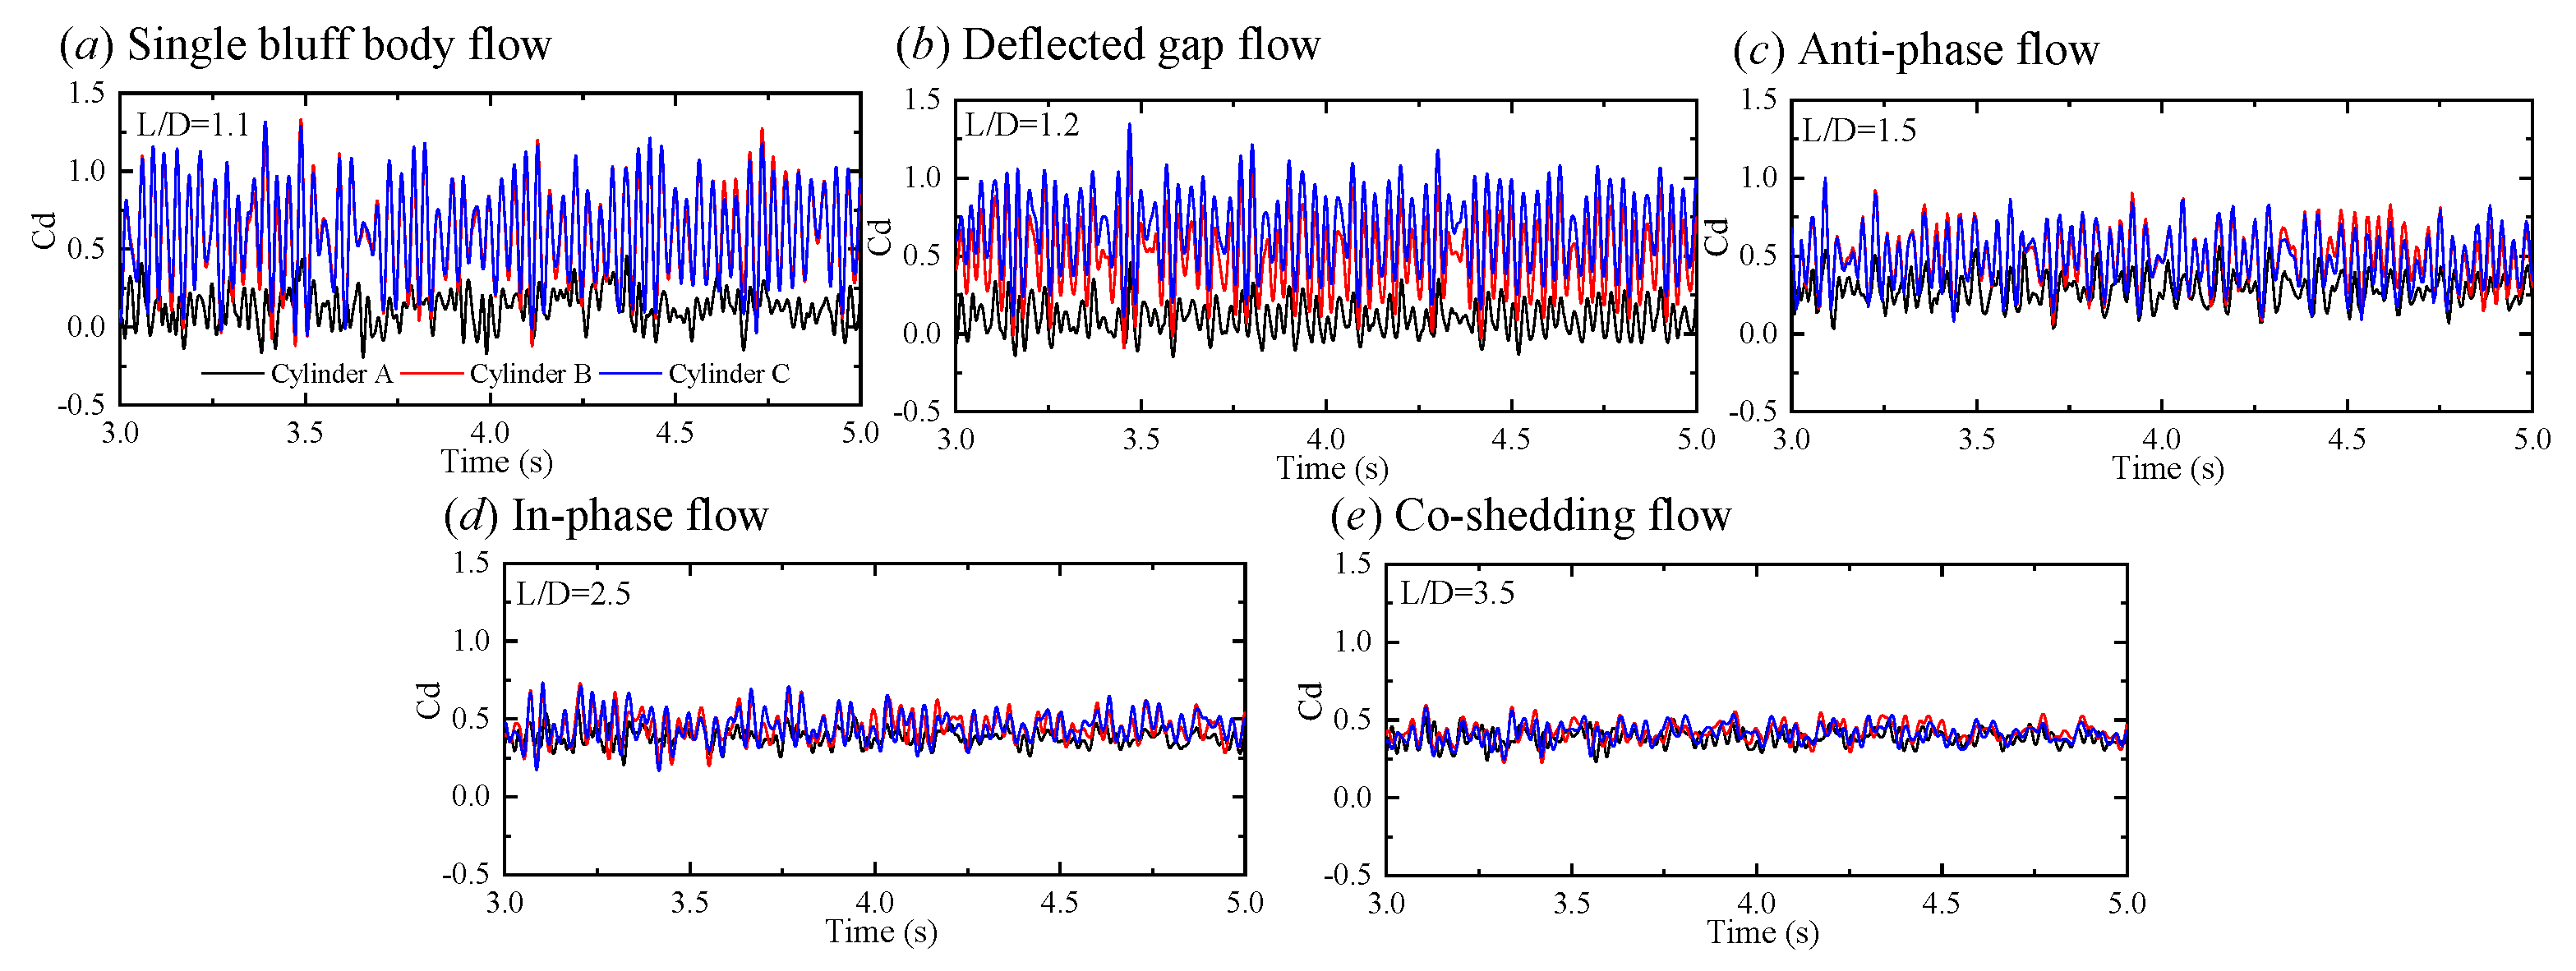
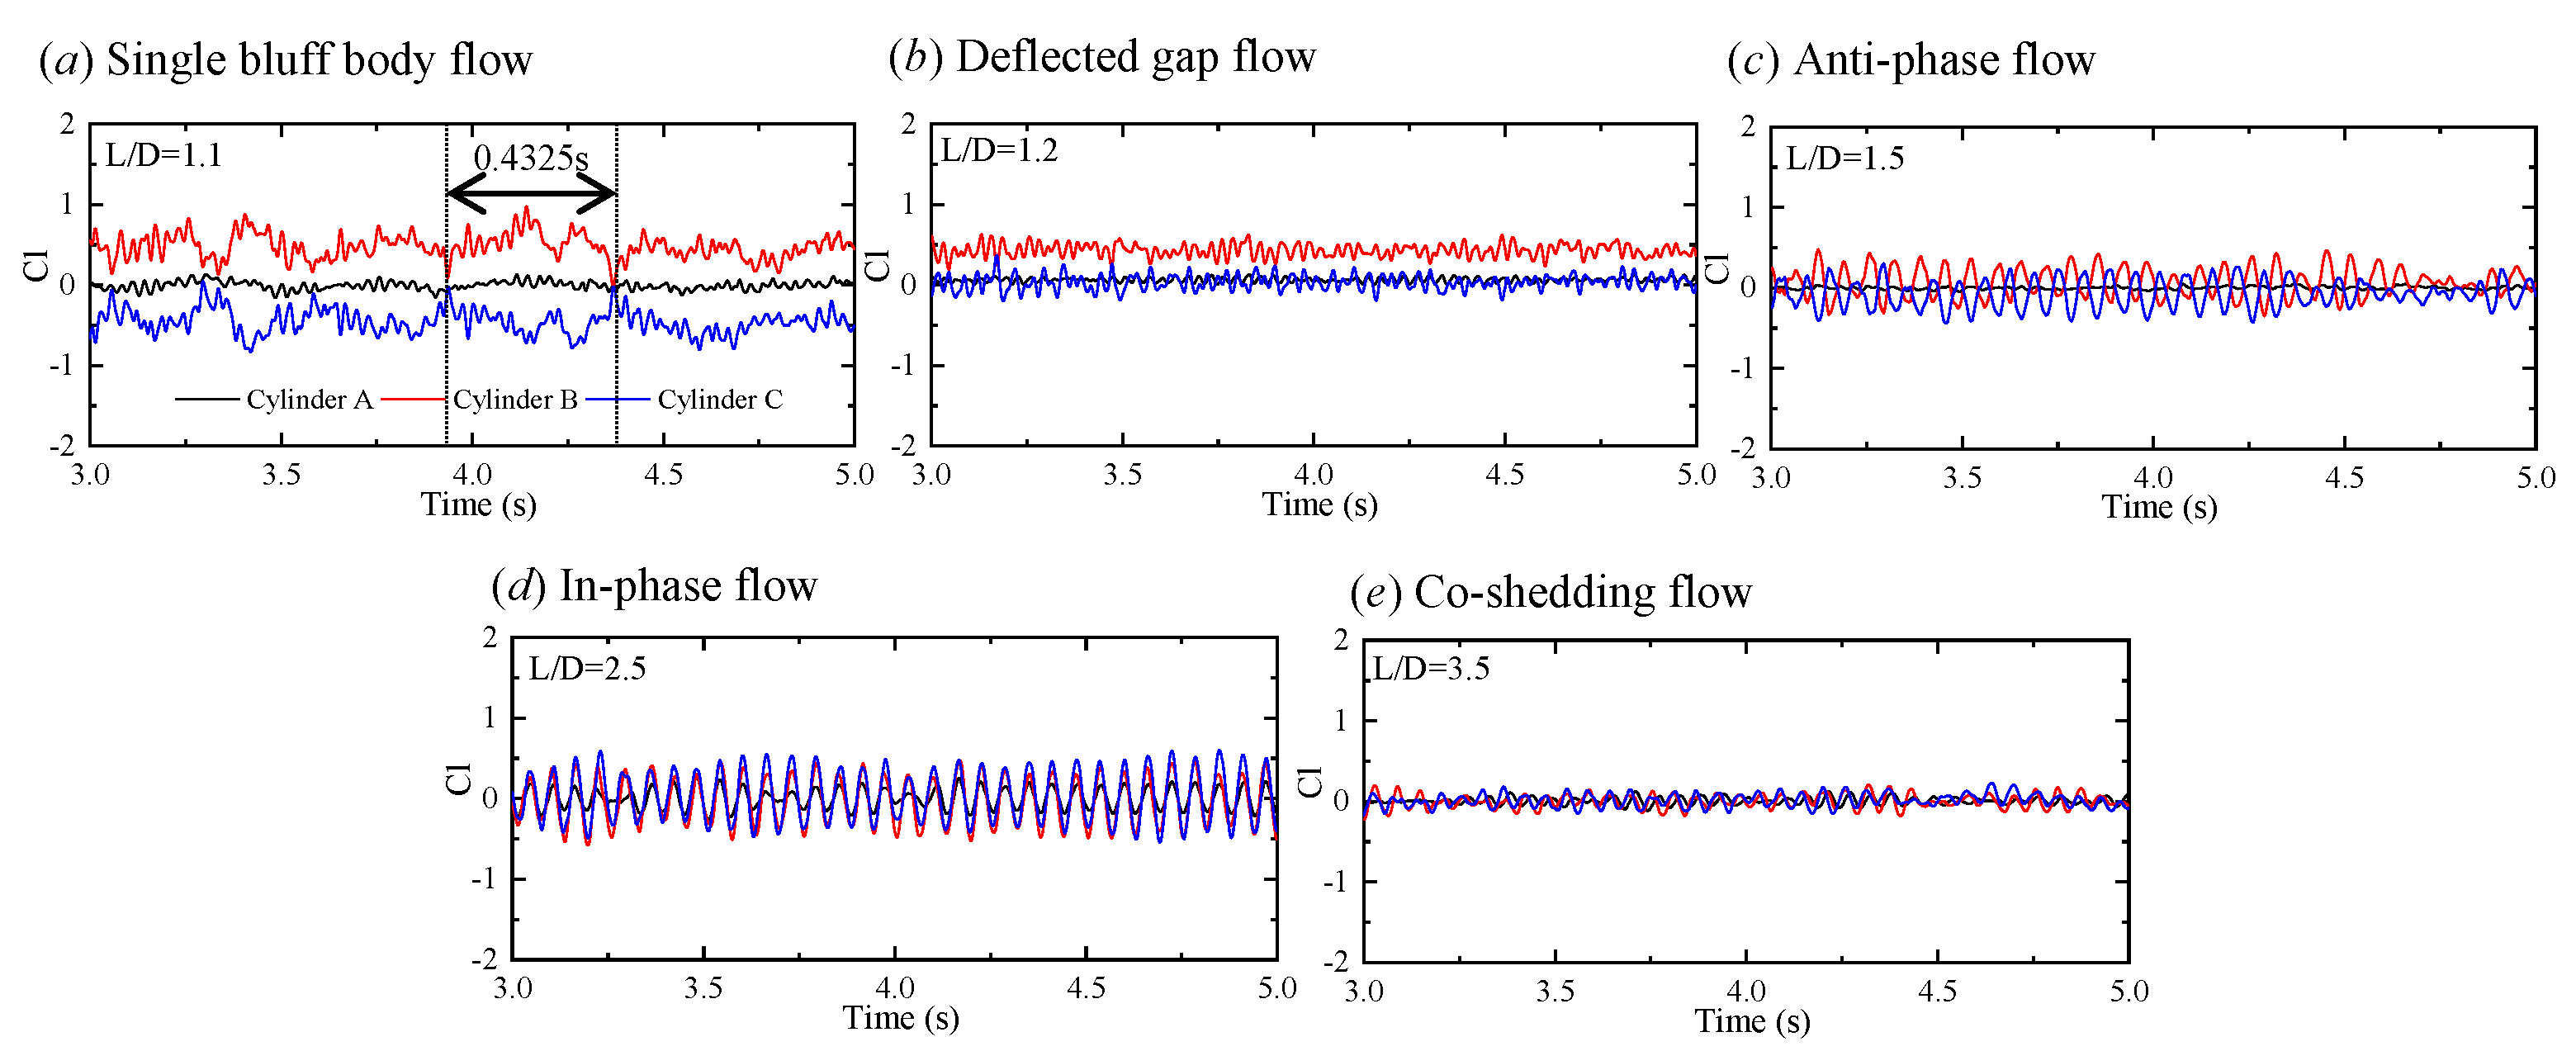
Figure 16 and Figure 17 show the time history curves of and at several critical s for each flow pattern, respectively.
It can be seen that the values of both drag and lift fluctuations for the upstream cylinder are smaller than those for the downstream cylinders. When , the reason for the lift fluctuations in the cylinder A is the motion of the shear layers, but for cylinders B and C, it is the vortex shedding. It is worth noting that at , curve of the downstream cylinders has some certain periodicity. The period () illustrated in Figure 17a, which is related to the time interval between the two minimum values of cylinder B and also the two maximum values of cylinder C, corresponding to , can be found in Figure 18a in the next section as the main frequency of cylinders B and C at .
This low frequency is due to the developmentally restricted shear layers of cylinder A.
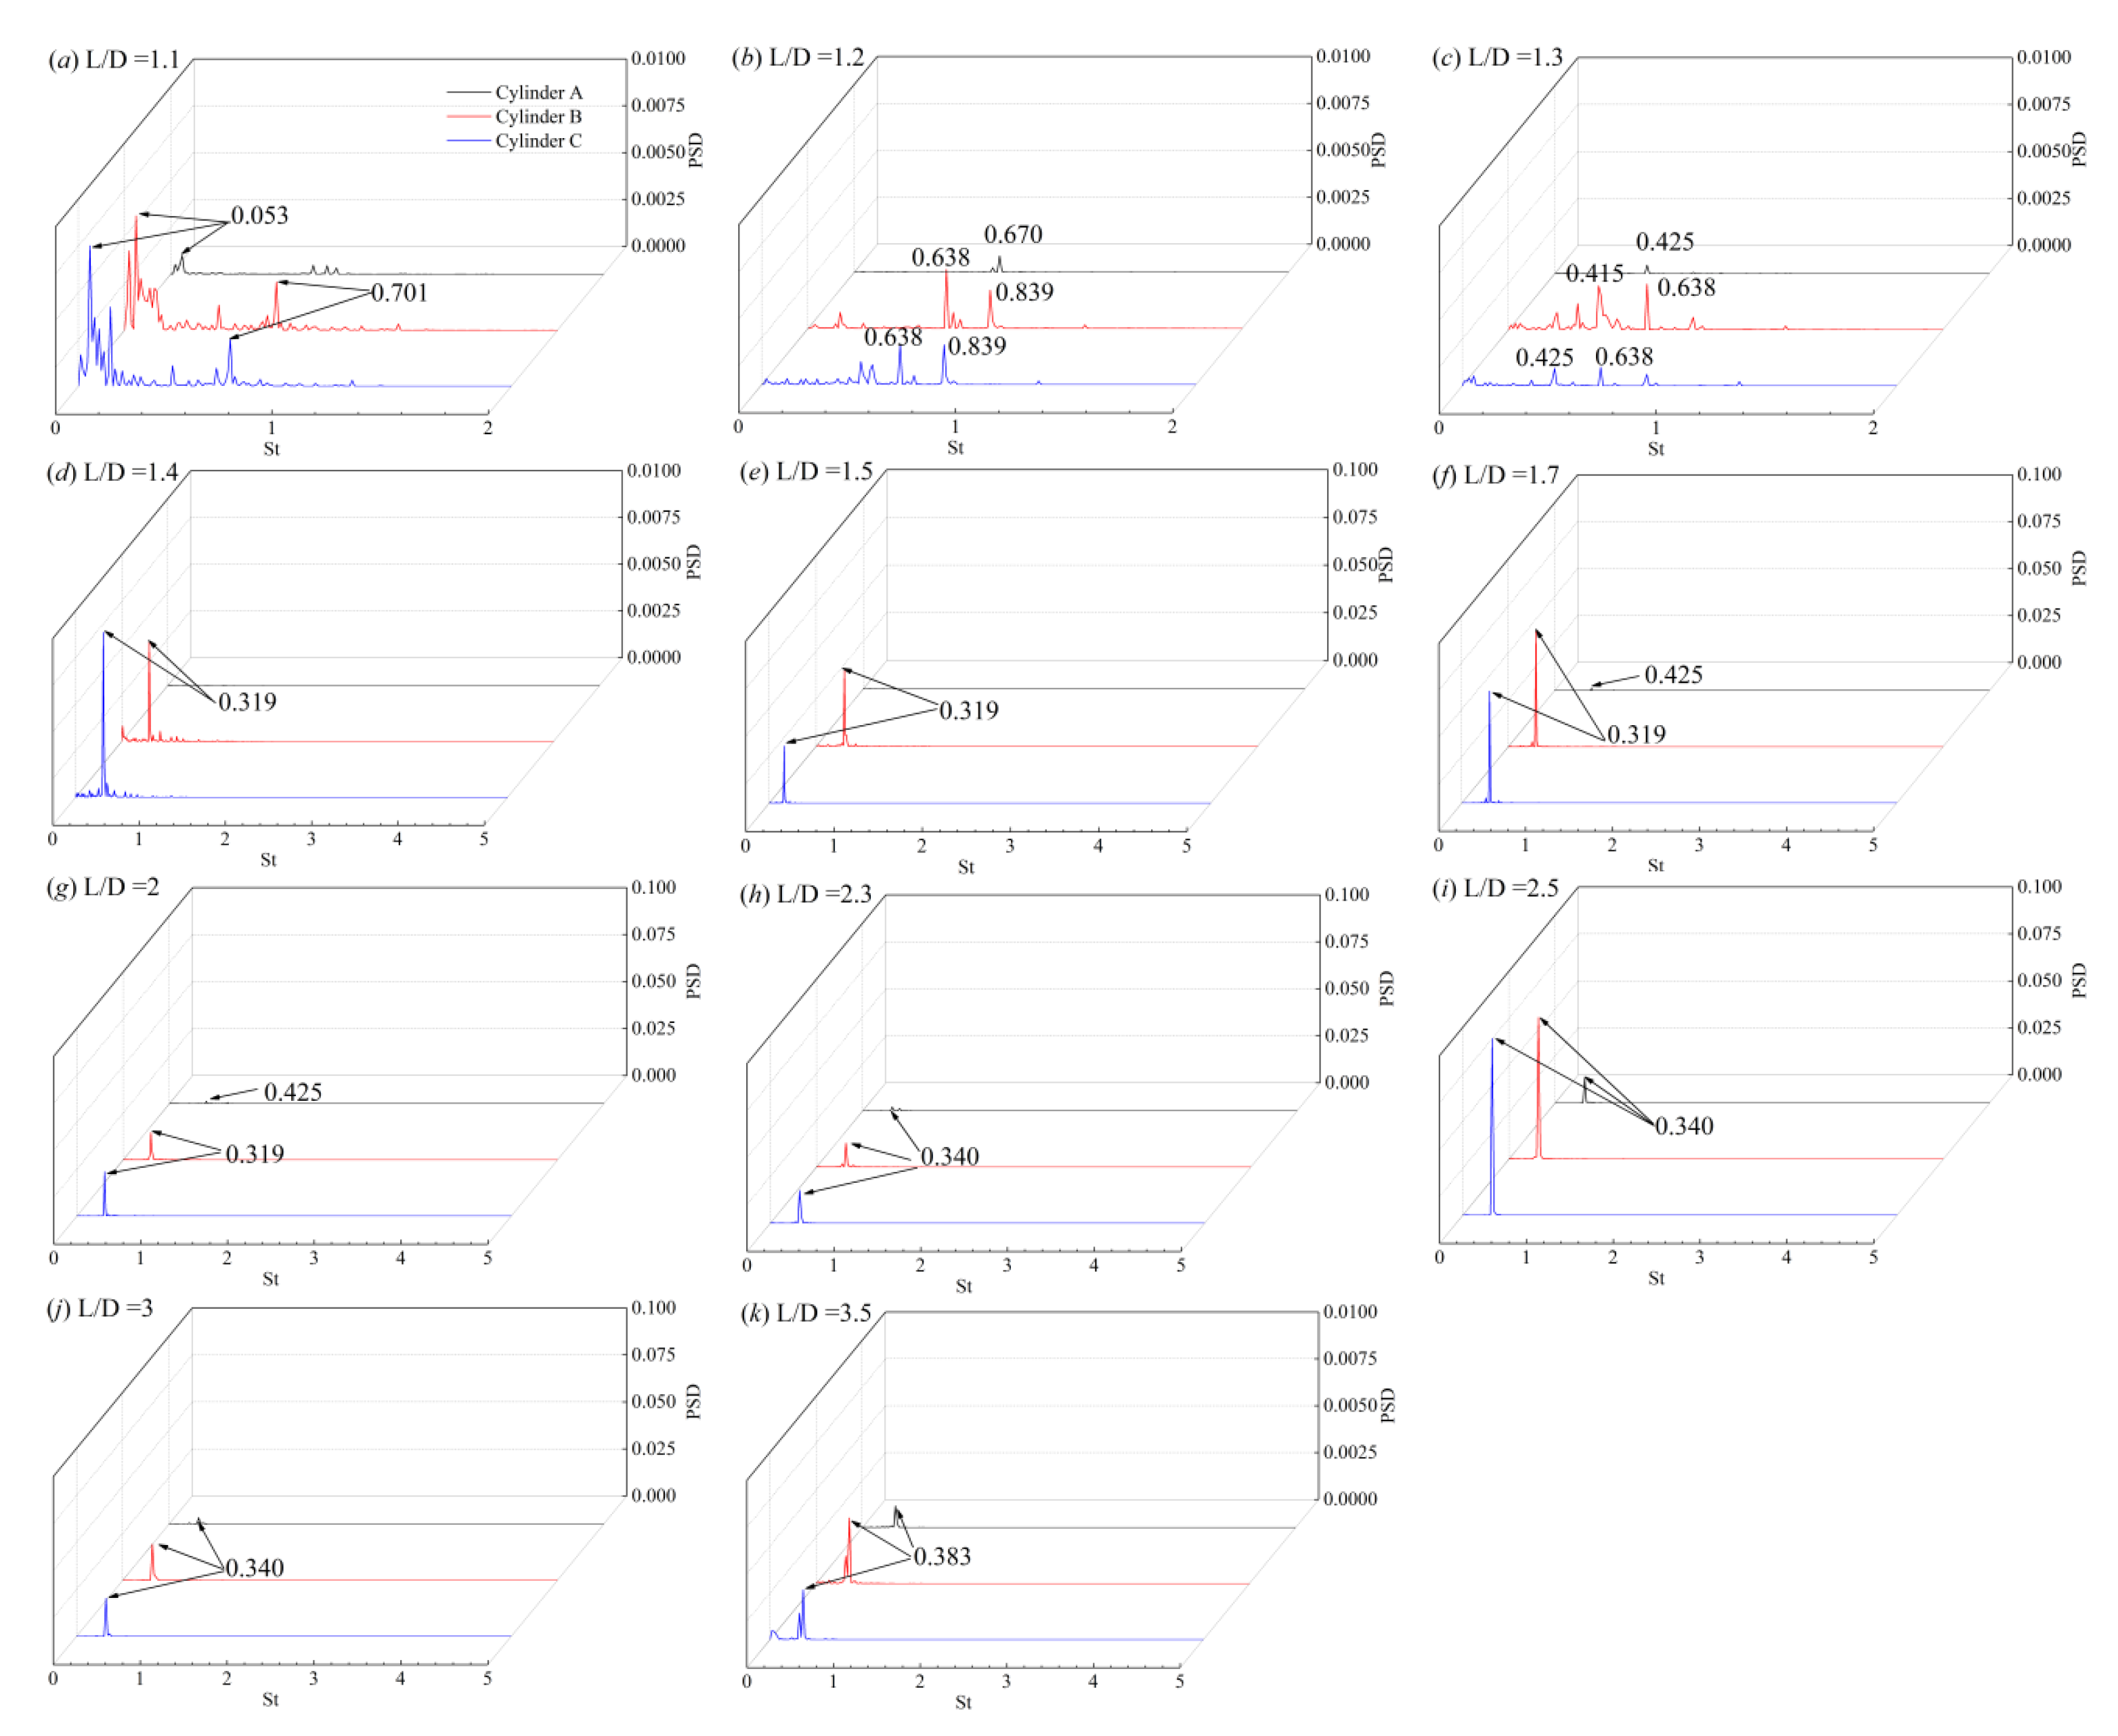
Figure 18.
Power spectral density (PSD) of of each cylinder at different .

4.3. Vortex Shedding Frequencies
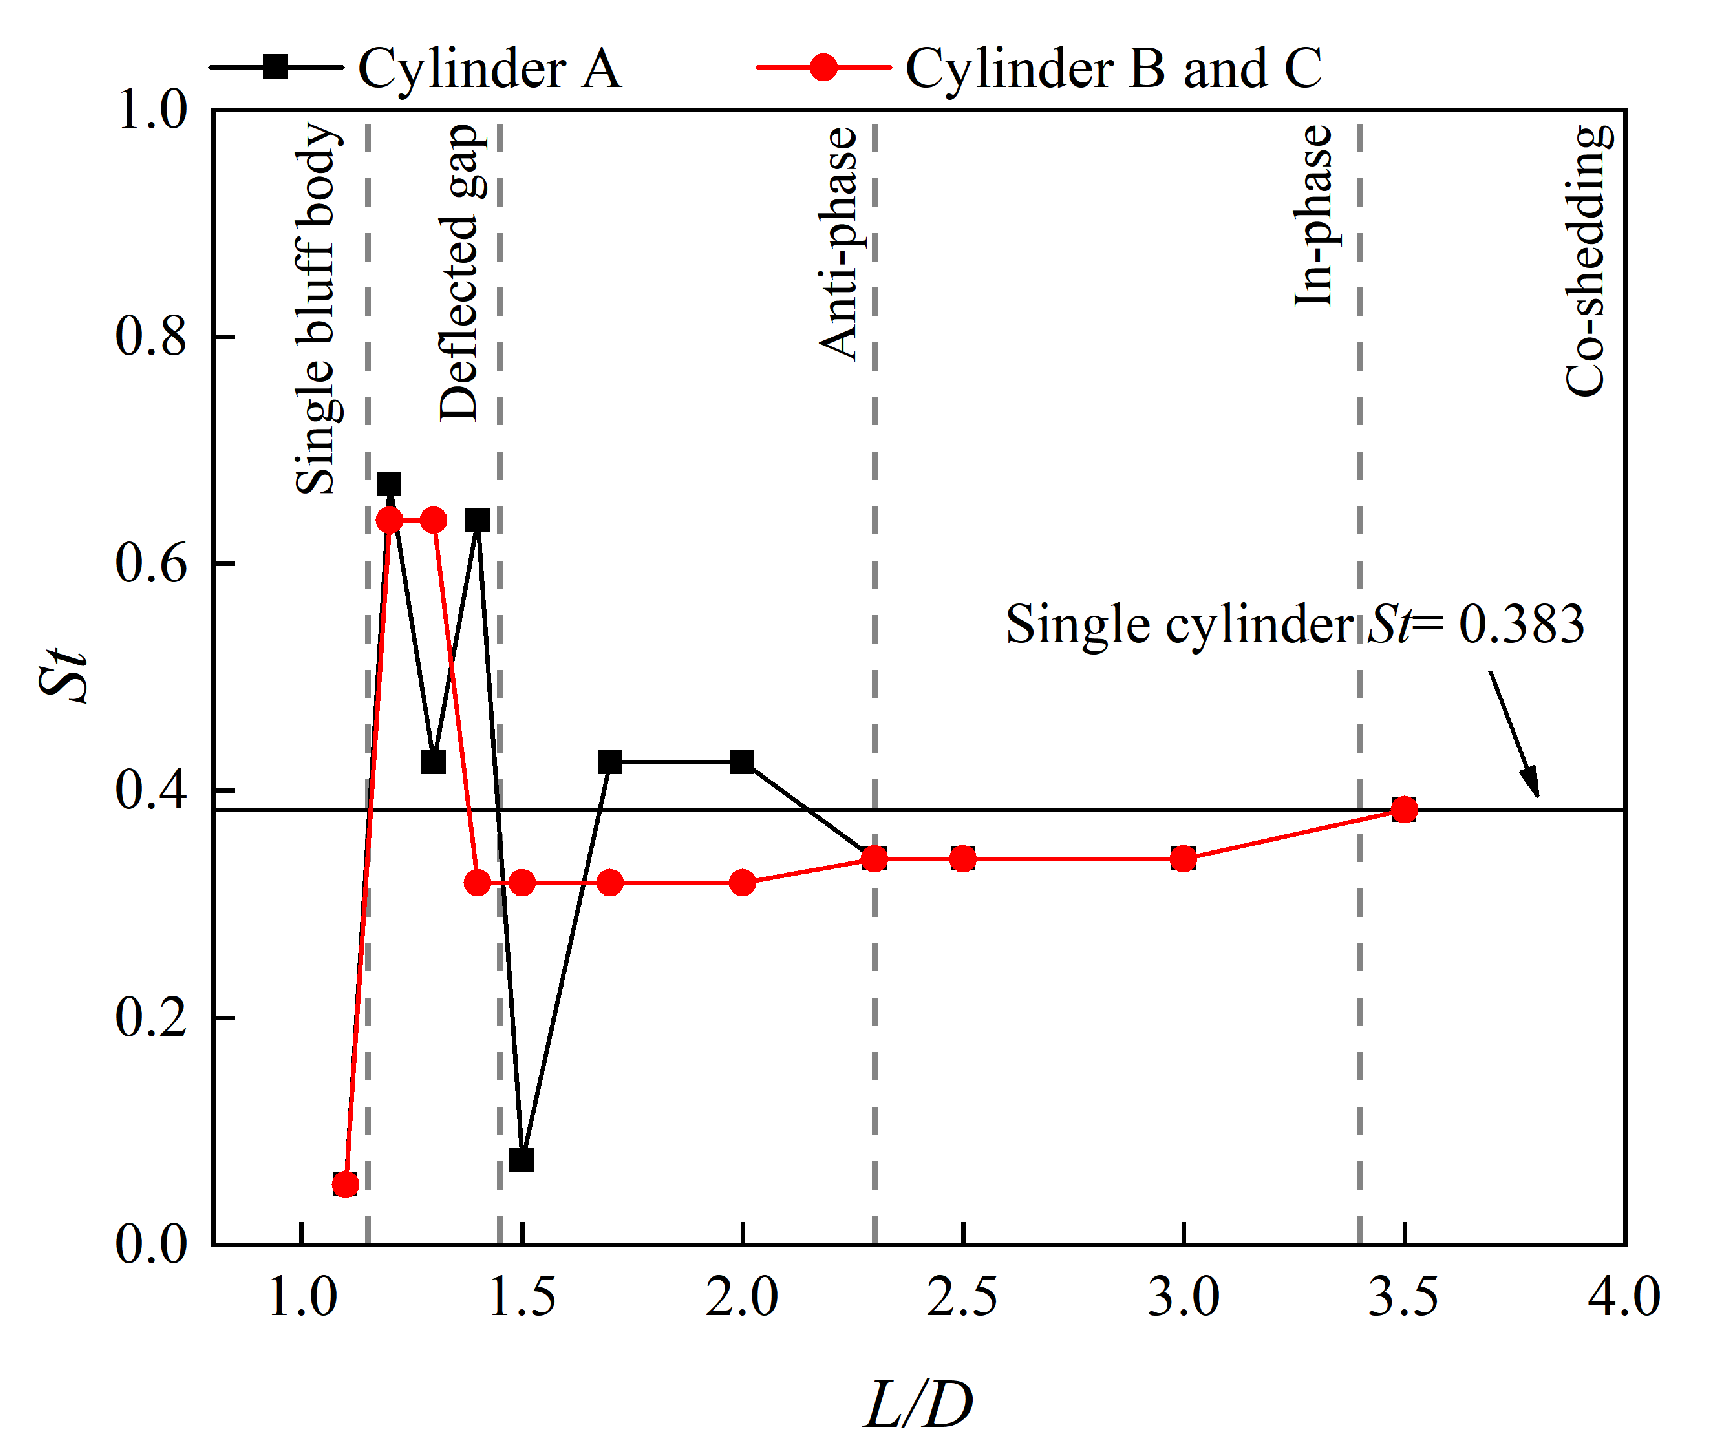
Figure 19 presents the lift coefficients power spectral density of three cylinders at various , respectively. The Strouhal number is defined as . At , the spectra of downstream cylinders are broad-banded. A dominant frequency of can be identified for the three cylinders. In addition, a second harmonic frequency of occurs. It can be attributed to the interactions of shear layers generated at cylinder A with those from the front side of cylinders B and C. The existence of a second harmonic frequency at low at is consistent with that for low Reynolds numbers () by Chen et al. [21]. At , only one spectral peak is identified in the upstream cylinder, and , respectively. While downstream cylinders’ power spectral density has multiple peaks and the corresponding power of these peaks are at similar values, illustrating that drastic vortex interaction exists. In contrast to the biased-gap flow pattern found for two cylinders placed side by side [7], which led to the observation that a wider wake cylinder has a lower vortex shedding frequency than the narrow wake cylinder, the dominate frequency of the two cylinders with either wide or narrow wake has the same value. This could be because of the presence of cylinder A. As increases to 1.4, dominant frequency, , occurs at the downstream cylinders. This implies that the interaction between the shedding processes weakens as the gap space is greater. However, as displayed in Figure 7e,f, the gap flow at still has a tendency of bias towards cylinder C. It demonstrates that is a critical spacing ratio from deflected gap flow to anti-phase flow. As increases, the of all cylinders gradually approach that of the flow past a single cylinder. When , all cylinders have the same frequency (), which is equivalent to that of a single cylinder. This indicates that the disturbance becomes very weak and that each vortex shedding behind every cylinder behaves like the flow past a single cylinder. Furthermore, it is notable to highlight that the power density is much higher at the dominant frequency when . This implies that the vortex shedding at these frequency is pronounced. This observation is in accordance with the discontinuous jump in , , and mentioned in the previous section, as shown in Figure 15.
The fluctuation of with is seen in Figure 13. As for the situations with multi-peak spectral densities, the frequency with the largest power density is collected. It is worth noting that cylinders B and C have the same dominant frequency at all ; nevertheless, only one set of data is shown for clarity. The of three cylinders is equal in single bluff body flow, in-phase flow, and co-shedding flow. It reaches the minimum value at . In the in-phase flow regime, the value of is 0.340, which is of that for a single cylinder. In the co-shedding flow regime, equals that for a single cylinder, demonstrating that is a crucial spacing ratio of the two flow regimes.
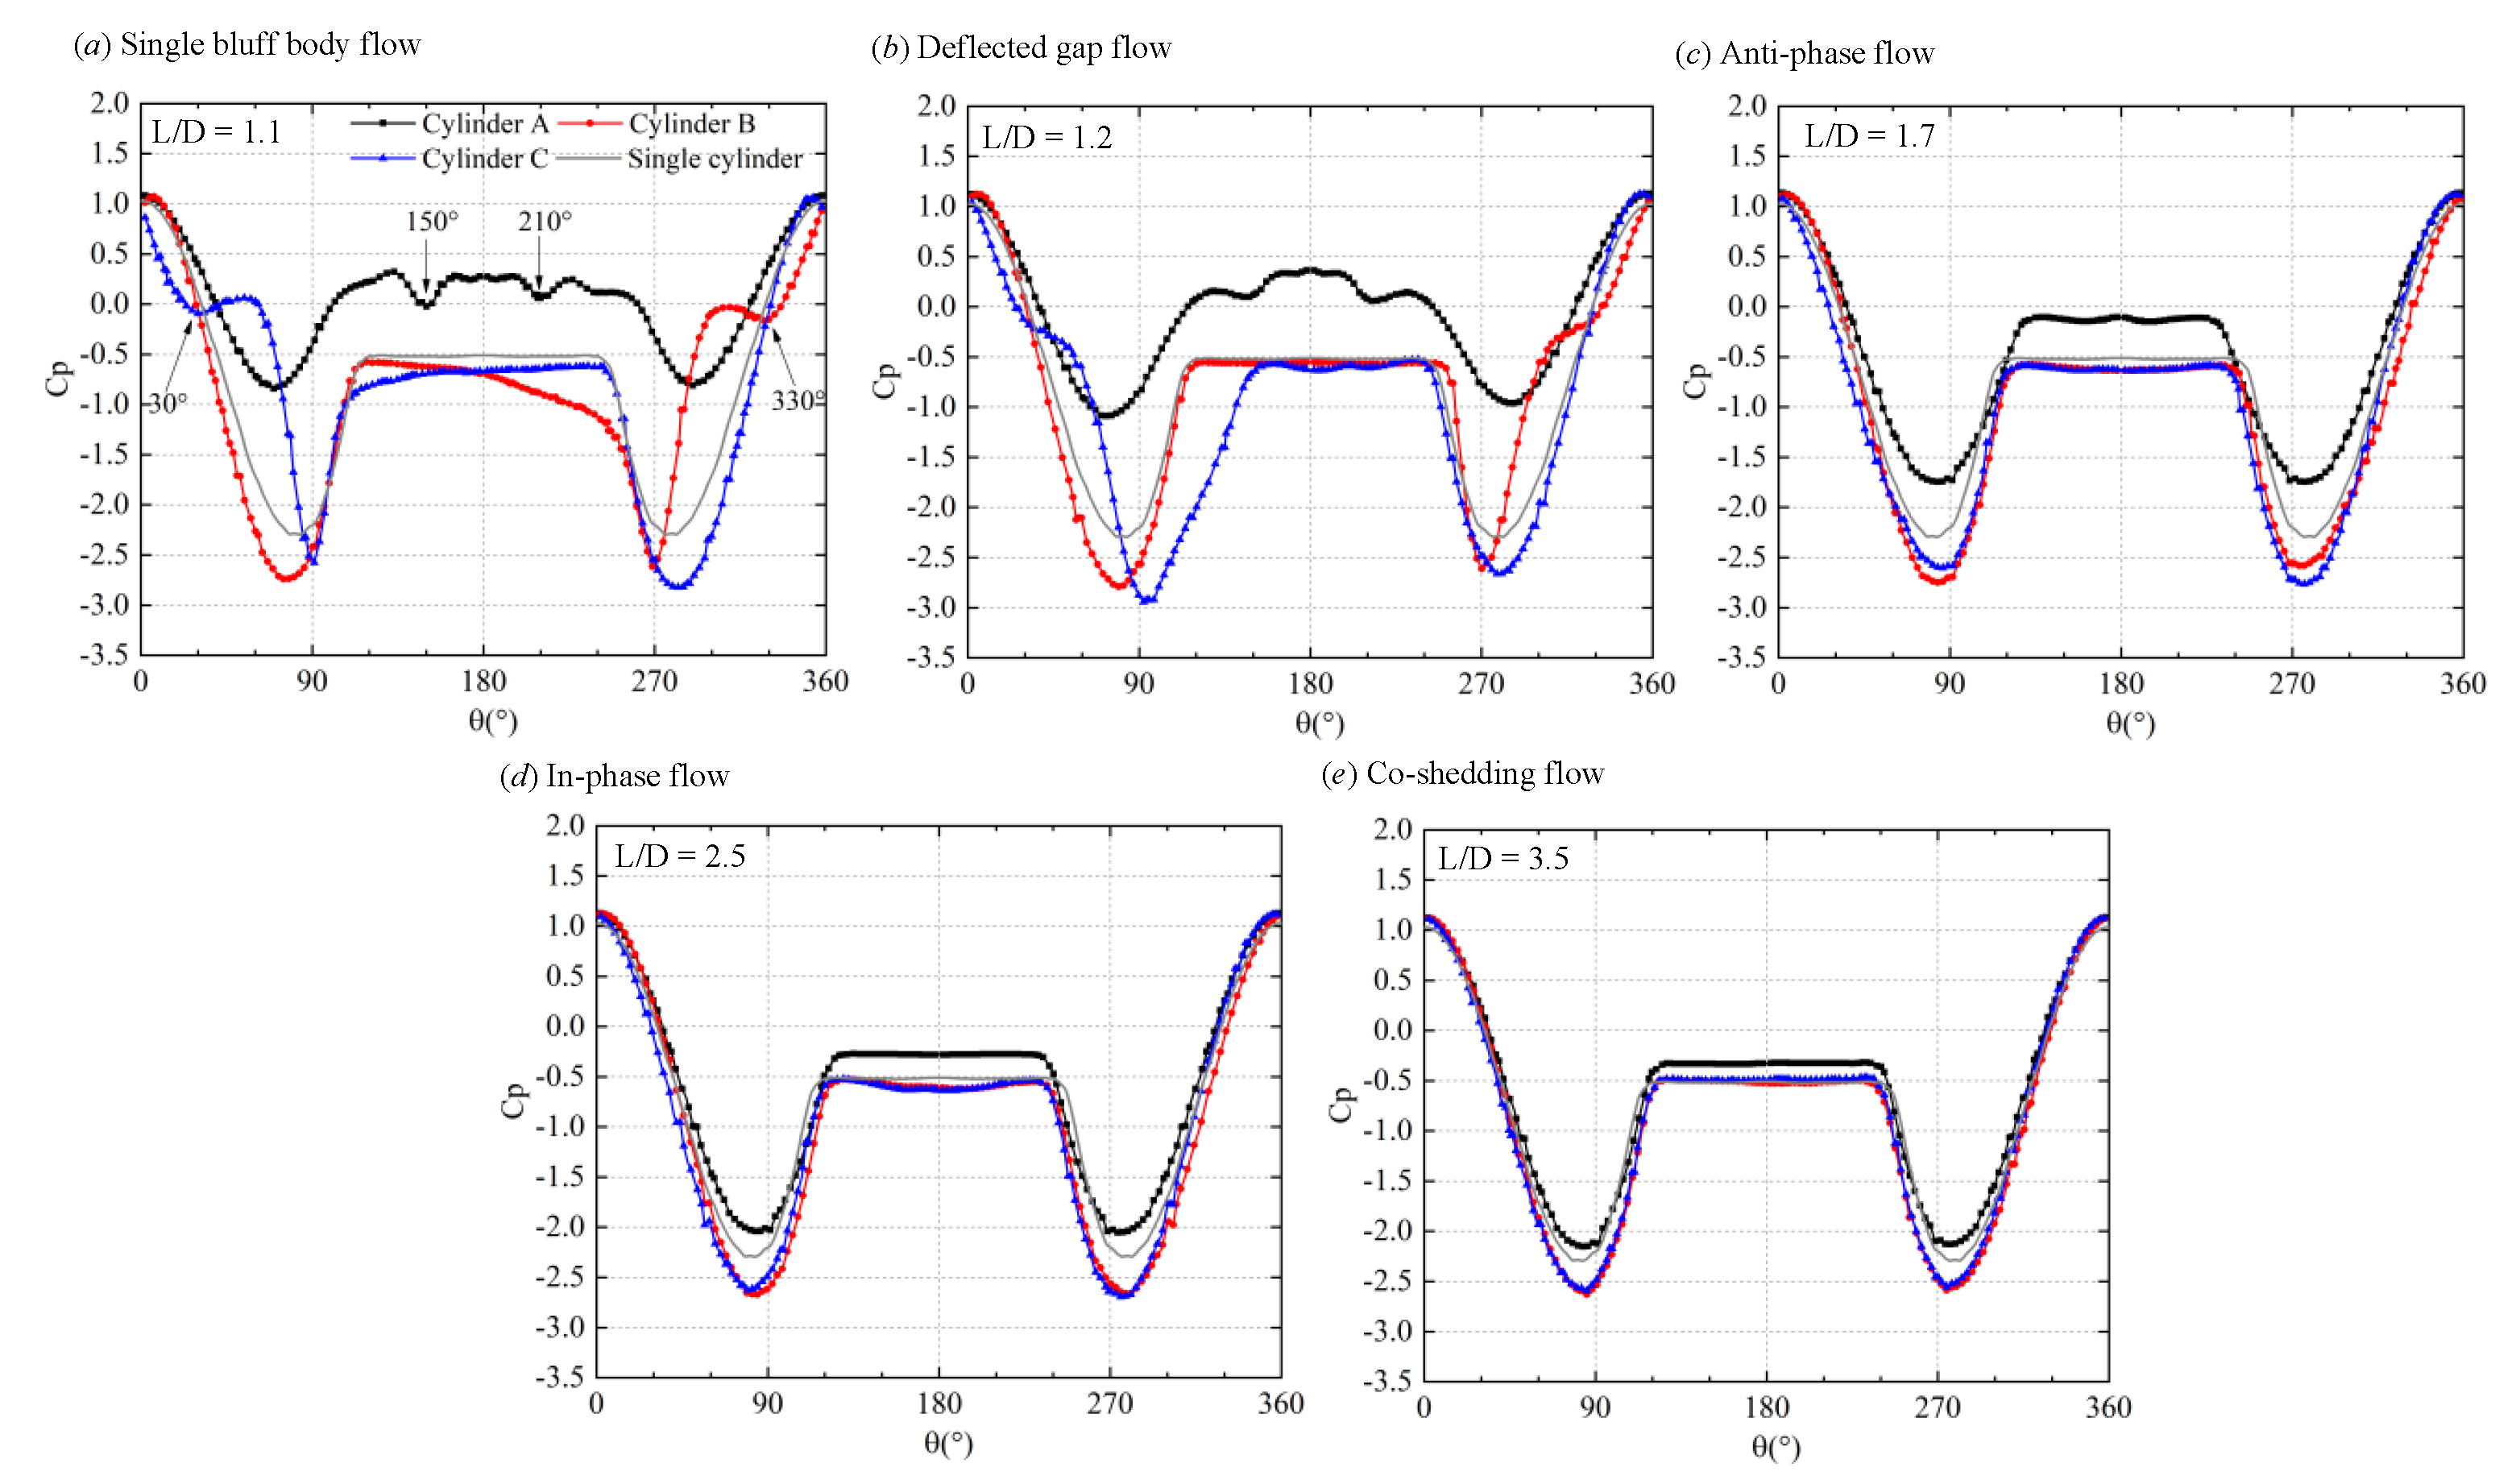
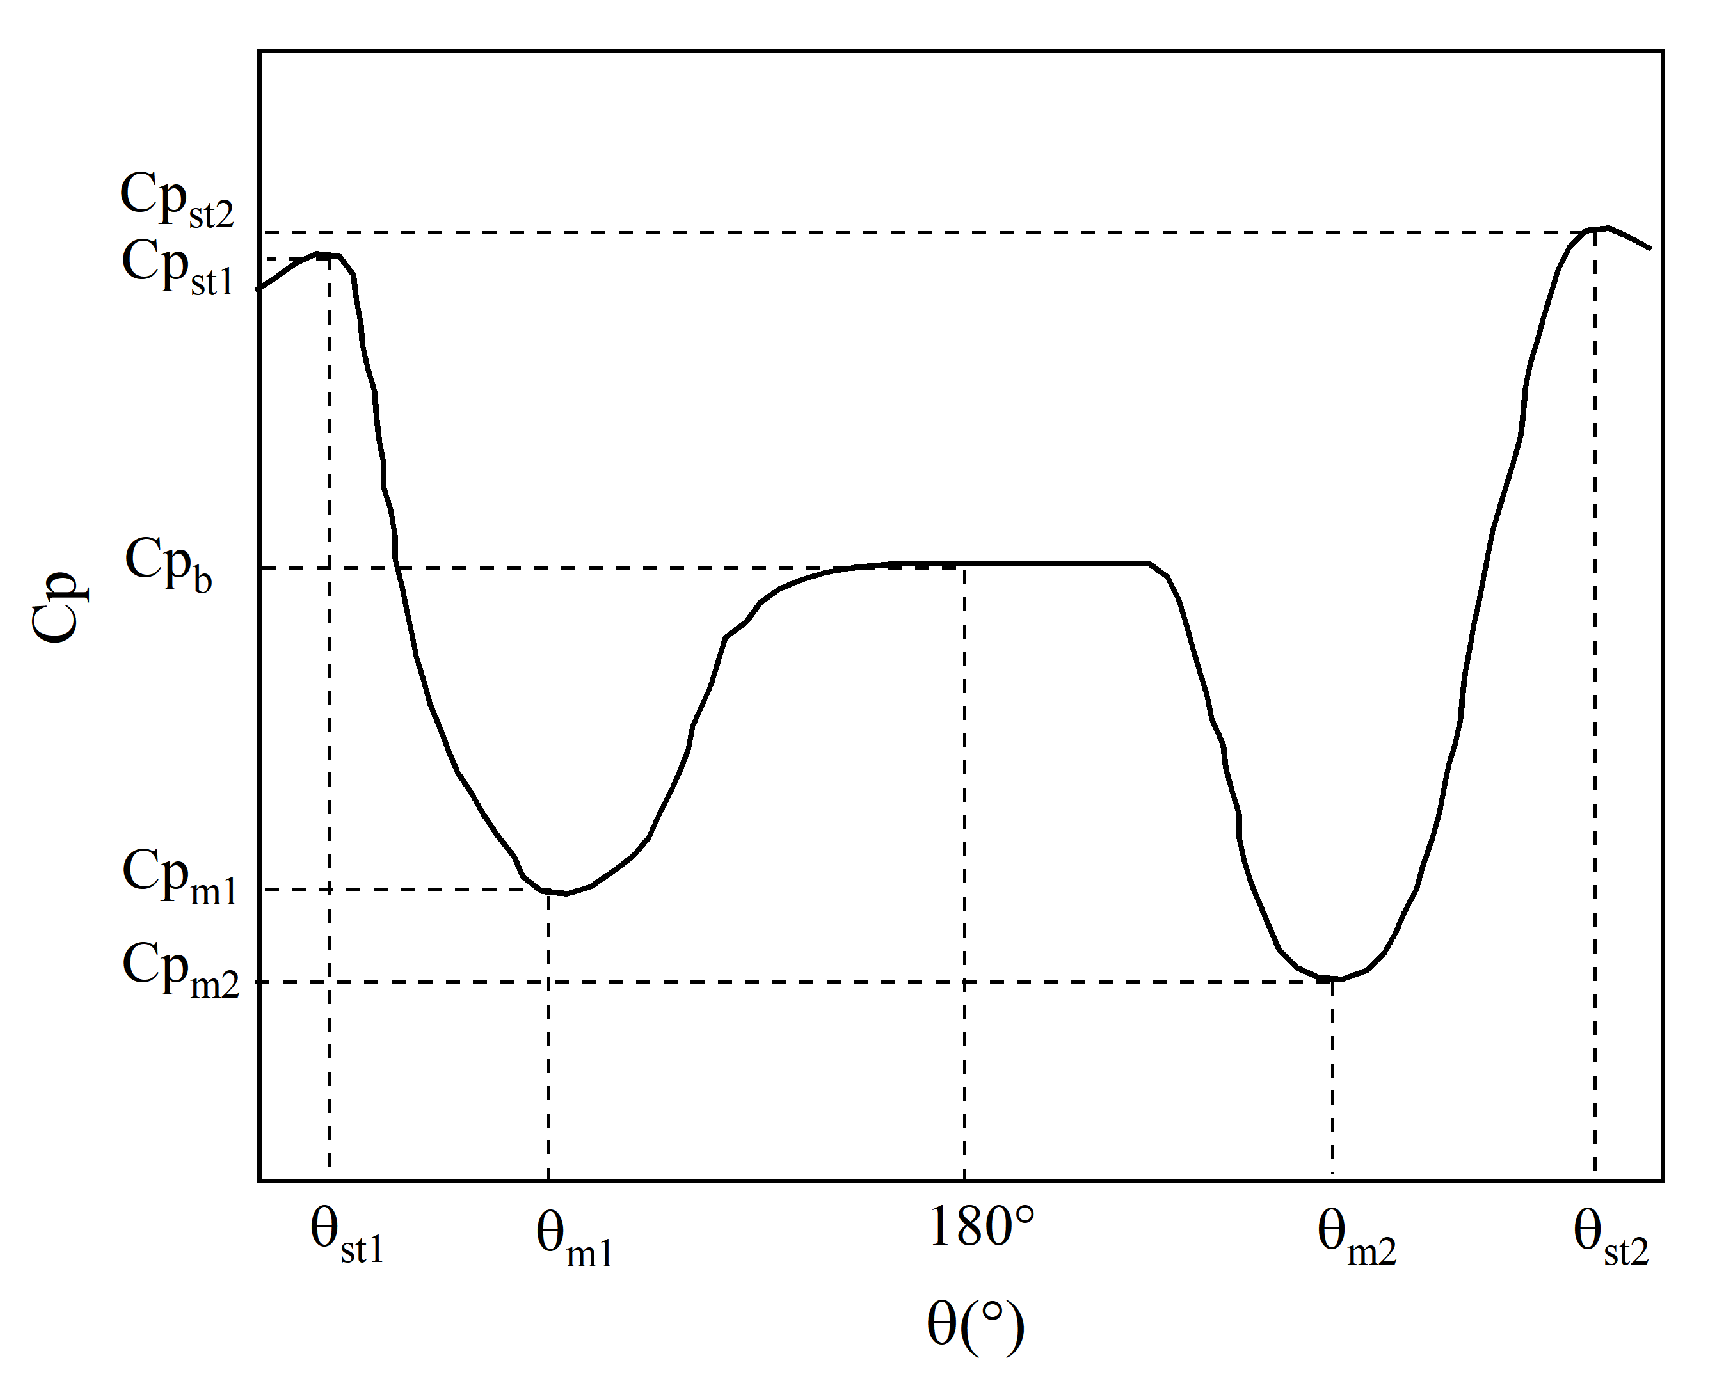
Figure 20 presents the time-averaged pressure distributions of the three cylinders in different flow regimes, where the pressure distribution is defined as , in which is the time-averaged local static pressure on the cylinder and is the reference pressure. For description convenience, some special parameters, , , , , and are defined first, as shown in Figure 21. and are the pressure coefficients at the upper and lower stagnation points, and , respectively. is the base pressure coefficient at . and are the minimum pressure coefficients at the upper and lower sides, respectively. and are the corresponding of and .
As shown in Figure 20a, in the single bluff body flow regime, the base pressure of the upstream cylinder increases compared to that of a single cylinder due to the blockage effect. Stagnation points of downstream cylinders are pretty obvious (, ). The base pressure of upstream cylinder has two minimal values in the local area, located at and . Meanwhile, two local minimum pressure coefficients occur at for cylinder B and for cylinder C. Those arrestive minimal values occur at the positions where cylinder A is closest to cylinders B and C, respectively. The pressure coefficients of downstream cylinders both have a decrease at the gap-side area, and are nearly mirror-symmetric about . For the deflected gap flow shown in Figure 20b, the pressure coefficients of downstream cylinders become asymmetrical because of the jet flow bias towards cylinder C. In addition, stagnation points of downstream cylinders are slightly smaller (, ). As increases into the anti-phase flow regime, the base pressure of the upstream cylinder turns into negative because the blockage effect becomes weak. of cylinder A is smaller than of cylinder B, while the opposite condition happens on cylinder C. This is because the flow velocity on the gap side is greater than the flow velocity on the free-flow side. When goes into the in-phase flow regime, stagnation points of downstream cylinders, and , become zero. In the co-shedding flow regime, the pressure coefficient distributions of all the cylinders are similar with that of a single cylinder.
Figure 20.
Time-averaged pressure coefficient distributions on surfaces of the cylinders at different .
Figure 20.
Time-averaged pressure coefficient distributions on surfaces of the cylinders at different .

Figure 21.
Sketch diagram of special parameters analyzing the pressure coefficient distribution.

4.4. Separation Angles
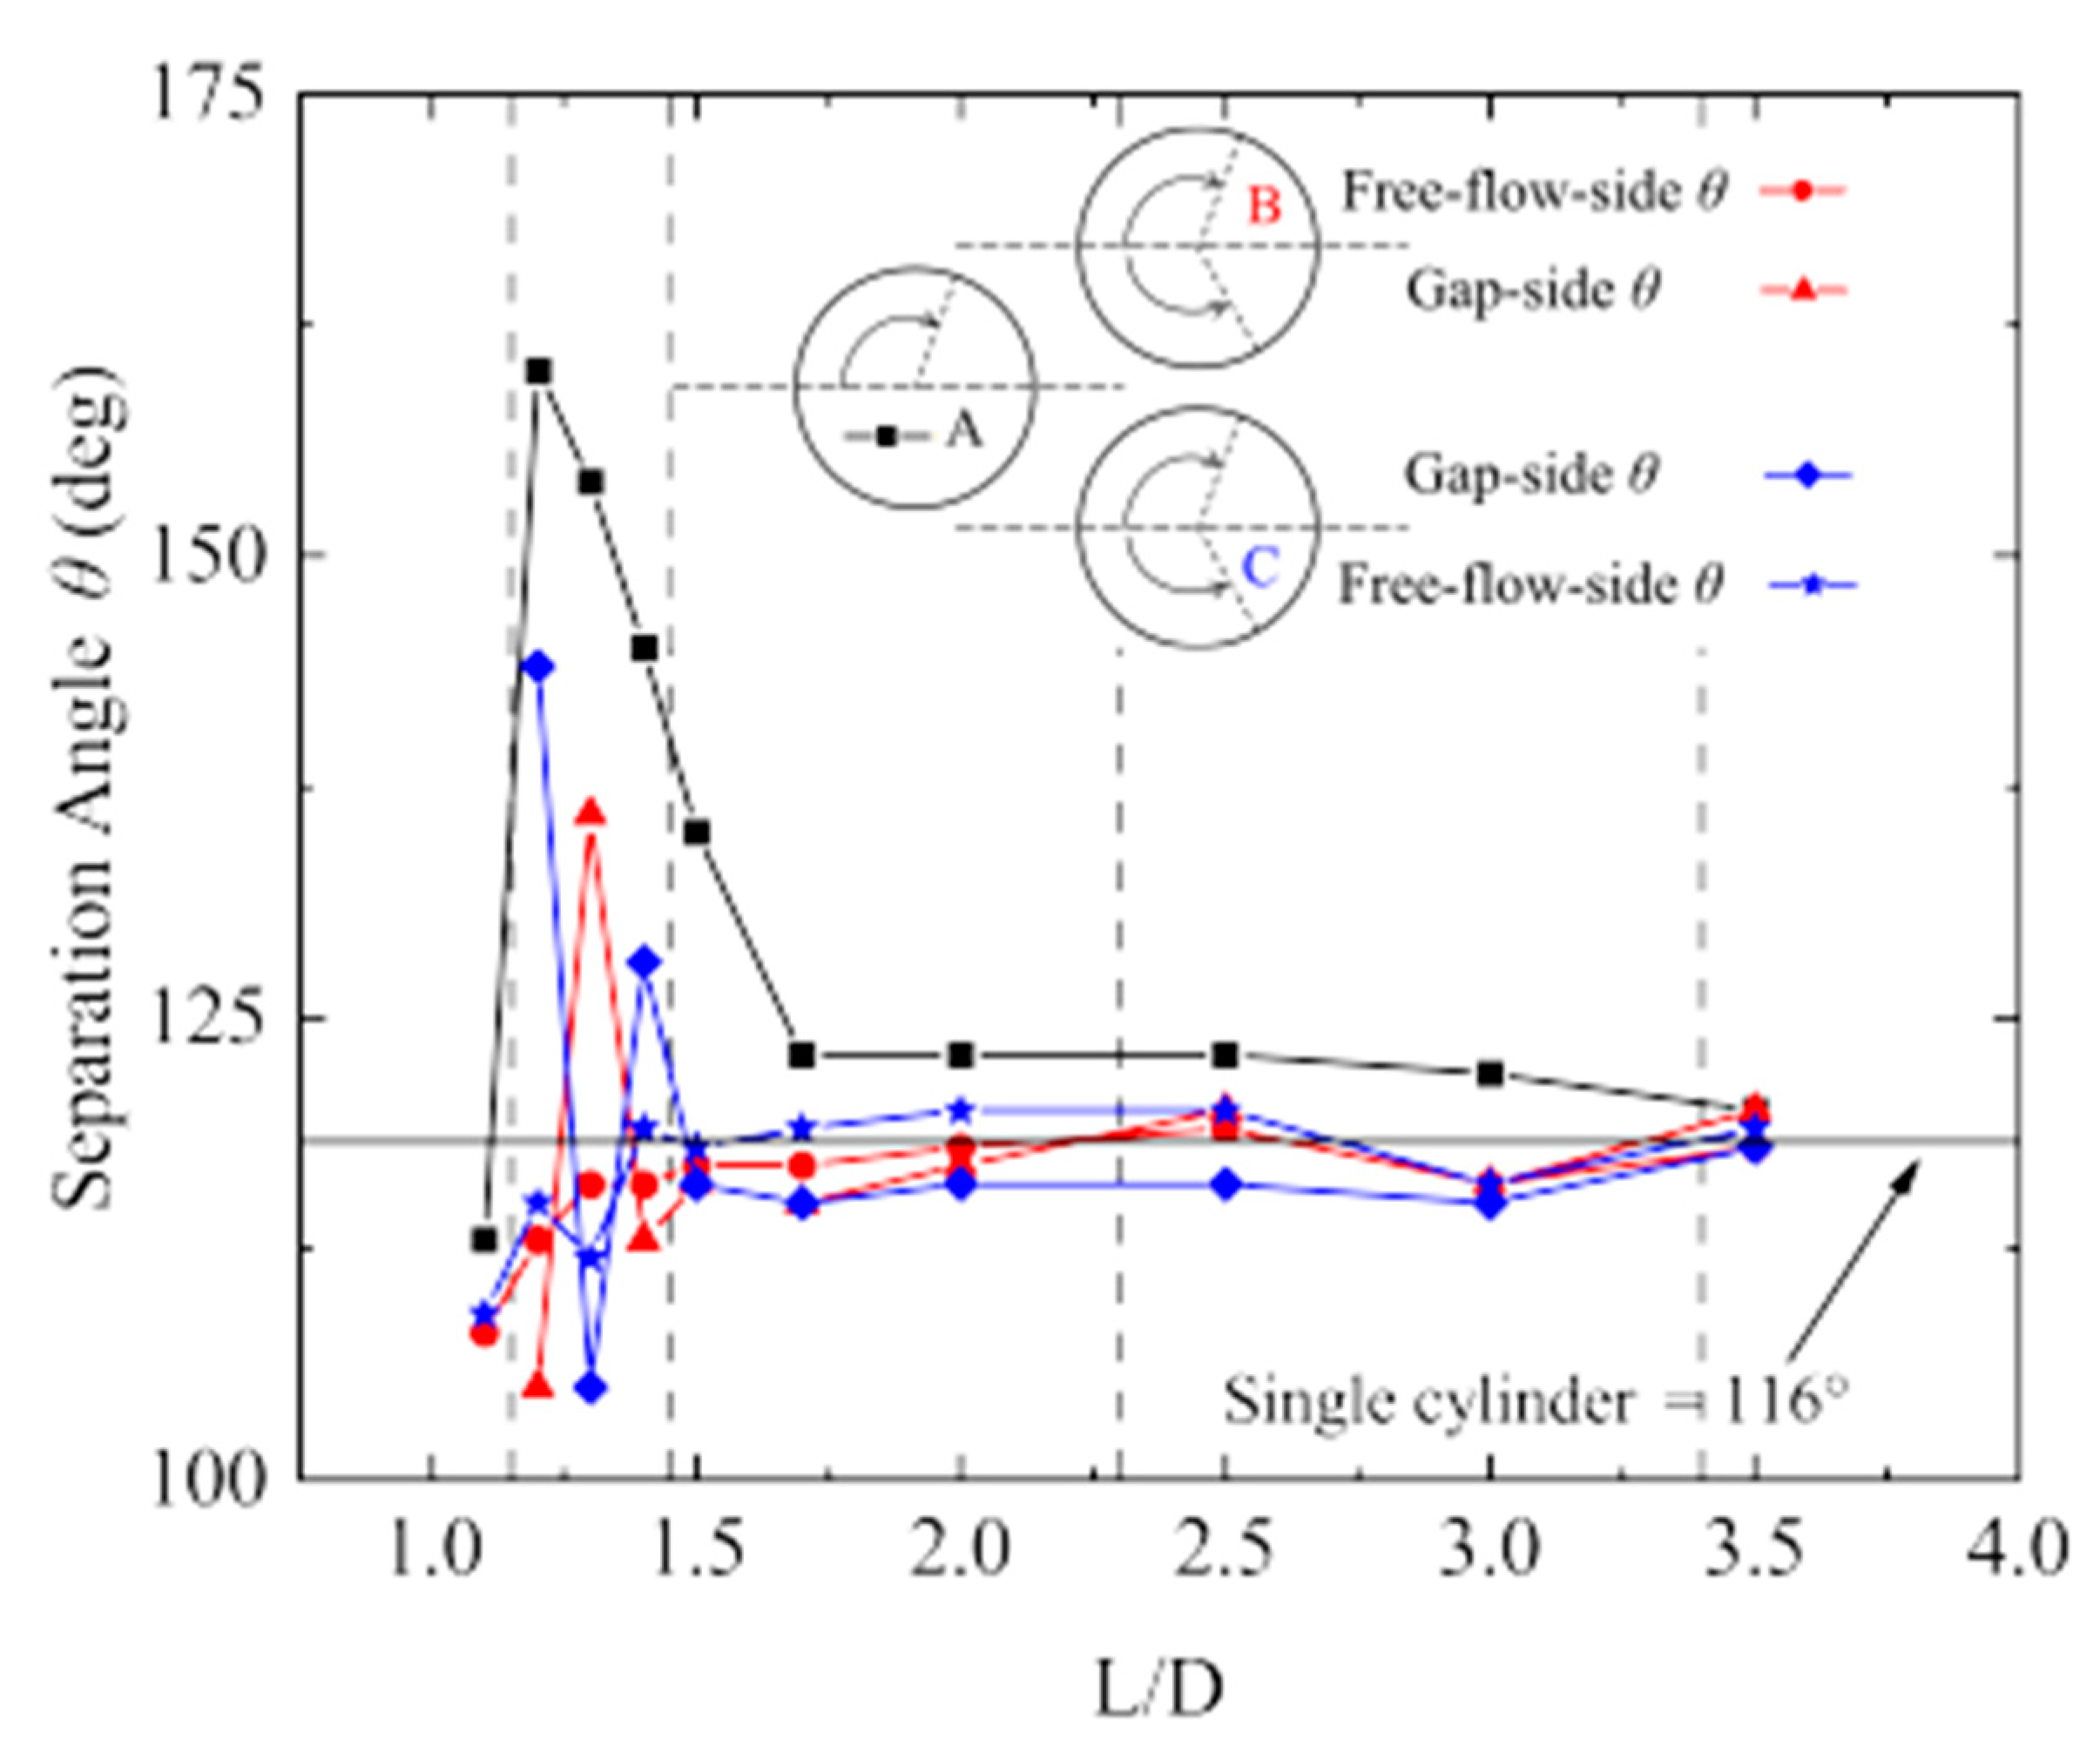
The separation angles of three cylinders are collected in Figure 22, and they are determined by . Because the flow separation points of cylinder A are symmetrical on the upper and lower sides, only one is shown here for convenience. As shown, when , the separation points on the upstream cylinder, with black square symbol, is lower than that of a single cylinder. No separation point on the gap-side of the downstream cylinders (red triangle symbol and blue diamond symbol) is identified, because there is no regular vortex shedding at the gap. At , there is an extremely sharp growth in the separation point of cylinder A, because the increase of gap space leads to the shear layers of the upstream cylinder flow through the gap. The separation point of the upstream cylinder is quite backward because the gap is still small, which limits the separation of shear layers. As goes up, the separation point of the upstream cylinder moves forward rapidly, starting to gradually adhere to the value at the single cylinder when . For the separation points on the free-stream-side of cylinders B and C, which are shown as red circle symbol and blue star symbol, respectively, they are smaller than in the case of a single cylinder when is small, indicating that the separation position is advanced. As increases, the separation position gradually leans forward, and when , the separation angle is close to that of single cylinder. For the separation points on the gap-side of downstream cylinders, they are special in the deflected gap flow regime. When and , the gap-side separation angle of cylinder C is conspicuously large in contrast to that of cylinder B. This is because at these , the gap flow is deflected towards cylinder C, resulting in the delayed separation of the shear layers of cylinder C. The situation is reversed at .
5. Conclusions
The flow past three equilateral-triangular-arranged cylinders is investigated for spacing ratios = 1.1–3.5 at a super-critical Reynolds number . Improved delayed-detached eddy simulation (IDDES) based on SST model is utilized to solve the flow field. With the aim to better understand the fluid dynamics of the configuration of three cylinders, the spanwise vorticity (), force coefficients, and its RMS, Strouhal numbers (), and pressure distribution () are discussed. The following is a summary of the conclusions:
- (i)
- Five flow regimes are identified depending on the spacing ratios, i.e, single bluff body flow (), deflected gap flow ( = 1.2–1.4), anti-phase flow ( = 1.5–2), in-phase flow ( = 2–3.5), and co-shedding flow ().
- (ii)
- When in deflected gap flow, the downstream cylinder with a wide wake experiences lower drag and higher lift (absolute value and RMS), compared to the cylinder with narrow wake. However, their vortex shedding frequencies are identical. In addition, the sum of lift forces of the three cylinders at the deflected gap flow is not zero, either a positive or negative lift may exist.
- (iii)
- When , the separation points on the free-flow-side of the downstream cylinders are always lower than that of the single cylinder, indicating that the violent flow at the gap also causes the flow separation on the outer side of the cylinder to advance. When , the separation point of the cylinder in upper stream is close to that of single cylinder, indicating that the minimum for negligible interaction among the cylinders is .
In conclusion, in this paper, we systematically study the characteristics of different flow regimes of three cylinders with equilateral-triangular arrangement. Fluid forces, flow patterns, vortex shedding frequencies, phase differences, and wake interactions are discussed in detail. Compared with previous studies, this paper focuses on the super-critical Reynolds number regime and a more detailed division is completed. The results of this paper deepen the understanding of the fluid interference of flow past cylinders.
Author Contributions
Methodology, B.Y.; Validation, Z.J.; Data curation, M.Z.; Writing—original draft, M.Z.; Writing–review & editing, B.Y.; Supervision, D.G. and G.Y. All authors have read and agreed to the published version of the manuscript.
Funding
This work was supported by the Strategic Priority Research Program of the Chinese Academy of Sciences (Class A) (Grant No. XDA22040203) and the Strategic Priority Research Program of the Chinese Academy of Sciences (Class B) (Grant No. XDB22020000).
Conflicts of Interest
The authors declare no conflict of interest.
References
- Han, P.; Pan, G.; Tian, W. Numerical simulation of flow-induced motion of three rigidly coupled cylinders in equilateral-triangle arrangement. Phys. Fluids 2018, 30, 125107. [Google Scholar]
- Liang, Y.; Tao, L.; Xiao, L.; Liu, M. Experimental and numerical study on vortex-induced motions of a deep-draft semi-submersible. Appl. Ocean Res. 2017, 67, 169–187. [Google Scholar] [CrossRef] [Green Version]
- Goldschmidt, M.; Muskulus, M. Coupled mooring systems for floating wind farms. Energy Procedia 2015, 80, 255–262. [Google Scholar] [CrossRef] [Green Version]
- Gonalves, T.R.; Chame, M.E.F.; Hannes, N.H.; de Paula Lopes, P.P.S.; Hirabayashi, S.; Suzuki, H. Experimental study on flow-induced motion of an array of three cylinders with circular, square, and diamond sections. In Proceedings of the 28th International Ocean and Polar Engineering Conference, Sapporo, Japan, 10–15 June 2018. [Google Scholar]
- Zdravkovich, M.M. The effects of interference between circular cylinders in cross flow. J. Fluids Struct. 1987, 1, 239–261. [Google Scholar] [CrossRef]
- Sumner, D.; Price, S.J.; Paidoussis, M.P. Tandem cylinders in impulsively started flow. J. Fluids Struct. 1999, 13, 955–965. [Google Scholar] [CrossRef]
- Sumner, D. Two circular cylinders in cross-flow: A review. J. Fluids Struct. 2010, 26, 849–899. [Google Scholar] [CrossRef]
- Harichandan, A.B.; Roy, A. Numerical investigation of low Reynolds number flow past two and three circular cylinders using unstructured grid CFR scheme. Int. J. Heat Fluid Flow 2010, 31, 154–171. [Google Scholar] [CrossRef]
- Igarashi, T.; Suzuki, K. Characteristics of the Flow around Three Circular Cylinders. Bull. JSME 1984, 27, 2397–2404. [Google Scholar] [CrossRef] [Green Version]
- Zhang, H.J.; Zhou, Y. Effect of unequal cylinder spacing on vortex streets behind three side-by-side cylinders. Phys. Fluids 2001, 13, 3675–3686. [Google Scholar] [CrossRef] [Green Version]
- Sayers, A.T. Flow interference between three equispaced cylinders when subjected to a cross flow. J. Wind Eng. Ind. Aerodyn. 1987, 26, 1–19. [Google Scholar] [CrossRef]
- Lam, K.; Cheung, W.C. Phenomena of vortex shedding and flow interference of three cylinders in different equilateral arrangements. J. Fluid Mech. 1988, 196, 1–26. [Google Scholar] [CrossRef]
- Tatsuno, M.; Amamoto, H.; Koji, I.I. Effects of interference among three equidistantly arranged cylinders in a uniform flow. Fluid Dyn. Res. 1998, 22, 297–315. [Google Scholar] [CrossRef]
- Gu, Z.; Sun, T. Classification of flow pattern on three circular cylinders in equilateral-triangular arrangements. J. Wind Eng. Ind. Aerodyn. 2001, 89, 553–568. [Google Scholar] [CrossRef]
- Pouryoussefi, S.G.; Mirzaei, M.; Pouryoussefi, M.H. Force coefficients and Strouhal numbers of three circular cylinders subjected to a cross-flow. Arch. Appl. Mech. 2011, 81, 1725–1741. [Google Scholar] [CrossRef]
- Bansal, M.S.; Yarusevych, S. Experimental study of flow through a cluster of three equally spaced cylinders. Exp. Therm. Fluid Sci. 2017, 80, 203–217. [Google Scholar] [CrossRef]
- Yang, Z.; Wang, X.; Si, J.H.; Li, Y. Flow around three circular cylinders in equilateral-triangular arrangement. Ocean Eng. 2020, 215, 107838. [Google Scholar] [CrossRef]
- Yan, B.; Zhou, D.; Cheng, H. Numerical simulation of flow over three circular cylinders in equilateral arrangements at low Reynolds number by a second-order characteristic-based split finite element method. Comput. Fluids 2010, 39, 882–899. [Google Scholar]
- Yan, W.; Wu, J.; Yang, S.; Wang, Y. Numerical investigation on characteristic flow regions for three staggered stationary circular cylinders. Eur. J. Mech. B/Fluids 2016, 60, 207–214. [Google Scholar] [CrossRef]
- Zheng, S.; Zhang, W.; Lv, X. Numerical simulation of cross-flow around three equal diameter cylinders in an equilateral-triangular configuration at low Reynolds numbers. Comput. Fluids 2016, 130, 94–108. [Google Scholar] [CrossRef]
- Chen, W.; Ji, C.; Alam, M.M.; Williams, J.; Xu, D. Numerical simulations of flow past three circular cylinders in equilateral-triangular arrangements. J. Fluid Mech. 2020, 891, A14. [Google Scholar] [CrossRef]
- Gao, Y.; Qu, X.; Zhao, M.; Wang, L. Three-dimensional numerical simulation on flow past three circular cylinders in an equilateral-triangular arrangement. Ocean Eng. 2019, 189, 106375. [Google Scholar] [CrossRef]
- Hu, X.; Zhang, X.; You, Y. On the flow around two circular cylinders in tandem arrangement at high Reynolds numbers. Ocean Eng. 2019, 189, 106301. [Google Scholar] [CrossRef]
- Schewe, G. On the force fluctuations acting on a circular cylinder in crossflow from subcritical up to transcritical Reynolds numbers. J. Fluid Mech. 1983, 133, 265–285. [Google Scholar] [CrossRef]
- Hinsberg, N.P.V. The Reynolds number dependency of the steady and unsteady loading on a slightly rough circular cylinder: From subcritical up to high transcritical flow state. J. Fluids Struct. 2015, 55, 526–539. [Google Scholar] [CrossRef]
- Rodriguez, I.; Lehmkuhl, O.; Chiva, J.; Borrell, R.; Oliva, A. On the flow past a circular cylinder from critical to super-critical Reynolds numbers: Wake topology and vortex shedding. Int. J. Heat Fluid Flow 2015, 55, 91–103. [Google Scholar] [CrossRef] [Green Version]
- Okajima, A. Flows around Two Tandem Circular Cylinders at Very High Reynolds Numbers. Bull. JSME Jpn. Soc. Mech. Eng. 1979, 22, 504–511. [Google Scholar] [CrossRef] [Green Version]
- Spalart, P.R. Comments on the feasibility of LES for wings, and on a hybrid RANS/LES approach. In Proceedings of the First AFOSR International Conference on DNS/LES, Ruston, LA, USA, 4–8 August 1997. [Google Scholar]
- Spalart, P.R.; Deck, S.; Shur, M.L.; Squires, K.D.; Strelets, M.K.; Travin, A. A New Version of Detached-eddy Simulation, Resistant to Ambiguous Grid Densities. Theor. Comput. Fluid Dyn. 2006, 20, 181. [Google Scholar] [CrossRef]
- Shur, M.L.; Spalart, P.R.; Strelets, M.K.; Travin, A.K. A hybrid RANS-LES approach with delayed-DES and wall-modelled LES capabilities. Int. J. Heat Fluid Flow 2008, 29, 1638–1649. [Google Scholar] [CrossRef]
- Liang, X.F.; Chen, G.; Li, X.B.; Zhou, D. Numerical simulation of pressure transients caused by high-speed train passage through a railway station. Build. Environ. 2020, 184, 107228. [Google Scholar] [CrossRef]
- Wang, B.; Liu, J.; Li, Q.B.; Yang, Y.J.; Xiao, Z.X. Numerical studies of reverse flows controlled by undulating leading edge. Sci.-China-Phys. Mech. Astron. 2019, 62, 974712. [Google Scholar] [CrossRef]
- Chen, G.; Li, X.B.; Liu, Z.; Zhou, D.; Wang, Z.; Liang, X.F.; Krajnovic, S. Dynamic analysis of the effect of nose length on train aerodynamic performance. J. Wind Eng. Ind. Aerodyn. 2019, 184, 198–208. [Google Scholar] [CrossRef]
- Tan, C.; Zhou, D.; Chen, G.; Sheridan, J.; Krajnovic, S. Influences of marshalling length on the flow structure of a maglev train. Int. J. Heat Fluid Flow 2020, 85, 108604. [Google Scholar] [CrossRef]
- Dong, T.; Minelli, G.; Wang, J.; Liang, X.; Krajnovi, S. The effect of reducing the underbody clearance on the aerodynamics of a high-speed train. J. Wind Eng. Ind. Aerodyn. 2020, 204, 104249. [Google Scholar] [CrossRef]
- Tamura, T.; Miyagi, T.; Kitagishi, T. Numerical prediction of unsteady pressures on a square cylinder with various corner shapes. J. Wind Eng. Ind. Aerodyn 1998, 74, 531–542. [Google Scholar] [CrossRef]
- Norberg, C. An experimental investigation of the flow around a circular cylinder: Influence of aspect ratio. J. Fluid Mech. 1994, 258, 287–316. [Google Scholar] [CrossRef]
- Spalart, P.R. Strategies for turbulence modelling and simulations. Int. J. Heat Fluid Flow 2000, 21, 252–263. [Google Scholar] [CrossRef]
- Lehmkuhl, O.; Rodriguez, I.; Borrell, R.; Chiva, J.; Oliva, A. Unsteady forces on a circular cylinder at critical Reynolds numbers. Phys. Fluids 2014, 26, 125110. [Google Scholar] [CrossRef] [Green Version]
- Roshko, A. Experiments on the Flow Past a Circular Cylinder at Very High Re Number. J. Fluid Mech. 1961, 10, 345–356. [Google Scholar] [CrossRef] [Green Version]
- Schmidt, L.V. Flucting force measurements upon a circular cylinder at Reynolds number up to 5 × 10⁶. In Proceedings of the Meeting on Ground Wind Load Problems in Relation to Launch Vehicles, Langley, WA, USA, 7–8 June 1966. [Google Scholar]
- Jones, G.W.; Cincotta, J.J.; Walker, R.W. Aerodynamic Forces on a Stationary and Oscillating Circular Cylinder at High Reynolds Numbers; Technical report; NASA: Washington, DC, USA, 1969. [Google Scholar]
- Shih, W.; Wang, C.; Coles, D.; Roshko, A. Experiments on flow past rough circular cylinders at large Reynolds numbers. J. Wind Eng. Ind. Aerodyn. 1993, 49, 351–368. [Google Scholar] [CrossRef]
- Travin, A.; Shur, M.; Strelets, M.; Spalart, P. Detached-Eddy Simulations Past a Circular Cylinder. Flow Turbul. Combust. 2000, 63, 293–313. [Google Scholar] [CrossRef]
- Catalano, P.; Wang, M.; Iaccarino, G.; Moin, P. Numerical simulation of the flow around a circular cylinder at high Reynolds numbers. Int. J. Heat Fluid Flow 2003, 24, 463–469. [Google Scholar] [CrossRef]
- Ong, M.; Utnes, T.; Holmedal, L.E.; Myrhaug, D.; B, P. Numerical simulation of flow around a smooth circular cylinder at very high Reynolds numbers. Mar. Struct. 2009, 22, 142–153. [Google Scholar] [CrossRef]
- Warschauer, K.A.; Leene, J.A. Experiments on mean and fluctuating pressures of circular cylinders at cross flow at very high Reynolds numbers. In Proceedings of the International Conference on Wind Effects on Buildings and Structures, Tokyo, Japan, 6–11 September 1971. [Google Scholar]
- Zdravkovich, M.M.; Bearman, P.W. Flow Around Circular Cylinders -Volume 1: Fundamentals. ASME J. Fluids Eng. 1998, 120, 216. [Google Scholar] [CrossRef] [Green Version]
- Achenbach, E. Distribution of local pressure and skin friction around a circular cylinder in cross-flow up to Re=5×10⁶. J. Fluid Mech. 1968, 34, 625–639. [Google Scholar] [CrossRef]
- Janocha, M.J.; Ong, M.C. Vortex-induced vibrations of piggyback pipelines near the horizontal plane wall in the upper transition regime. Mar. Struct. 2021, 75, 102872. [Google Scholar] [CrossRef]
- Yang, X.; Ji, C.; Chen, W.; Zhang, Z. Wake patterns and hydrodynamic forces of flow around circular cylinders in an equilateral triangular arrangement. Chin. J. Hydrodynom. 2019, 34, 69–76. (In Chinese) [Google Scholar]
- Kim, H.J. Investigation of the flow between a pair of circular cylinders in the flopping regime. J. Fluid Mech. 1988, 196, 431–448. [Google Scholar] [CrossRef]
- Alam, M.M.; Moriya, M.; Sakamoto, H. Aerodynamic characteristics of two side-by-side circular cylinders and application of wavelet analysis on the switching phenomenon. J. Fluids Struct. 2003, 18, 325–346. [Google Scholar] [CrossRef]
- Hunt, J.; Wray, A.; Moin, P. Eddies, streams, and convergence zones in turbulent flows. In Proceedings of the 1988 Summer Program, Stanford, CA, USA, 27 June–22 July 1988; pp. 193–208. [Google Scholar]
Figure 4.
Comparison of pressure distribution on a single cylinder between the present study and published data [44,45,47,48].

Figure 5.
Comparison of skin friction coefficient () distribution on a single cylinder surface with the published experimental and numerical data [44,46,49].

Figure 13.
Iso-surface of Q = colored by dimensionless streamwise velocity at different flow pattern regimes.
Figure 13.
Iso-surface of Q = colored by dimensionless streamwise velocity at different flow pattern regimes.

Figure 14.
Instantaneous pressure distributions in the middle section (z = 2 m) at different flow pattern regimes.
Figure 14.
Instantaneous pressure distributions in the middle section (z = 2 m) at different flow pattern regimes.

Figure 15.
Variations of mean force coefficients and fluctuating force coefficients with different : (a) time mean drag force coefficients; (b) fluctuating drag force coefficients; (c) time mean of lift force coefficients, green line means the sum of two downstream cylinders; (d) fluctuating lift force coefficients.

Figure 16.
Time histories of of cylinders in different flow pattern regimes.

Figure 17.
Time histories of of cylinders in different flow pattern regimes.

Figure 19.
Strouhal numbers of three cylinders at different .

Figure 22.
Variation of separation angles of cylinders with .


Table 1.
Grid density sensitivity study results of a single cylinder at .
| Case | Cell Count (Million) | |||||
|---|---|---|---|---|---|---|
| Coarse Mesh | ||||||
| Medium Mesh | ||||||
| Fine Mesh |
Table 2.
Comparison of present and previous studies for flow past a single cylinder.
| Researchers | Description | |||||
|---|---|---|---|---|---|---|
| Present study | k– IDDES | |||||
| Roshko [40] | Experiments | 0.30 | − | − | 0.37 | |
| Experiments | 0.42 | − | − | 0.62 | ||
| Experiments | 0.69 | − | − | 0.85 | ||
| Schmidt [41] | (2.6–3.3) × 10 | Experiments | 0.25–0.44 | − | − | 0.51–0.61 |
| Jones et al. [42] | Experiments | 0.21 | − | − | 0.53 | |
| Experiments | 0.53 | − | − | 0.59 | ||
| Experiments | 0.56 | − | − | 0.61 | ||
| Schewe [24] | Experiments | 0.45 | − | − | − | |
| Shih et al. [43] | (3–3.1) × 10 | Experiments | 0.35–0.38 | − | − | 0.45–0.46 |
| Travin et al. [44] | DES | |||||
| Catalanoet al. [45] | LES | − | ||||
| Ong et al. [46] | k– URANS | − |
Publisher’s Note: MDPI stays neutral with regard to jurisdictional claims in published maps and institutional affiliations. |
© 2022 by the authors. Licensee MDPI, Basel, Switzerland. This article is an open access article distributed under the terms and conditions of the Creative Commons Attribution (CC BY) license (https://creativecommons.org/licenses/by/4.0/).
Share and Cite
MDPI and ACS Style
Zhang, M.; Yin, B.; Guo, D.; Ji, Z.; Yang, G. Numerical Study on the Flow Past Three Cylinders in Equilateral-Triangular Arrangement at Re = 3 × 10⁶. Appl. Sci. 2022, 12, 11835. https://0-doi-org.brum.beds.ac.uk/10.3390/app122211835
AMA Style
Zhang M, Yin B, Guo D, Ji Z, Yang G. Numerical Study on the Flow Past Three Cylinders in Equilateral-Triangular Arrangement at Re = 3 × 10⁶. Applied Sciences. 2022; 12(22):11835. https://0-doi-org.brum.beds.ac.uk/10.3390/app122211835
Chicago/Turabian StyleZhang, Mohan, Bo Yin, Dilong Guo, Zhanling Ji, and Guowei Yang. 2022. "Numerical Study on the Flow Past Three Cylinders in Equilateral-Triangular Arrangement at Re = 3 × 106" Applied Sciences 12, no. 22: 11835. https://0-doi-org.brum.beds.ac.uk/10.3390/app122211835
Note that from the first issue of 2016, this journal uses article numbers instead of page numbers. See further details here.