Article

Cortical Activation in Response to Speech Differs between Prelingually Deafened Cochlear Implant Users with Good or Poor Speech-in-Noise Understanding: An fNIRS Study

1
Department of Communication Disorders, Steyer School of Health Professions, Sackler Faculty of Medicine, Tel Aviv University, Tel Aviv 39040, Israel
2
Faculty of Engineering, Holon Institute of Technology, Holon 305, Israel
*
Author to whom correspondence should be addressed.
Submission received: 24 October 2022 / Revised: 17 November 2022 / Accepted: 24 November 2022 / Published: 25 November 2022
(This article belongs to the Special Issue Hearing Loss: From Pathophysiology to Therapies and Habilitation)

Abstract

:
Cochlear implant (CI) users with prelingual deafness (hearing impairment started before language development was completed) show variable speech-in-noise (SIN) understanding. The present study aimed to assess cortical activation patterns to speech-in-quiet (SIQ) and SIN in prelingual CI users and compared to individuals with normal hearing (NH), using functional Near-Infrared Spectroscopy (fNIRS). Participants included 15 NH who listened to natural speech, 15 NH who listened via 8-channel noise-excited vocoder, and 14 prelingual CI users. fNIRS data were collected in a block design that included three conditions: SIQ, SIN in a signal-to-noise ratio of 0 dB, and noise. Speech reception thresholds in noise (SRTn) were also assessed. Results revealed different patterns of activation between the NH and CI participants in channels covering mainly the right and left middle temporal gyrus (MTG), depending on the SRTn of the CI users. Specifically, while the NH group showed large response to SIQ and SIN in the MTG areas, prelingual CI users with poor SRTn showed significantly smaller response to SIQ, and inversed response (a reduction in activation) to SIN in the same brain areas. These novel findings support the notion that the MTG can serve as a neural marker for speech understanding in CI patients.

1. Introduction

Most listening situations include surrounding masking sounds and background noise. Nevertheless, most of the time, listeners with normal hearing (NH) are able to understand speech in such adverse listening conditions. However, hearing impaired individuals who use cochlear implants (CIs) exhibit remarkable deterioration in speech recognition in noisy conditions, with high performance variability [1,2,3,4,5,6,7]. This may lead to significant communication problems for CI users in many real-life listening situations [8] and may have a negative effect on linguistic and neurocognitive development [3,9]. Multiple behavioral studies have been conducted to assess the factors that contribute to the variability in speech-in-noise (SIN) perception observed in CI users. These included NH listeners who listened via acoustic simulations of CI hearing (vocoders) and/or actual CI users (e.g., [7,10]). In general, the suggested contributing factors include spectral and temporal resolution of the implant itself, age of hearing loss onset, use of residual hearing, mode of communication, period of auditory deprivation, auditory nerve survival, and reorganization of the central auditory system [11,12,13,14,15,16,17]. Neuroimaging can supplement behavioral findings in assessing the neural mechanisms underlying speech understanding of the degraded auditory signal transmitted via a CI device [18,19,20]. In the current study, we applied an emerging optical imaging technique, functional near-infrared spectroscopy (fNIRS), to compare neural activation patterns to speech in quiet and noisy conditions between three groups: prelingually deafened CI users, that is, individuals who became hearing impaired before their perceptual or spoken language development was completed, NH individuals who listened to spectrally degraded (vocoded) speech, and NH individuals who listened to natural speech stimuli.
Commonly used neuroimaging techniques have certain disadvantages in the assessment of the cortical activation to auditory signals in CI individuals. For example, functional magnetic resonance imaging (fMRI) may have limitations in auditory research due to the impact of extraneous scanner noise [20,21]. Additionally, artifacts associated with the CI magnet may interfere with the imaging of the temporal areas of the brain. Magnetic artifacts are also problematic in magnetoencephalography (MEG). Electroencephalography (EEG) data may also be limited by implant-related electrical artifacts, although several studies have presented new analysis techniques to overcome this problem [22,23]. Positron emission tomography (PET) has been successfully used in some studies to visualize the brains of CI users [24,25,26]. However, this technique requires the injection of radioactive isotopes. An optical neuroimaging technique such as fNIRS does not have these limitations. fNIRS uses near-infrared light to noninvasively image hemodynamic responses to neuronal activity [27,28,29]. Specifically, changes in optical absorption are recorded across the scalp over time and converted to relative changes in the concentrations of oxygenated and deoxygenated hemoglobin, which are then mapped to the specific volumes of the activated underlying cerebral cortex regions. Because the equipment is mobile, quiet, and tolerates some movement, it is well suited for testing speech processing while participants are awake and performing various tasks [30,31,32,33]. Importantly, owing to its optical nature, fNIRS is compatible with the magnetic and electronic components of CI devices, making it an ideal imaging modality for assessing brain activity in CI individuals [31,34,35,36,37,38].
Several recent studies have assessed cross-modal reorganization in CI users before and after implantation, using fNIRS measures of cortical activation (e.g., extracting beta weights of the generalized-linear-model (GLM) fit to the canonical hemodynamic response function (HRF) to quantify the amplitude of cortical activation [35,39]), and functional connectivity (e.g., assessing the temporal correlations between time courses of hemodynamic changes of two brain regions [40,41]). Table S1 (Supplementary Materials) details studies that assessed neural activation to auditory speech via CI hearing, including NH participants who listened to vocoded speech and CI participants. For NH participants (Table S1a), a general trend of increased activation in the temporal regions with improved intelligibility has been reported in several studies [42,43,44]. However, other studies did not find significant differences in temporal activation between natural and vocoded stimuli [45] or reported a difference between the right and left temporal areas, with larger activation in the left temporal regions for vocoded stimuli and in the right temporal regions for natural stimuli [30]. A significant effect of speech intelligibility on frontal region activation was also reported in a small number of studies, with larger activation for degraded stimuli compared to natural stimuli (e.g., [45,46]), and activation peaking at intermediate levels of intelligibility [43,47].
For CI participants (Table S1b), on the other hand, variable findings were reported, ranging from larger [32], to similar [38,48,49], and to smaller brain activation levels [50] to auditory speech in temporal brain areas compared to NH controls. Furthermore, unlike the results for NH participants, one study that examined the activation to auditory speech in the frontal regions for CI users reported a similar pattern of activation for CI and NH controls [49]. The inconsistency in CI reports may stem from the fact that CI users are a heterogeneous group with variable speech perception abilities. This explanation is supported by two recent studies that showed cortical activation in temporal regions to correlate with the level of speech comprehension of CI users [31,32]. The lack of coherence across studies may also be related to the fact that most CI studies have tested post-lingually deafened adults, that is, individuals with acquired hearing loss who had normal acoustic hearing during their cognitive and language development years [31,32,48,49,50]. Post-lingual CI users learned to process speech based on acoustic information, and thus, the pattern of cortical activation to the degraded speech transmitted by the CI device may resemble that of NH individuals who listen to degraded speech via acoustic simulations. Conversely, prelingually deafened CI users experienced impaired acoustic hearing, or electric hearing during their perceptual and spoken language development and their cognitive development (depending on age at implantation), and therefore might be expected to exhibit a different pattern of cortical activation to speech.
To our knowledge, only one study has assessed the cortical activation to auditory speech in prelingual CI users using fNIRS [38]. In that study, the activation to visual and auditory speech in temporal brain regions was compared between prelingual CI children and NH children who listened to natural speech (Table S1b). The results showed greater cortical responses to visual speech in CI children, with no significant difference in the pattern of activity to auditory speech between the CI and NH groups. No control group of NH participants who listened to vocoded speech was included in the study. To the best of our knowledge, the only fNIRS study that included a comparison group of NH participants who listened to vocoded (and non-vocoded) speech assessed cortical activation in post-lingual CI users [31] (Table S1c). This study found a similar pattern of temporal activation for the NH participants and post-lingual CI participants with good speech perception, both showing strong cortical responses to natural and vocoded speech (no significant differences between these two stimuli), and smaller activation to scrambled speech and environmental sounds. On the other hand, CI participants with poor speech perception had similarly large areas of cortical activation for all four stimulus types.
Prelingual CI users, whose language systems were deprived during language development may activate different processes when listening to degraded speech, compared with post-lingual CI users or NH listeners who have well-functioning language systems [37]. Hence, conclusions regarding cortical activation to speech in prelingual CI adults, compared to NH adults who listen to vocoded and non-vocoded stimuli, are difficult to draw based on previous studies. Furthermore, none of these studies have tested cortical activation in response to speech in background noise. Given that CI users typically struggle with understanding speech amid background noise, a complex task that involves an interplay of sensory and cognitive processes [51], one cannot assume that a similar pattern of activation will be demonstrated in quiet and noisy conditions. In our current study, we aimed to investigate the pattern of brain activation involved in speech perception in quiet and background noise conditions in three groups of participants: prelingual CI adults, NH adults who listened to spectrally degraded (vocoded) stimuli, and NH adults who listened to natural stimuli. To examine the possible relationships between behavioral SIN perception and cortical activity to speech, speech reception thresholds in noise (SRTn) were also measured in all participants.

2. Materials and Methods

2.1. Participants

A total of 44 participants (aged 18 to 44 years) were recruited for this experiment: 30 NH participants (mean age = 26.85 ± 5.80 years) and 14 CI users (mean age = 26.73 ± 6.56 years). The NH participants were randomly divided into two groups: participants who listened to natural stimuli, i.e., “NH” (n = 15, mean age = 27.13 ± 6.45 years), and participants who listened to acoustic simulation using a vocoder, i.e., “NHV” (n = 15, mean age = 26.57 ± 5.27). All participants were native Hebrew speakers with at least 12 years of education. Participants met the following criteria: (1) no history of language or learning disorders and (2) minimal (<1 year) or no musical training. The background information was based on self-reports. All NH participants had hearing sensitivity within the normal range in both ears (pure-tone air conduction thresholds ≤15 dB HL at octave frequencies of 500–4000 Hz) [52]. CI participants were prelingually deafened. Seven participants were early implanted (≤3 years old), and seven were late-implanted (≥4;06 years old). Eight participants were bilateral CI users who underwent sequential implantation. All participants used spoken language as their primary mode of communication. The background information of the CI users is shown in Table 1.

2.2. Sentence-in-Noise Test

Sentence recognition thresholds under noisy conditions (SRTn) were assessed for all participants using a sentence-in-noise test that was recently developed in our lab. This test was specifically chosen to allow the use of either natural or vocoded stimuli. The test consisted of 69 5-word normalized sentences with the same grammatical structure—name-verb-number-noun-adjective—recorded by a female native Hebrew speaker. The order of presentation for the sentences was pseudo-randomized, with a given sentence presented only once within a threshold assessment. The noise was a steady-state speech-shaped noise with a long-term spectrum that matches the long-term spectrum of the sentences. Sentences were presented at a fixed sound pressure level (SPL) of 65 dB, and the signal-to-noise ratio (SNR) ranged from +15 dB to −10 dB. Initially, a sentence was presented with an SNR of 15 dB. Listeners were asked to orally repeat everything they heard as accurately as possible and were encouraged to guess when uncertain. There was no time limit for responses. Based on the listener’s answer, the tester indicated correctly recognized words on the computer. Correct recognition of 3, 4, or 5 words within a sentence was designated as a correct response and accurate word recognition of only 0, 1, or 2 words within a sentence was marked as incorrect. A two-down, one-up tracking procedure was used to estimate the SNR corresponding to the 70.7% sentence recognition on the psychometric function [53]. Specifically, the SNR step (initially 25 dB) was reduced by a factor of two following two correct responses or one incorrect response until the second reversal (i.e., the step size was reduced to 12.5 dB and then to 6.25 dB). For the next (3rd) reversal, the SNR step was reduced by a factor of 1.41 ( 2 ) to 4.43 dB, and for the subsequent reversals (4th–6th), the SNR step was reduced by a factor of 1.19 ( 2 4 ) to 3.72 dB. SRTn was calculated as the arithmetic mean of the last four reversals.

2.3. CI simulation

For the NHV group only, all stimuli (sentences and noise) for the sentence-in-noise test and the fNIRS data collection were vocoded using the same eight-channel noise-excited vocoder previously used in our laboratory [54,55]. The analysis and reconstruction of the filterbanks were performed using a logarithmic frequency scale with center frequencies ranging between 250 and 4000 Hz: 250 Hz, 372 Hz, 552 Hz, 820 Hz, 1219 Hz, 1811 Hz, 2692 Hz, 4000 Hz. An overlap-add method for finite impulse response filtering was used via a fast Fourier transform and 256-point filters. The bandwidth of the filter applied a 6-dB crossover point that occurred with logarithmic spacing midway between the center frequencies. To ensure that the filterbank included eight filters across four octaves, 6-dB crossover points occurred at 2 ± 1/4 times the center frequency of the Hanning window filter, resulting in a corresponding bandwidth of 1/2 octave. The Hilbert transform method was used to extract channel envelopes from the filterbank output. The corresponding channel envelopes were multiplied by Gaussian noise and processed using the reconstruction filterbank. The results were normalized to an identical root-mean-square (rms) value.

2.4. fNIRS Paradigm

fNIRS data were collected in a pseudorandom block design (Figure 1) that lasted between 13.85 to 16.43 min, starting with a 20-s baseline (rest), and followed by 21 blocks of stimuli alternating between three conditions: (1) speech-only stimulation (SO condition), (2) speech-shaped noise (NO condition), and (3) speech stimulation with speech-shaped noise in SNR = 0 dB (SIN condition). This SNR was assumed to pose significant difficulty in speech understanding for the CI patients [7]. A plus sign appeared in the middle of the computer screen two seconds before each block to focus participants’ attention. Seven 7.5-s blocks were presented in each condition, interleaved with rest periods of random duration in the range of 20–35-s. We used 42 normalized sentences for the speech blocks: 21 sentences for the SO blocks and 21 sentences for the SIN blocks. Each sentence included five words in the grammatical structure of name-verb-number-noun-adjective, recorded by a female native Hebrew speaker. Each speech block comprised three concatenated sentences. The participants were instructed to be attentive to speech, when heard, and to try to understand what was being said. Although there was no active task for the most part, to encourage sustained attention to the experimental stimuli, 16 s following the 1st and the 20th blocks (which were always SO blocks) the participants were asked to press yes/no buttons to indicate whether they heard a certain word in the preceding speech block. Following the participant’s response, an additional 10-s rest was added to the start of the ensuing rest period.

2.5. fNIRS Data Collection

The fNIRS system used in the current study (NIRSport2 Core System Unit, NIRX Medical Technologies, LLC, Medizintechnik, Berlin, Germany) was a continuous-wave NIRS instrument with 16 LED illumination sources and 16 photodiode detectors. Each source had two LED illuminators that emitted near-infrared light with wavelengths of 760 nm and 850 nm. One of four NIRScaps, according to the participant’s head scope, was positioned on the head to hold the sources and detectors and was secured by a chinstrap to create source-detector pairs (denoted as channels). The NIRScap sizes were 54, 56, 58, and 60 cm. Forty-one channels were used for the experimental montage, as shown in Figure 2. Thirty-three of them were separated by approximately 3.5 cm, and eight channels were used as short-distance separation channels (SSC), separated by approximately 1.2 cm. The latter were used to reduce the contamination of NIRS signals by extracerebral blood flow and improve sensitivity to cortical regions [56]. A 6-axis accelerometer, positioned on the cap was also included in order to identify and later remove, motion artifacts. By registering the positions of the sources and detectors on the NIRScap to the 10–10 system [57,58], using the fNIRS Optodes’ Location Decider (fOLD) toolbox, the specificity of each channel to different neural structures was calculated. See Table 2 for a summary of specificity ratings > 30% for each anatomical area, as it relates to each source-detector position. The specificity values reported in Table 2 were obtained from the fOLD toolbox [59] using the Brodmann atlas. Note that each source-detector pair may report multiple specificity values for different anatomical structures. Because variations in the thickness of the skull and adjacent tissues can affect the inter-subject sensitivity of fNIRS [60], probe fabrication error analysis was conducted using the AtlasViewer application [61]. This analysis examined how closely the actual optode locations from individual subjects matched the original probe design (Figure 3). Analysis of variance (ANOVA) showed smaller fabrication errors for the prefrontal optodes compared to the right and left temporal and frontal optodes across all groups (NH, NHV, CI) (p < 0.001), with no significant difference between the groups and no significant group × brain area interaction (p > 0.05). Before commencing data collection, signal optimization was conducted to check the optode-skin contact using the Aurora 2020.7 fNIRS software. During signal optimization, NIRSport2 increased the source brightness in a stepwise manner until an optimal signal amplitude for each channel was obtained. In cases of poor signal quality, the hair under the relevant grommet was carefully pushed aside, and the signal quality was rechecked. The procedure was repeated several times until as many channels as possible showed a good signal quality. The signals were sampled at 5.4 Hz using the Aurora fNIRS software and imported to MATLAB for further processing using the Homer3 software [62].

2.6. Study Design

All the participants took part in a single test session. At the beginning of the session, the NH participants performed a short hearing test (at octave frequencies of 500–4000 Hz in both ears) to ensure normal-hearing thresholds. The CI participants provided an updated audiogram (from the previous year) and completed a questionnaire with anamnestic and demographic details. The testing began with the collection of fNIRS data for all participants. After data collection, two SRTn assessments were conducted. The first SRTn was considered as familiarization and the second SRTn was used for further analyses. Overall, the test session lasted approximately 60–75 min, including two short breaks of 5–8 min.

2.7. Apparatus

Stimuli for the fNIRS data collection were delivered to all participants via a laptop personal computer using two tabletop loudspeakers located 45° to the right and left sides of the participant. The stimuli were presented at approximately 65 dB SPL, as determined by a portable sound-level meter held by the participant’s head. Stimuli for the SRTn testing were delivered for the CI group in the same manner as the fNIRS data collection. For the NH groups, stimuli were delivered through a GSI-61 audiometer to both ears via THD-50 headphones at approximately 35–40 dB SL above individual PTA (pure-tone average: mean thresholds at 500, 1000, and 2000 Hz). All the tests were conducted in a double-wall soundproof room. Bilateral CI users were tested while wearing both the CIs. Unilateral CI users were tested only with their CI (without a hearing aid on the contralateral side). One CI participant (CI5) had her left ear plugged with earplugs during the entire testing process since she had residual hearing in this ear (PTA = 48.33 dB).

2.8. fNIRS Data Analysis

Signal Processing

Signal processing was performed using Homer3 software [62], and it consisted of four main steps: (1) filtering out channels with excessive noise according to their scalp-coupling index (SCI); (2) removal of motion artifacts and unwanted physiological signals, (3) conversion of data into oxygenated hemoglobin (HbO) and deoxygenated hemoglobin (HbR) concentration changes, and (4) making inferences on brain activity from the hemodynamic response.
Step 1—The quality of the data was determined based on the SCI, which is a measure of how well the source and detector optodes for a given channel are coupled to the skin [30,63]. To determine the SCI, a bandpass filter (0.7–1.5 Hz) was used to detect the frequency range corresponding to blood volume pulsations related to the heartbeat for each of the two NIR wavelengths. Then, the correlation between the two filtered NIR wavelengths in each channel was calculated based on the assumption that good optode-skin contact will lead to good correlation of the heartbeat signals that would be present in both NIR wavelengths [64]. Channels with absolute correlation values less than 0.6 [32] were excluded from further analysis. Table 3 details the number of participants excluded for each channel, divided by group. Note that more channels were excluded from the CI group than from the two NH groups because some optodes were above the processor coil (see, for example, the location of the striped circle in Figure 3).
Step 2—After channel exclusion, preprocessing of the raw data included: (a) conversion of the data from each channel (light intensity) to optical density [62], (b) removal of high-frequency physiological noises, including the cardiac response and respiration in the hemodynamic response using a low-pass filter of 0.5 Hz, (c) exclusion of motion artifacts in each channel by performing a cubic spline correction of the artifacts using the algorithm described by Scholkmann et al. [65], followed by wavelet analysis [47]. The latter analysis performs wavelet transformation of the optical density data and computes the distribution of wavelet coefficients using an algorithm that follows the procedure described by Molavi and Dumont [66]. This method has been shown to effectively diminish motion artifacts during experiments with speech tasks [67].
Step 3—The processed optical density data were converted to the concentration changes of HbO and HbR, i.e., the hemodynamic response, using the Modified Beer-Lambert Law [68].
Step 4—To compare the quality of fit between the predicted and actual hemodynamic response curves, an ordinary least squares GLM was applied to the processed fNIRS signal [69]. The GLM matrix included a modified gamma function applied to both HbO and HbR: [γ(t,τ,σ) = (t − τ)22) * exp [1 − (t − τ)22]], convolved with a square-wave of duration (T). Base values for τ and σ were obtained from SPM (e.g., [70]). Simultaneous drift regression using 3rd order polynomial drift correction and regression of: (a) the most correlated short-distance separation channels (SSC) and (b) auxiliary measurements from the accelerometer was conducted to further remove systemic physiological noise and motion artifacts. The beta weights of the canonical HRF term were extracted for each stimulation condition, measurement channel, and participant.

2.9. Statistical Analysis

Channel-based contrasts were performed using the Homer3 software [62], for both HbO and HbR data. Contrast analyses were conducted separately for each group (NH, NHV, and CI) using paired t-tests between the HRF of each two conditions (SO-NO, SO-SIN, and SIN-NO). Results were corrected for multiple comparisons using the false discovery rate (FDR) method. The regions of interest (ROIs) were determined using two approaches: an a priori anatomical-driven approach and a data-driven approach. For the anatomical-driven ROIs we clustered fNIRS channels that covered, with at least 30% specificity values, the dorsolateral prefrontal cortex (DLPFC), pars triangularis Broca’s, superior temporal gyrus (STG), and middle temporal gyrus (MTG), separately for the right and left sides (Table 2). For the data-driven ROIs we clustered fNIRS channels that yielded the largest activation in response to the speech stimuli, across all participants (n = 44), separately for the right and left sides. Specifically, the data-driven ROIs included fNIRS channels with HbO averaged beta values to speech larger than the mean beta value across channels + 0.5 standard deviation (SD). Two-way repeated-measures analyses of variance (RM-ANOVAs) and Univariate analyses were conducted to compare mean beta values across groups, conditions, and sides. Post hoc analyses were conducted using Bonferroni corrections for multiple comparisons.

3. Results

3.1. Behavioral Data

The individual SRTn results for all the participants are shown in Table 4. Note that three CI participants reached a floor effect and were unable to reach 70.7% correct identification of the sentence stimuli at SNR = +15 dB. One-way ANOVA revealed significantly worse SRTn for the NHV (n = 15) and CI (n = 12) groups than for the NH (n = 15) group (p < 0.001), with no significant difference between the NHV and CI groups (p = 0.682).

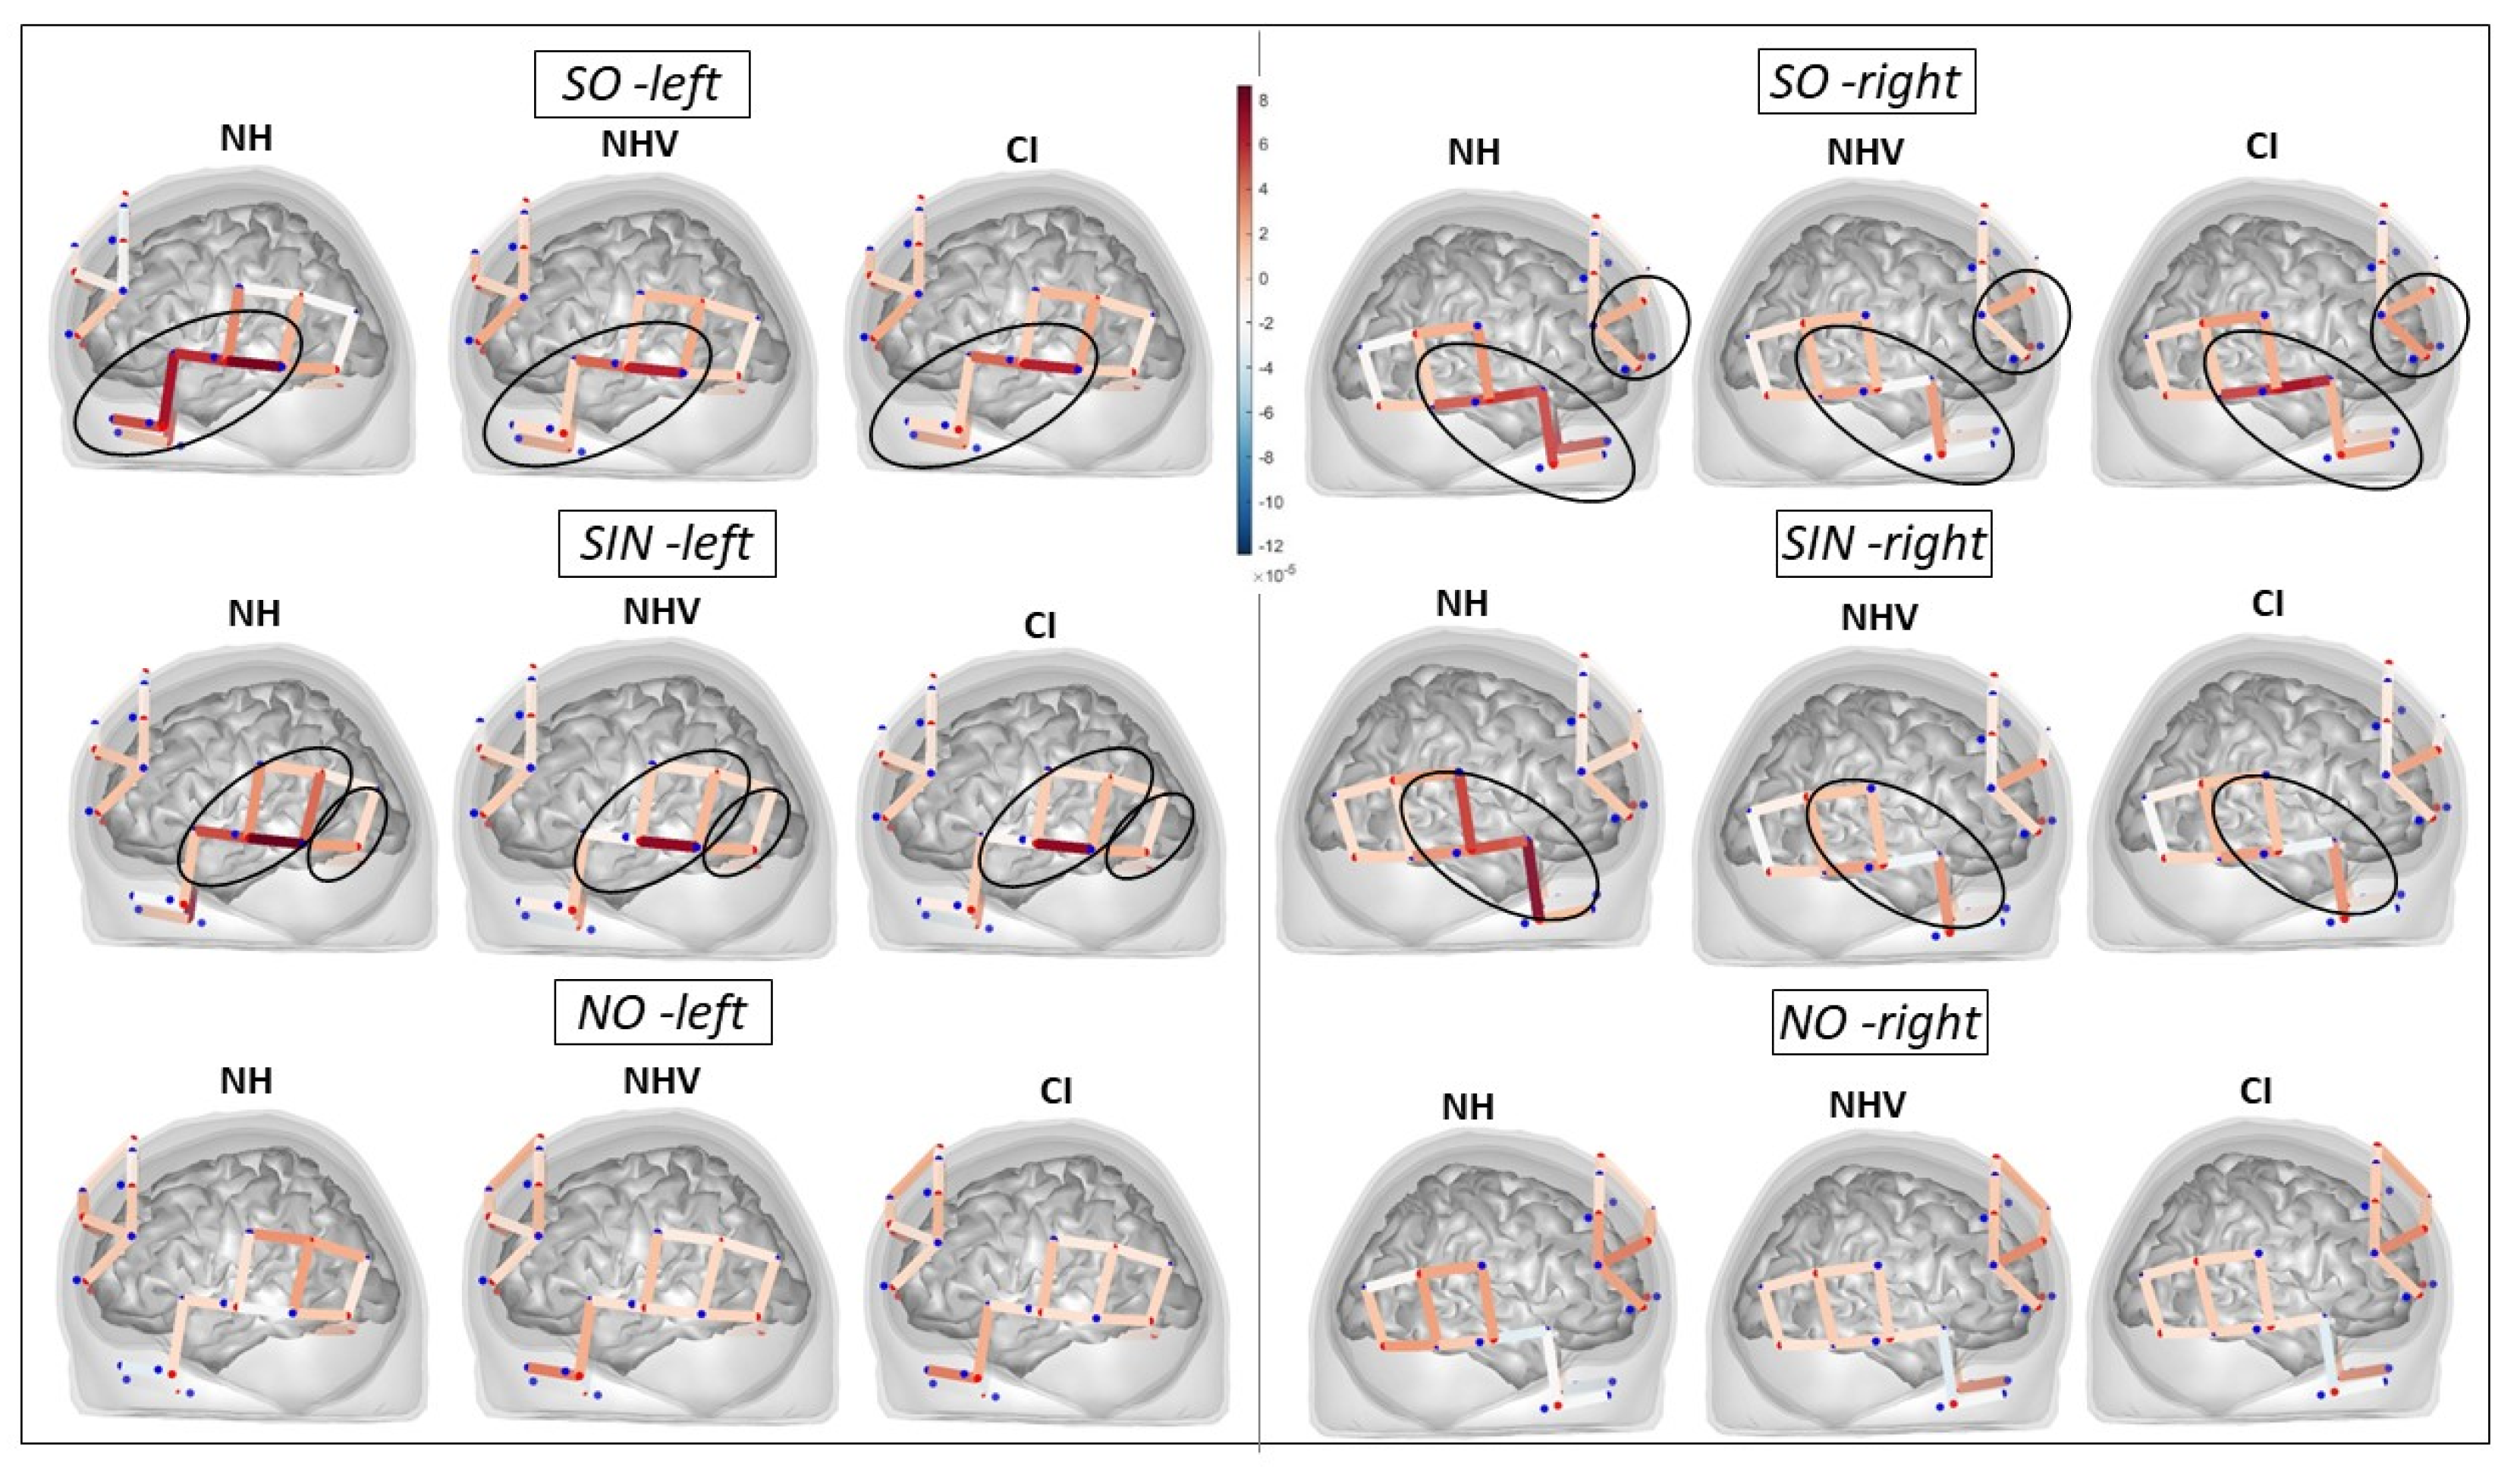
3.2. fNIRS: HbO Data

Figure 4 displays group-mean beta values of the HbO data for each channel and condition, separately for each group. Channel-wise contrast analyses revealed no significant differences between conditions for all groups (p > 0.05, FDR-corrected). Similarly, RM-ANOVAs for the anatomical-driven ROIs yielded no significant differences between conditions or groups and no significant interactions (p > 0.05).
The data-driven ROI’s selection, based on the channels with the highest beta-values, yielded three ROIs for the SO condition: Two ROIs covering primarily the right and left MTG (each ROI including four fNIRS channels), and one ROI (including two fNIRS channels) covering part of the right DLPFC. For the SIN condition, three slightly different ROIs were formulated: Two ROIs covering similar (but not identical) areas in the right and left MTG as the SO ROIs (each including three channels), and one ROI (including two channels) covering the left fusiform gyrus. All the data-driven ROIs are circled in Figure 4. In addition to these ROIs, high beta-values were revealed in the SIN condition for a single channel covering part of the right DLPFC. This channel was separately analyzed as is detailed bellow.
The mean beta values in the four data-driven ROIs covering the MTG are shown in Figure 5a,b for each group. In the left ROI with the SO condition and in the right and left ROIs with the SIN condition, the largest mean beta values were demonstrated for the NH, smaller values were demonstrated for the NHV, and the smallest values were demonstrated for the CI. In the right ROI with the SO condition, similar beta values were observed for the NH and NHV, with smaller values for the CI group. Two-way RM-ANOVA was conducted for these four MTG ROIs with Condition (SO, SIN) and Side (right, left) as the within-subject variables and Group (NH, NHV, CI) as the between-subject variable. Results revealed a significant effect of Group [F)1, 41) = 4.339 p = 0.020, η2 = 0.175], with larger beta values only for the NH group compared to the CI group (p = 0.017). No significant differences were observed between the NHV group and the other two groups (p > 0.05). There were also no significant effects of Condition or Side, and no significant interactions.
Univariate analyses comparing the three groups were separately conducted for the right DLPFC ROI with SO and for the left fusiform gyrus ROI with SIN. No significant effect of group was revealed (p > 0.05). A similar analysis conducted for the right DLPFC channel that showed high beta-values with the SIN condition also revealed no significant effect of group (p > 0.05).
As large within-subject variability was observed in the SRTn performance for the CI group (Table 4), we further examined activation levels in this group by dividing it based on SRTn, compared to the mean SRTn of the NHV group (mean SRTn = −2.14 dB). This division yielded two subgroups: “Good CI”—participants with SRTn < −2.14 dB (n = 6), and “Poor CI”—participants with SRTn > −2.14 dB (n = 8). Note that all the poor CI had SRTn > 0 dB, which was the SNR in the SIN condition. Next, we reanalyzed the MTG ROI-data of the four groups using two-way RM-ANOVA with Condition (SO, SIN) and Side (right, left) as the within-subject variables and Group (NH, NHV, good CI, poor CI) as the between-subject variable. The results showed a significant effect of Subgroup [F)1, 40) = 3.003, p = 0.042, η2 = 0.184], with a larger response (i.e., higher beta values) for the NH group compared to the poor CI group (p = 0.046). Figure 5c,d demonstrate that whereas smaller but positive beta values were shown for the poor CI compared to the NH with the SO condition, the opposite behavior was shown with the SIN condition. Specifically, large positive beta values were shown for the NH, as opposed to negative values for the poor CI. No significant differences were observed between the two CI subgroups (p > 0.05), possibly because of the small number of participants included in each subgroup. There were no significant effects of Condition or Side, and no significant interactions (p > 0.05).

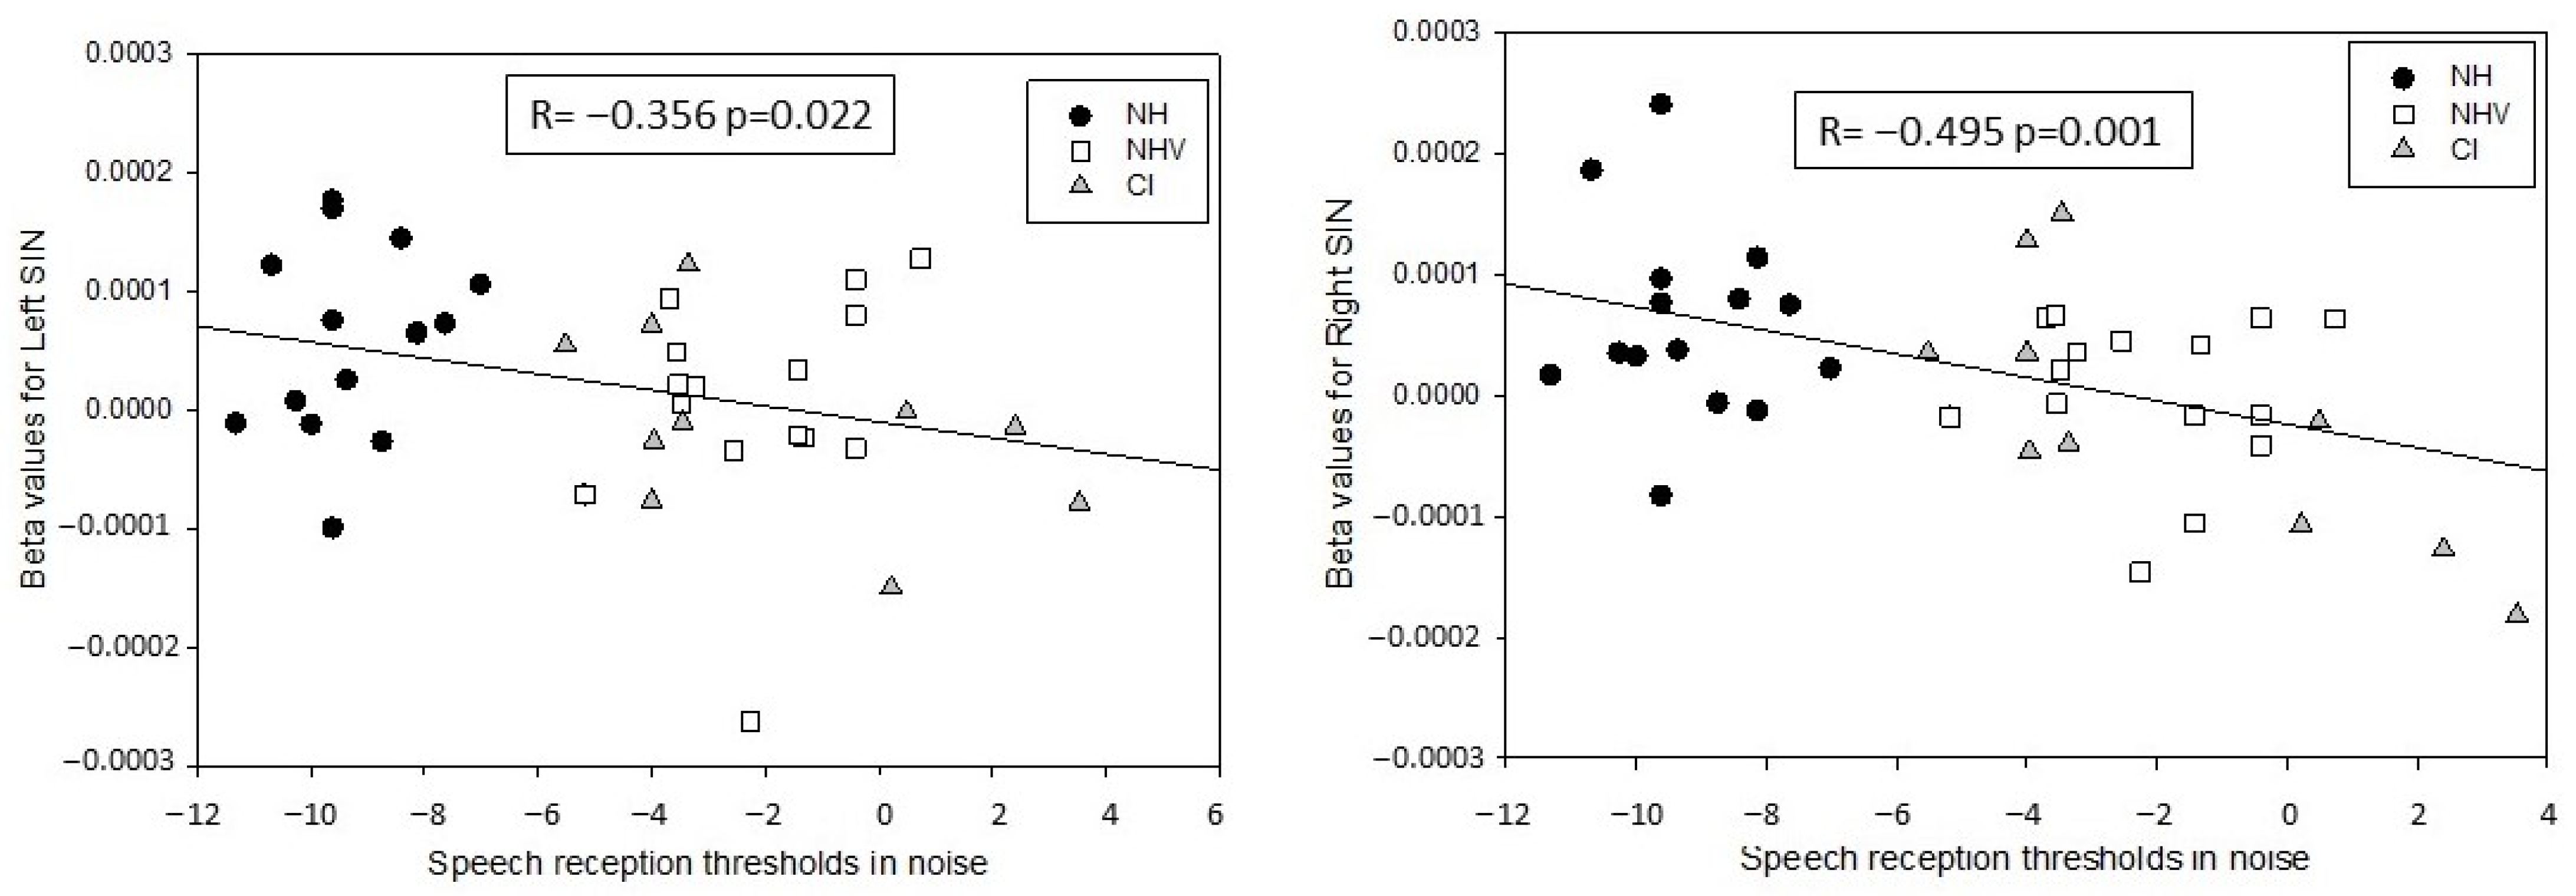
3.3. Explaining Factors for the Results

Pearson correlations were conducted between the SRTn and the MTG ROI-mean beta values across participants (n = 41 because three CI users reached a floor effect in their SRTn assessment). Significant correlations were revealed with the right and left MTG ROI-mean beta values in the SIN condition (Figure 6), suggesting higher mean beta values for participants with better SRTn. Additional correlations that were conducted specifically for the CI group revealed no significant associations (p > 0.05) between ROI-mean beta values and SRTn (n = 11), age at identification of hearing loss (n = 14), age at implantation (n = 14), or experience with the CI (n = 14). RM-ANOVA was conducted to examine the effect of the implanted ear (defined as the first-implanted ear for the bilateral CI users) on the mean-ROI HbO beta values with Condition (SO, SIN) and Side (right, left) as the within-subject variables and implanted ear (right, left) as the between-subject variable. The results showed no significant differences between the right-implanted (n = 6) and left-implanted (n = 8) CI users (p > 0.05). Further individual examination of the CI group revealed that among the seven late-implanted CI users (≥ 4;06 years old), five (CI3, CI8, CI12, CI13, and CI14) were classified as “poor” based on their SRTn.

3.4. fNIRS: HbR Data

Channel-wise contrast analyses conducted for the HbR data revealed no significant differences between the conditions for either group (p > 0.05, FDR-corrected). Two-way RM-ANOVA for the MTG ROIs (the same as for HbO) revealed no significant effect of Group (NH, NHV, CI), Conditions (SO, SIN), or Side (right, left), and no significant interactions (p > 0.05). Univariate analyses for the additional ROIs showed no significant effect of Group (p > 0.05).

4. Discussion

The findings of the present study demonstrate different patterns of cortical activation in temporal regions covering mostly the MTG in response to speech in NH listeners who listen to natural stimuli and prelingually deafened CI users, depending on the SRTn of the latter. Specifically, while NH listeners showed large cortical activation, (i.e., high positive HbO beta values in the temporal areas), to speech in quiet and in noise, prelingual CI users with poor SRTn showed significantly smaller cortical activation to speech, with positive beta values for speech in quiet, and negative beta values, representing reduced HbO supply, for speech amid noise. On the other hand, CI users with good SRTn showed somewhat smaller, but not significantly different, beta values when compared with the NH group. Interestingly, the NH participants who listened to vocoded stimuli showed an activation pattern that was not significantly different from that of the NH participants who listened to natural stimuli or the CI groups. Nevertheless, beta values in response to SIN in the right and left MTG were correlated with SRTn across all participants, suggesting that larger brain activation in these temporal areas relates to better speech understanding in noise, irrespective of the auditory background.
Our novel main finding illustrates the relationship between the pattern of cortical activation and SIN understanding for CI users, with CI participants who have poor SIN understanding showing smaller response to SIQ and inversed response to SIN in temporal regions, compared with NH controls. These findings may support the notion that visual repurposing of the auditory regions have occurred for some of the CI users during the period of auditory deprivation, that is, before implantation (for a review see: [71]). As a result, their processing of auditory stimuli in these cortical regions may have been reduced (e.g., [39]). To date, the only study that assessed cortical activation to speech using fNIRS in a group of prelingually deafened CI users (children) reported no significant difference in activation to auditory speech in temporal regions between CI and NH participants [38]. This discrepancy may be explained by the fact that in Mushtaq et al.’s study, only three of the 19 CI participants had poor speech perception ability; thus, no statistical analysis separating the good and poor CI patients could have been conducted. On the other hand, in our current study, most CI participants (8/14) had poor SIN perception. Another reason for the differences between the two studies may be related to the different fNIRS paradigm that was used to assess cortical activation to speech in Mushtaq et al.’s study, and/or the different approach used for ROIs identification.
Individual examination of the poor CI performers in the current study shows that more than half (5/8) of these participants were implanted late, i.e., they were rehabilitated after the “critical” or “sensitive” early life period wherein neuronal properties are particularly susceptible to shaping by experience [72,73]. Electrophysiology studies in children with CI show significant differences in evoked middle latency response (eMLR) (e.g., [74]) and in cortical auditory-evoked potentials (CAEP) (e.g., [75]) between children implanted before 3.5–5 years of age and children implanted later, supporting the notion that the most sensitive period for auditory deprivation is up to approximately 4 years of age [76]. Furthermore, animal studies suggest that when implantation occurs at a later age, or after the sensitive period of synaptic pruning in the auditory pathway, it may restore some of the tonotopic organization of the primary auditory cortex without functionally improving synaptic efficiency (e.g., [77]). Thus, late-implanted individuals may have impaired spectral processing of the auditory signal [54], which may result in poor speech perception, particularly in noisy conditions. Indeed, in our current study, five of the seven late-implanted CI users had poor SIN perception. They also had significantly smaller activation in response to SIQ compared to NH participants, and inversed response to SIN in fNIRS channels reflecting mainly the middle temporal gyrus (MTG). Given that this temporal region is thought to be recruited to perform auditory analyses and early speech decoding processes [47,78], the finding of a smaller response to SIQ provides new evidence that suggests that speech understanding in late-implanted individuals with prelingual deafness is subserved by less efficient speech processing mechanisms.
The inversed HbO response shown in the right and left MTG areas to SIN for the poor CI participants may have several explanations. One explanation, derived from fMRI studies, may postulate that the negative response indicated a blood “stealing” effect, that is, redirection of blood from a passive cortical region to a region with high neuronal activity [79]. However, a careful inspection of the poor CI data, does not reveal elevated beta-values in close-by channels. A different explanation may suggest that the negative response represented a suppression of cortical activation in the MTG regions for the poor CI participants. Such deactivation was previously suggested in fMRI studies to represent functional inhibition that occurs in cortical areas that are unnecessary for task performance, to maintain efficient processing [80]. Recent findings that combined fNIRS and EEG data argue, however, that negative fNIRS HbO responses to auditory signals may not be driven by a decrease in neural activity in the auditory cortex [81]. This disagreement may be resolved in future studies that will specifically examine the phenomenon of inversed HbO response to auditory signals.
It should be noted that age-at-implantation cannot solely account for the differences shown in the MTG pattern of activity between the good and poor CI performers, as two late-implanted CI users were included in the good CI group and three poor CI performers were implanted early. Other contributing factors, excluding auditory history, should therefore be considered, including factors like the linguistic background of the CI participants. Neural activity in the MTG has been suggested to underlie the recognition of sounds as words and the comprehension of the syntactic properties of words by combining phonetic and semantic cues [82,83,84]. Hence, deficits in phonemic and/or syntactic knowledge may yield reduced MTG activation to speech for poor CI performers, limiting their ability to segregate the speech stream into syllables and words, and thus, causing poor SIN understanding. This reasoning aligns with studies that show poor linguistic skills in some prelingual CI users when compared to NH subjects [3,9,85,86,87,88]. Unfortunately, we did not test linguistic abilities in this study. Future fNIRS studies with CI patients may include comprehensive linguistic assessments to test this hypothesis.
The present findings, reported for the first time for prelingual CI users, are in accordance with previous fNIRS reports on a significant relationship between patterns of activation to auditory and visual speech and speech understanding in CI groups that included post-lingually deafened, or a mix of prelingually and post-lingually deafened participants [31,32,35,39,40]. They are also consistent with the PET data that showed that the degree of cortical response to speech correlated with speech perception in post-lingual CI users [25,89]. Post-lingually deafened individuals have robust language systems to interpret degraded auditory signals via the CI device. On the other hand, prelingually deafened patients construe the reduced auditory input from the CI using language systems that were deprived during development. However, the similarities between current and previous studies suggest a common neural basis for speech processing in temporal regions across CI populations. Moreover, the significant correlation that we found between SRTn and cortical activity in the right and left temporal ROIs across all our participants, both CI and NH, may further suggest neural markers in the right and left MTG for speech understanding, regardless of the auditory background.
Notably, high mean beta-values were also shown across participants in channel(s) covering part of the right DLPFC in response to the SIQ and SIN, and in channels covering the left fusiform gyrus in response to SIN, with no significant differences in activation between the groups. The elevated activation in the right DLPFC aligns with reports on the sensitivity of this area to the acoustic envelope of the speech stimuli [90], specifically to the sound’s onsets [91]. This sensitivity was suggested to reflect an increase in cognitive control processes that plausibly prepare the listener to be attentive to the following stimulation [90,91]. Regarding the left fusiform gyrus, although it was previously described mainly as a visual area involved in face perception, reading, and object recognition [92,93], several reports suggest that it also plays a critical role in the integration of multiple stimuli [94], and in semantic decoding [95]. Both these skills are relevant for SIN understanding.
Channel-wise contrast analyses were conducted separately for each group; these did not yield significant differences between conditions (SO, SIN, NO), contrary to the previous fNIRS reports in NH participants [42,45]. This inconsistency may be related to the fact that most previous studies employed less efficient techniques to separate spurious scalp signals from cortical signals (e.g., SSC regression, as used in the present study). Methods to correct for systemic hemodynamic responses using SSC have been shown to improve signal quality and provide a more precise estimate of the evoked HRF [96,97,98]. Alternatively, the fabrication errors, assumed to be created by inter-subject variations in the thickness of the skull and nearby tissues, which were larger in the temporal areas (Figure 3), might have masked channel-based differences across conditions.
Analyses of the HbO data based on the pre-determined anatomical ROIs yielded no significant differences between conditions or groups. This lack of differences may be attributed to the fact that each fNIRS channel may reflect a combined response from more than just one anatomical area (as reflected by the specificity values, Table 2) and therefore there may be overlapping between ROIs, introducing variability to the data.
No significant differences across conditions or groups were also shown for the ROI-base analyses of the HbR data. This may result from a higher noise level in the HbR data than in the HbO data when regressing SSCs. Using a single SSC regression (as was done in this study, using the most correlated channel) was shown to improve HbO noise reduction by 33%, while only improving HbR noise reduction by 3% [99]. This may also explain why many previous studies have chosen to analyze only HbO data and/or have used HbR data merely for cross-correlations with HbO during signal preprocessing [32,38,44,45,48]. Assuming that a smaller but detectable change may, nevertheless, be expected in HbR values in response to auditory stimuli (e.g., [100]), it is worthwhile considering to enlarge statistical power by including larger groups of participants in future studies.

Limitations and Suggestions for Future Studies

Although the behavioral findings (i.e., in SRTn) in the NHV group were significantly different from the NH group, no significant differences were shown in temporal activity to SIN, plausibly because of the relatively easy SNR (0 dB) that was used for the SIN condition. Future studies may want to replicate the current study using several SNR levels, including those that are expected to yield less than 70.7% correct recognition of speech, to further explore the effect of noise on speech processing mechanisms for NH people. Similarly, future investigations may wish to use additional types of background noise to expand the implications of the current study. For example, multi-talker babble noise produces informational and not only energetic masking, and thus may burden speech understanding in both NH and CI participants. Finally, to better understand the similarities and differences in cortical activation in response to speech between prelingual and post-lingual CI users, future studies may want to design a testing protocol that will directly compare these two groups using fNIRS and behavioral measures.

5. Conclusions

Our current study is the first to examine cortical activity in response to auditory speech in quiet and in noise in prelingually deaf CI adults; results were compared to NH adults, who listened to natural and vocoded speech, using fNIRS measurements. Our findings demonstrated a clear relationship between SIN understanding and the degree of cortical response to speech in the right and left temporal cortices of the MTG. At the group level, a significantly smaller cortical response to speech in quiet and noisy conditions was shown, compared to NH controls, in CI individuals with poor SIN understanding. At a more general level, a significant correlation was shown between SRTn and cortical response to SIN across all participants (CI, NHV, and NH). These findings support the notion that neuroimaging data from the right and left MTG can serve as neural markers for behavioral speech understanding. They may also suggest that prelingually and postlingually deafened CI users activate similar neural regions during processing of auditory speech. This conclusion must be reassessed in future studies including prelingual and post-lingual deafened CI users.

Supplementary Materials

The following are available online at https://0-www-mdpi-com.brum.beds.ac.uk/article/10.3390/app122312063/s1, Table S1: fNIRS studies from the last decade that examined cortical activation related to auditory speech in (a) NH participants listening via acoustic simulations of CI hearing (i.e., vocoded stimuli), (b) CI users, and (c) both NH participants listening via CI simulation, and CI users. GLM = general linear model, PCA = principal component analysis, SSC = short-distance separation channel, LML = linear mixed model, RM-ANOVA = repeated-measures analysis of variance, SPM= statistical parametric mapping, ROI = region of interest, includes a cluster of channels. HbC = ΔHbO − ΔHbR.

Author Contributions

Conceptualization, Y.Z.; Formal analysis, M.L. and Y.Z.; Investigation, M.L.; Methodology, Y.Z.; Project administration, Y.Z.; Resources, Y.Z.; Software, M.L.; Supervision, M.B. and Y.Z.; Visualization, M.L. and Y.Z.; Writing—original draft, M.L. and Y.Z.; Writing—review & editing, M.B. and Y.Z. All authors have read and agreed to the published version of the manuscript.

Funding

This research received no external funding.

Institutional Review Board Statement

The study was conducted according to the guidelines of the Declaration of Helsinki, and approved by the Institutional Review Board of Tel Aviv University (approval code 0003676-1 on 8 January 2021).

Informed Consent Statement

Informed consent was obtained from all subjects involved in the study.

Data Availability Statement

The data presented in this study are available on request from the corresponding author.

Acknowledgments

We thank lan Roziner for helping with the statistical analyses. We also wish to thank all the participants for participating in the study.

Conflicts of Interest

The authors declare no conflict of interest.

References

  1. Hochmair-Desoyer, I.; Schulz, E.; Moser, L.; Schmidt, M. The HSM sentence test as a tool for evaluating the speech understanding in noise of cochlear implant users. Am. J. Otolaryngol. 1997, 18, 83. [Google Scholar]
  2. Caldwell, A.; Nittrouer, S. Speech perception in noise by children with cochlear implants. J. Speech Lang. Hear. Res. 2013, 56, 13–30. [Google Scholar] [CrossRef] [Green Version]
  3. Eisenberg, L.S.; Fisher, L.M.; Johnson, K.C.; Ganguly, D.H.; Grace, T.; Niparko, J.K.; Team, C.I. Sentence recognition in quiet and noise by pediatric cochlear implant users: Relationships to spoken language. Otol. Neurotol. 2016, 37, e75–e81. [Google Scholar] [CrossRef] [Green Version]
  4. Ching, T.Y.; Zhang, V.W.; Flynn, C.; Burns, L.; Button, L.; Hou, S.; McGhie, K.; Van Buynder, P. Factors influencing speech perception in noise for 5-year-old children using hearing aids or cochlear implants. Int. J. Audiol. 2018, 57, S70–S80. [Google Scholar] [CrossRef] [PubMed]
  5. Mishra, S.K.; Boddupally, S.P. Auditory cognitive training for pediatric cochlear implant recipients. Ear Hear. 2018, 39, 48–59. [Google Scholar] [CrossRef] [PubMed]
  6. Bugannim, Y.; Roth, D.A.E.; Zechoval, D.; Kishon-Rabin, L. Training of speech perception in noise in pre-lingual hearing impaired adults with cochlear implants compared to normal hearing adults. Otol. Neurotol. 2019, 40, e316–e325. [Google Scholar] [CrossRef] [PubMed]
  7. Zaltz, Y.; Bugannim, Y.; Zechoval, D.; Kishon-Rabin, L.; Perez, R. Listening in noise remains a significant challenge for cochlear implant users: Evidence from early deafened and those with progressive hearing loss compared to peers with normal hearing. J. Clin. Med. 2020, 9, 1381. [Google Scholar] [CrossRef] [PubMed]
  8. Fu, Q.J.; Galvin, J.J. Maximizing cochlear implant patients’ performance with advanced speech training procedures. Hear. Res. 2008, 242, 198–208. [Google Scholar] [CrossRef] [Green Version]
  9. Kronenberger, W.G.; Colson, B.G.; Henning, S.C.; Pisoni, D.B. Executive functioning and speech-language skills following long-term use of cochlear implants. J. Deaf Stud. Deaf Educ. 2014, 19, 456–470. [Google Scholar] [CrossRef] [Green Version]
  10. Dorman, M.F.; Gifford, R.H. Speech understanding in complex listening environments by listeners fit with cochlear implants. J. Speech Lang. Hear. Res. 2017, 60, 3019–3026. [Google Scholar] [CrossRef] [Green Version]
  11. Geers, A.E. Speech, language, and reading skills after early cochlear implantation. Arch. Otolaryngol. Head Neck Surg. 2004, 130, 634–638. [Google Scholar] [CrossRef]
  12. Svirsky, M.A.; Teoh, S.W.; Neuburger, H. Development of language and speech perception in congenitally, profoundly deaf children as a function of age at cochlear implantation. Audiol. Neurootol. 2004, 9, 224–233. [Google Scholar] [CrossRef] [PubMed]
  13. Akeroyd, M.A. Are individual differences in speech reception related to individual differences in cognitive ability? A survey of twenty experimental studies with normal and hearing-impaired adults. Int. J. Audiol. 2008, 47, S53–S71. [Google Scholar] [CrossRef] [PubMed]
  14. Rudner, M.; Foo, C.; Sundewall-Thorén, E.; Lunner, T.; Rönnberg, J. Phonological mismatch and explicit cognitive processing in a sample of 102 hearing-aid users. Int. J. Audiol. 2008, 47, S91–S98. [Google Scholar] [CrossRef] [PubMed]
  15. Lunner, T.; Rudner, M.; Rönnberg, J. Cognition and hearing aids. Scand. J. Psychol. 2009, 50, 395–403. [Google Scholar] [CrossRef] [PubMed] [Green Version]
  16. Moberly, A.C.; Bates, C.; Harris, M.S.; Pisoni, D.B. The Enigma of Poor Performance by Adults with Cochlear Implants. Otol. Neurotol. 2016, 37, 1522–1528. [Google Scholar] [CrossRef] [PubMed] [Green Version]
  17. Davidson, L.S.; Geers, A.E.; Uchanski, R.M.; Firszt, J.B. Effects of early acoustic hearing on speech perception and language for pediatric cochlear implant recipients. J. Speech Lang. Hear. Res. 2019, 62, 3620–3637. [Google Scholar] [CrossRef] [PubMed]
  18. Pasley, B.N.; David, S.V.; Mesgarani, N.; Flinker, A.; Shamma, S.A.; Crone, N.E.; Knight, R.T.; Chang, E.F. Reconstructing speech from human auditory cortex. PLoS Biol. 2012, 10, e1001251. [Google Scholar] [CrossRef] [Green Version]
  19. Steinschneider, M.; Nourski, K.V.; Rhone, A.E.; Kawasaki, H.; Oya, H.; Howard, M.A., III. Differential activation of human core, non-core and auditory-related cortex during speech categorization tasks as revealed by intracranial recordings. Front. Neurosci. 2014, 8, 240. [Google Scholar] [CrossRef] [Green Version]
  20. Gaab, N.; Gabrieli, J.D.; Glover, G.H. Assessing the influence of scanner background noise on auditory processing. I. An fmri study comparing three experimental designs with varying degrees of scanner noise. Hum. Brain Mapp. 2007, 28, 703–720. [Google Scholar] [CrossRef] [PubMed]
  21. Scarff, C.J.; Dort, J.C.; Eggermont, J.J.; Goodyear, B.G. The effect of mr scanner noise on auditory cortex activity using fMRI. Hum. Brain Mapp. 2004, 22, 341–349. [Google Scholar] [CrossRef] [PubMed]
  22. Deprez, H.; Gransier, R.; Hofmann, M.; van Wieringen, A.; Wouters, J.; Moonen, M. Independent component analysis for cochlear implant artifacts attenuation from electrically evoked auditory steady-state response measurements. J. Neural Eng. 2017, 15, 016006. [Google Scholar] [CrossRef]
  23. BinKhamis, G.; Perugia, E.; O’Driscoll, M.; Kluk, K. Speech-abrs in cochlear implant recipients: Feasibility study. Int. J. Audiol. 2019, 58, 678–684. [Google Scholar] [CrossRef] [Green Version]
  24. Fujiki, N.; Naito, Y.; Hirano, S.; Kojima, H.; Shiomi, Y.; Nishizawa, S.; Konishi, J.; Honjo, I. Correlation between rcbf and speech perception in cochlear implant users. Auris Nasus Larynx 1999, 26, 229–236. [Google Scholar] [CrossRef] [PubMed]
  25. Green, K.M.J.; Julyan, P.J.; Hastings, D.L.; Ramsden, R.T. Auditory cortical activation and speech perception in cochlear implant users: Effects of implant experience and duration of deafness. Hear. Res. 2005, 205, 184–192. [Google Scholar] [CrossRef] [PubMed]
  26. Mortensen, M.V.; Mirz, F.; Gjedde, A. Restored speech comprehension linked to activity in left inferior prefrontal and right temporal cortices in postlingual deafness. Neuroimage 2006, 31, 842–852. [Google Scholar] [CrossRef]
  27. Boas, D.A.; Elwell, C.E.; Ferrari, M.; Taga, G. Twenty years of functional near-infrared spectroscopy: Introduction for the special issue. NeuroImage 2014, 85, 1–5. [Google Scholar] [CrossRef]
  28. Wiggins, I.M.; Anderson, C.A.; Kitterick, P.T.; Hartley, D.E. Speech-evoked activation in adult temporal cortex measured using functional near-infrared spectroscopy (fNIRS): Are the measurements reliable? Hear. Res. 2016, 339, 142–154. [Google Scholar] [CrossRef]
  29. Pinti, P.; Tachtsidis, I.; Hamilton, A.; Hirsch, J.; Aichelburg, C.; Gilbert, S.; Burgess, P.W. The present and future use of functional near-infrared spectroscopy (fNIRS) for cognitive neuroscience. Ann. N. Y. Acad. Sci. 2020, 1464, 5–29. [Google Scholar] [CrossRef] [PubMed]
  30. Pollonini, L.; Olds, C.; Abaya, H.; Bortfeld, H.; Beauchamp, M.S.; Oghalai, J.S. Auditory cortex activation to natural speech and simulated cochlear implant speech measured with functional near-infrared spectroscopy. Hear. Res. 2014, 309, 84–93. [Google Scholar] [CrossRef] [Green Version]
  31. Olds, C.; Pollonini, L.; Abaya, H.; Larky, J.; Loy, M.; Bortfeld, H.; Beauchamp, M.S.; Oghalai, J.S. Cortical Activation Patterns Correlate with Speech Understanding After Cochlear Implantation. Ear Hear. 2016, 37, e160–e172. [Google Scholar] [CrossRef] [PubMed]
  32. Zhou, X.; Seghouane, A.K.; Shah, A.; Innes-Brown, H.; Cross, W.; Litovsky, R.; McKay, C.M. Cortical speech processing in postlingually deaf adult cochlear implant users, as revealed by functional near-infrared spectroscopy. Trends Hear. 2018, 22, 2331216518786850. [Google Scholar] [CrossRef]
  33. Butler, L.K.; Kiran, S.; Tager-Flusberg, H. Functional near-infrared spectroscopy in the study of speech and language impairment across the life span: A systematic review. Am. J. Speech Lang. Pathol. 2020, 29, 1674–1701. [Google Scholar] [CrossRef]
  34. Saliba, J.; Bortfeld, H.; Levitin, D.J.; Oghalai, J.S. Functional near-infrared spectroscopy for neuroimaging in cochlear implant recipients. Hear. Res. 2016, 338, 64–75. [Google Scholar] [CrossRef] [PubMed] [Green Version]
  35. Anderson, C.A.; Lazard, D.S.; Hartley, D.E. Plasticity in bilateral superior temporal cortex: Effects of deafness and cochlear implantation on auditory and visual speech processing. Hear. Res. 2017, 343, 138–149. [Google Scholar] [CrossRef] [PubMed]
  36. Basura, G.J.; Hu, X.S.; Juan, J.S.; Tessier, A.M.; Kovelman, I. Human central auditory plasticity: A review of functional near-infrared spectroscopy (fNIRS) to measure cochlear implant performance and tinnitus perception. Laryngoscope Investig. Otolaryngol. 2018, 3, 463–472. [Google Scholar] [CrossRef] [Green Version]
  37. Bortfeld, H. Functional near-infrared spectroscopy as a tool for assessing speech and spoken language processing in pediatric and adult cochlear implant users. Dev. Psychobiol. 2019, 61, 430–443. [Google Scholar] [CrossRef]
  38. Mushtaq, F.; Wiggins, I.M.; Kitterick, P.T.; Anderson, C.A.; Hartley, D.E.H. The Benefit of Cross-Modal Reorganization on Speech Perception in Pediatric Cochlear Implant Recipients Revealed Using Functional Near-Infrared Spectroscopy. Front. Hum. Neurosci. 2020, 14, 308. [Google Scholar] [CrossRef]
  39. Anderson, C.A.; Wiggins, I.M.; Kitterick, P.T.; Hartley, D.E.H. Pre-operative Brain Imaging Using Functional Near-Infrared Spectroscopy Helps Predict Cochlear Implant Outcome in Deaf Adults. J. Assoc. Res. Otolaryngol. 2019, 20, 511–528. [Google Scholar] [CrossRef] [Green Version]
  40. Chen, L.-C.; Sandmann, P.; Thorne, J.D.; Bleichner, M.G.; Debener, S. Cross-modal functional reorganization of visual and auditory cortex in adult cochlear implant users identified with fnirs. Neural Plast. 2016, 2016, 4382656. [Google Scholar] [CrossRef] [Green Version]
  41. Chen, L.-C.; Puschmann, S.; Debener, S. Increased cross-modal functional connectivity in cochlear implant users. Sci. Rep. 2017, 7, 10043. [Google Scholar] [CrossRef]
  42. Defenderfer, J.; Kerr-German, A.; Hedrick, M.; Buss, A.T. Investigating the role of temporal lobe activation in speech perception accuracy with normal hearing adults: An event-related fNIRS study. Neuropsychologia 2017, 106, 31–41. [Google Scholar] [CrossRef]
  43. Lawrence, R.J.; Wiggins, I.M.; Anderson, C.A.; Davies-Thompson, J.; Hartley, D.E.H. Cortical correlates of speech intelligibility measured using functional nearinfrared spectroscopy (fNIRS). Hear. Res. 2018, 370, 53–64. [Google Scholar] [CrossRef]
  44. Lawrence, R.J.; Wiggins, I.M.; Hodgson, J.C.; Hartley, D.E.H. Evaluating cortical responses to speech in children: A functional near-infrared spectroscopy (fNIRS) study. Hear. Res. 2021, 401, 108155. [Google Scholar] [CrossRef] [PubMed]
  45. Wijayasiri, P.; Hartley, D.E.H.; Wiggins, I.M. Brain activity underlying the recovery of meaning from degraded speech: A functional near-infrared spectroscopy (fNIRS) study. Hear. Res. 2017, 351, 55–67. [Google Scholar] [CrossRef]
  46. Zhou, X.; Sobczak, G.S.; McKay, C.M.; Litovsky, R.Y. Effects of degraded speech processing and binaural unmasking investigated using functional near-infrared spectroscopy (fNIRS). PLoS ONE 2022, 17, e0267588. [Google Scholar] [CrossRef]
  47. Defenderfer, J.; Forbes, S.; Wijeakumar, S.; Hedrick, M.; Plyler, P.; Buss, A.T. Frontotemporal activation differs between perception of simulated cochlear implant speech and speech in background noise: An image-based fNIRS study. Neuroimage 2021, 240, 118385. [Google Scholar] [CrossRef]
  48. Bisconti, S.; Shulkin, M.; Hu, X.; Basura, G.J.; Kileny, P.R.; Kovelman, I. Functional near-infrared spectroscopy brain imaging investigation of phonological awareness and passage comprehension abilities in adult recipients of cochlear implants. J. Speech Lang. Hear. Res. 2016, 59, 239–253. [Google Scholar] [CrossRef] [PubMed]
  49. Van de Rijt, L.P.; van Opstal, A.J.; Mylanus, E.A.; Straatman, L.V.; Hu, H.Y.; Snik, A.F.; van Wanrooij, M.M. Temporal cortex activation to audiovisual speech in normal-hearing and cochlear implant users measured with functional near-infrared spectroscopy. Front. Hum. Neurosci. 2016, 10, 48. [Google Scholar] [CrossRef] [PubMed] [Green Version]
  50. Chen, L.-C.; Stropahl, M.; Schönwiesner, M.; Debener, S. Enhanced visual adaptation in cochlear implant users revealed by concurrent eeg-fnirs. Neuroimage 2017, 146, 600–608. [Google Scholar] [CrossRef]
  51. Anderson, S.; Kraus, N. Sensory-cognitive interaction in the neural encoding of speech in noise: A review. J. Am. Acad. Audiol. 2010, 21, 575–585. [Google Scholar] [CrossRef]
  52. ANSI, S 3.6; 2018 Specification for Audiometers. ANSI: New York, NY, USA, 2018.
  53. Levitt, H. Transformed up-down methods in psychoacoustics. J. Acoust. Soc. Am. 1971, 49, 467–477. [Google Scholar] [CrossRef]
  54. Zaltz, Y.; Goldsworthy, R.L.; Kishon-Rabin, L.; Eisenberg, L.S. Voice discrimination by adults with cochlear implants: The benefits of early implantation for vocal-tract length perception. J. Assoc. Res. Otolaryngol. JARO 2018, 19, 193–209. [Google Scholar] [CrossRef]
  55. Zaltz, Y.; Goldsworthy, R.L.; Eisenberg, L.S.; Kishon-Rabin, L. Children with normal hearing are efficient users of fundamental frequency and vocal tract length cues for voice discrimination. Ear Hear. 2020, 41, 182–193. [Google Scholar] [CrossRef] [PubMed]
  56. Saager, R.B.; Telleri, N.L.; Berger, A.J. Two-detector corrected near infrared spectroscopy (C-NIRS) detects hemodynamic activation responses more robustly than single-detector NIRS. Neuroimage 2011, 55, 1679–1685. [Google Scholar] [CrossRef] [PubMed]
  57. American Clinical Neurophysiology Society. Guideline 5: Guidelines for standard electrode position nomenclature. Am. J. Electroneurodiagnostic. Technol. 2006, 46, 222–225. [Google Scholar] [CrossRef]
  58. Jurcak, V.; Tsuzuki, D.; Dan, I. 10/20, 10/10, and 10/5systems revisited: Their validity as relative head-surfacebased positioning systems. NeuroImage 2007, 34, 1600–1611. [Google Scholar] [CrossRef]
  59. Zimeo Morais, G.A.; Balardin, J.B.; Sato, J.R. fNIRS Optodes’ Location Decider (fOLD): A toolbox for probe arrangement guided by brain regions-of-interest. Sci. Rep. 2018, 8, 3341. [Google Scholar] [CrossRef] [Green Version]
  60. Chen, W.L.; Wagner, J.; Heugel, N.; Sugar, J.; Lee, Y.W.; Conant, L.; Malloy, M.; Heffernan, J.; Quirk, B.; Zinos, A.; et al. Functional Near-Infrared Spectroscopy and Its Clinical Application in the Field of Neuroscience: Advances and Future Directions. Front. Neurosci. 2020, 14, 724. [Google Scholar] [CrossRef] [PubMed]
  61. Aasted, C.M.; Yücel, M.A.; Cooper, R.J.; Dubb, J.; Tsuzuki, D.; Becerra, L.; Petkov, M.P.; Borsook, D.; Dan, I.; Boas, D.A. Anatomical guidance for functional near-infrared spectroscopy: AtlasViewer tutorial. Neurophotonics 2015, 2, 020801. [Google Scholar] [CrossRef] [Green Version]
  62. Huppert, T.J.; Diamond, S.G.; Franceschini, M.A.; Boas, D.A. HomER: A review of time-series analysis methods for near-infrared spectroscopy of the brain. Appl. Opt. 2009, 48, D280–D298. [Google Scholar] [CrossRef] [PubMed]
  63. Pollonini, L.; Bortfeld, H.; Oghalai, J.S. PHOEBE: A method for real time mapping of optodes-scalp coupling in functional near-infrared spectroscopy. Biomed. Opt. Express 2016, 7, 5104–5119. [Google Scholar] [CrossRef] [Green Version]
  64. Themelis, G.; Selb, J.; Thaker, S.; Stott, J.J.; Custo, A.; Boas, D.A.; Franceschini, M.-A. Depth of Arterial Oscillation Resolved with NIRS Time and Frequency Domain; Optical Society of America: Washington, DC, USA, 2004. [Google Scholar]
  65. Scholkmann, F.; Spichtig, S.; Muehlemann, T.; Wolf, M. How to detect and reduce movement artifacts in near-infrared imaging using moving standard deviation and spline interpolation. Physiol. Meas. 2010, 31, 649–662. [Google Scholar] [CrossRef] [Green Version]
  66. Molavi, B.; Dumont, G.A. Wavelet-based motion artifact removal for functional near-infrared spectroscopy. Physiol. Meas. 2012, 33, 259. [Google Scholar] [CrossRef]
  67. Brigadoi, S.; Ceccherini, L.; Cutini, S.; Scarpa, F.; Scatturin, P.; Selb, J.; Gagnon, L.; Boas, D.A.; Cooper, R.J. Motion artifacts in functional near-infrared spectroscopy: A comparison of motion correction techniques applied to real cognitive data. Neuroimage 2014, 85, 181–191. [Google Scholar] [CrossRef] [Green Version]
  68. Delpy, D.T.; Cope, M.; van der Zee, P.; Arridge, S.; Wray, S.; Wyatt, J. Estimation of optical pathlength through tissue from direct time of flight measurement. Phys. Med. Biol. 1988, 33, 1433–1442. [Google Scholar] [CrossRef] [Green Version]
  69. Ye, J.C.; Tak, S.; Jang, K.E.; Jung, J.; Jang, J. NIRS-SPM: Statistical parametric mapping for near-infrared spectroscopy. Neuroimage 2009, 44, 428–447. [Google Scholar] [CrossRef] [PubMed]
  70. Uga, M.; Dan, I.; Sano, T.; Dan, H.; Watanabe, E. Optimizing the general linear model for functional near-infrared spectroscopy: An adaptive hemodynamic response function approach. Neurophotonics 2014, 1, 015004. [Google Scholar] [CrossRef] [PubMed] [Green Version]
  71. Glick, H.; Sharma, A. Cross-modal plasticity in developmental and age-related hearing loss: Clinical implications. Hear. Res. 2017, 343, 191–201. [Google Scholar] [CrossRef] [PubMed]
  72. Bornstein, M.H. Sensitive periods in development: Interdisciplinary Perspective. In Lawrence Erlbaum Associative; New York University Press: New York, NY, USA, 1987. [Google Scholar]
  73. Bornstein, M.H. Sensitive periods in development: Structural characteristics and causal interpretations. Psychol. Bull. 1989, 105, 179–197. [Google Scholar] [CrossRef]
  74. Gordon, K.A.; Papsin, B.C.; Harrison, R.V. Effects of cochlear implant use on the electrically evoked middle latency response in children. Hear. Res. 2005, 204, 78–89. [Google Scholar] [CrossRef] [PubMed]
  75. Sharma, A.; Dorman, M.F.; Kral, A. The influence of a sensitive period on central auditory development in children with unilateral and bilateral cochlear implants. Hear. Res. 2005, 203, 134–143. [Google Scholar] [CrossRef] [PubMed]
  76. Kral, A.; Tillein, J. Brain plasticity under cochlear implant stimulation. Adv. Otorhinolaryngol. 2006, 64, 89–108. [Google Scholar] [PubMed]
  77. Barone, P.; Lacassagne, L.; Kral, A. Reorganization of the connectivity of cortical field DZ in congenitally deaf cat. PLoS ONE 2013, 8, e60093. [Google Scholar] [CrossRef] [PubMed]
  78. Hickok, G.; Poeppel, D. The cortical organization of speech processing. Nat. Rev. Neurosci. 2007, 8, 393–402. [Google Scholar] [CrossRef] [PubMed]
  79. Suarez, A.; Valdes-Hernandez, P.A.; Moshkforoush, A.; Tsoukias, N.; Riera, J. Arterial blood stealing as a mechanism of negative BOLD response: From the steady-flow with nonlinear phase separation to a windkessel-based model. J. Theor. Biol. 2021, 529, 110856. [Google Scholar] [CrossRef]
  80. Mayhew, S.D.; Coleman, S.C.; Mullinger, K.J.; Can, C. Across the adult lifespan the ipsilateral sensorimotor cortex negative BOLD response exhibits decreases in magnitude and spatial extent suggesting declining inhibitory control. NeuroImage 2022, 253, 119081. [Google Scholar] [CrossRef]
  81. Steinmetzger, K.; Shen, Z.; Riedel, H.; Rupp, A. Auditory cortex activity measured using functional near-infrared spectroscopy (fNIRS) appears to be susceptible to masking by cortical blood stealing. Hear. Res. 2020, 396, 108069. [Google Scholar] [CrossRef]
  82. Majerus, S.; Van Der Linden, M.; Collette, F.; Laureys, S.; Poncelet, M.; Degueldre, C.; Delfiore, G.; Luxen, A.; Salmon, E. Modulation of brain activity during phonological familiarization. Brain Lang. 2005, 92, 320–331. [Google Scholar] [CrossRef]
  83. Graves, W.W.; Grabowski, T.J.; Mehta, S.; Gupta, P. The left posterior superior temporal gyrus participates specifically in accessing lexical phonology. J. Cogn. Neurosci. 2008, 20, 1698–1710. [Google Scholar] [CrossRef] [PubMed] [Green Version]
  84. Gow, D., Jr. The cortical organization of lexical knowledge: A dual lexicon model of spoken language processing. Brain Lang. 2012, 121, 273–288. [Google Scholar] [CrossRef] [PubMed]
  85. Johnson, C.; Goswami, U. Phonological awareness, vocabulary, and reading in deaf children with cochlear implants. J. Speech Lang. Hear. Res. 2010, 53, 237–261. [Google Scholar] [CrossRef] [PubMed]
  86. Niparko, J.K.; Tobey, E.A.; Thal, D.J.; Eisenberg, L.S.; Wang, N.Y.; Quittner, A.L.; Fink, N.E.; Team, C.I. Spoken language development in children following cochlear implantation. JAMA 2010, 303, 1498–1506. [Google Scholar] [CrossRef] [PubMed] [Green Version]
  87. Geers, A.E.; Hayes, H. Reading, writing, and phonological processing skills of adolescents with 10 or more years of cochlear implant experience. Ear. Hear. 2011, 32, 49S–59S. [Google Scholar] [CrossRef] [Green Version]
  88. Chandramouli, S.H.; Kronenberger, W.G.; Pisoni, D.B. Verbal Learning and Memory in Early-Implanted, Prelingually Deaf Adolescent and Adult Cochlear Implant Users. J. Speech Lang. Hear. Res. 2019, 62, 1033–1050. [Google Scholar] [CrossRef]
  89. Naito, Y.; Tateya, I.; Fujiki, N.; Hirano, S.; Ishizu, K.; Nagahama, Y.; Fukuyama, H.; Kojima, H. Increased cortical activation during hearing of speech in cochlear implant users. Hear. Res. 2000, 143, 139–146. [Google Scholar] [CrossRef]
  90. Rowland, S.C.; Hartley, D.; Wiggins, I.M. Listening in naturalistic scenes: What can functional Near-Infrared Spectroscopy and intersubject correlation analysis tell us about the underlying brain activity? Trends Hear. 2018, 22, 2331216518804116. [Google Scholar] [CrossRef] [Green Version]
  91. Evans, S.; McGettigan, C.; Agnew, Z.K.; Rosen, S.; Scott, S.K. Getting the Cocktail Party Started: Masking Effects in Speech Perception. J. Cogn. Neurosci. 2016, 28, 483–500. [Google Scholar] [CrossRef] [Green Version]
  92. Çukur, T.; Huth, A.G.; Nishimoto, S.; Gallant, J.L. Functional subdomains within human FFA. J. Neurosci. Off. J. Soc. Neurosci. 2013, 33, 16748–16766. [Google Scholar] [CrossRef] [Green Version]
  93. Weiner, K.S.; Zilles, K. The anatomical and functional specialization of the fusiform gyrus. Neuropsychologia 2016, 83, 48–62. [Google Scholar] [CrossRef] [Green Version]
  94. Zhang, W.; Wang, J.; Fan, L.; Zhang, Y.; Fox, P.T.; Eickhoff, S.B.; Yu, C.; Jiang, T. Functional organization of the fusiform gyrus revealed with connectivity profiles. Hum. Brain Mapp. 2016, 37, 3003–3016. [Google Scholar] [CrossRef] [PubMed]
  95. Forseth, K.J.; Kadipasaoglu, C.M.; Conner, C.R.; Hickok, G.; Knight, R.T.; Tandon, N. A lexical semantic hub for heteromodal naming in middle fusiform gyrus. Brain J. Neurol. 2018, 141, 2112–2126. [Google Scholar] [CrossRef] [PubMed] [Green Version]
  96. Zhou, X.; Sobczak, G.; McKay, C.M.; Litovsky, R.Y. Comparing fNIRS signal qualities between approaches with and without short channels. PLoS ONE 2020, 15, e0244186. [Google Scholar] [CrossRef] [PubMed]
  97. Luke, R.; Larson, E.; Shader, M.J.; Innes-Brown, H.; Van Yper, L.; Lee, A.K.C.; Sowman, P.F.; McAlpine, D. Analysis methods for measuring passive auditory fNIRS responses generated by a block-design paradigm. Neurophotonics 2021, 8, 025008. [Google Scholar] [CrossRef]
  98. Yücel, M.A.; Lühmann, A.V.; Scholkmann, F.; Gervain, J.; Dan, I.; Ayaz, H.; Boas, D.; Cooper, R.J.; Culver, J.; Elwell, C.E.; et al. Best practices for fNIRS publications. Neurophotonics 2021, 8, 012101. [Google Scholar] [CrossRef]
  99. Gagnon, L.; Yücel, M.A.; Boas, D.A.; Cooper, R.J. Further improvement in reducing superficial contamination in NIRS using double short separation measurements. Neuroimage 2014, 85 Pt 1, 127–135. [Google Scholar] [CrossRef] [Green Version]
  100. Shader, M.J.; Luke, R.; Gouailhardou, N.; McKay, C.M. The use of broad vs restricted regions of interest in functional near-infrared spectroscopy for measuring cortical activation to auditory-only and visual-only speech. Hear. Res. 2021, 406, 108256. [Google Scholar] [CrossRef] [PubMed]
Figure 1. Pseudorandom block design of the fNIRS stimuli presentation. In total, 21 blocks were presented, 7 from each condition. Two questions were presented, following the 1st and 20th blocks. SO = speech-only condition, NO = noise-only condition, SIN = speech-in-noise at SNR = 0 dB condition.
Applsci 12 12063 g001
Figure 2. fNIRS montage. (a) A two-dimensional picture to indicate sources (red dots), detectors (blue dots), short-distance separation channels (red dots with blue circles), and regular channels (purple lines) in 10–10 system. (b) Two three-dimensional pictures as an example for the sources, detectors, and channel positions on the brain cortex.
Applsci 12 12063 g002
Figure 3. Probe fabrication error for each group. Black dots show the opotodes location in the original probe design. Colored dots show the range in location of the actual optodes for each group. As an example for the possible location of the CI device(s) in the CI group, the striped circles show the location of the two CI devices of participant CI12. NH = normal-hearing participants who listened to natural stimuli, NHV = normal-hearing participants who listened to vocoded stimuli, CI = cochlear implant users.
Applsci 12 12063 g003
Figure 4. Mean beta values of the GLM analysis for the HbO data, separately for each condition and group. NH = normal-hearing participants who listened to natural stimuli (n = 15), NHV = normal-hearing participants who listened to vocoded stimuli (n = 15), CI = cochlear implant users (n = 14), SO = speech-only condition, SIN = speech-in-noise condition, NO = noise-only condition.
Applsci 12 12063 g004
Figure 5. Mean beta values (+1SE) for the four MTG clustered ROIs for (a,b): the NH, NHV and CI groups, and (c,d): NH, NHV, good CI, poor CI. NH = normal-hearing participants who listened to natural stimuli (n = 15), NHV = normal-hearing participants who listened to vocoded stimuli (n = 15), CI= cochlear implant users (n = 14), Good CI = CI users with SRTn < 0 dB (n = 6), poor CI = CI users with SRTn > 0 dB (n = 8), SO = speech-only condition, SIN = speech-in-noise condition. Asterisk = p < 0.05.
Applsci 12 12063 g005
Figure 6. ROI-mean beta values for the SIN condition as a function of speech reception thresholds in noise (SRTn) across participants (n = 41; 15NH, 15NHV, 11CI). Left panel for Left SIN and right panel for Right SIN. NH = normal-hearing participants who listened to natural stimuli, NHV = normal-hearing participants who listened to vocoded stimuli, CI = cochlear implant users.
Applsci 12 12063 g006
Table 1. Background information of the CI participants. CMV = cytomegalovirus.
Subject
ID
GenderEtiology Age at Identification
(Years;Months)
Age at Implantation
(Years;Months)
Age at Testing
(Years;Months)
ImplantVocation
CI1FGenetic—connexin 260;011;00 (R)
6;06 (L)
20;04Cochlear Nucleus (Both—Nucleus 6)Student
CI2FGenetic—connexin 260;011;01 (L)
6;08 (r)
20;01Cochlear Nucleus (R—Freedom, L—Nucleus 5)Unemployed
CI3FUnknown0;082;00 (R)
10;00 (L)
23;06Cochlear Nucleus (Both Nucleus 7)Student
CI4MCMV0;032;00 (L)
12;01 (R)
22;05Cochlear nucleus (R—Nucleus 24, L—Freedom)student
CI5FCMV at pregnancy1;002;05 (R)
18;00 (L)
26;01Cochlear Nucleus (R—Nucleus 5, L—Nucleus 6)National service
CI6MGenetic—connexin 260;103;00 (L)
25;04 (R)
28;10Cochlear Nucleus (R—Nucleus 7, L—Nucleus 6)Social worker
CI7FUnknown4;0614;00 (R)
16;00(L)
24Both: AB-260Student
CI8FGenetic0;0825;11 (R)
30;06 (L)
35;05Med-El (R—Concerto, L—SynchroniTeacher
CI9FWaardenburg syndrom0;013;00 (L)31;01Cochlear Nucleus—Espirit 3GTeacher
CI10FGenetic—connexin 261;004;06 (L)18;04Med-El OpusStudent
CI11MRubella in pregnancy0;035;00 (L)30;10Cochlear—Nucleus 6Technician
CI12FUnknown0:0624;00 (L)20;10Med-El Combi40+National service
CI13FGenetic3;0031;01 (L)33;04Cochlear-KensoAssistant to kindergarten teacher
CI4FEar infections5;0634;00 (R)40AB PhonacKindergarten teacher
Table 2. The detailed montage for the study (short-distance separation channels are not included). Specificity ratings > 30% for each anatomical area as it relates to each source-detector (SD) position were taken from the fOLD toolbox [59], using the Brodmann atlas.
ChannelSD PairPair on MapMNI Coordinates x,y,zSD Distance (mm)Brodmann
Number
RegionSpecificity %
1S1-D1AF7-F5−59.58960.168−4.3623645Pars triangularis Broca’s48.79
46Dorsolateral prefrontal cortex43.20
3S2-D1AF3-F5−52.10565.73513.04641.945Pars triangularis Broca’s43.88
46Dorsolateral prefrontal cortex32.12
4S2-D3AF3-Afz−18.35483.51724.18939.110Frontopolar area72.47
5S3-D1F3-F5−58.80254.14323.51330.645Pars triangularis Broca’s70.67
6S3-D2F3-F1−41.38758.4248.85530.59Dorsolateral prefrontal cortex66.61
8S4-D2Fz-F1−15.83763.08762.13130.49Dorsolateral prefrontal cortex63.16
8Frontal eye fields34.73
9S4-D3Fz-Afz0.19375.2549.4339.89Dorsolateral prefrontal cortex61.77
10S4-D4Fz-F214.82463.33962.2430.29Dorsolateral prefrontal cortex68.93
11S5-D3AF4-Afz18.29183.47324.40338.710Frontopolar area72.47
12S5-D5AF4-F651.37166.11714.43941.246Dorsolateral prefrontal cortex49.34
45Pars triangularis Broca’s32.12
13S6-D4F4-F241.23259.17948.12930.39Dorsolateral prefrontal cortex68.37
14S6-D5F4-F658.57953.90624.73930.445Pars triangularis Broca’s70.67
16S7-D5AF8-F659.01860.776−3.20235.545Pars triangularis Broca’s43.88
46Dorsolateral prefrontal cortex43.18
18S8-D6T7-FT7−82.152−0.704−17.68430.621Middle temporal gyrus67.39
19S8-D7T7-TP7−87.447−30.648−14.48630.421Middle temporal gyrus49.28
20Inferior temporal gyrus47.32
20S8-D8T7-C5−85.287−14.1793.53941.122Superior temporal gyrus42.20
21Middle temporal gyrus37.02
22S9-D7CP5-TP7−83.896−46.5056.4540.822Superior temporal gyrus35.29
21Middle temporal gyrus34.85
23S9-D8CP5-C5−85.028−29.92625.72733.648Restosubicular area36.01
24S9-D15CP5-P5−77.374−64.10426.85833.639Angular gyrus part of Wernicke’s area32.67
25S10-D9T8-FT881.9020.854−15.9683021Middle temporal gyrus84.30
26S10-D10T8-C685.078−12.6984.82541.122Superior temporal gyrus47.33
21Middle temporal gyrus38.02
27S10-D11T8-TP886.471−30.117−13.1323121Middle temporal gyrus54.96
20Inferior temporal gyrus41.52
29S11-D10CP6-C684.951−28.59527.43634.322Superior temporal gyrus31.60
30S11-D11CP6-TP883.928−46.198.43540.921Superior temporal gyrus40.43
22Middle temporal gyrus35.40
31S11-D13CP6-P678.121−62.05127.56233.939Angular gyrus part of Wernicke’s area34.98
32S12-D9FT10-FT880.74313.185−38.23541.921Middle temporal gyrus69.07
33S12-D12FT10-F1078.13627.381−59.24629.138Superior temporal gyrus38.91
20Inferior temporal gyrus32.41
35S13-D11P8-TP879.743−60.24−9.10531.737Fusiform gyrus68.11
36S13-D13P8-P673.274−76.3329.54633.637Fusiform gyrus68.82
37S14-D6FT9-FT7−80.81712.621−38.55941.721Middle temporal gyrus69.10
38S14-D14FT9-F9−78.7125.365−59.94629.738Temporopolar area42.31
20Inferior temporal gyrus31.83
40S15-D7P7-TP7−79.372−61.256−10.55431.437Fusiform gyrus71.20
41S15-D15P7-P5−72.834−77.398.48133.537Fusiform gyrus68.55
Table 3. The number of participants who had SCI < 0.6 [32], and thus were excluded for each channel, divided by group. SCI = scalp coupling index. CI = cochlear implant (n = 14), NH = normal hearing (n = 15), NHV = Normal hearing participants who listened via a vocoder (n = 15).
Group/ChannelNHNHVCI
1001
3001
4000
5001
6001
8001
9203
10000
11100
12000
13011
14201
16000
18000
19000
20001
22000
23000
24102
25002
26102
27105
29000
30003
31000
32200
33010
35104
36001
37012
38002
40005
41004
Table 4. The individual speech reception thresholds in noise (SRTn) results for all the participants. CE = ceiling effect, SD = standard deviation.
CINHVNH
Serial NumberSRTnSerial NumberSRTnSerial NumberSRTn
CI1−4NHV1−5.18NH1−9.62
CI2−4NHV2−0.41NH2−6.30
CI3−3.96NHV3−3.69NH3−8.75
CI40.22NHV4−1.33NH4−10.69
CI5CENHV5−0.41NH5−11.32
CI6−3.46NHV6−2.26NH6−8.14
CI73.53NHV7−3.54NH7−9.37
CI80.49NHV8−0.41NH8−10.00
CI92.40NHV9−3.23NH9−10.27
CI10−5.52NHV10−1.42NH10−9.62
CI116.75NHV110.74NH11−7.02
CI12−3.36NHV12−2.55NH12−8.14
CI13CENHV13−3.48NH13−9.62
CI14CENHV14−1.42NH14−9.62
NHV15−3.56NH15−7.64
Mean (SD)0.34 (5.95) −2.14 (1.64) −9.03 (1.35)
Publisher’s Note: MDPI stays neutral with regard to jurisdictional claims in published maps and institutional affiliations.

