
Ecosystem Services Assessment for Their Integration in the Analysis of Landslide Risk

 , , , , and
Abstract
:1. Introduction
2. Materials and Methods
2.1. Study Area
2.2. Materials Used for the Present Paper

| Ecosystem Service | Method | Units |
|---|---|---|
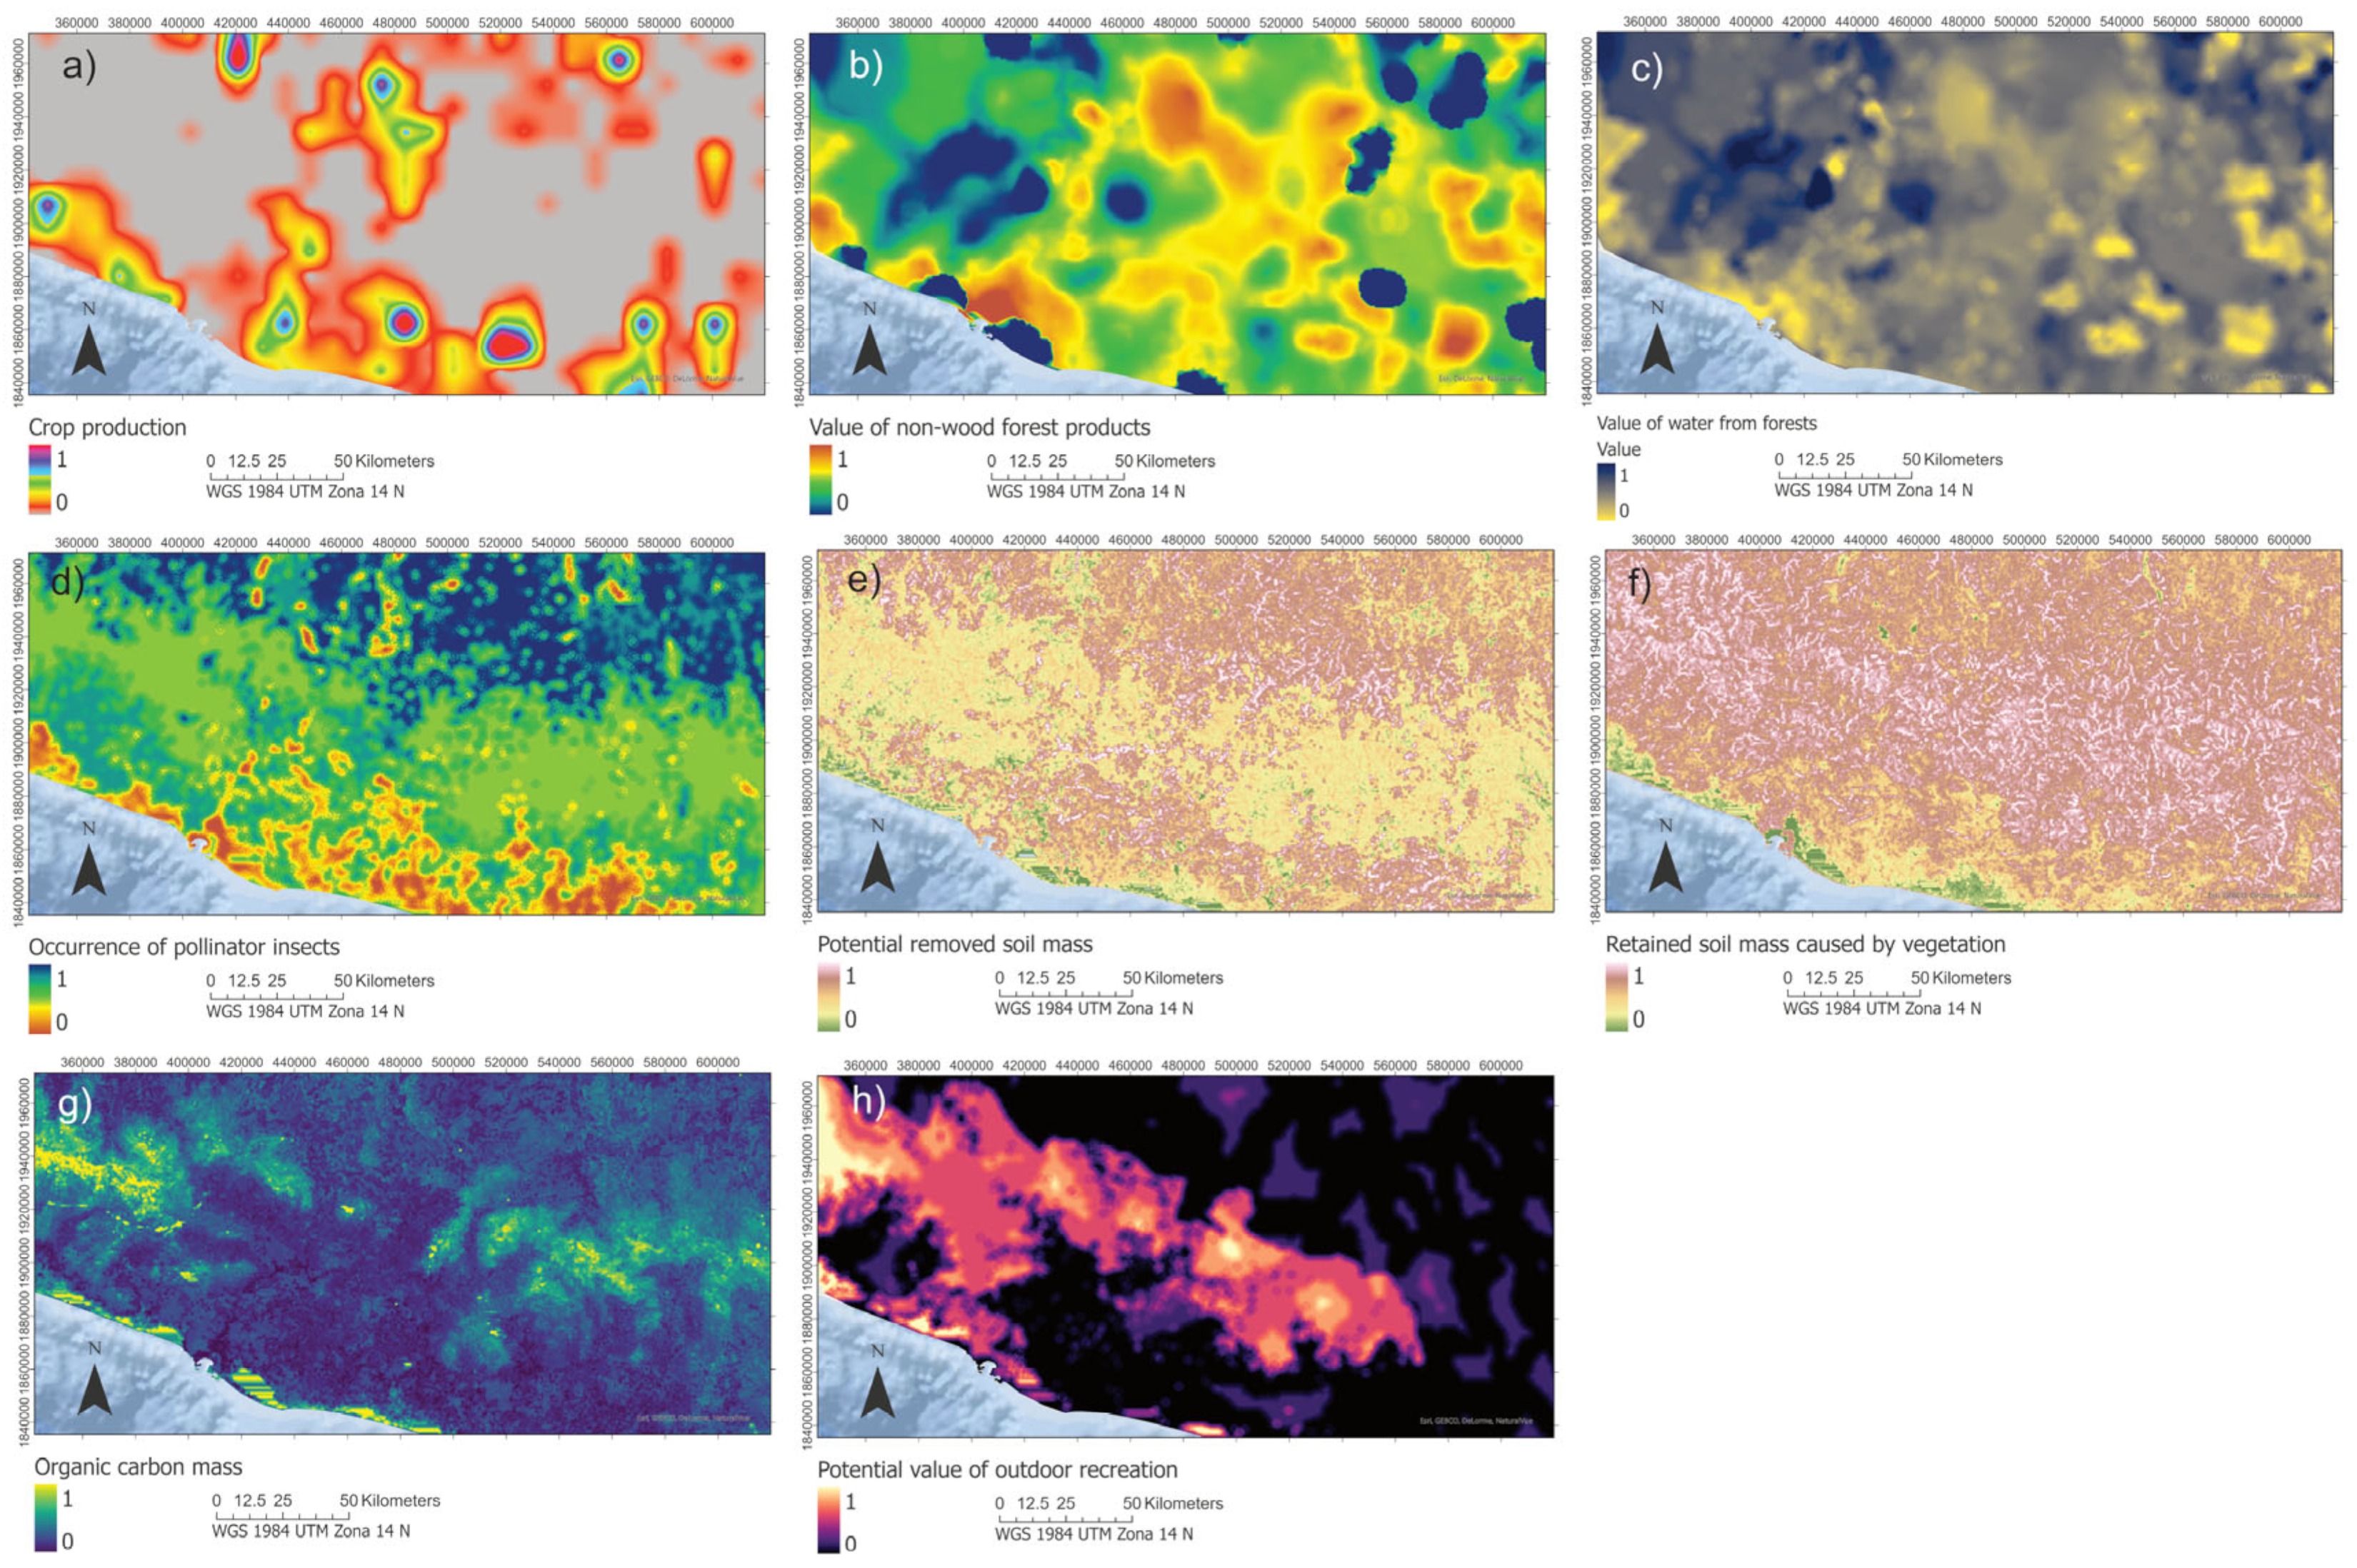
| Organic Carbon mass | Sum of aboveground, belowground biomass carbon storage, and soil organic carbon. | Ton/ha |
| Crop production | Sum of production of maise, rice, wheat, barley, rapeseed, sugar beet, rye, soybean, sugarcane, potato, and sunflower. | Ton/ha |
| Occurrence of pollinator insects | Components of insect occurrence related to weather factors and landscape structure are combined to produce the pollinator occurrence map. | 0–1 |
| Potential value of outdoor recreation | Recreation potential values follow the ESTIMAP implementation for the recreation opportunity spectrum, which reclassifies the landscape by recreation theoretical supply and proximity to people. | 0–1 |
| Retained soil mass from vegetation | The potential value (supply) of the sediment regulation ecosystem service is computed by calculating RUSLE twice, first using the best land cover data available, then changing all land cover to bare soil and differentiating the results to estimate the avoided soil erosion attributable to vegetation. | Ton/ha |
| Potential removed soil mass | This implementation of RUSLE uses methods to calculate LS, based on contributing area, grid cell size, aspect, and slope length exponents, to calculate K, based on soil organic matter and clay, sand, and silt fractions, and global studies for C and P factors based on land cover type. | Ton/ha |
| Value of water from forests | Model-based on a regression function of the monetary value of water services. | USD 2013(PPP) |
| Value of non-wood forest products | Model-based on a regression function of the monetary value of non-wood forest products. | USD 2013(PPP) |
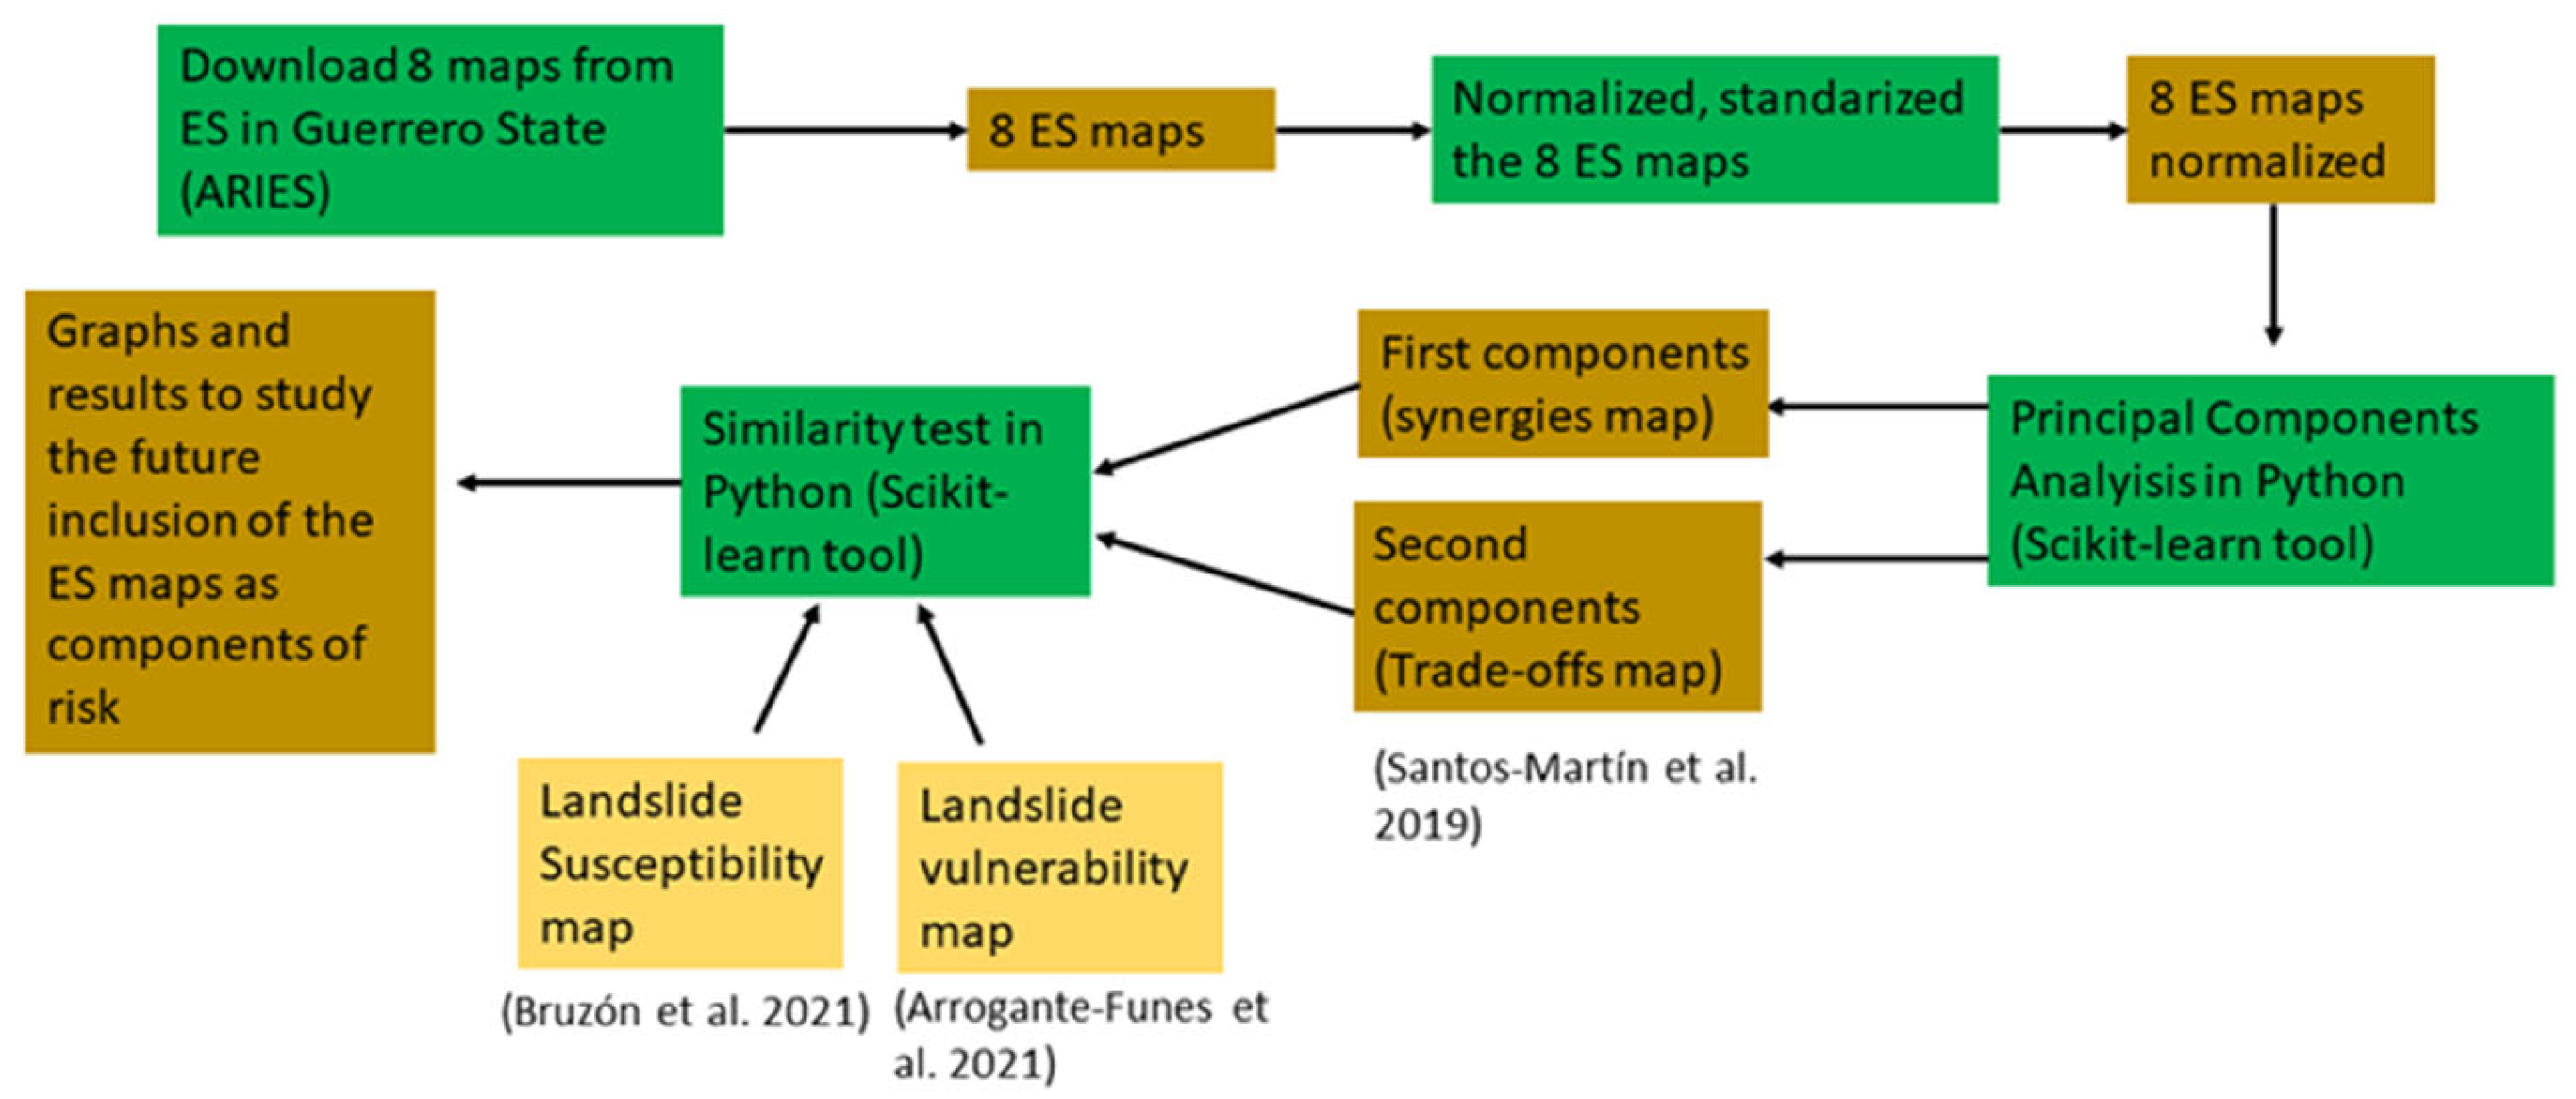
2.3. Methods
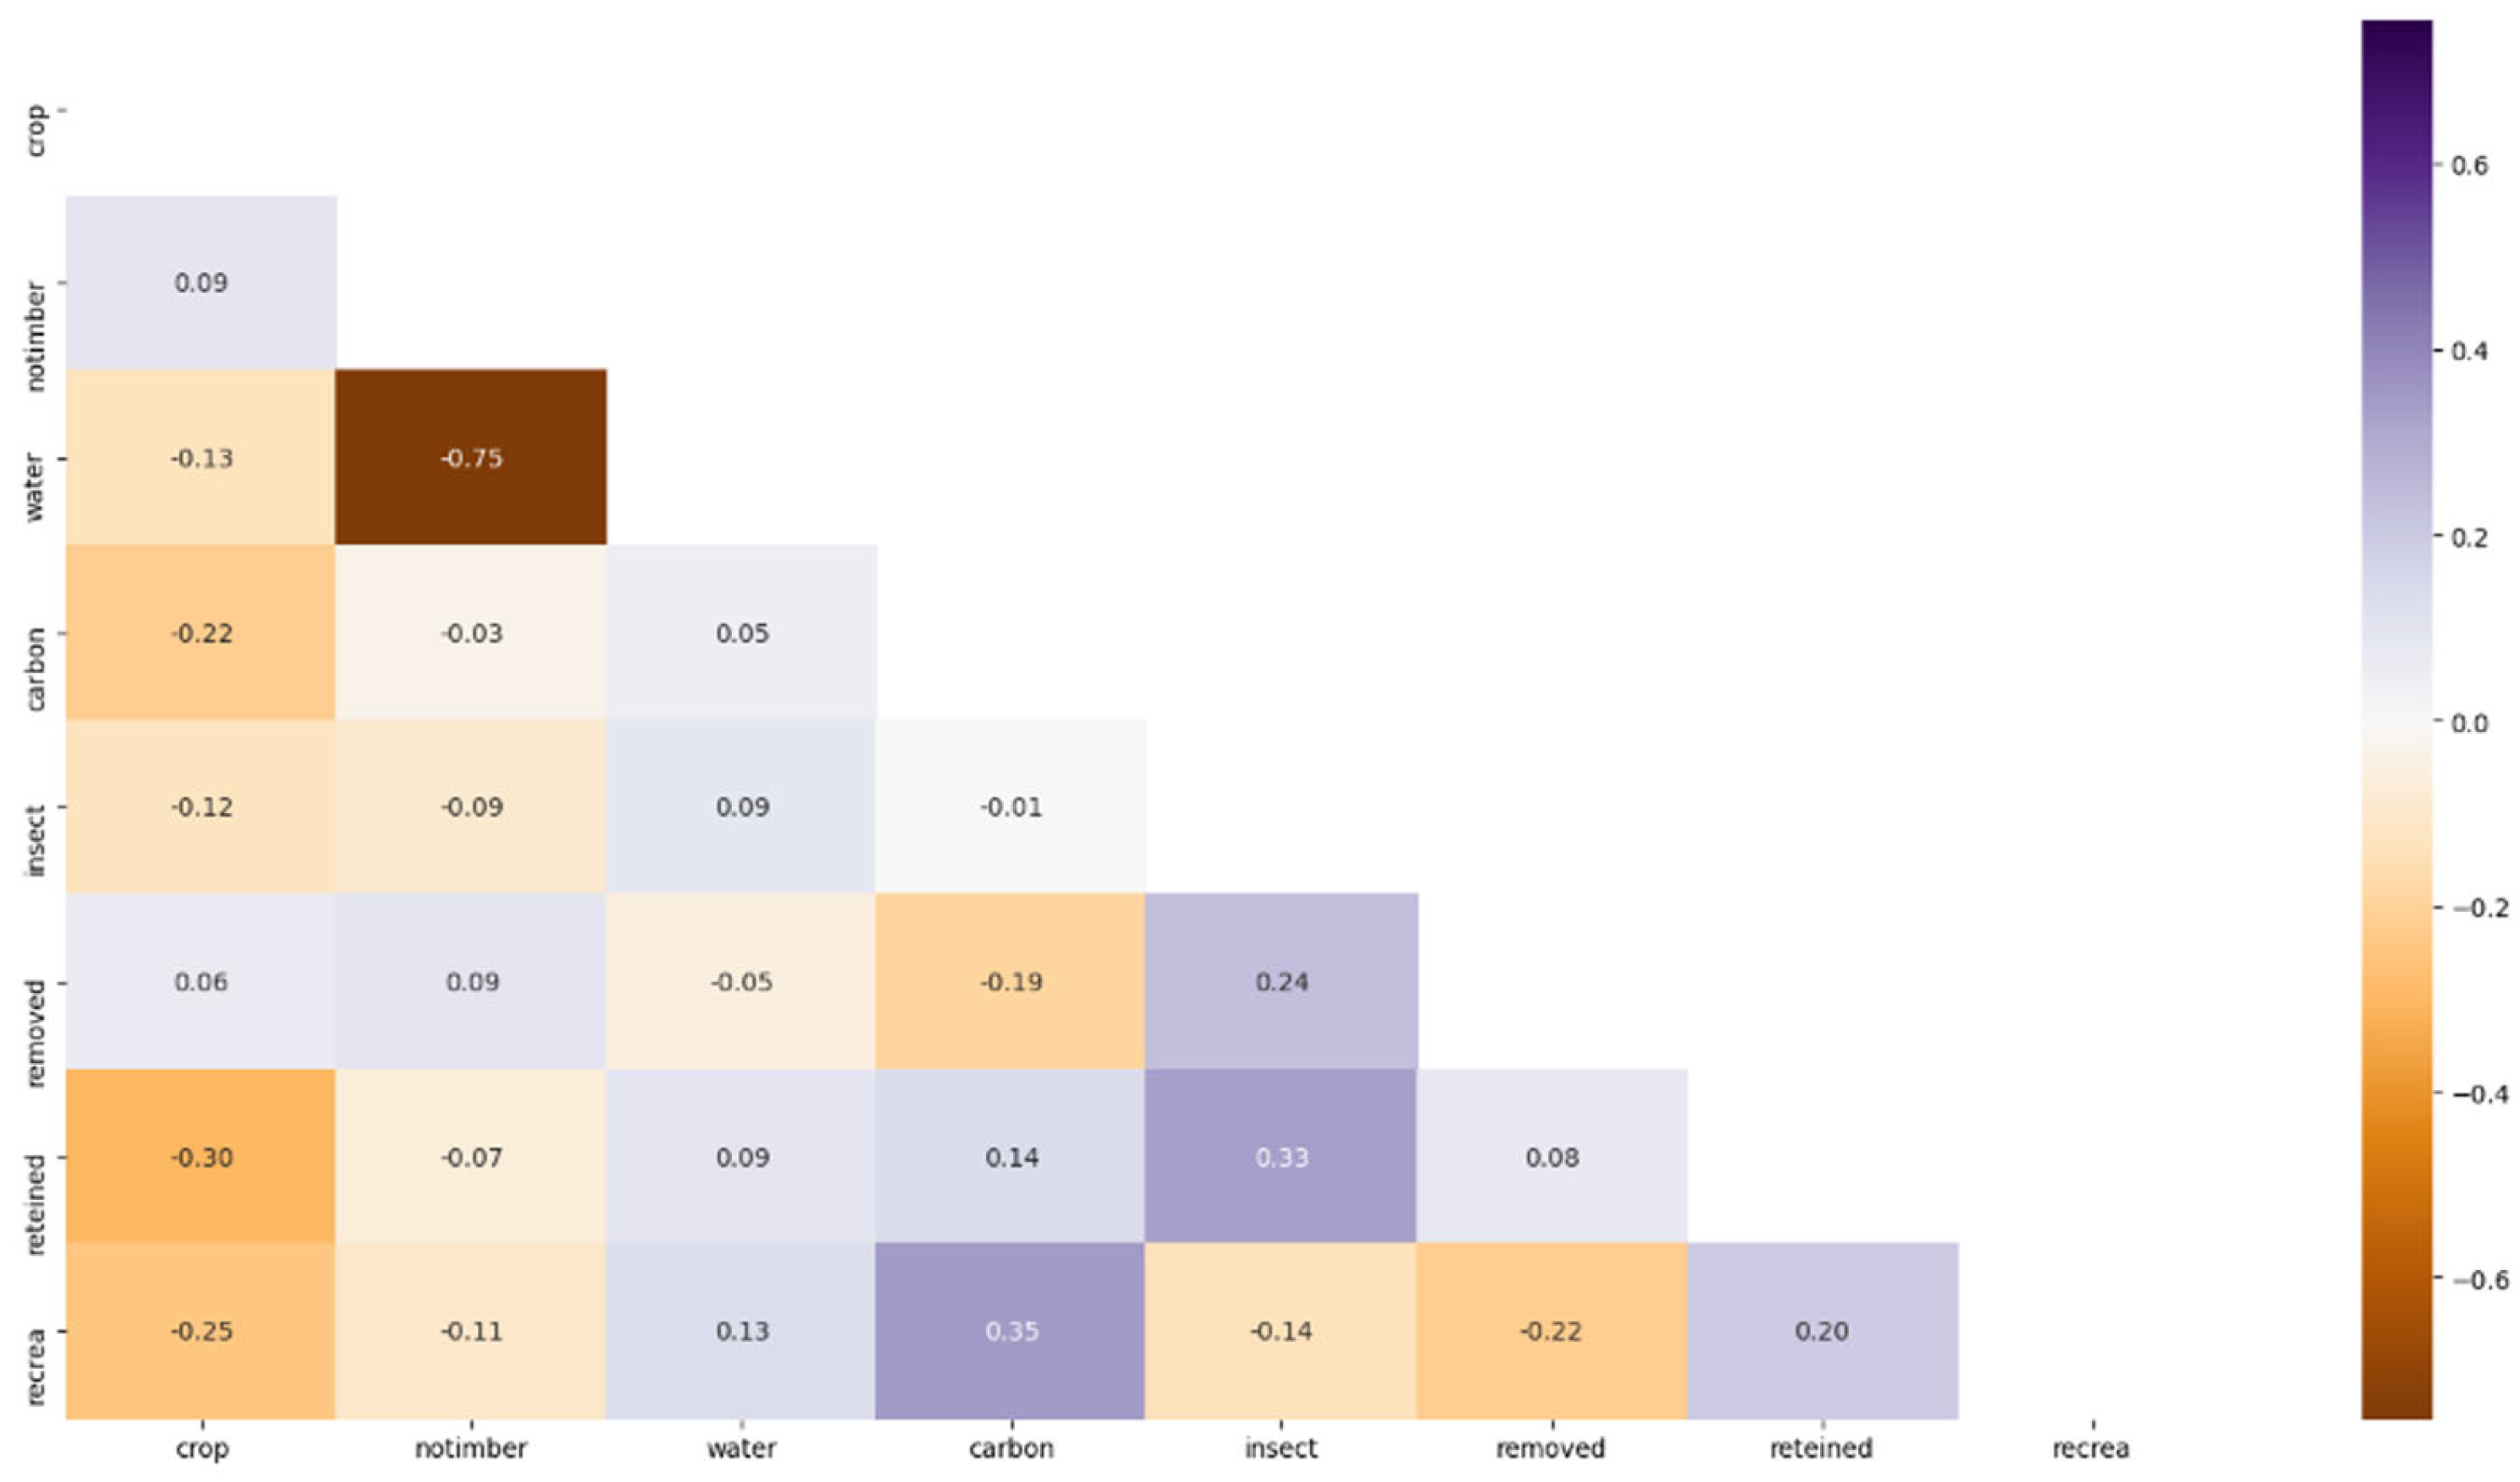
2.3.1. Exploratory Data Analysis
2.3.2. Principal Component Analysis
2.3.3. Similarity Test
3. Results
3.1. Exploratory Data Analysis: Ecosystem Services Maps of Guerrero State
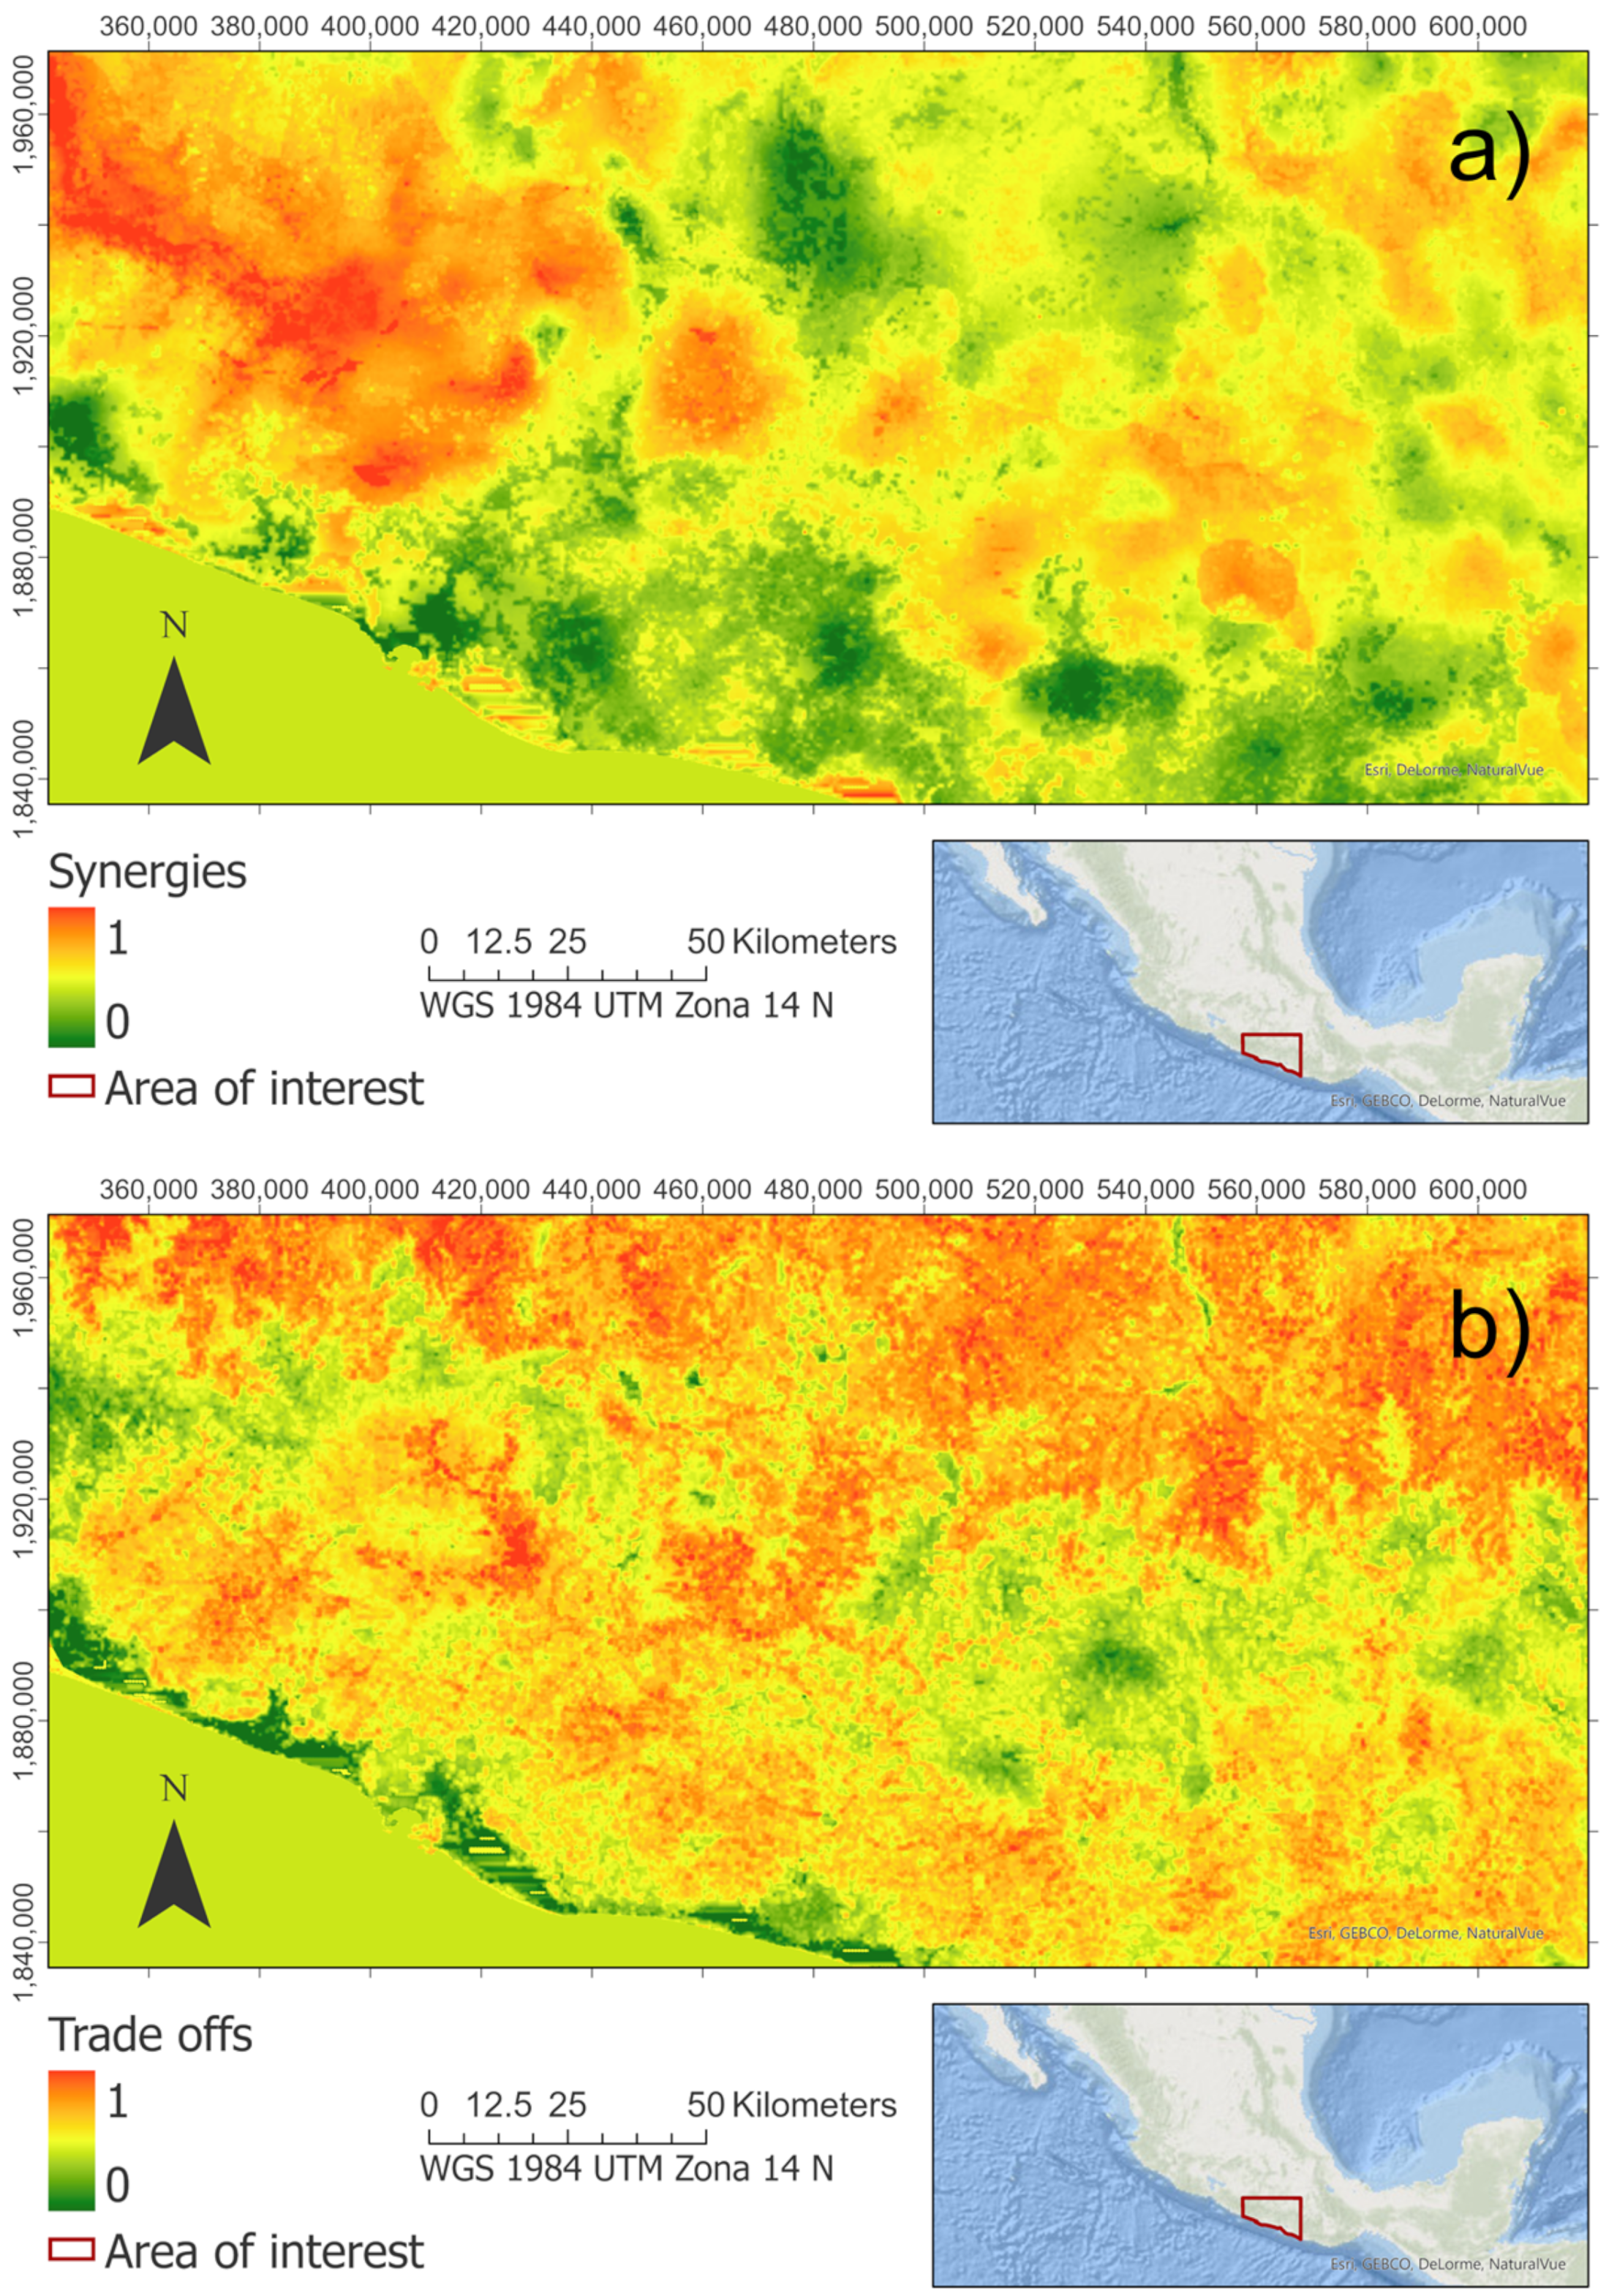
3.2. Principal Component Analysis
3.3. Analysis of Similarities
4. Discussion
5. Conclusions
Author Contributions
Funding
Institutional Review Board Statement
Informed Consent Statement
Conflicts of Interest
References
- Keller, E.A.; Blodgett, R.H. Riesgos Naturales. In Procesos de la Tierra como Riesgos, Desastres y Catástrofes; Pearson Prentice-Hall: Madrid, Spain, 2004. [Google Scholar]
- Carrillo-Hidalgo, N.; Gómez, E.G. Desastres naturales y su influencia en el medio ambiente. Rev. Inst. Investig. Fac. Minas Metal. Cienc. Geográficas 2001, 4, 7. [Google Scholar] [CrossRef]
- Rodriguez-Merino, A.; Fernandez-Zamudio, R.; Garcia-Murillo, P. An invasion risk map for non-native aquatic macrophytes of the Iberian Peninsula. An. Jard. Bot. Madr. 2017, 74, 055. [Google Scholar] [CrossRef]
- Ferrer Gijon, M. Deslizamientos, desprendimientos, flujos y avalanchas. In Riesgos Geológicos; I.G.M.E: Madrid, Spain, 1988. [Google Scholar]
- Cruden, D. A suggested method for a landslide summary. Bull. Int. Assoc. Eng. Geol. 1991, 43, 101–110. [Google Scholar]
- Islam, M.; Yamaguchi, R.; Sugiawan, Y.; Managi, S. Valuing natural capital and ecosystem services: A literature review. Sustain. Sci. 2019, 14, 159–174. [Google Scholar] [CrossRef]
- Watson Robert, T.; Zakri, A.H. Overview of the millennium ecosystem assessment. In Global Millennium Ecosystem Assessment Reports; Island Press: Washington, DC, USA, 2005. [Google Scholar]
- Wolloch, N. Adam Smith and the concept of natural capital. Ecosyst. Serv. 2020, 43, 101097. [Google Scholar] [CrossRef]
- Maes, J.; Egoh, B.; Willemen, L.; Liquete, C.; Vihervaara, P.; Schägner, J.P.; Grizzetti, B.; Drakou, E.G.; La Notte, A.; Zulian, G. Mapping ecosystem services for policy support and decision making in the European Union. Ecosyst. Serv. 2012, 1, 31–39. [Google Scholar] [CrossRef]
- Qiu, L.; Dong, Y.; Liu, H. Integrating Ecosystem Services into Planning Practice: Situation, Challenges and Inspirations. Land 2022, 11, 545. [Google Scholar] [CrossRef]
- Dang, K.B.; Burkhard, B.; Müller, F.; Dang, V.B. Modelling and mapping natural hazard regulating ecosystem services in Sapa, Lao Cai province, Vietnam. Paddy Water Environ. 2018, 16, 767–781. [Google Scholar] [CrossRef]
- Shoyama, K.; Kamiyama, C.; Morimoto, J.; Ooba, M.; Okuro, T. A review of modeling approaches for ecosystem services assessment in the Asian region. Ecosyst. Serv. 2017, 26, 316–328. [Google Scholar] [CrossRef]
- Wood, M.D.; Kumar, P.; Negandhi, D.; Verma, M. Guidance Manual for the Valuation of Regulating Services; UNEP: Liverpool, UK, 2010. [Google Scholar]
- Grima, N.; Edwards, D.; Edwards, F.; Petley, D.; Fisher, B. Landslides in the Andes: Forests can provide cost-effective landslide regulation services. Sci. Total Environ. 2020, 745, 141128. [Google Scholar] [CrossRef]
- Brander, L.; Tankha, S.; Sovann, C.; Sanadiradze, G.; Zazanashvili, N.; Kharazishvili, D.; Memiadze, N.; Osepashvili, I.; Beruchashvili, G.; Arobelidze, N. Mapping the economic value of landslide regulation by forests. Ecosyst. Serv. 2018, 32, 101–109. [Google Scholar] [CrossRef]
- Band, L.E.; Hwang, T.; Hales, T.; Vose, J.; Ford, C. Ecosystem processes at the watershed scale: Mapping and modeling ecohydrological controls of landslides. Geomorphology 2012, 137, 159–167. [Google Scholar] [CrossRef]
- Guzzetti, F.; Carrara, A.; Cardinali, M.; Reichenbach, P. Landslide hazard evaluation: A review of current techniques and their application in a multi-scale study, Central Italy. Geomorphology 1999, 31, 181–216. [Google Scholar] [CrossRef]
- Michael-Leiba, M.; Baynes, F.; Scott, G.; Granger, K. Quantitative landslide risk assessment of Cairns, Australia. In Landslide Hazard and Risk; John Wiley & Sons Ltd.: Hoboken, NJ, USA, 2005; pp. 621–642. [Google Scholar]
- Dai, F.; Lee, C.; Ngai, Y.Y. Landslide risk assessment and management: An overview. Eng. Geol. 2002, 64, 65–87. [Google Scholar] [CrossRef]
- Li, Z.; Nadim, F.; Huang, H.; Uzielli, M.; Lacasse, S. Quantitative vulnerability estimation for scenario-based landslide hazards. Landslides 2010, 7, 125–134. [Google Scholar] [CrossRef]
- Falcón, R.-G.; Francisco, J. Estudio de Vulnerabilidad de la Ría de Pontevedra Mediante Análisis SIG. Centro Universitario de la Defensa en la Escuela Naval Militar, Universidad de Vigo, Vigo, Spain, October 2017. Available online: http://calderon.cud.uvigo.es/xmlui/handle/123456789/152 (accessed on 15 October 2022).
- Chang, K. Introduction to Geographic Information Systems 9e; McGraw-Hill Education: New York, NY, USA, 2018. [Google Scholar]
- Morales, R. La Migración Jornalera Agrícola en tres Municipios de las Regiones Centro y Montaña del Estado de Guerrero; Universidad Autónoma de Guerrero Chilpancingo: Chilpancingo, Mexico, 1999. [Google Scholar]
- Cerca-Martínez, M. Deformacion y magmatismo Cretacico Tardio-Terciario Temprano en la zona de la Plataforma Guerrero Morelos. Ph.D. Thesis, Universidad Nacional Autonoma de Mexico, Mexico City, Mexico, 2004. [Google Scholar]
- Tovar Cabañas, R.; Jáuregui Díaz, J.A.; Vázquez Espinosa, S.A. Moda, media y mediana de la altura del relieve mexicano. Real. Datos Espac. Rev. Int. Estadística Geogr. 2020, 11, 90–102. [Google Scholar]
- Gallegos, G. La importancia de la comunicación previo y durante un siniestro, el caso de México: Communication importance before and during a sinister Mexico’ s case. Gestión Segur. Salud Trab. 2021, 3, 9–14. [Google Scholar] [CrossRef]
- Bruzon, A.G.; Arrogante-Funes, P.; Arrogante-Funes, F.; Martin-Gonzalez, F.; Novillo, C.J.; Fernandez, R.R.; Vazquez-Jimenez, R.; Alarcon-Paredes, A.; Alonso-Silverio, G.A.; Cantu-Ramirez, C.A.; et al. Landslide Susceptibility Assessment Using an AutoML Framework. Int. J. Environ. Res. Public Health 2021, 18, 10971. [Google Scholar] [CrossRef] [PubMed]
- Arrogante-Funes, P.; Bruzón, A.G.; Arrogante-Funes, F.; Ramos-Bernal, R.N.; Vázquez-Jiménez, R. Integration of vulnerability and hazard factors for landslide risk assessment. Int. J. Environ. Res. Public Health 2021, 18, 11987. [Google Scholar] [CrossRef] [PubMed]
- Remondo, J.; Bonachea, J.; Cendrero, A. A statistical approach to landslide risk modelling at basin scale: From landslide susceptibility to quantitative risk assessment. Landslides 2005, 2, 321–328. [Google Scholar] [CrossRef]
- Lozoya, J.P.; Sarda, R.; Jiménez, J.A. A methodological framework for multi-hazard risk assessment in beaches. Environ. Sci. Policy 2011, 14, 685–696. [Google Scholar] [CrossRef]
- Duraiappah, A.K.; Naeem, S.; Agardy, T.; Ash, N.J.; Cooper, H.D.; Díaz, S.; Faith, D.P.; Mace, G.; McNeely, J.A.; Mooney, H.A. Ecosystems and Human Well-Being: Biodiversity Synthesis; A Report of the Millennium Ecosystem Assessment; World Resources Institute: Washington, DC, USA, 2005. [Google Scholar]
- Villa, F.; Bagstad, K.J.; Voigt, B.; Johnson, G.W.; Portela, R.; Honzák, M.; Batker, D. A methodology for adaptable and robust ecosystem services assessment. PLoS ONE 2014, 9, e91001. [Google Scholar] [CrossRef] [PubMed] [Green Version]
- Chuvieco, E.; Martínez, S.; Román, M.V.; Hantson, S.; Pettinari, M.L. Integration of ecological and socio-economic factors to assess global vulnerability to wildfire. Glob. Ecol. Biogeogr. 2014, 23, 245–258. [Google Scholar] [CrossRef]
- Tian, H.; Chen, G.; Liu, M.; Zhang, C.; Sun, G.; Lu, C.; Xu, X.; Ren, W.; Pan, S.; Chappelka, A. Model estimates of net primary productivity, evapotranspiration, and water use efficiency in the terrestrial ecosystems of the southern United States during 1895–2007. For. Ecol. Manag. 2010, 259, 1311–1327. [Google Scholar] [CrossRef]
- Vallecillo, S.; La Notte, A.; Zulian, G.; Ferrini, S.; Maes, J. Ecosystem services accounts: Valuing the actual flow of nature-based recreation from ecosystems to people. Ecol. Model. 2019, 392, 196–211. [Google Scholar] [CrossRef]
- FAO. Catálogo de Publicaciones de la FAO 2021; FAO: Roma, Italy, 2021. [Google Scholar] [CrossRef]
- Benra, F.; Nahuelhual, L.; Gaglio, M.; Gissi, E.; Aguayo, M.; Jullian, C.; Bonn, A. Ecosystem services tradeoffs arising from non-native tree plantation expansion in southern Chile. Landsc. Urban Plan. 2019, 190, 103589. [Google Scholar] [CrossRef]
- Rodriguez-Sanchez, A.; Tomasek, A.; McMillan, S.; Yufra, S.; Yupanqui, M.; Rondon, R.; Hoagland, L. Composition and potential functional roles of soil fungal communities on arid farms in Arequipa (Southern Peru) characterized using SMRT sequencing. Appl. Soil Ecol. 2022, 169, 104228. [Google Scholar] [CrossRef]
- Yu, B.; Rosewell, C. Technical notes: A robust estimator of the R-factor for the universal soil loss equation. Trans. ASAE 1996, 39, 559–561. [Google Scholar] [CrossRef]
- Ricketts, T.H.; Regetz, J.; Steffan-Dewenter, I.; Cunningham, S.A.; Kremen, C.; Bogdanski, A.; Gemmill-Herren, B.; Greenleaf, S.S.; Klein, A.M.; Mayfield, M.M. Landscape effects on crop pollination services: Are there general patterns? Ecol. Lett. 2008, 11, 499–515. [Google Scholar] [CrossRef] [PubMed]
- Kremen, C.; Williams, N.M.; Aizen, M.A.; Gemmill-Herren, B.; LeBuhn, G.; Minckley, R.; Packer, L.; Potts, S.G.; Roulston, T.A.; Steffan-Dewenter, I. Pollination and other ecosystem services produced by mobile organisms: A conceptual framework for the effects of land-use change. Ecol. Lett. 2007, 10, 299–314. [Google Scholar] [CrossRef] [PubMed]
- Zulian, G.; Paracchini, M.L.; Maes, J.; Liquete, C. ESTIMAP: Ecosystem Services Mapping at European Scale; Publications Office of the European Union: Luxembourg, 2013. [Google Scholar]
- Santos-Martín, F.; Zorrilla-Miras, P.; Palomo, I.; Montes, C.; Benayas, J.; Maes, J. Protecting nature is necessary but not sufficient for conserving ecosystem services: A comprehensive assessment along a gradient of land-use intensity in Spain. Ecosyst. Serv. 2019, 35, 43–51. [Google Scholar] [CrossRef]
- Grinstein, U.M.F.G.G.; Wierse, A. Information Visualization in Data Mining and Knowledge Discovery; Morgan Kaufmann: San Francisco, CA, USA, 2002. [Google Scholar]
- Andrienko, N.; Andrienko, G. Exploratory Analysis of Spatial and Temporal Data: A Systematic Approach; Springer Science & Business Media: New York, NY, USA, 2006. [Google Scholar]
- Román, M.O.; Gatebe, C.K.; Schaaf, C.B.; Poudyal, R.; Wang, Z.; King, M.D. Variability in surface BRDF at different spatial scales (30 m–500 m) over a mixed agricultural landscape as retrieved from airborne and satellite spectral measurements. Remote Sens. Environ. 2011, 115, 2184–2203. [Google Scholar] [CrossRef] [Green Version]
- Olguín, G.E.M.; De Jesús, Y.L. Métricas de similaridad y evaluación para sistemas de recomendación de filtrado colaborativo. Rev. Investig. Tecnol. Inf. RITI 2019, 7, 224–240. [Google Scholar]
- Singh, D.; Singh, B. Investigating the impact of data normalization on classification performance. Appl. Soft Comput. 2020, 97, 105524. [Google Scholar] [CrossRef]
- Cao, X.H.; Stojkovic, I.; Obradovic, Z. A robust data scaling algorithm to improve classification accuracies in biomedical data. BMC Bioinform. 2016, 17, 1–10. [Google Scholar] [CrossRef] [PubMed] [Green Version]
- Pedregosa, F.; Varoquaux, G.; Gramfort, A.; Michel, V.; Thirion, B.; Grisel, O.; Blondel, M.; Prettenhofer, P.; Weiss, R.; Dubourg, V.; et al. Scikit-learn: Machine learning in Python. J. Mach. Learn. Res. 2011, 12, 5. [Google Scholar]
- Ferrero, S.; Palacio, M.; Campanella, O. Análisis de componentes principales en teledetección. Consideraciones estadísticas para optimizar su interpretación. Rev. Teledetec. 2002, 17, 43. [Google Scholar]
- Ringnér, M. What is principal component analysis? Nat. Biotechnol. 2008, 26, 303–304. [Google Scholar] [CrossRef] [PubMed]
- Bartlett, M.S. The effect of standardization on a χ2 approximation in factor analysis. Biometrika 1951, 38, 337–344. [Google Scholar] [CrossRef]
- Dziuban, C.D.; Shirkey, E.C. When is a correlation matrix appropriate for factor analysis? Some decision rules. Psychol. Bull. 1974, 81, 358. [Google Scholar] [CrossRef]
- Trizano-Hermosilla, I.; Alvarado, J.M. Best alternatives to Cronbach’s alpha reliability in realistic conditions: Congeneric and asymmetrical measurements. Front. Psychol. 2016, 7, 769. [Google Scholar] [CrossRef] [PubMed] [Green Version]
- Han, J.C.; Zhang, Z.; Cao, J. Developing a New Method to Identify Flowering Dynamics of Rapeseed Using Landsat 8 and Sentinel-1/2. Remote Sens. 2021, 13, 105. [Google Scholar] [CrossRef]
- Chuvieco, E.; Aguado, I.; Jurdao, S.; Pettinari, M.L.; Yebra, M.; Salas, J.; Hantson, S.; de la Riva, J.; Ibarra, P.; Rodrigues, M. Integrating geospatial information into fire risk assessment. Int. J. Wildland Fire 2012, 23, 606–619. [Google Scholar] [CrossRef]
- Mallick, J.; Alqadhi, S.; Talukdar, S.; Sarkar, S.K.; Roy, S.K.; Ahmed, M. Modelling and mapping of landslide susceptibility regulating potential ecosystem service loss: An experimental research in Saudi Arabia. Geocarto Int. 2022, 1–29. [Google Scholar] [CrossRef]
- Munns, W.R., Jr.; Poulsen, V.; Gala, W.R.; Marshall, S.J.; Rea, A.W.; Sorensen, M.T.; von Stackelberg, K. Ecosystem services in risk assessment and management. Integr. Environ. Assess. Manag. 2017, 13, 62–73. [Google Scholar] [CrossRef] [PubMed]
- Munns, W.R., Jr.; Rea, A.W.; Suter, G.W.; Martin, L.; Blake-Hedges, L.; Crk, T.; Davis, C.; Ferreira, G.; Jordan, S.; Mahoney, M. Ecosystem services as assessment endpoints for ecological risk assessment. Integr. Environ. Assess. Manag. 2016, 12, 522–528. [Google Scholar] [CrossRef] [PubMed]
- Capriolo, A.; Boschetto, R.; Mascolo, R.; Balbi, S.; Villa, F. Biophysical and economic assessment of four ecosystem services for natural capital accounting in Italy. Ecosyst. Serv. 2020, 46, 101207. [Google Scholar] [CrossRef]
- Saha, S.; Sarkar, R.; Roy, J.; Hembram, T.K.; Acharya, S.; Thapa, G.; Drukpa, D. Measuring landslide vulnerability status of Chukha, Bhutan using deep learning algorithms. Sci. Rep. 2021, 11, 16374. [Google Scholar] [CrossRef]
- Alqadhi, S.; Mallick, J.; Talukdar, S.; Ahmed, M.; Khan, R.A.; Sarkar, S.K.; Rahman, A. Assessing the effect of future landslide on ecosystem services in Aqabat Al-Sulbat region, Saudi Arabia. Nat. Hazards 2022, 113, 641–671. [Google Scholar] [CrossRef]
- Häyhä, T.; Franzese, P.P.; Paletto, A.; Fath, B.D. Assessing, valuing, and mapping ecosystem services in Alpine forests. Ecosyst. Serv. 2015, 14, 12–23. [Google Scholar] [CrossRef]
- López Alegría, A. Impacto Económico en Servicios Ecosistémicos por Deslizamientos del 2010, en la Reserva de la Biosfera la Mariposa Monarca. Master Thesis, Instituto de Investigaciones en Ciencias de la Tierra. Universidad Michoacana de San Nicolás de Hidalgo, Morelia, México, November 2020. Available online: http://bibliotecavirtual.dgb.umich.mx:8083/xmlui/handle/DGB_UMICH/4446 (accessed on 15 October 2022).
- Álvarez-Vargas, F.J.; Castaño, M.A.V.; Restrepo, C. Demand for Ecosystem Services Drive Large-Scale Shifts in Land-Use in Tropical Mountainous Watersheds Prone to Landslides. Remote Sens. 2022, 14, 3097. [Google Scholar] [CrossRef]
- Bennett, E.M.; Peterson, G.D.; Gordon, L.J. Understanding relationships among multiple ecosystem services. Ecol. Lett. 2009, 12, 1394–1404. [Google Scholar] [CrossRef] [PubMed]
- Balbi, S.; Bagstad, K.J.; Magrach, A.; Sanz, M.J.; Aguilar-Amuchastegui, N.; Giupponi, C.; Villa, F. The global environmental agenda urgently needs a semantic web of knowledge. Environ. Evid. 2022, 11, 5. [Google Scholar] [CrossRef]
- Nakagawa, S.; Dunn, A.; Lagisz, M.; Bannach-Brown, A.; Grames, E.; Sánchez-Tójar, A.; Haddaway, N. Un nuevo ecosistema para la síntesis de evidencia. Nat. Ecol. Evol. 2020, 4, 4. [Google Scholar]


| Number of PCA | 1 | 2 |
|---|---|---|
| Explicability | 0.41 | 0.31 |
| Eigenvectors | 194.46 | 146.88 |
| Input layer | Synergies | Trade-offs |
| Organic carbon mass | 0.35 | −0.38 |
| Crop production | −0.36 | 0.34 |
| Occurrence of pollinator insects | 0.13 | 0.47 |
| Value of non-wood forest products | −0.47 | −0.24 |
| Potential value of outdoor recreation | 0.39 | −0.35 |
| Potential removed soil mass | −0.25 | 0.50 |
| Retained soil mass caused by vegetation | 0.29 | 0.28 |
| Value of water from the forest | 0.46 | 0.34 |
| First Characteristic | Second Characteristic | Cosine Similarity Metric |
|---|---|---|
| Synergies | Synergies | 1 |
| Trade-offs | Synergies | −0.0003 |
| Landslide Susceptibility | Synergies | 0.3587 |
| Landslide Vulnerability | Synergies | 0.0333 |
| Landslide Susceptibility | Trade-offs | −0.0108 |
| Landslide Vulnerability | Trade-offs | −0.1955 |
| Landslide Vulnerability | Landslide Susceptibility | 0.0786 |
Publisher’s Note: MDPI stays neutral with regard to jurisdictional claims in published maps and institutional affiliations. |
© 2022 by the authors. Licensee MDPI, Basel, Switzerland. This article is an open access article distributed under the terms and conditions of the Creative Commons Attribution (CC BY) license (https://creativecommons.org/licenses/by/4.0/).
Share and Cite
Arrogante-Funes, P.; Bruzón, A.G.; Arrogante-Funes, F.; Cantero, A.M.; Álvarez-Ripado, A.; Vázquez-Jiménez, R.; Ramos-Bernal, R.N. Ecosystem Services Assessment for Their Integration in the Analysis of Landslide Risk. Appl. Sci. 2022, 12, 12173. https://0-doi-org.brum.beds.ac.uk/10.3390/app122312173
Arrogante-Funes P, Bruzón AG, Arrogante-Funes F, Cantero AM, Álvarez-Ripado A, Vázquez-Jiménez R, Ramos-Bernal RN. Ecosystem Services Assessment for Their Integration in the Analysis of Landslide Risk. Applied Sciences. 2022; 12(23):12173. https://0-doi-org.brum.beds.ac.uk/10.3390/app122312173
Chicago/Turabian StyleArrogante-Funes, Patricia, Adrián G. Bruzón, Fátima Arrogante-Funes, Ana María Cantero, Ariadna Álvarez-Ripado, René Vázquez-Jiménez, and Rocío N. Ramos-Bernal. 2022. "Ecosystem Services Assessment for Their Integration in the Analysis of Landslide Risk" Applied Sciences 12, no. 23: 12173. https://0-doi-org.brum.beds.ac.uk/10.3390/app122312173