Article

On the Mechanism of Electron Beam Radiation-Induced Modification of Poly(lactic acid) for Applications in Biodegradable Food Packaging

by
Eleanor C. Grosvenor
1,
Justin C. Hughes
1,
Cade W. Stanfield
1,
Robert L. Blanchard
1,
Andrea C. Fox
1,
Olivia L. Mihok
1,
Kristen Lee
1,
Jonathan R. Brodsky
1,
Ann Hoy
1,
Ananya Uniyal
1,
Sydney M. Whitaker
1,
Chris Acha
1,
Kalina Gibson
1,
Lilly Ding
1,
Catherine A. Lewis
2,
Lorelis González López
2,
Charlotte M. Wentz
3,
Lawrence R. Sita
3 and
Mohamad Al-Sheikhly
2,*
1
Gemstone Honors Program, University of Maryland, College Park, MD 20742, USA
2
Department of Materials Science and Engineering, University of Maryland, College Park, MD 20742, USA
3
Department of Chemistry and Biochemistry, University of Maryland, College Park, MD 20742, USA
*
Author to whom correspondence should be addressed.
Submission received: 4 November 2021 / Revised: 26 January 2022 / Accepted: 28 January 2022 / Published: 10 February 2022
(This article belongs to the Special Issue Applied Radiation Chemistry: Theory, Methods and Applications)

Abstract

:

Featured Application

Electron beam radiation induces C-O-C bond scissions on the backbone of the amorphous poly(lactic acid) (PLA) used for food packaging. The radiolytically produced alkoxyl radicals abstract hydrogen atoms from the neighboring PLA molecules, leading to the formation of carbon-centered radicals. Since all PLA samples were exposed to air after irradiation and electron paramagnetic resonance (EPR) measurements, the carbon-centered radicals react with oxygen to form the corresponding peroxyl radicals. The resultant PLA is suitable for food irradiation and is biodegradable after the packaging is discarded. The radiation of sterilization has no detrimental effect on the water vapor diffusion through the PLA membrane.

Abstract

Poly(lactic acid) (PLA) is a biodegradable polymer used for food packaging. The effects of electron beam radiation on the chemical and physical properties of amorphous PLA were studied. In this study, amorphous, racemic PLA was irradiated at doses of 5, 10, 15, and 20 kGy in the absence of oxygen. Utilizing electron paramagnetic resonance spectrometry, it was found that alkoxyl radicals are initially formed as a result of C-O-C bond scissions on the backbone of the PLA. The dominant radiation mechanism was determined to be H-abstraction by alkoxyl radicals to form C-centered radicals. The C-centered radicals undergo a subsequent peroxidation reaction with oxygen. The gel permeation chromatography (GPC) results indicate reduction in polymer molecular mass. The differential scanning calorimetry and X-ray diffraction results showed a subtle increase in crystallinity of the irradiated PLA. Water vapor transmission rates were unaffected by irradiation. In conclusion, these results support that irradiated PLA is a suitable material for applications in irradiation of food packaging, including food sterilization and biodegradation.

1. Introduction

Every year, 1.3 billion tons of food are wasted globally [1,2]. This figure corresponds to almost one third of all food produced for humans [2]. In theory, global food production can provide for every living person, indicating that ineffective food distribution systems are substantial contributors to world hunger [3]. According to the United States Department of Agriculture, 31 percent of U.S. food supply at the retail and consumer levels is wasted [4]. Of the United States’ total food waste, packaging accounts for 29.5% of municipal solid waste, suggesting that a more efficient material for the transport and storage of foods may contribute to less food wasted [5]. Simultaneously, our waste management systems face an overwhelming influx of discarded plastic products [6]. Even so-called recyclable materials have a limited number of cycles before they undergo phase separation and become unusable, meaning that recycling is not an effective solution to plastic waste [7].
A solution to both food spoilage and plastic waste is a biodegradable polymer that extends the shelf life of produce through selective permeability of the membrane. Currently, finding an appropriate bio-based polymer can be rather challenging because they are typically hydrophilic in nature, leading to high water vapor transmission rates [8,9]. The concentrations of oxygen gas and water vapor must remain low to prevent spoilage due to oxidation [10,11]. Within the localized packaging environment, a modified, carbon dioxide-rich environment is necessary to preserve food and delay rancidity [12,13,14]. Carbon dioxide maintains a low pH, which decreases microbe growth [12,13,14].
A polymer capable of the aforementioned tasks is poly(lactic acid) (PLA). PLA is a polyester that is classified as Generally Recognized as Safe (known as GRAS) by the U.S. Food and Drug Administration [15]. Commercial synthesis of PLA via the condensation of lactic acid is an environmentally friendly, inexpensive, and energy efficient process [16,17,18,19,20,21]. For these reasons, PLA has been established as a viable biodegradable polymer for food packaging applications [22,23,24,25,26,27]. PLA has two naturally occurring stereoregular forms, PDLA and PLLA [28]. A great deal of current research is focused on characterizing these forms with techniques such as nuclear magnetic resonance [29]. A racemic mixture of PLA leads to an amorphous polymeric structure [28]. The water vapor permeability of the racemic PLA is 14–23% lower than for the homopolymers, making racemic PLA an ideal choice for food packaging applications [30]. Moreover, dipole–dipole interaction and hydrogen bonding between the two stereoregular forms lead to a stronger, denser material with improved thermal stability [30].
Food packaging is inextricably linked to radiation in multiple ways. First, ionizing radiation is already utilized as a safe method of extending shelf life and ensuring the safety of food products [31]. Food is irradiated inside its packaging once it is ready for retail, and this process serves several purposes including the delay of sprouting and ripening, reduction of spoilage-causing organisms, control of insects, and the prevention of foodborne illness through elimination of pathogenic bacteria [31,32]. Electron beam radiation for the treatment of fruits and vegetables is typically achieved with doses up to 10 kGy [31]. After the consumer has discarded the food packaging, radiation is used to enhance the slow biodegradation rate of PLA [33].
Elucidating the radiation chemistry mechanism of PLA via identification of the radiolytically produced free radicals and their decay will further the understanding of the physical properties, permeability, and biodegradability of PLA. It is expected that radiation-induced C-O-C bond scissions in the PLA will occur under the radiation conditions used in this work.
Previous research showed that the molar mass of PLA decreased when irradiated at 25 °C compared to an increase in molar mass at 80 °C and 170 °C [34]. Malinowski states that crosslinking of PLA is optimized at a dose of 40–200 kGy and 3–5 wt% triallyl isocyanurate (TAIC) additive [35]. Chain scission is the primary reaction when neat PLA is irradiated from 1–100 kGy [36]. As a result of irradiation, the gel fractions were between 0.5% and 0.9%, the heat of fusion increased, and the glass transition temperature decreased slightly, all indicating the presence of chain scission and a reduction in molar mass [36]. The chain scission occurs predominantly at the C-O-C bonds on the backbone of the PLA chain [37,38].
Electron beam radiation in the range of 1 to 30 kGy in the presence of oxygen prompts PLA degradation; a decrease was seen in the molar mass, tensile strength, break elongation and elastic modulus, and water vapor permeability of the polymer [39]. Another group found that electron beam irradiation at doses below 25 kGy did not cause any changes in the mechanical properties of PLA [40]. PLA has a resistance to radiation treatment that adds to its potential for applications in food packaging [40]. Another group observed that the degree of crystallinity for poly-L-lactic acid increased with dose up until 50 kGy [33]. Overall, the previous literature shows varied results depending on the irradiation conditions. For the scope of this research, samples were irradiated at doses of 5, 10, 15, and 20 kGy in the absence of oxygen.

2. Materials and Methods

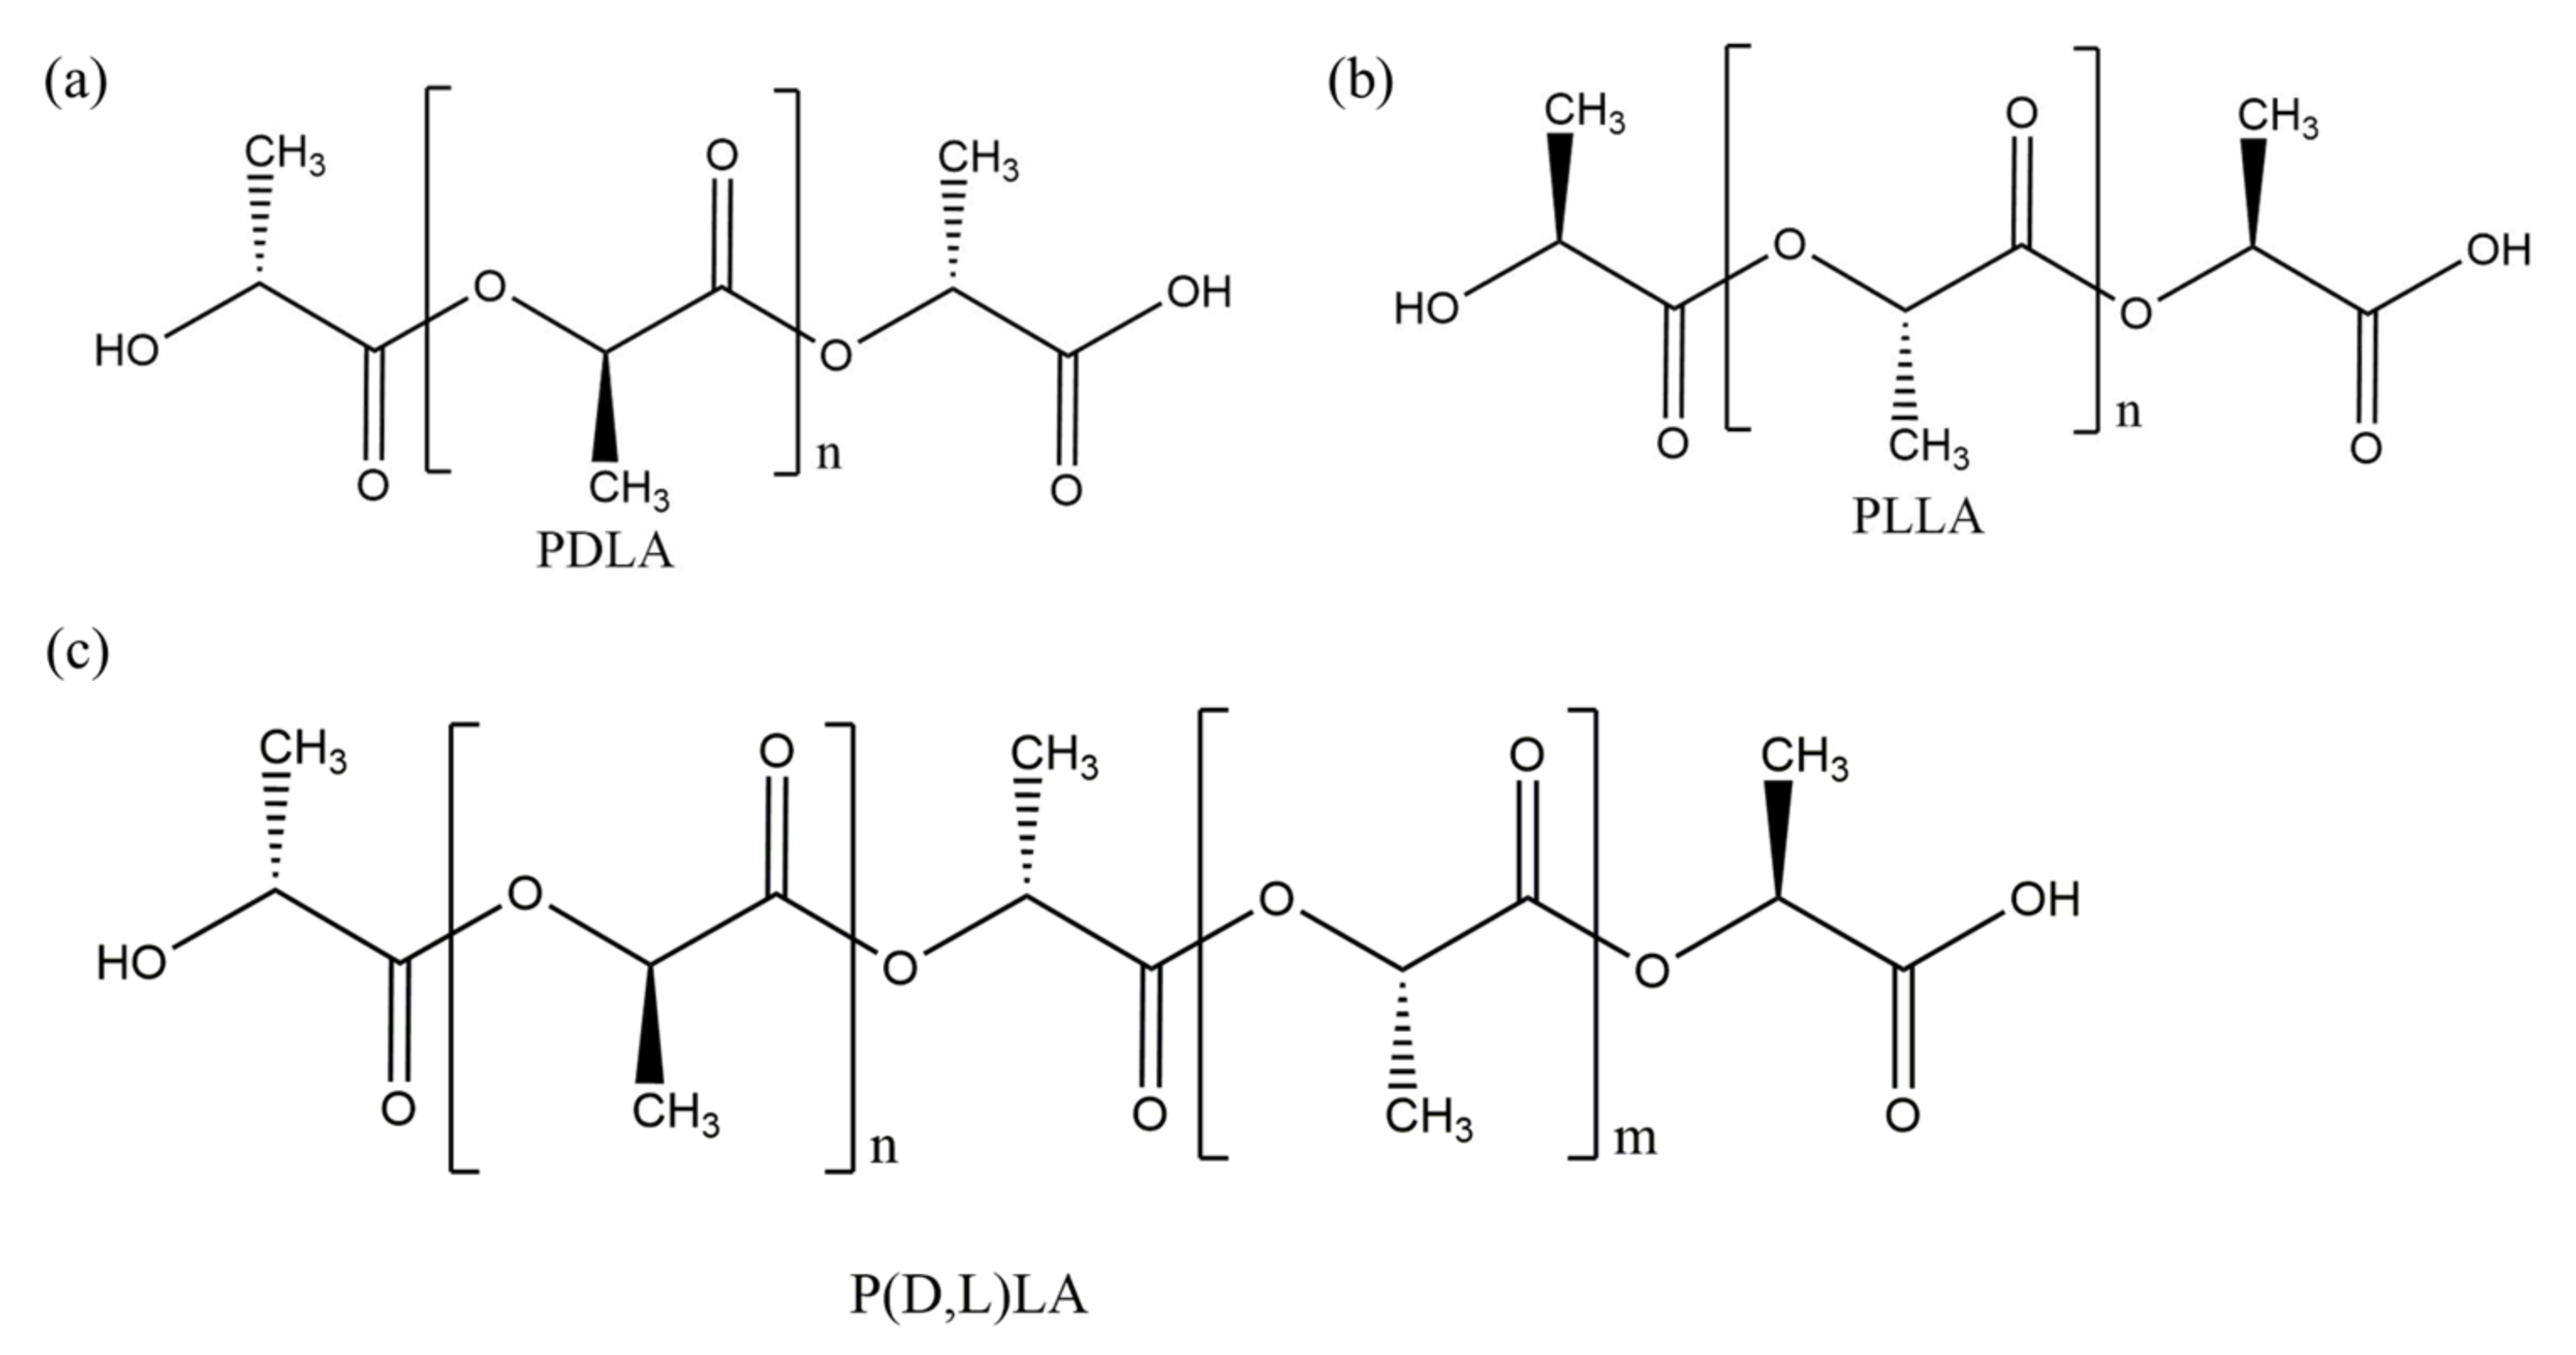
2.1. Background on Material Used in Experimentation

A commercial-grade sheet of polylactic acid was graciously donated by Ex-Tech Plastics. The PLA sheets were approximately 25.4 cm × 20.3 cm with a thickness of 0.0304 cm. The material was identified and characterized as received using optical microscopy (Olympus BX40 microscope, Tokyo, Japan), X-ray diffraction (XRD) (Rigaku Miniflex 600 with D/teX Ultra silicon strip detector, Tokyo, Japan), Fourier transform infrared spectroscopy (FTIR) (Nicolet iS50 FTIR spectrometer, Thermo Scientific, Waltham, MA, USA), differential scanning calorimetry (DSC) (DSC Q100, TA Instruments, New Castle, DE, USA), and gel permeation chromatography (GPC)(VE 2001 GPCMax, Viscotek, Houston, TX, USA). The L and D composition of the amorphous PLA was determined to be racemic after analysis of optical microscope images. We used XRD to confirm that we had highly amorphous PLA, as shown in Figure 1 by the two wide peaks and no sharp peak corresponding to a crystalline phase. We explain these results in detail in Section 3.5. We subsequently performed GPC and obtained a number average molar mass (Mn) of 119,500 Da, weight average molar mass (Mw) of 196,400 Da, and polydispersity index of 1.646 for the unirradiated PLA samples. As shown in Figure 1, DSC results demonstrated that the material is not a stereocomplex, but rather a copolymer of P(DL)LA with equal proportions of L and D subunits. The double melting peak due to stereocomplexation would occur at a higher temperature than we observed, indicating that the double peak in our DSC results can be attributed to perfected spherulites. We expand on this analysis in Section 3.3. PLA without plasticizers and additives is used, as confirmed by FTIR spectral analysis on unirradiated PLA, shown in Figure 1 and analyzed in Section 3.2.

2.2. Optical Microscopy

Optical microscopy was utilized to determine the L and D composition of the PLA. Microscope images were taken on the Olympus BX40 microscope (Japan), both with and without polarized light. The objectives used were 4×, 10×, and 40×. Prior to optical microscopy, the PLA was spin coated to prepare a thin polymer film. The PLA samples were dissolved in dimethyl sulfoxide at a concentration of 8 mg/mL. The spin coater was run for 30 s at 3000 rpm to deposit the solution onto a silicon wafer.

2.3. Sample Preparation and Irradiation

The sheets of PLA were cleaned with deionized water and cut into two different-sized pieces for sample treatment, the smaller being 52 mm × 4 mm and the larger being 52 mm × 16 mm. The 52 mm × 4 mm sample was used for electron paramagnetic resonance (EPR) characterization, while the 52 mm × 16 mm sample was divided between FTIR and water vapor transmission rate (WVTR) testing. FTIR is a non-destructive test, and it was performed before the WVTR tests. Each pair of small and large PLA strips was placed into an individual 40 mL septum vial and purged at 7 psi for 20 min with inert gas, which was either nitrogen or argon. These septum vials were then sealed with parafilm prior to irradiation.
Irradiation was conducted at the Medical Industrial Radiation Facility at the National Institutes of Standards and Technology Physical Measurement Laboratory using a Sagattaire traveling-wave electron linear accelerator. The pulse width was maintained at 6 µs with a pulse repetition of 100 pulses/s and an energy of 11.5 MeV. The samples were irradiated to a total dose of 5, 10, 15, and 20 kGy and at an average dose rate of 68 kGy/h. Dosimetry was conducted using strips of alanine placed in the path of the electron beam. Samples were placed on a foam block 100 cm from the exit beam. The electron beam was run at room temperature. Once irradiated, the samples were kept on dry ice in the absence of oxygen prior to transfer from septum vials to EPR tubes for subsequent EPR analysis. This sample transfer was conducted in a glove box purged with nitrogen at 7 psi.

2.4. Radical Structure and Concentration Decay Characterization Using Electron Paramagnetic Resonance (EPR) Spectrometry

2,2-diphenyl-1-picrylhydrazyl (DPPH) was used to calibrate the frequencies from the microwave generator, and EPR measurements were taken for each of the irradiated samples. DPPH was chosen as it contains a stable free radical which is possible through stabilization provided by the three rings in its structure. The following instrument parameters were used: microwave power of 5 mW, frequency modulation of 100 kHz, modulation amplitude of 3.12 G, receiver gain of 6.32 × 10³, center field at 3500 G, sweep width of 1000 G, conversion time of 40.96 ms, and time constant of 20.48. The parameters were selected to avoid overmodulation or signal distortion, and four sweeps over the magnetic field spectrum were conducted for each sample to maintain a high level of signal resolution. The expected number of hyperfines for an EPR spectrum can be described by Equation (1):
number of hyperfines = Π 2 n i I i + 1
where ni denotes the number of equivalent nuclei and Ii denotes the nuclear spin of the equivalent nuclei. The concentration of radicals in spins per gram was determined from Equation (2):
x = s t d A x R x s c a n x 2 G s t d M s t d g s t d 2 [ s s + 1 ] s t d A s t d R s t d s c a n s t d 2 G x M x g x 2 s s + 1 x
where [x] denotes radical concentration, Ax denotes the double integral of the EPR first derivative curve, scanx denotes the magnetic field sweep width in gauss, G is the gain of the signal amplifier (Hz), M is the modulation amplitude (G), g is the Lande factor, s is the radical spin quantum number, and R is the Kramers degeneracy of the EPR spectrum. The subscript std refers to the parameters measured from the manganese sulfate monohydrate (MnSO4·H2O) standard sample and the subscript x refers to the parameters measured from the experimental samples.

2.5. Bond Structure Characterization via Fourier Transform Infrared Spectroscopy (FTIR)

FTIR spectroscopy was used to measure the oxidation index of the irradiated samples. Infrared spectra of PLA samples were taken on the Thermo Scientific Nicolet iS50 FTIR spectrometer (USA) from 525–4000 cm−1 with a resolution of 4 cm−1 and analyzed via the OMNIC software. An attenuated total reflectance (ATR) accessory, the SmartiTx with diamond, was used. Ninety-six scans at a resolution of 4 cm−1 were performed for each spectrum to obtain averages, and two spectra were taken per sample. Backgrounds were taken every 30 min, and the changes in peaks were analyzed thereafter. All FTIR spectra were normalized to the peak at about 1450 cm−1 corresponding to the C-H stretching in the methyl groups. This was done by dividing the range of absorbance values from 500 to 4000 cm−1 by the absorbance at 1450 cm−1. The C-H stretch at 1450 cm−1 was chosen due to the expected lack of change in C-H bonds in methyl groups as a result of irradiation [41]. FTIR was used to calculate the oxidation index for C-O and C=O bonds. Integrals of the C-O peak at approximately 1100 cm−1, C=O peak at approximately 1750 cm−1, and CH3 peak at approximately 1450 cm−1 were calculated using the Origin8 Software. Oxidation index for the C-O and C=O peaks was found by dividing the integrated area of their respective peaks by the integrated area of the CH3 peak, the reference peak.

2.6. Thermal Analysis Using Differential Scanning Calorimetry (DSC)

DSC analysis was performed on samples of about 5 mg in sealed aluminum pans in a nitrogen atmosphere using a TA Instruments DSC Q100 (USA). The samples were subjected to two heating and cooling cycles. In the first run, the samples equilibrated at 40 °C and then increased to 190 °C. They were held isothermal for five minutes at 190 °C before being cooled back down to 40 °C. The samples were again held isothermal for five minutes at 40 °C before increasing to 190 °C, where they were held isothermal for five minutes. Finally, the samples were cooled to 40 °C. For both heating cycles, the scanning rate was 5 °C min−1. From the resulting thermograms, attempts were made to measure the glass transition temperature (Tg), cold crystallization temperature (Tc), cold crystallization enthalpy (Hc), melting temperature (Tm), and melting enthalpy (Hm). Despite the fact that the unirradiated PLA samples were almost completely amorphous, efforts were made to measure the percent crystallinity (%Xc) using Equation (3) after irradiation in case any crystallization had occurred in the irradiated samples:
% X c = Δ H m Δ H c Δ H ° m   ×   100
where Hm is the experimentally determined melting enthalpy (Jg−1), Hc is the experimentally determined cold crystallization enthalpy (Jg−1), and Hm is the melting enthalpy for 100% crystalline PLLA, stereoregular L-oriented PLA (93 Jg−1) [42].

2.7. Characterization of Crystallinity with X-ray Diffraction (XRD)

XRD diffractograms (Rigaku Miniflex 600 with D/teX Ultra silicon strip detector, Japan) were taken for an unirradiated and a 20 kGy irradiated sample two weeks post-irradiation to confirm equilibrium crystallinity of the polymer samples. The measurements were conducted using 2θ values between 10° and 90° with a step size of 0.2°, and a Rietveld refinement based on an SI standard was conducted to analyze diffracted peak locations.

2.8. Gel Permeation Chromatography (GPC)

GPC was used to obtain molar mass (Mn and Mw) and polydispersity index (PDI) of PLA films using Viscotek VE 2001 GPCMax (USA) equipped with three columns (Styragel HR-4, HR-3, and HR-1) in a column oven and differential refractometer (maintained at 40 °C). Tetrahydrofuran (HPLC grade) was used as the eluent with a flow rate of 1 mL/min. Polystyrene standards (from Polymer Laboratories Inc., 580 Da–3039 kDa) were used for calibration. For GPC sample preparation, 2–4 mg of dry PLA film sample was dissolved in 2 mL of THF (HPLC grade).

2.9. Water Vapor Transmission Rate (WVTR) Testing

Materials included a 40 mL septum vial, a desiccant (2–5 mm silica beads), fume hood, a balance showing uncertainty to four decimal places (±0.0001 g), adhesive silicone or other water-resistant sealant, and the testing material: a sheet of PLA with a width of 0.0304 cm. The scale used was a New Classic MF model MS105DU, produced by Mettler Toledo. The following methodology is a modified version of ASTM Standard E96: Standard Test Methods for Water Vapor Transmission of Materials [43]. PLA was cut from a sheet to completely cover the surface area of the opening of the 40 mL septum vial. The septum vial was weighed, and the initial weight was recorded. The silica beads were added to the vial and filled to within 1/2 inch of the top of the vial. The weight of the vial with the additional silica beads was measured. The PLA sample was then attached to the top of the vial using the silicone sealant. A continuous layer of sealant was applied to the edges of the top of the vial, and the sample was pressed to the sealant and allowed to dry. The vial was weighed again for the initial testing weight and placed in the test chamber. After initial weighing, the sample was weighed once every day for the following six days. The weight of the vial was plotted over time. WVTR was calculated using Equation (4):
W V T R = G t   ×   A
where G is the weight change in grams, t is time in days, and A is the test area of the vial mouth in meters squared. WVTR is measured in gd−1m−2.

3. Results and Discussion

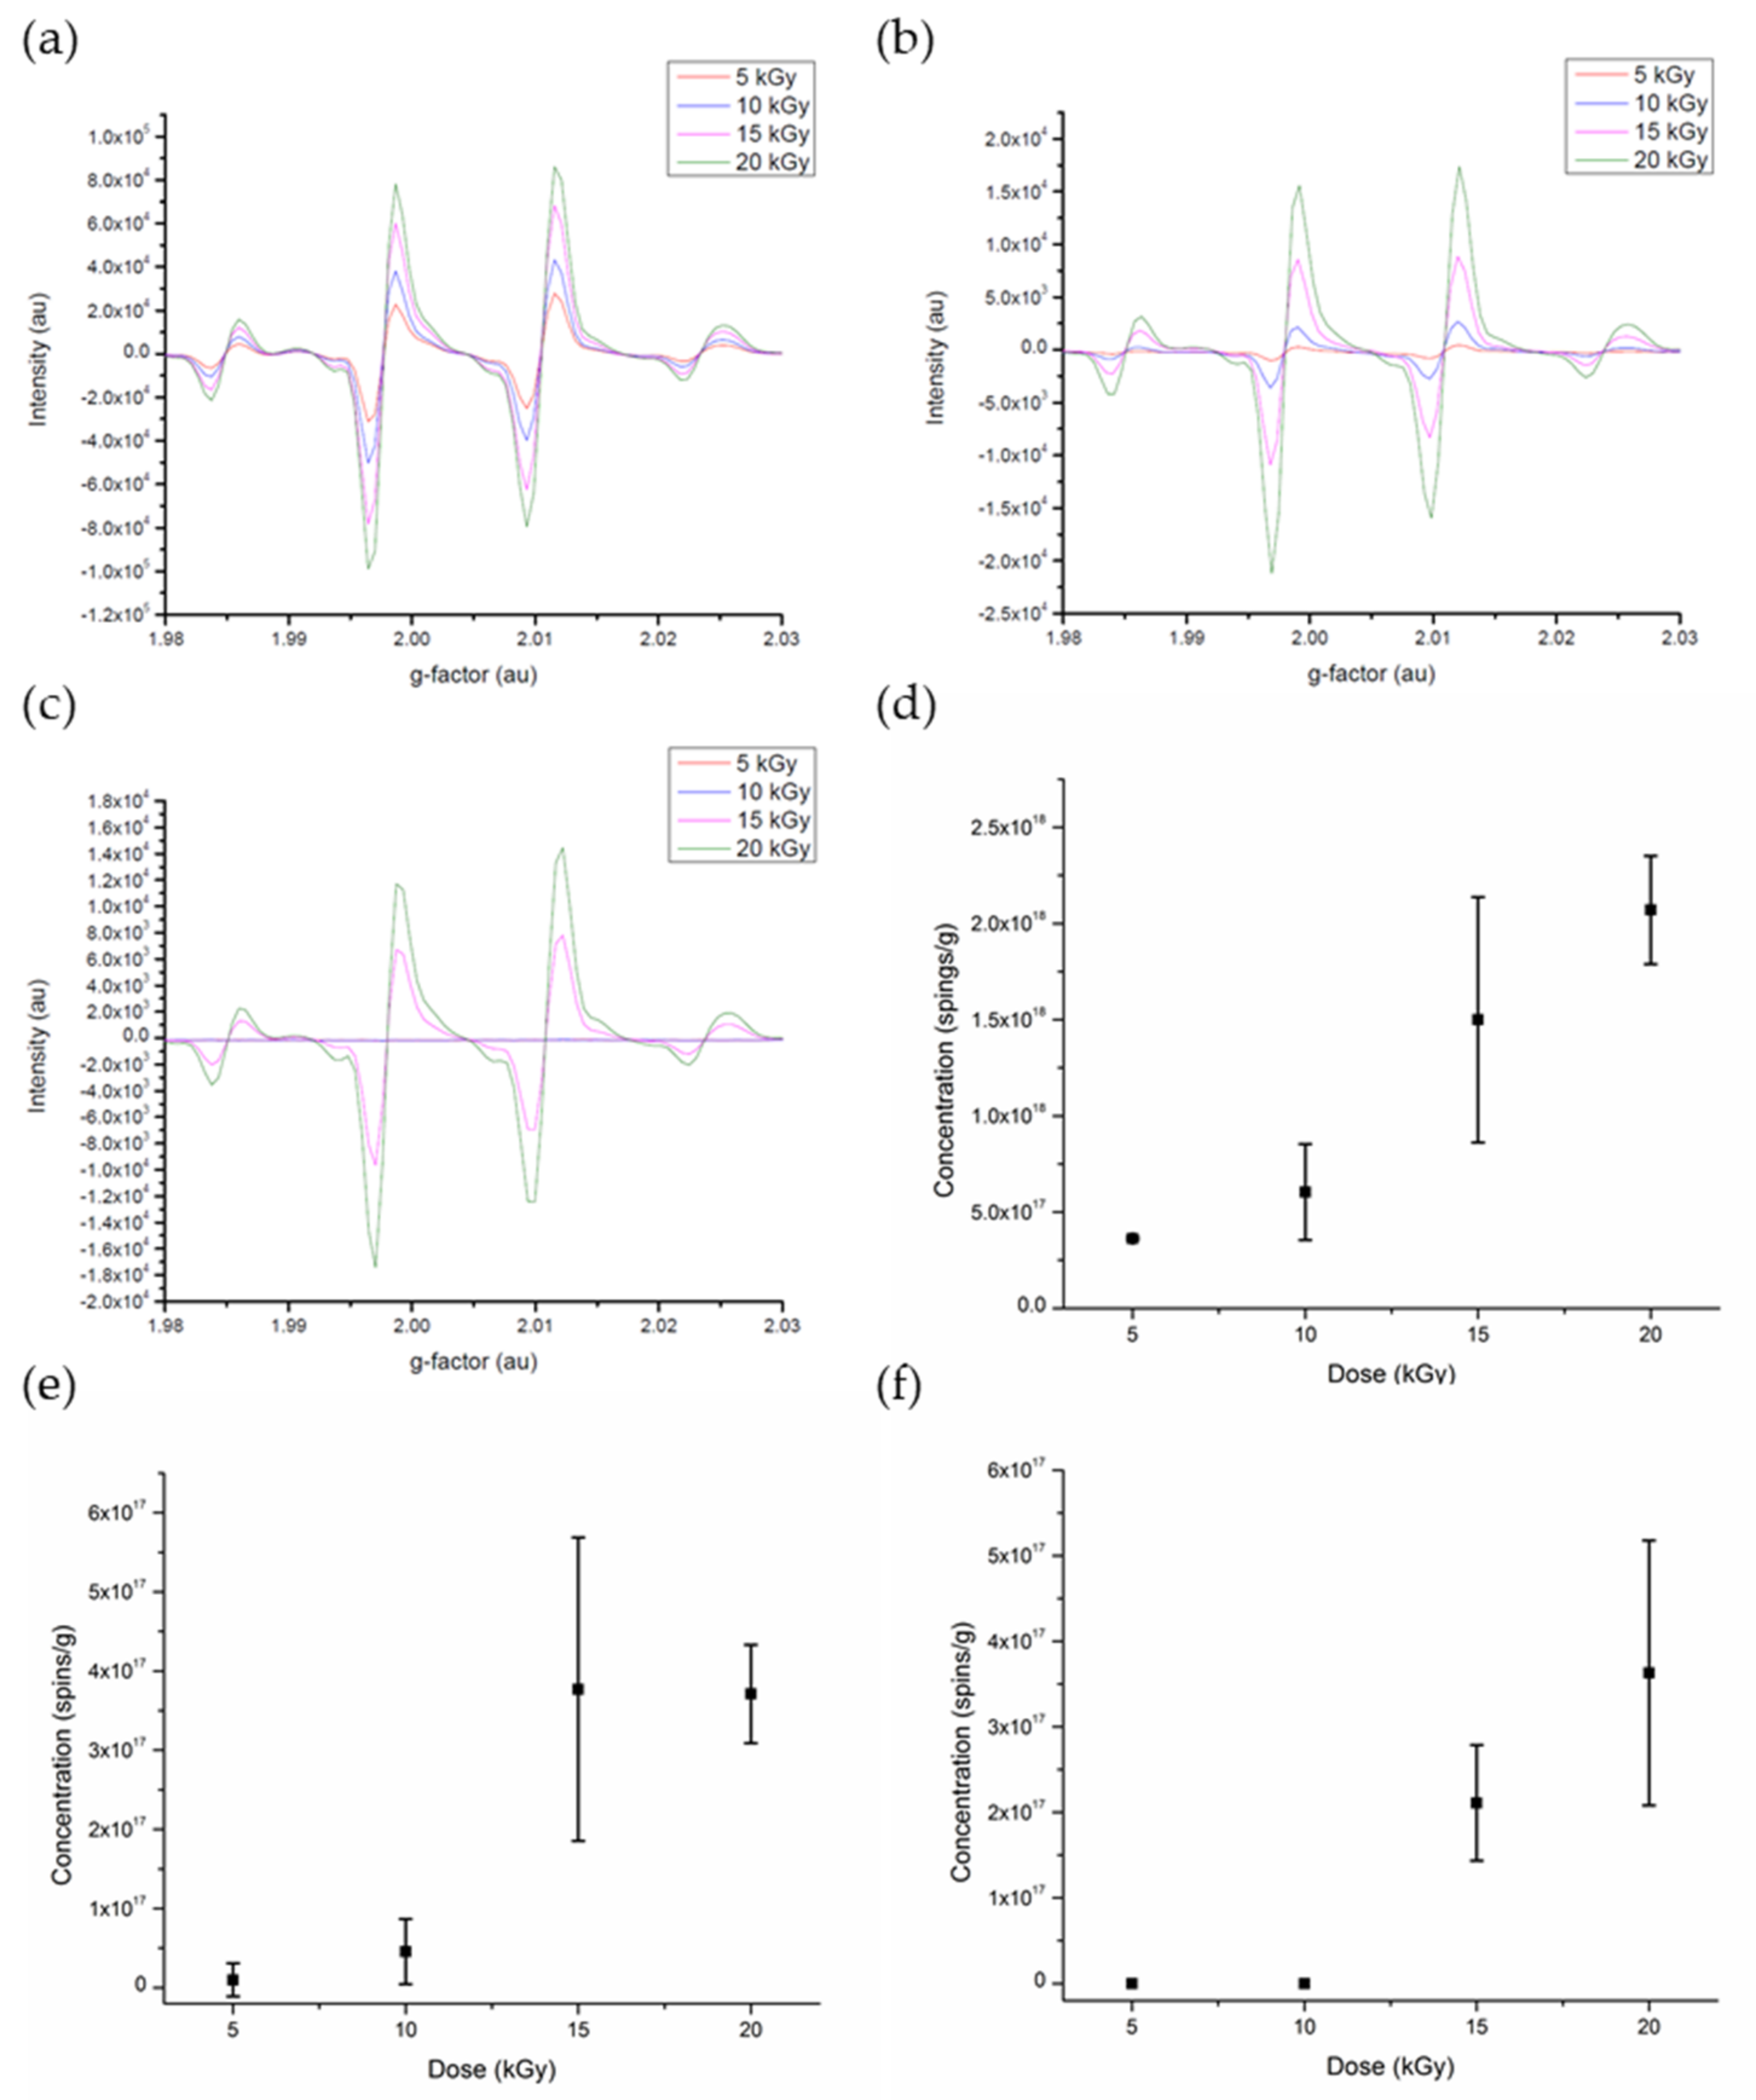
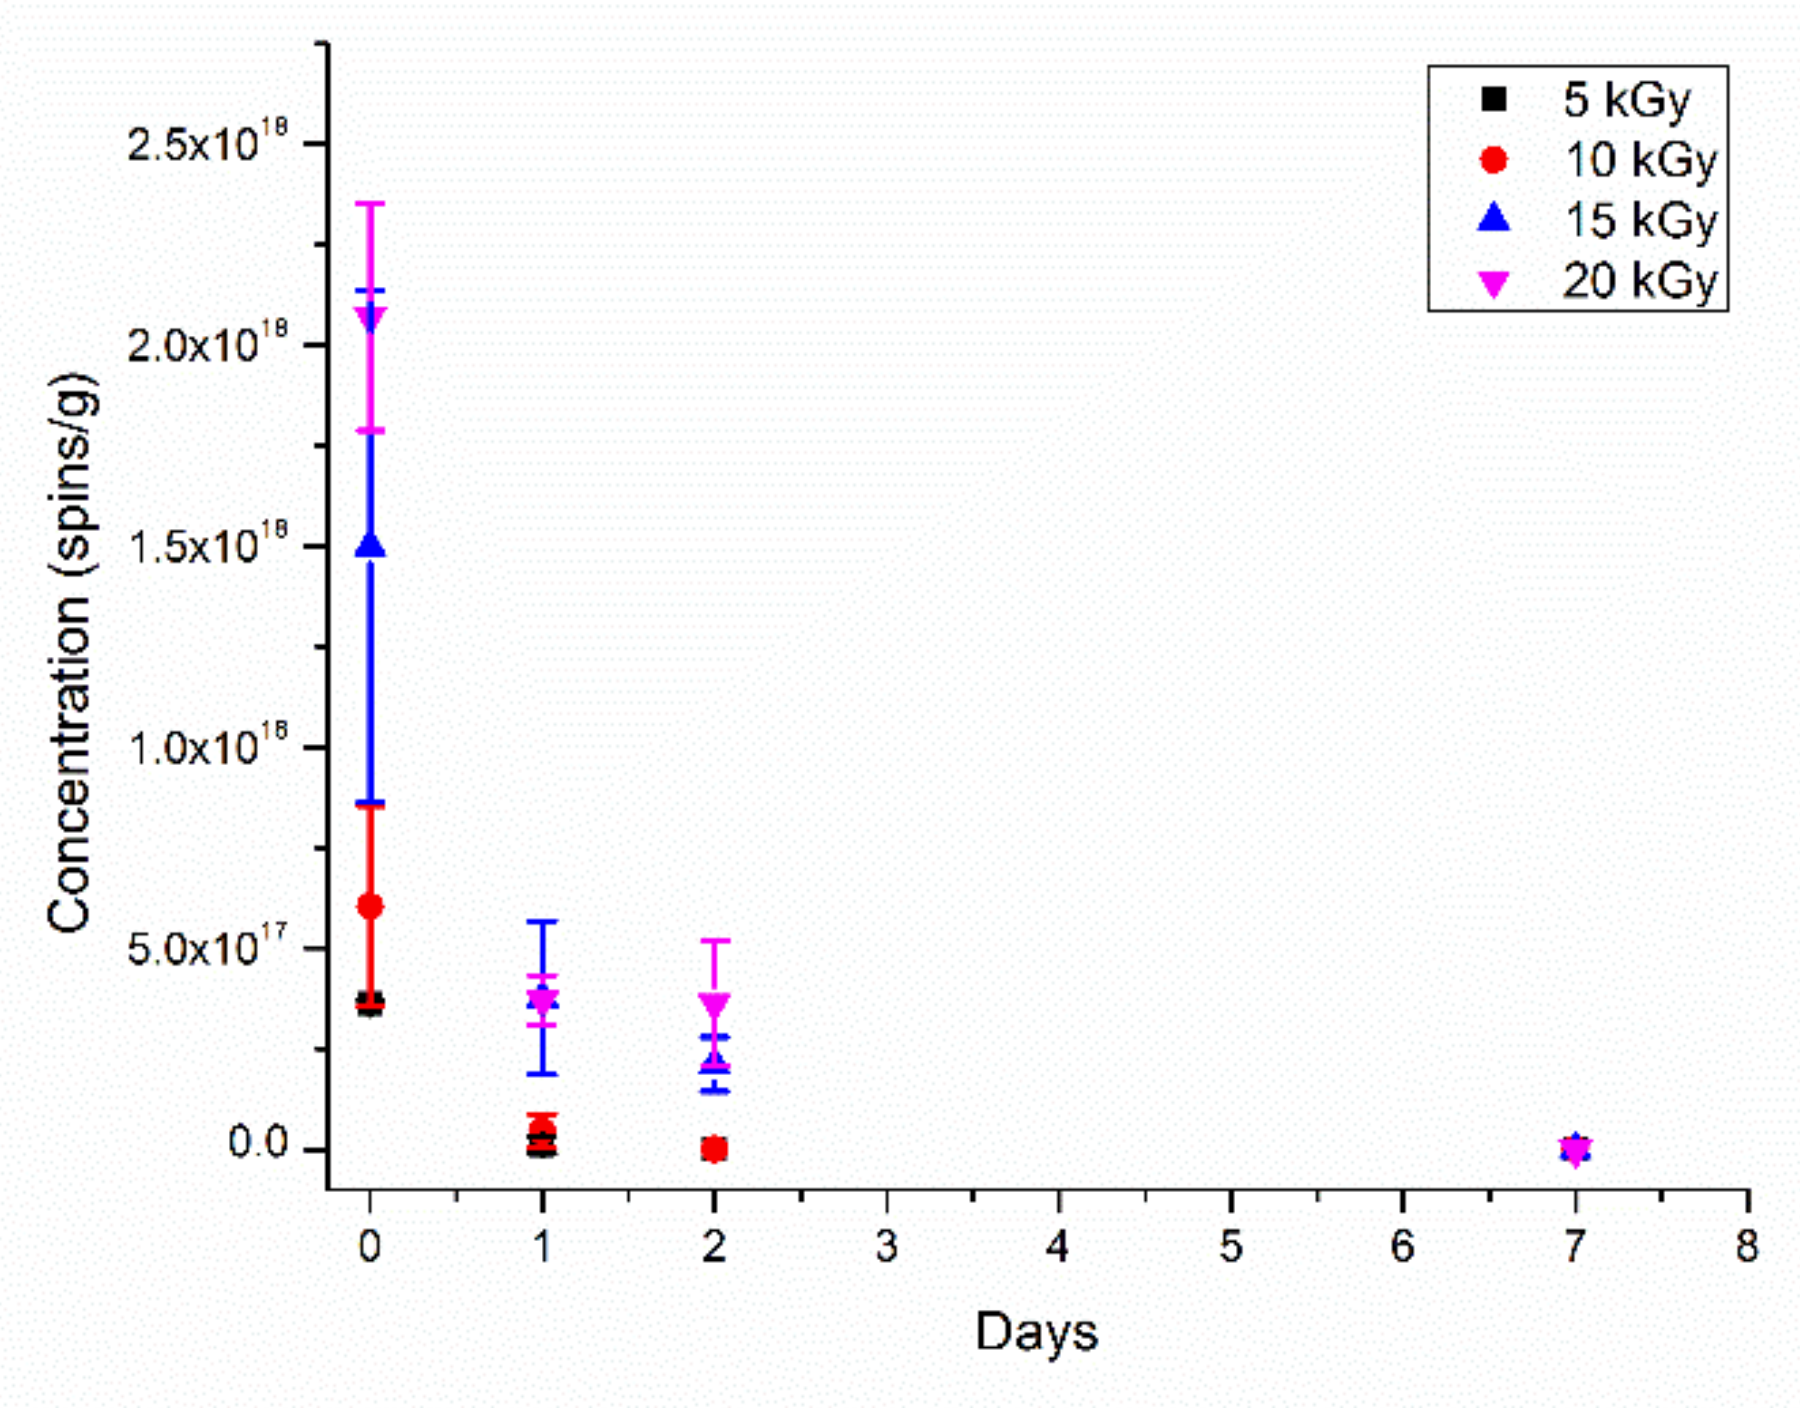
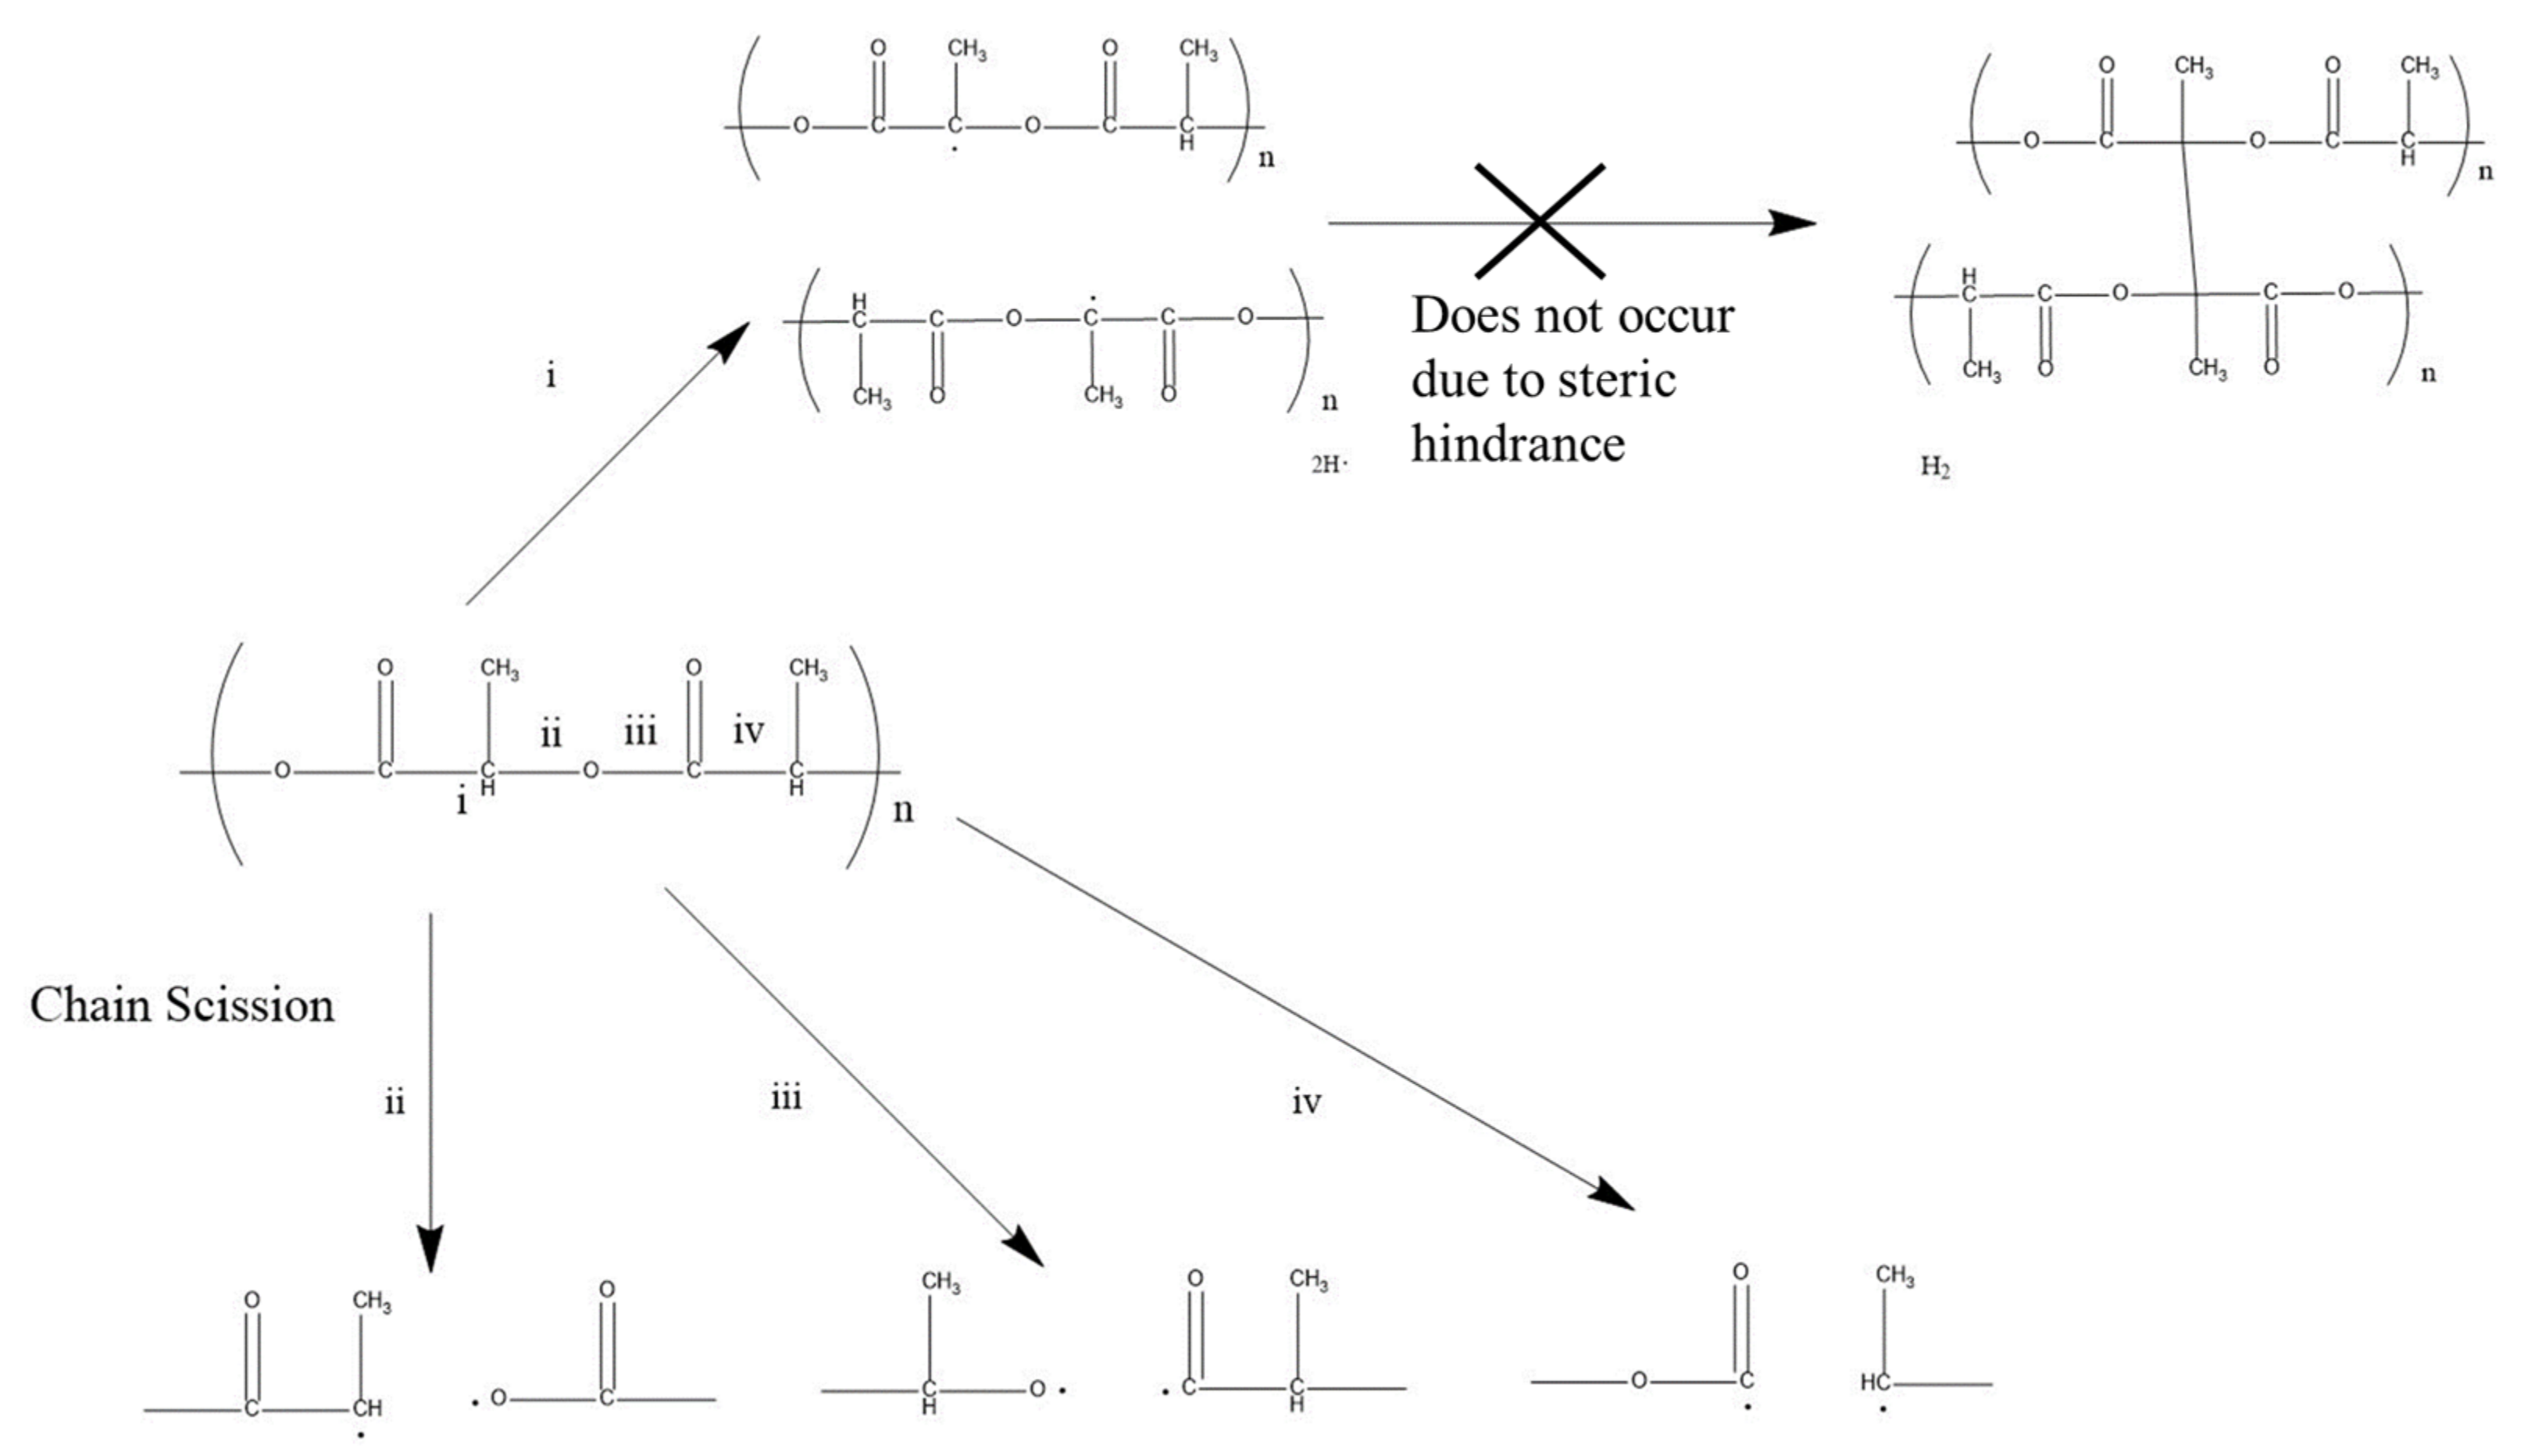
3.1. Identification of the PLA Radiolytically Produced Free Radicals and Their Kinetics Decay

Representative EPR spectra from each of the four doses were taken for comparison and plotted in Figure 2. Upon examination of each of the spectra, it is apparent that the dominant splitting pattern is four peaks with relative intensity magnitudes of 1:3:3:1. Assuming interactions between atoms less than three bond-lengths away from the radical contribute to the hyperfine structure, this splitting pattern matches the predicted result from Equation (1). H-abstraction from PLA results in three equivalent hydrogen atoms located two bond-lengths away from the carbon-centered radical. Substitution of n = 3 for the number of equivalent hydrogen atoms and I = ½ for the nuclear spin of hydrogen yields four hyperfine peaks, which is in agreement with experimental results.
This dose dependence can be further expanded upon by calculating the number of radicals present in the sample over time, with concentration expressed in spins per gram. Figure 3 illustrates this calculation. Even on day 2, in the absence of oxygen, relatively stable free radicals are still present. We believe it is a mixture of alkoxyl radicals, including radical (b) in the proposed mechanism of Figure 4. After one week, the radical concentration had decreased below the effective detection limit of the spectrometer and all yields were approximately zero spins per gram. For the reactions that occur after the irradiation of PLA, the rate-determining step is the abstraction of hydrogen by alkoxyl radicals. The decay fits neither first nor second order reaction kinetics due to complexity of the free radicals present.
Figure 4 shows the overall proposed reaction mechanisms of the radiolysis of PLA in the absence of oxygen. The EPR results demonstrate the radiation-induced C-O-C bond scissions that lead to the formation of the oxidative alkoxyl radicals and the reductive C-centered radicals. The alkoxyl radicals abstract H atoms from the neighboring molecule, giving rise to the formation of more C-centered radicals. The carbon-centered radicals on nearby PLA chains are not expected to undergo crosslinking reactions (reaction pathway i) because of steric hindrance. After chain scission (reaction pathways ii and iii), the alkoxyl radical abstracts a hydrogen from an adjacent polymer chain, giving rise to the formation of C-centered radicals. In addition, alkoxyl radicals undergo β-fragmentation and 1,2-H-shift reactions [44]. Since oxygen is not present during the EPR measurements only, the peroxyl radicals are not expected to be present, thus limiting the potential for chain scission [37]. In this investigation, dry ice was used to slow radical concentration decay kinetics until they could be characterized by EPR, and the inert atmosphere was used to prevent the formation of undesired radical species, such as the peroxyl radical, that could impact the resultant PLA structure. As expected, the presence of the L and D stereoregular forms of PLA shown in Figure 5 did not impact the shape of the EPR spectra.

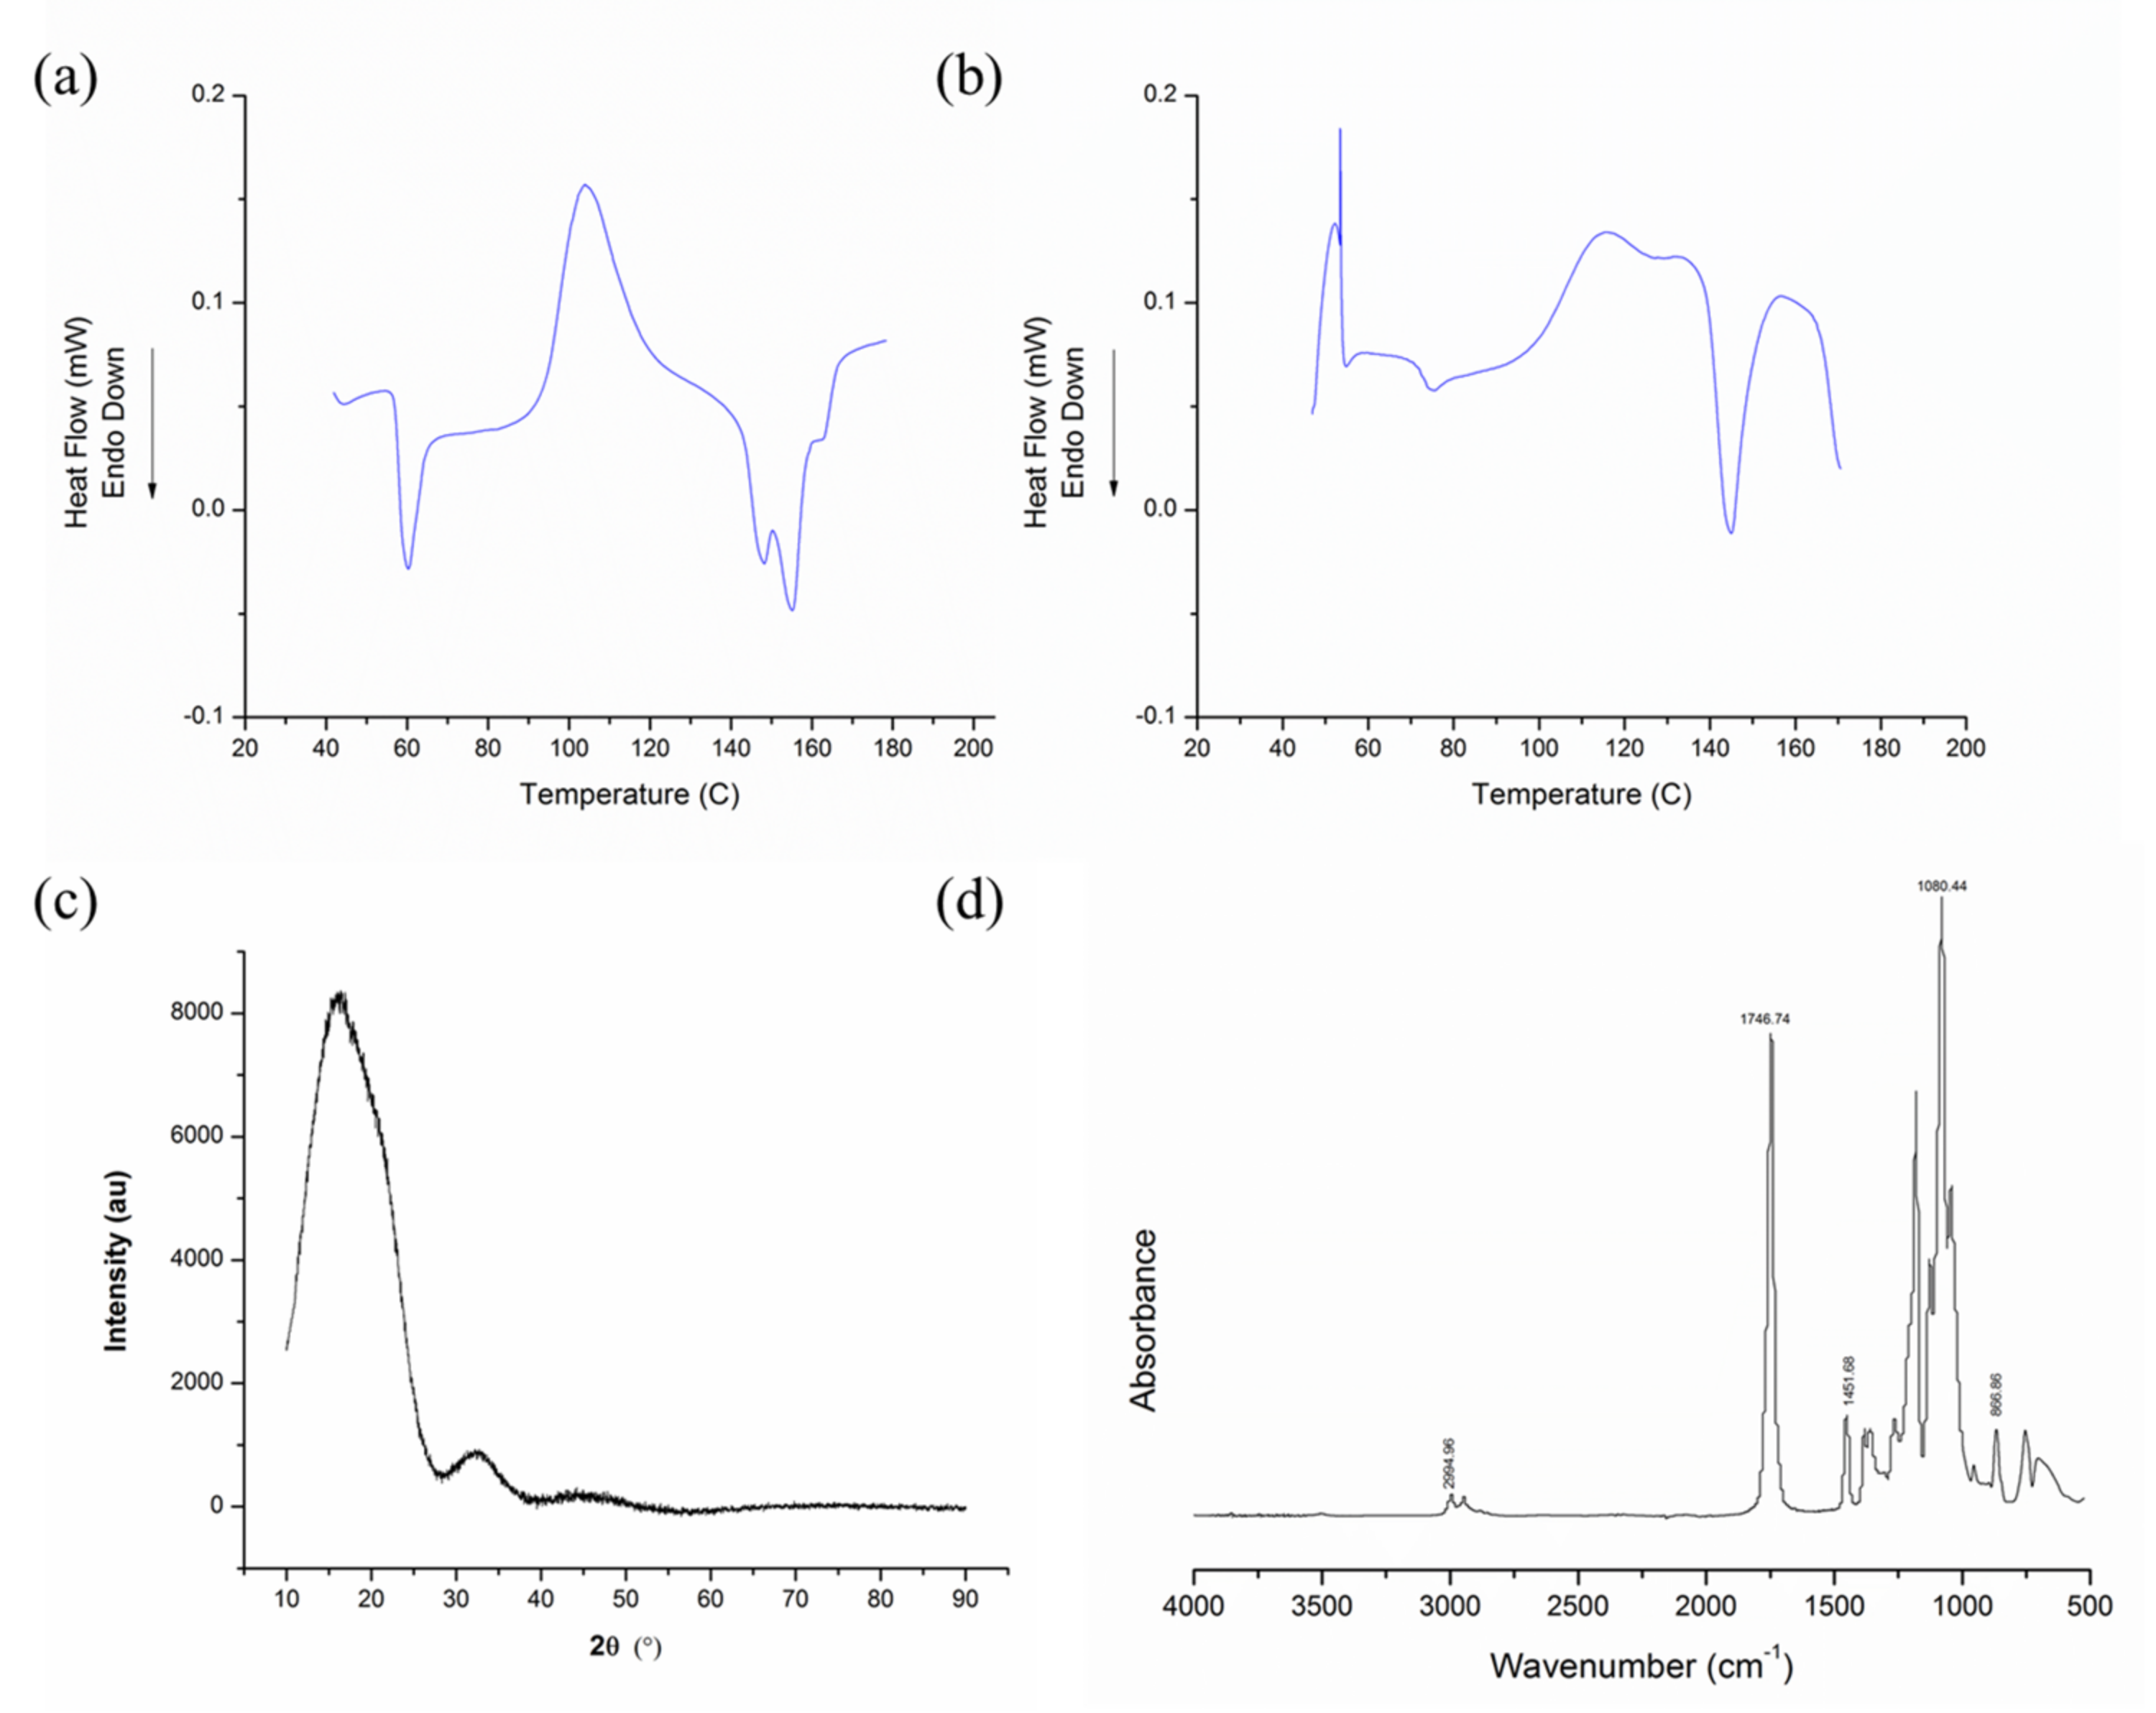
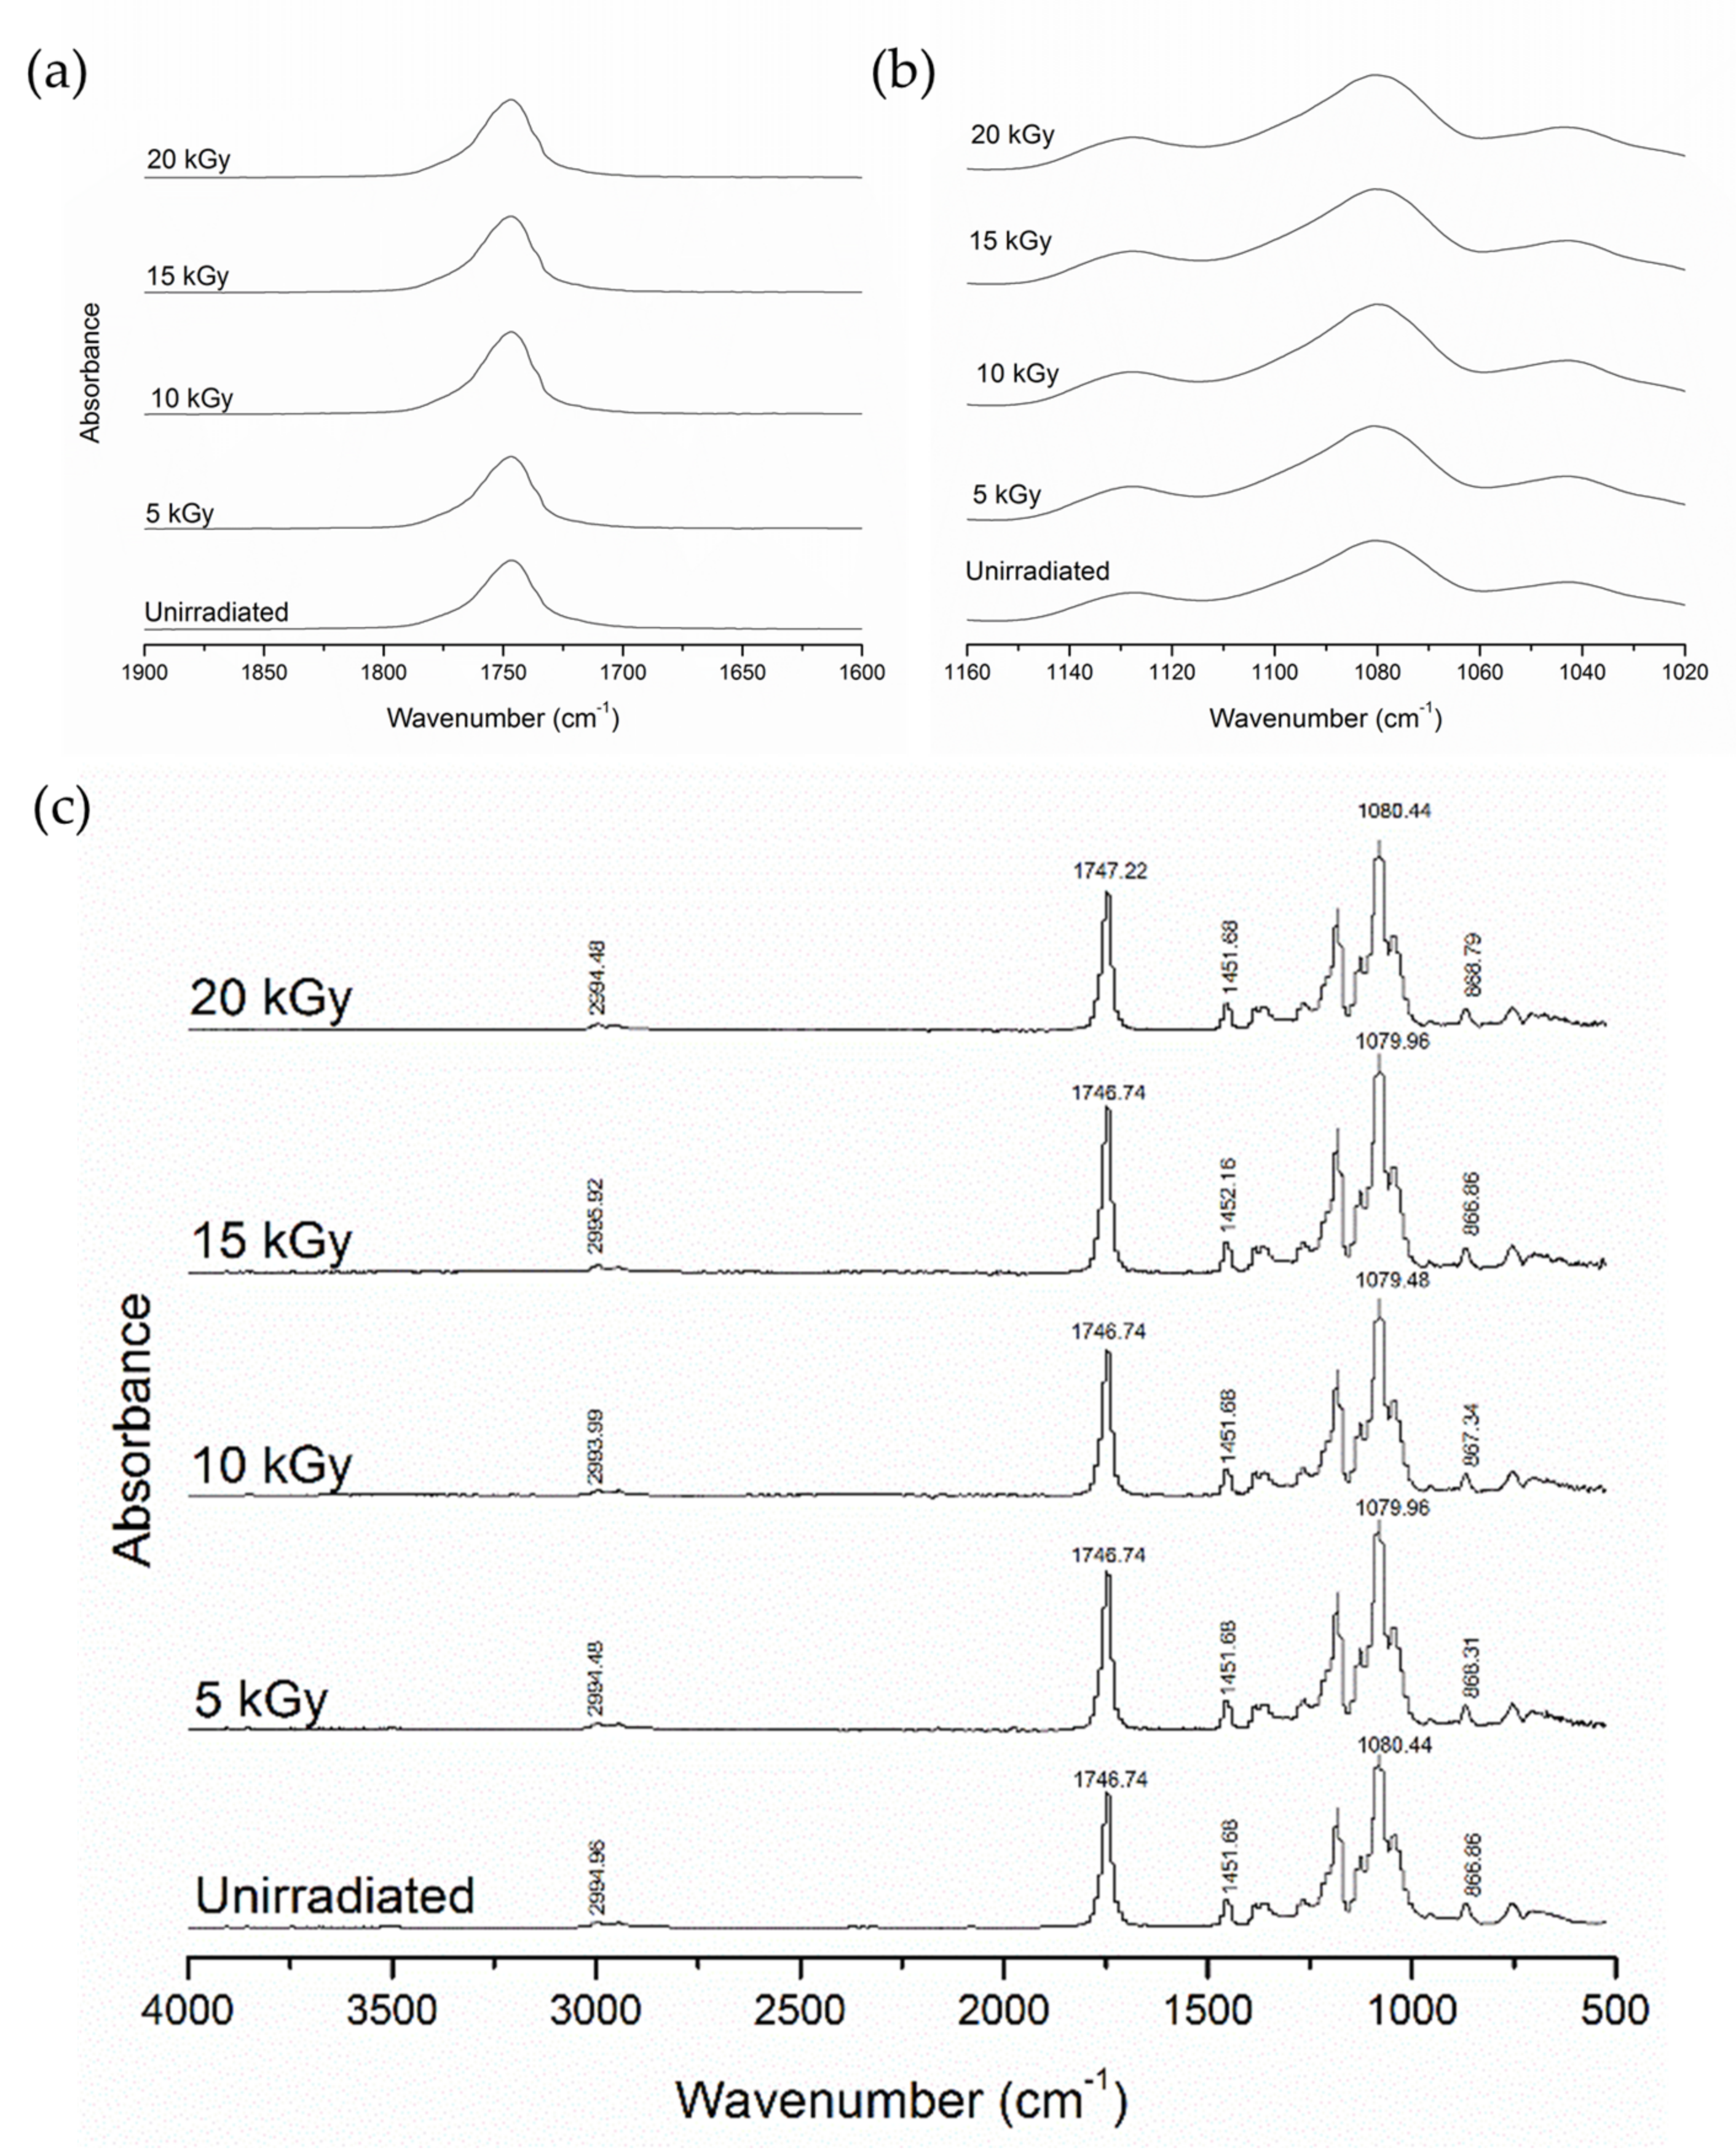
3.2. Oxidation Index Based on FTIR Spectroscopy
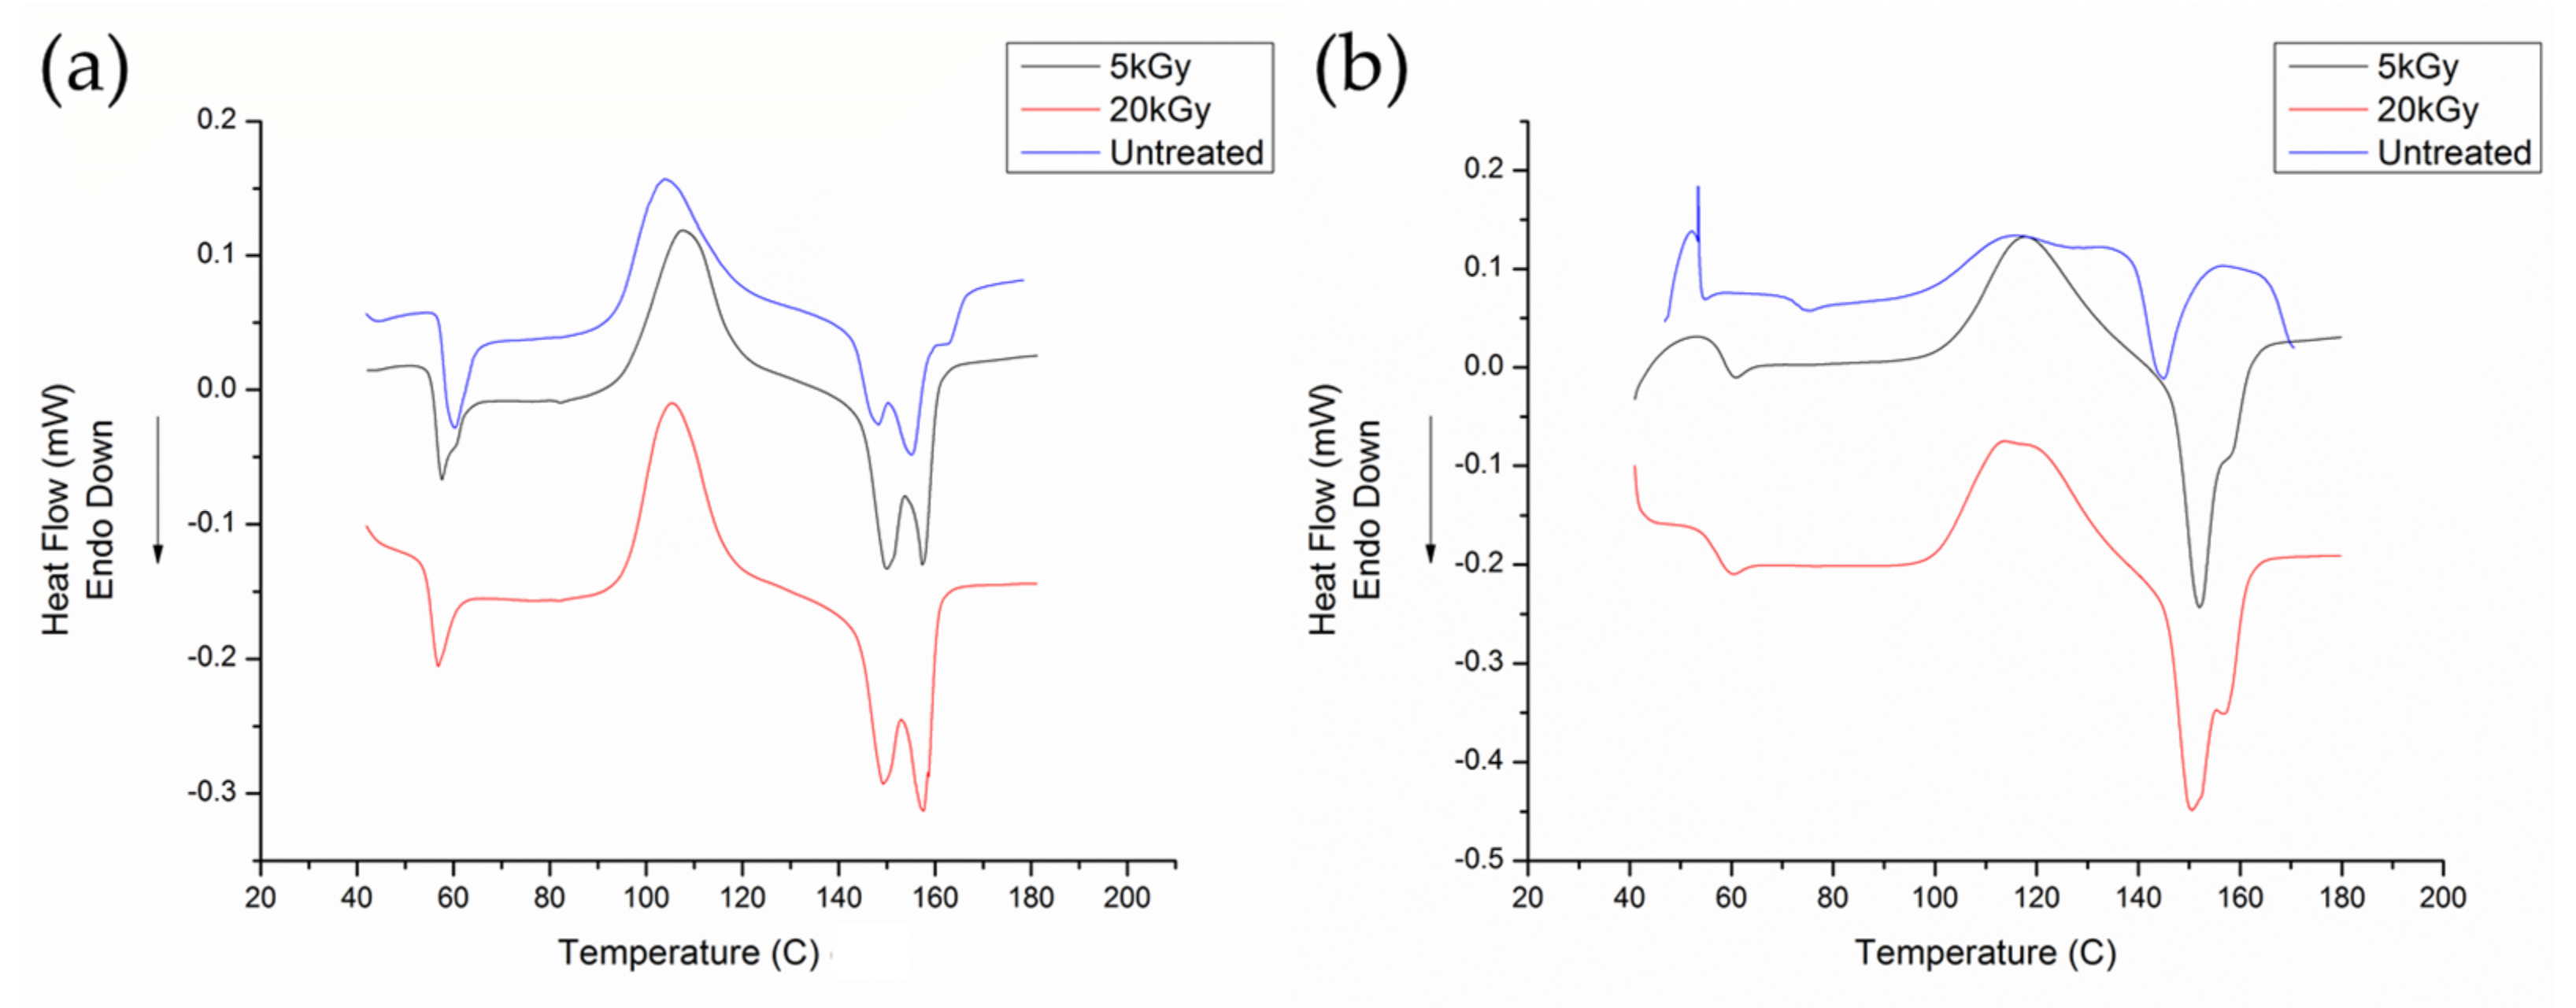
The characteristic absorption bands of each PLA functional group were found, corresponding to what is expected in the literature [45,46,47,48]. As shown in Figure 6, every spectrum contains an absorption band just below 3000 cm−1 corresponding to the C-H stretch and a weaker band at 1250 cm−1 corresponding to C-H deformation. Spectra also contain an absorption band around 1750 cm−1 for the C=O stretch, and weaker bands at 1380 cm−1 and 770 cm−1 correspond to the C=O bend. The absorption band near 1450 cm−1 corresponds to the CH3 bend, and the intense absorption bands in the 1180 and 1080 cm−1 range are representative of the C-O stretch. The absorption band at 1040 corresponds to the OH bend. The absorption bands around 860 cm−1 correspond to C-C stretches.
FTIR spectroscopy was used primarily to determine the oxidation index (OI) in the irradiated samples (Table 1). OIs which include the formation of aldehydes, ketones, and carboxylic groups were found to increase with irradiation for all doses. Although these samples were irradiated in the absence of oxygen, they were exposed to the air after irradiation. Therefore, it is expected that peroxidation of the free radicals will take place.

3.3. DSC Results

The thermal behavior of the unirradiated and irradiated samples from the thermal analysis is given in Table 2. The glass transition of unirradiated samples was 60.8 ± 1.2 °C on average. Therefore, the samples were in a glassy phase during irradiation. Since the total dose used in this study was comparatively low, as a result, the degradation was minimal and there was no effect on Tg.
The cold crystallization and softening points were found to be on average 122.1 ± 1.7 °C and 153.3 ± 2.2 °C, respectively. The average transition temperatures for irradiated samples slightly decreased with increasing dose due to chain scissions resulting in shorter chains. A negligible ratio of crystallinity was found to be 1.2% on average in unirradiated samples. With increasing radiation dose, an increase in crystallinity was observed, with crystallinity of 2.4 ± 0.12% at 5 kGy and 7.3 ± 0.4% at 20 kGy. A larger increase in crystallinity was expected [35]. However, the steric hindrance on the backbone of the PLA chains impeded crystallization of these broken chains.
As shown in Figure 7, a pronounced double melting peak was observed in the first heating cycle, with the two peaks occurring at approximately 155 °C and 161 °C. The stereocomplex consisting of both PLLA and PDLA has a higher melting point than tactically pure PLA due to interlocking of oriented chains [50]. A double peak due to stereocomplexation would be found around 220 °C, much higher than the second peak we observed [50,51,52]. Therefore, it is more likely that the double peak is due to perfected spherulites. The melt–recrystallization model has been used to describe similar behavior in PLA and semicrystalline polymers in the literature [53,54]. Small imperfect crystalline spherulites realign and become more stable perfected spherulites, which creates an exothermic peak that divides the melting curve into two [53,55]. This process is dependent on heating rate, as recrystallization is a slow process. The shoulder behavior seen in our second heating curve agrees with the behavior seen at 10 °C as outlined by Yasuniwa et al. [53].

3.4. Characterization with Optical Microscopy

To investigate the composition of the PLA samples, optical microscopy was used. Microscopy showed no optical activity when viewed with and without the polarized light. This indicates that the polymer is a racemic mixture of PDLA and PLLA because optical activity would be expected at other compositions. Optically active materials exhibit this property because they can rotate the plane of polarization due to differing amounts of enantiomers and their chirality; racemic mixtures of enantiomers are optically inactive because the equal and opposite rotations cancel out [28,56]. There were no changes in optical properties of irradiated samples.

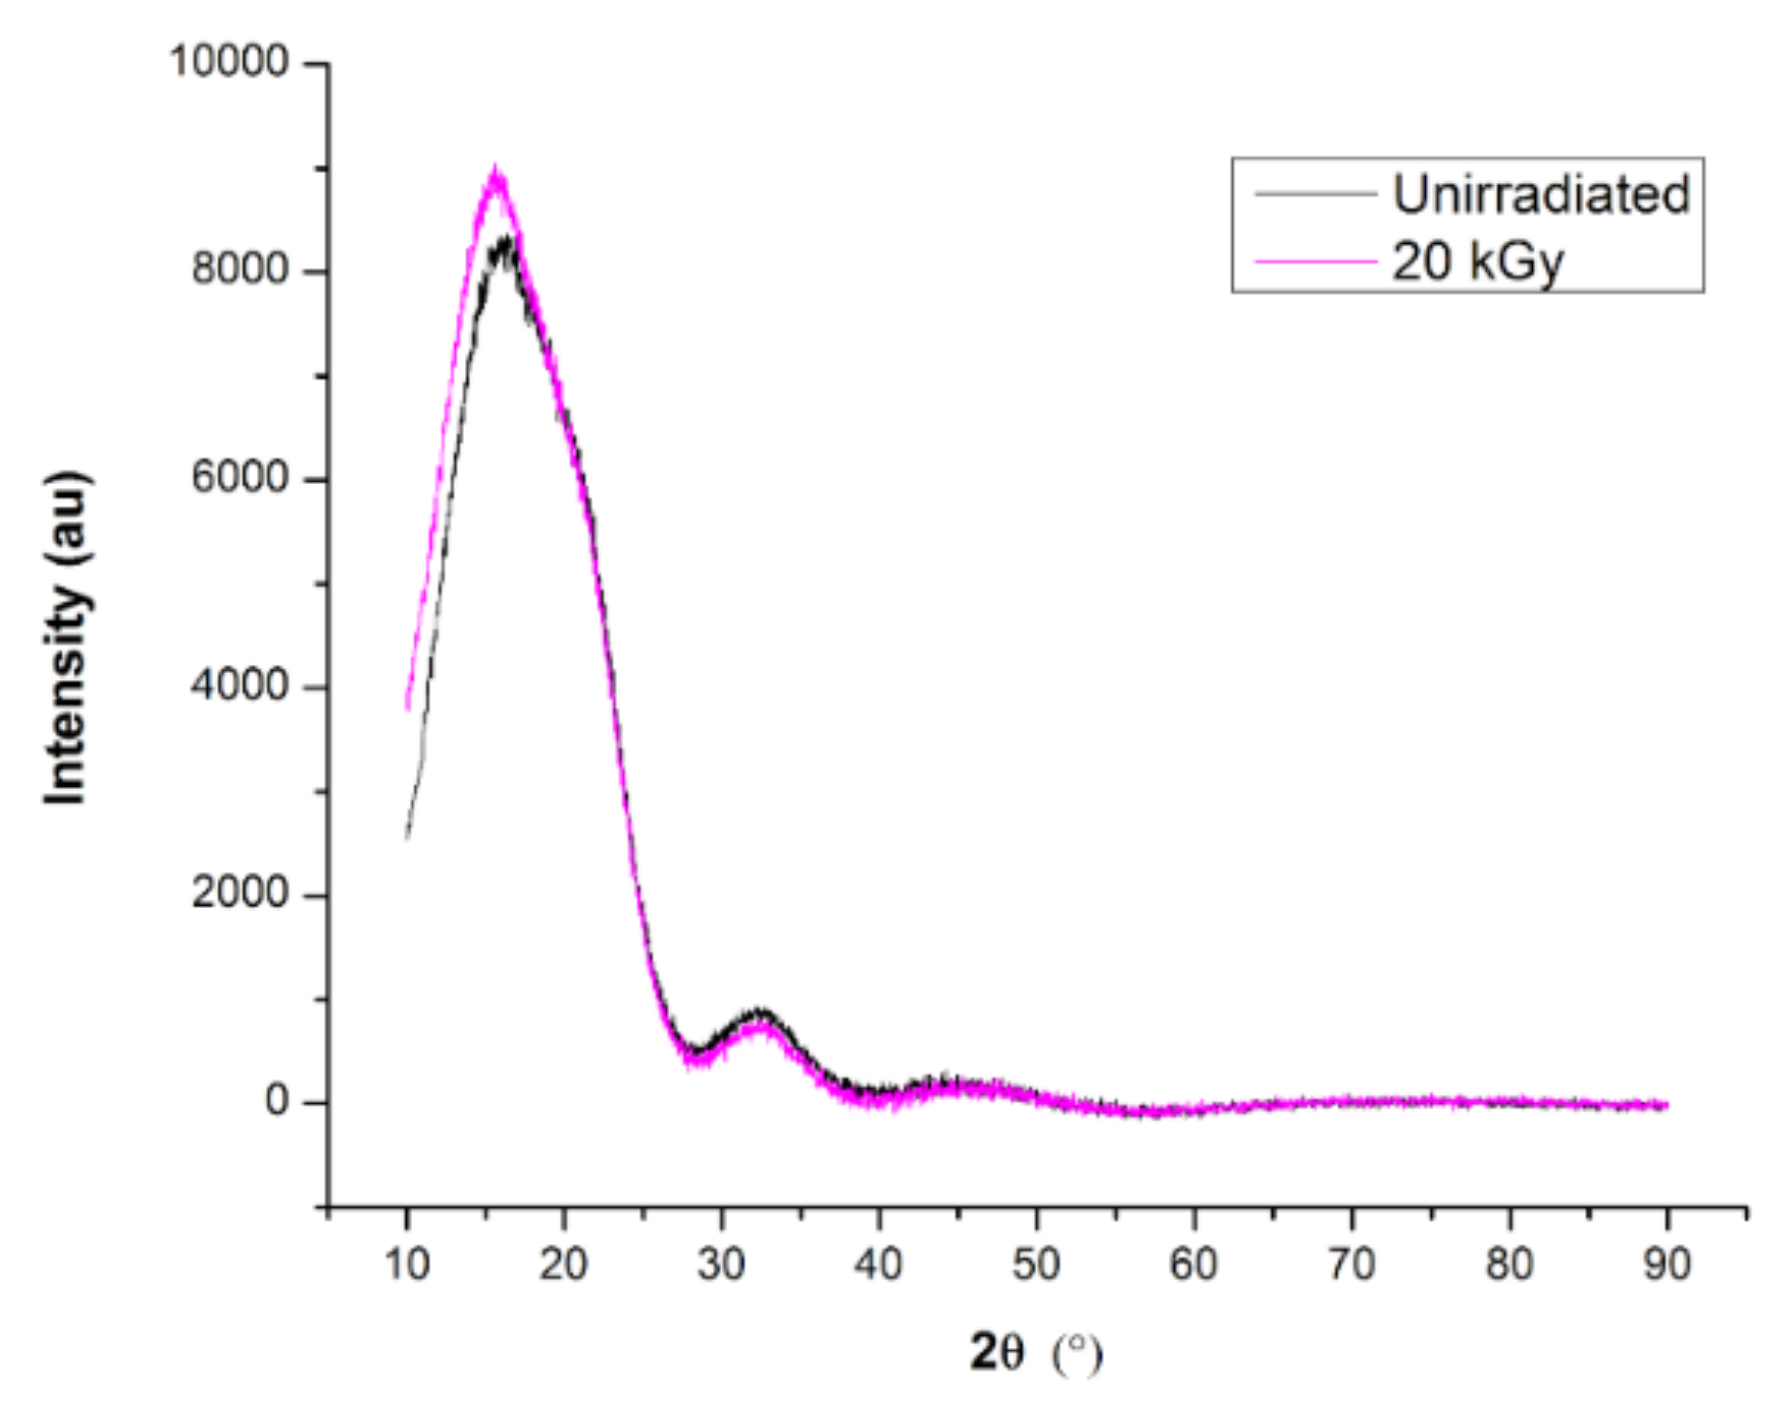
3.5. XRD Analysis of Polymer Matrix Structure and Crystallinity
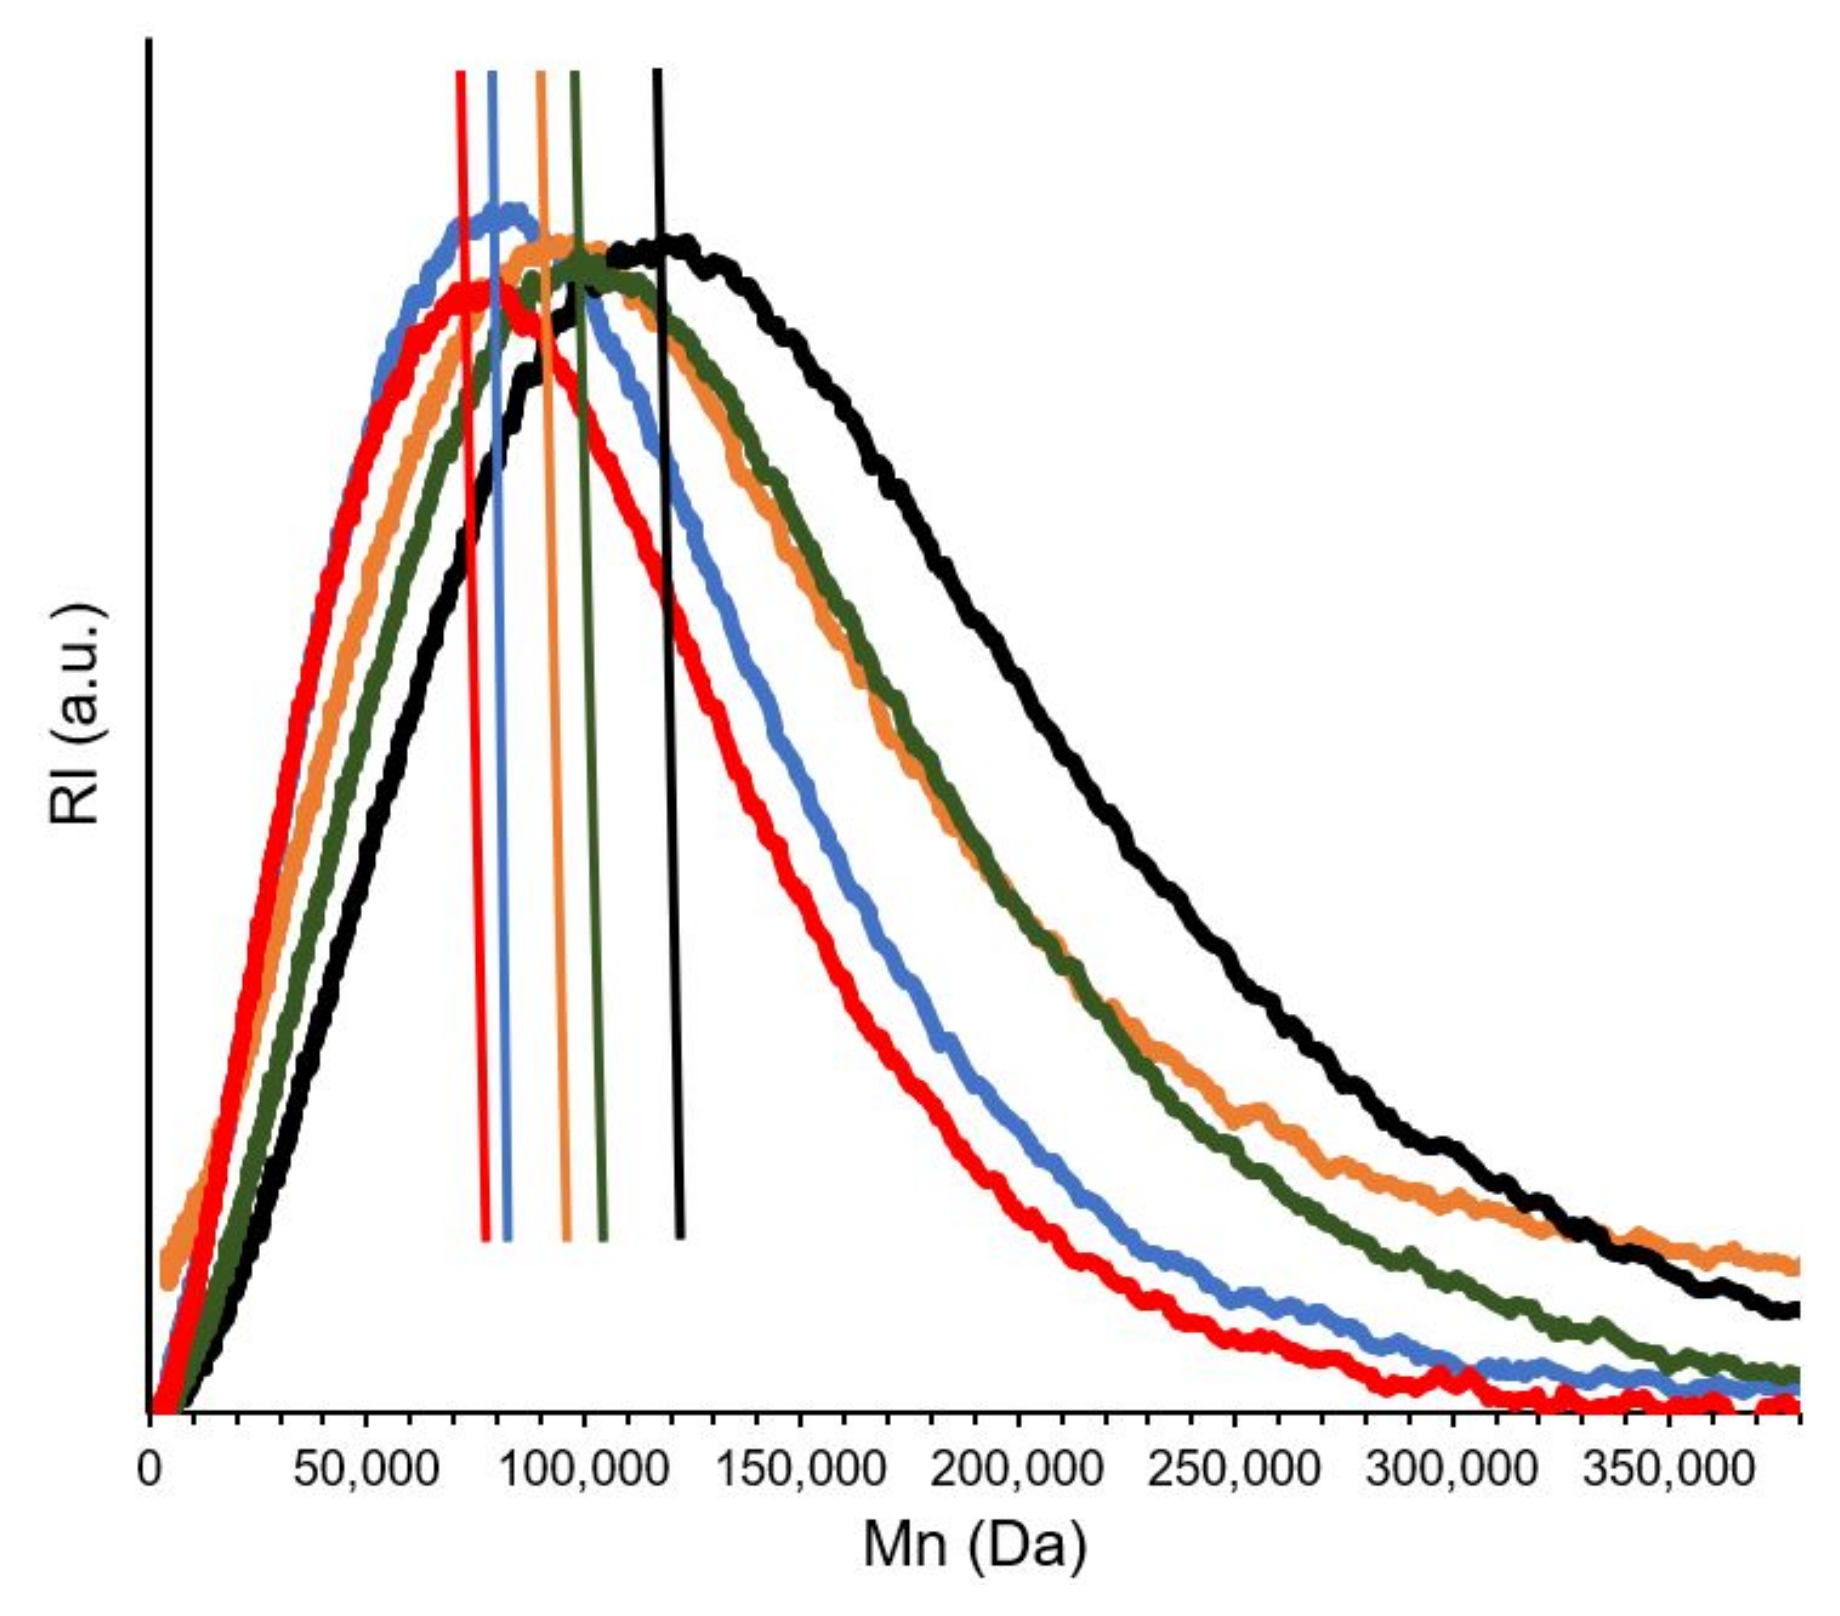
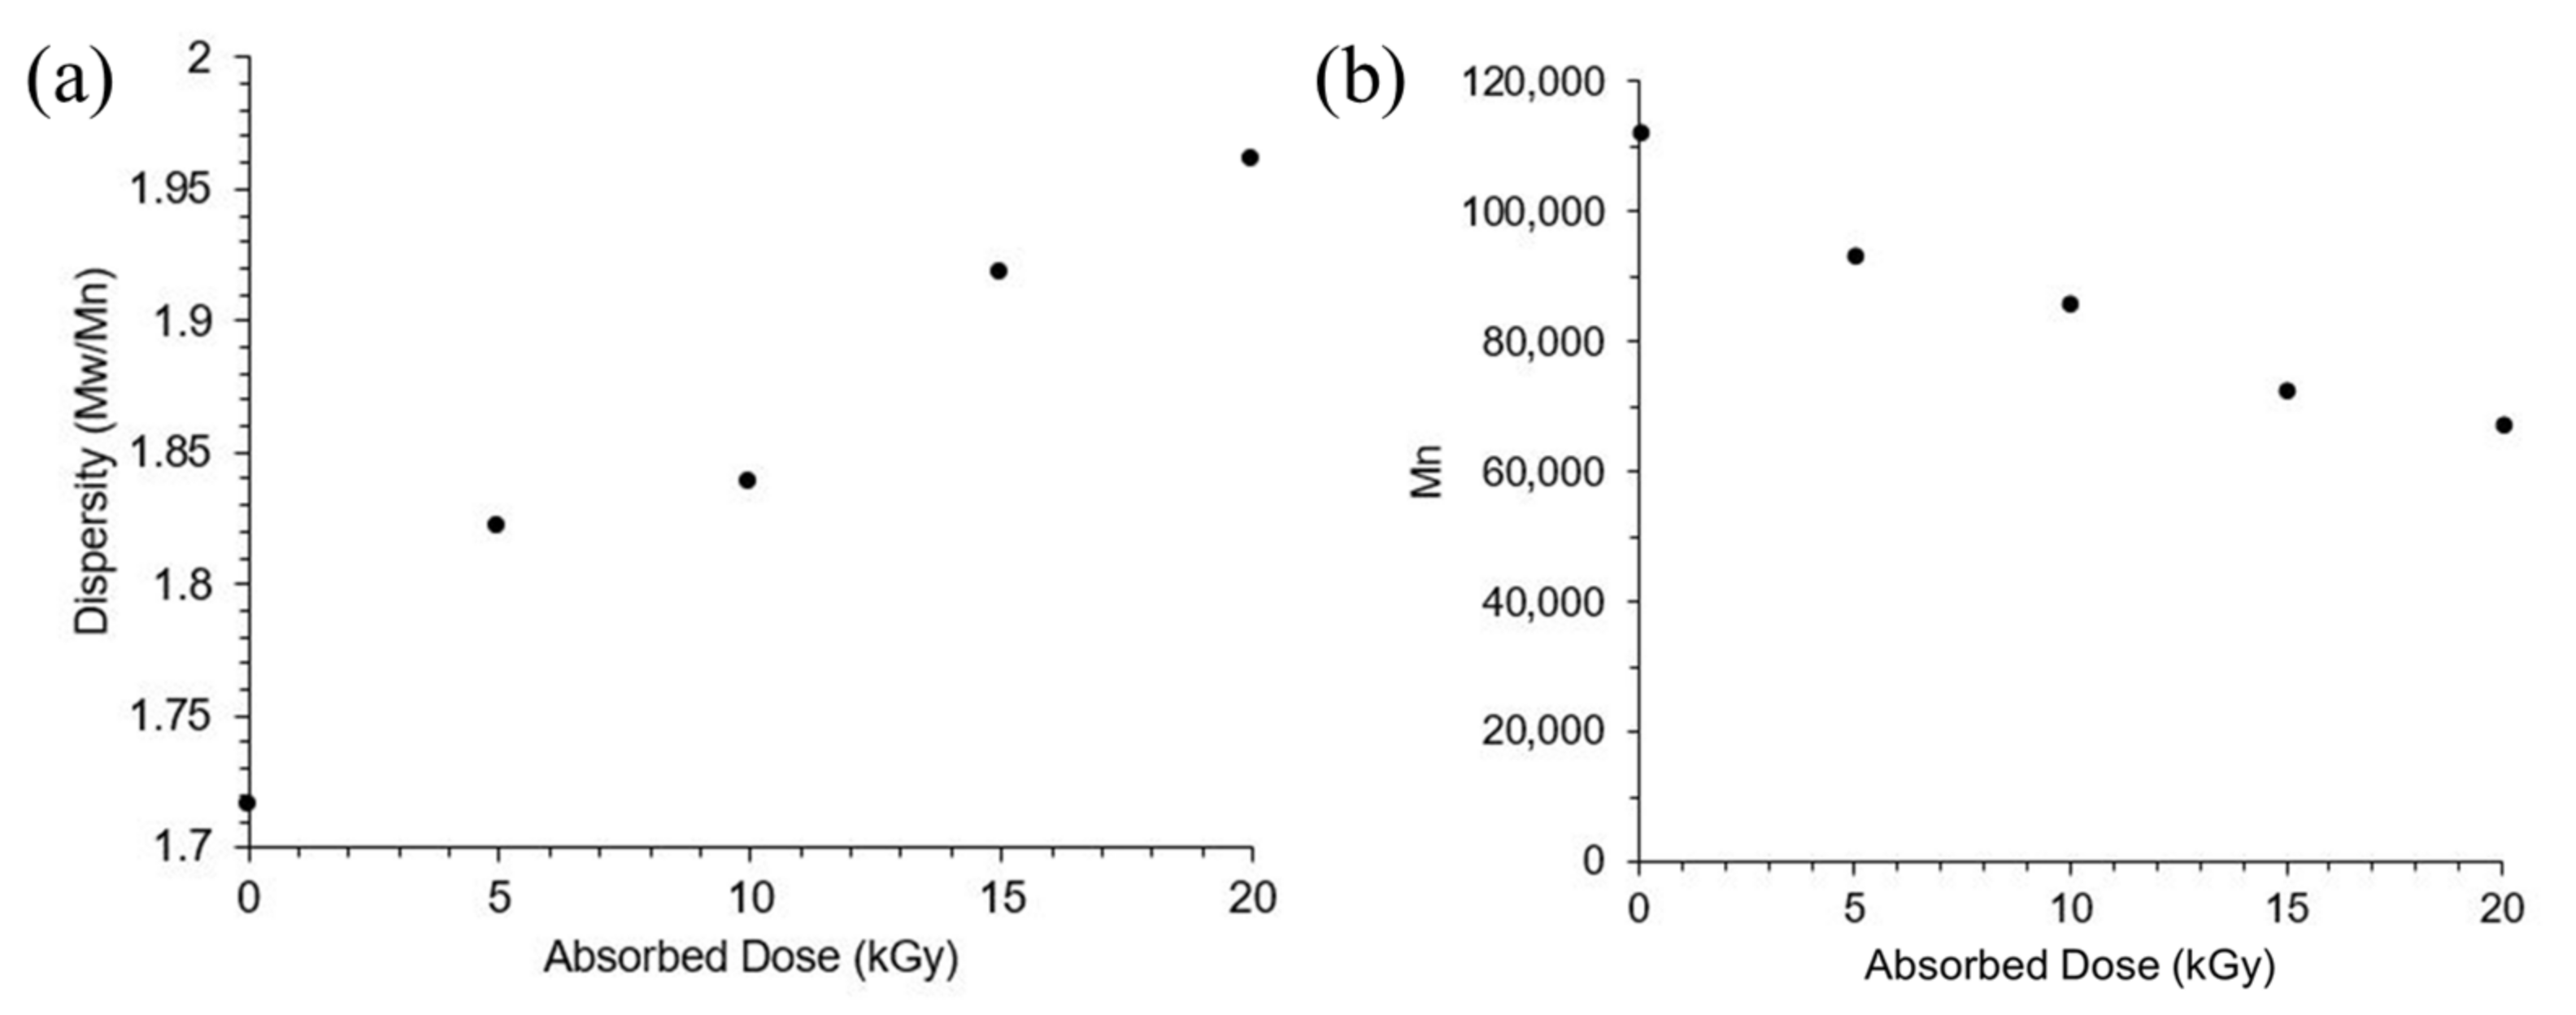
The diffractograms from both an unirradiated PLA sample and a 20 kGy irradiated PLA sample are shown in Figure 8. Both diffractograms demonstrate two wide peaks or halos: one from about 10° to 28° and the other from about 28° to 40°. Previous literature on the X-ray diffraction of highly amorphous PLA demonstrated that wide halos, such as the two observed in both samples measured, arise from diffraction patterns caused by the amorphous phase [57,58]. No sharp peaks corresponding to the presence of crystalline phase are observed, meaning that the PLA films, both before and after irradiation, are highly amorphous. However, there is a slight increase in the peak intensity of an initial wide amorphous halo from 10° to 28°. Previous X-ray diffraction studies of PLA indicate that an increase in peak intensity of this amorphous peak can be attributed to increases in crystallinity of the sample [59]. However, because this difference in peak intensity between samples is only on the order of 5%, more detailed characterization is necessary to ascertain more details about the crystallinity of the PLA.

3.6. GPC Results

As shown by the molar mass distributions in Figure 9, there is no indication of an increase in molar mass with dose; thus, scission reactions are predominant under these conditions. Additionally, in Figure 10, we observed a loosely linear relationship between increasing dose (0–20 kGy) and a corresponding increase in the dispersity and decrease in Mn of the PLA films.

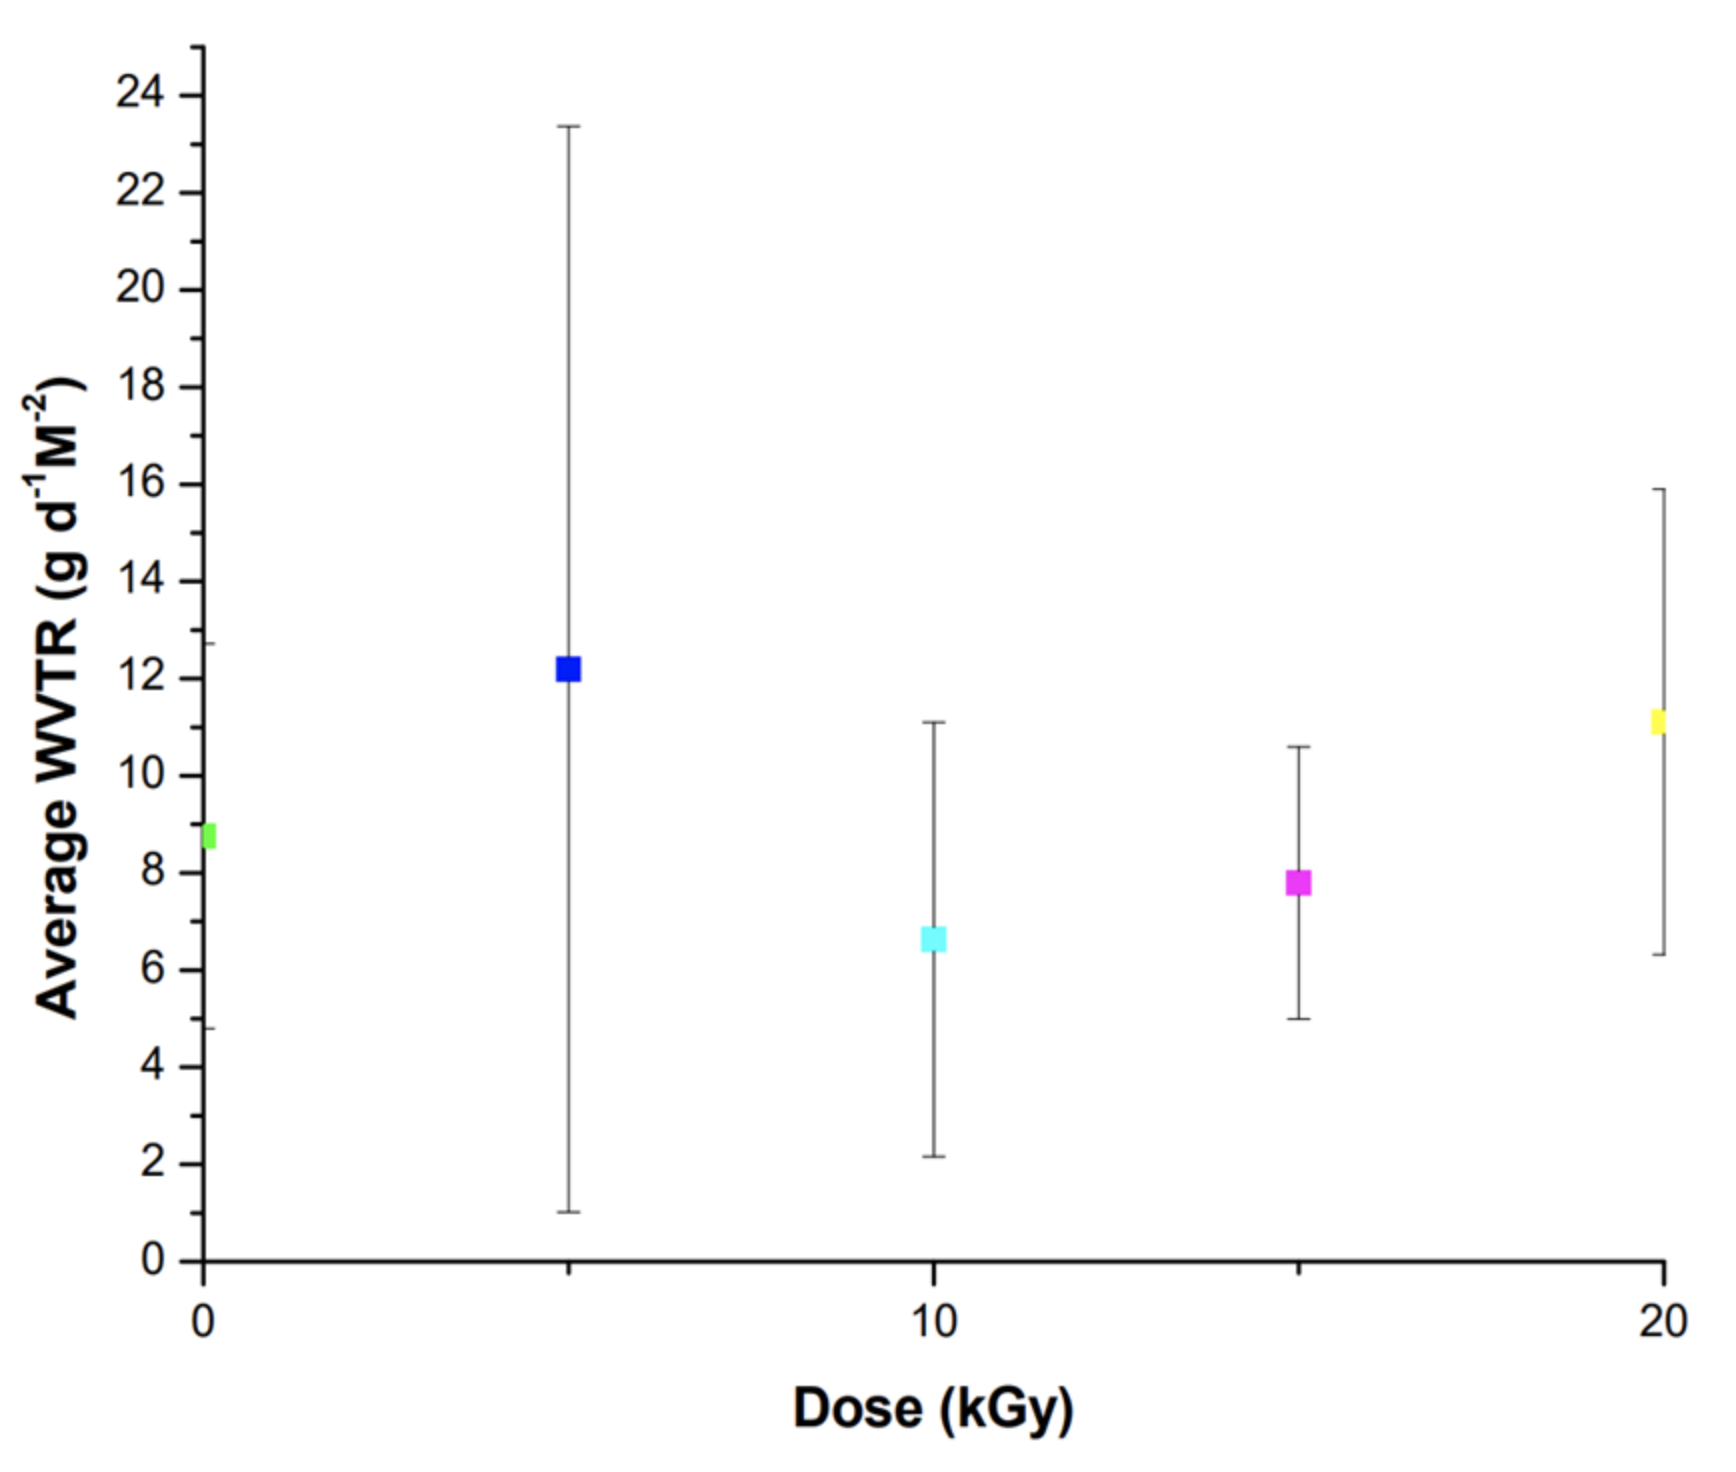
3.7. WVTR Calculation Results

For the WVTR analysis, three samples of each dose were weighed for six days. The WVTR was calculated using Equation (4), averaged, and plotted with the standard deviation shown in Figure 11. No significant trend was observed, as the standard deviation indicates high variability in the data. The thickness of the sample is higher than that of samples more commonly found in the literature while still meeting the requirements for the ASTM procedure [60,61,62].
Analysis of the data indicates that there is no notable effect of irradiation dosage on WVTR of PLA. Based on the EPR and GPC results, an increase in the WVTR was expected after irradiation of the PLA. It has been shown that chain scission increases the WVTR of the polymer as it reduces the pathway tortuosity, or the number of barriers that the water vapor molecules must overcome [63,64]. However, in this study PLA was irradiated only up to a dose of 20 kGy and this resulted in low chain scission yields which did not have an impact in the WVTR.

4. Conclusions

Despite the fact that electron beam radiation provides a high dose rate and the absence of oxygen, the EPR and GPC results demonstrate that the predominant effect of radiation is the scission. The EPR results clearly show the formation of alkoxyl and C-centered radicals upon irradiation. The GPC data confirm the EPR results that the predominant effect of radiation is the scission. Upon irradiation with 20 kGy, Mn and Mw of the unirradiated samples decreased from 126,200 Da and 201,400 Da to 74,200 Da and 141,000 Da, respectively. The abstraction of H-atoms by alkoxyl radicals from neighboring molecules can also contribute to the formation of C-centered radicals. The GPC results also reveal the absence of higher-molecular-weight chains, which directly demonstrate the absence of crosslinking reactions of these C-centered radicals. This can be explained by the fact that these C-centered radicals react with the oxygen very rapidly since the irradiated samples were exposed to air after irradiation. Due to the relatively low dose (maximum 20 kGy) and, consequently, the small induced scission yields, we have found that there is no change in Tg, only negligible (minor) changes in crystallinity, and no effect on water vapor transmission rate. Gel fraction measurements to measure crosslinking density were unsuccessful, as the gel point could not be reached. The absence of the formation of the three-dimensional gels supports the GPC findings. The presence of oxygen after irradiation can also contribute to the prevention of gel formation, since the reaction of C-centered radicals with oxygen compete to produce the corresponding peroxyl radicals. Finally, the change in oxidation index is very low, which is a good indicator that the irradiated PLA within this range of doses undergoes minimal degradation.
The main objective of this study is to evaluate the viability of PLA as a biodegradable food packaging material. Our results show that the irradiation has no effect on the aforementioned physical properties of the PLA. Therefore, this small degradation will enhance the biodegradability of this polymer for food irradiation and sterilization applications.

Author Contributions

Conceptualization, E.C.G.; methodology, J.C.H., O.L.M. and C.W.S.; formal analysis, C.A.L., J.R.B., E.C.G., J.C.H., K.L., C.W.S., A.C.F. and L.R.S.; investigation, J.R.B., E.C.G., A.H., K.L., C.W.S., C.A.L, R.L.B., A.C.F. and C.M.W.; data curation, E.C.G., O.L.M., K.L., C.A.L. and C.A.; writing—original draft preparation, E.C.G., J.C.H., K.L., O.L.M., C.W.S., S.M.W. and A.C.F.; writing—review and editing, E.C.G., K.G., J.C.H., K.L., O.L.M., C.W.S., A.U., A.C.F., C.M.W. and L.R.S.; visualization, C.A.L.; supervision, M.A.-S. and L.G.L.; project administration, E.C.G. and O.L.M.; funding acquisition, L.D. All authors have read and agreed to the published version of the manuscript.

Funding

This research was funded by the Maryland Sea Grant, National Oceanic and Atmospheric Administration, U.S. Department of Commerce under awards NA14OAR4170090 and NA18OAR4170070.

Institutional Review Board Statement

Not applicable.

Informed Consent Statement

Not applicable.

Data Availability Statement

Data are available from the authors upon reasonable request.

Acknowledgments

Kim Morehouse, Fred Bateman, the Gemstone Program at the University of Maryland, Kyle Ludwig, Jacques De Beer, Stas Stoliarov, and You Zhou.

Conflicts of Interest

The authors declare no conflict of interest. The funders had no role in the design of the study; in the collection, analyses, or interpretation of data; in the writing of the manuscript, or in the decision to publish the results. The statements, findings, conclusions, and recommendations are those of the authors and do not necessarily reflect the view of Maryland Sea Grant, the National Oceanic and Atmospheric Administration, or U.S. Department of Commerce.

References

  1. Food and Agriculture Organization of the United Nations. Food Wastage Footprint: Impacts on Natural Resources; Food Wastage Footprint Summary—United Nations: Rome, Italy, 2013. [Google Scholar]
  2. Gustavsson, J.; Cederberg, C.; Sonesson, U.; van Otterdijk, R.; Meybeck, A. Global Food Losses and Food Waste: Extent, Causes and Prevention; Swedish Institute for Food and Biotechnology, Food and Agriculture Organization of the United States: Rome, Italy, 2011; p. 37. [Google Scholar]
  3. Holt-Giménez, E.; Shattuck, A.; Altieri, M.; Herren, H.; Gliessman, S. We already grow enough food for 10 billion people … and still can’t end hunger. J. Sustain. Agric. 2012, 36, 595–598. [Google Scholar] [CrossRef]
  4. Buzby, J.C.; Bentley, J.T.; Padera, B.; Campuzano, J.; Ammon, C. Updated Supermarket Shrink Estimates for Fresh Foods and Their Implications for ERS Loss-Adjusted Food Availability Data; Economic Information Bulletin; Economic Research Service of the U.S. Department of Agriculture: Washington, DC, USA, 2016. [Google Scholar]
  5. United States Environmental Protection Agency. Facts and figures. In Municipal Solid Waste Generation, Recycling, and Disposal in the United States: Facts and Figures for 2009; Environmental Protection Agency: Washington, DC, USA, 2010; p. 13. [Google Scholar]
  6. Puccini, S. The plastics problem part 1: Plastic packaging and the solid waste crisis. Environs 1992, 16, 21–34. [Google Scholar]
  7. Geyer, R.; Jambeck, J.R.; Law, K.L. Production, use, and fate of all plastics ever made. Sci. Adv. 2017, 3, e1700782. [Google Scholar] [CrossRef] [Green Version]
  8. Yang, L.; Paulson, A.T. Effects of lipids on mechanical and moisture barrier properties of edible gellan film. Food Res. Int. 2000, 33, 571–578. [Google Scholar] [CrossRef]
  9. Debeaufort, F.; Martin-Polo, M.; Voilley, A. Polarity homogeneity and structure affect water vapor permeability of model edible films. J. Food Sci. 1993, 58, 426–429. [Google Scholar] [CrossRef]
  10. Belay, Z.A.; Caleb, O.J.; Opara, U.L. Influence of initial gas modification on physicochemical quality attributes and molecular changes in fresh and fresh-cut fruit during modified atmosphere packaging. Food Packag. Shelf Life 2019, 21, 100359. [Google Scholar] [CrossRef]
  11. Tsafrakidou, P.; Sameli, N.; Bosnea, L.; Chorianopoulos, N.; Samelis, J. Assessment of the Spoilage Microbiota in Minced Free-Range Chicken Meat during Storage at 4 °C in Retail Modified Atmosphere Packages. Food Microbiol. 2021, 99, 103822. [Google Scholar] [CrossRef]
  12. Gómez-Estaca, J.; López-de-Dicastillo, C.; Hernández-Muñoz, P.; Catalá, R.; Gavara, R. Advances in Antioxidant Active Food Packaging. Trends Food Sci. Technol. 2014, 35, 42–51. [Google Scholar] [CrossRef]
  13. Teixeira, G.H.A.; Cunha Júnior, L.C.; Ferraudo, A.S.; Durigan, J.F. Quality of Guava (Psidium guajava L. Cv. Pedro Sato) Fruit Stored in Low-O2 Controlled Atmospheres Is Negatively Affected by Increasing Levels of CO2. Postharvest Biol. Technol. 2016, 111, 62–68. [Google Scholar] [CrossRef] [Green Version]
  14. Singh, S.P.; Pal, R.K. Controlled Atmosphere Storage of Guava (Psidium guajava L.) Fruit. Postharvest Biol. Technol. 2008, 47, 296–306. [Google Scholar] [CrossRef]
  15. Conn, R.E.; Kolstad, J.J.; Borzelleca, J.F.; Dixler, D.S.; Filer, L.J.; Ladu, B.N.; Pariza, M.W. Safety Assessment of Polylactide (PLA) for Use as a Food-Contact Polymer. Food Chem. Toxicol. 1995, 33, 273–283. [Google Scholar] [CrossRef]
  16. Cheng, Y.; Deng, S.; Chen, P.; Ruan, R. Polylactic Acid (PLA) Synthesis and Modifications: A Review. Front. Chem. China 2009, 4, 259–264. [Google Scholar] [CrossRef]
  17. Lassalle, V.L.; Ferreira, M.L. Lipase-Catalyzed Synthesis of Polylactic Acid: An Overview of the Experimental Aspects. J. Chem. Technol. Biotechnol. 2008, 83, 1493–1502. [Google Scholar] [CrossRef]
  18. Albertsson, A.-C.; Edlund, U.; Stridsberg, K. Controlled Ring-Opening Polymerization of Lactones and Lactides. Macromol. Symp. 2000, 157, 39–46. [Google Scholar] [CrossRef]
  19. Gao, Q.; Lan, P.; Shao, H.; Hu, X. Direct Synthesis with Melt Polycondensation and Microstructure Analysis of Poly(l-lactic acid-co-glycolic acid). Polym. J. 2002, 34, 786–793. [Google Scholar] [CrossRef] [Green Version]
  20. Datta, R.; Tsai, S.-P.; Bonsignore, P.; Moon, S.-H.; Frank, J.R. Technological and Economic Potential of Poly(lactic acid) and Lactic Acid Derivatives. FEMS Microbiol. Rev. 1995, 16, 221–231. [Google Scholar] [CrossRef]
  21. Fahim, I.S.; Chbib, H.; Mahmoud, H.M. The Synthesis, Production & Economic Feasibility of Manufacturing PLA from Agricultural Waste. Sustain. Chem. Pharm. 2019, 12, 100142. [Google Scholar] [CrossRef]
  22. Meekum, U.; Khiansanoi, A. PLA and Two Components Silicon Rubber Blends Aiming for Frozen Foods Packaging Applications. Results Phys. 2018, 8, 79–88. [Google Scholar] [CrossRef]
  23. Aznar, M.; Ubeda, S.; Dreolin, N.; Nerín, C. Determination of Non-Volatile Components of a Biodegradable Food Packaging Material Based on Polyester and Polylactic Acid (PLA) and Its Migration to Food Simulants. J. Chromatogr. A 2019, 1583, 1–8. [Google Scholar] [CrossRef]
  24. Ingrao, C.; Tricase, C.; Cholewa-Wójcik, A.; Kawecka, A.; Rana, R.; Siracusa, V. Polylactic Acid Trays for Fresh-Food Packaging: A Carbon Footprint Assessment. Sci. Total Environ. 2015, 537, 385–398. [Google Scholar] [CrossRef]
  25. Weber, C.J. Biobased Packaging Materials for the Food Industry: Status and Perspectives: A European Concerted Action; KVL Department of Dairy and Food Science: Frederiksberg, Denmark, 2000. [Google Scholar]
  26. Chandra, R. Biodegradable Polymers. Prog. Polym. Sci. 1998, 23, 1273–1335. [Google Scholar] [CrossRef]
  27. Ahmed, J.; Varshney, S.K. Polylactides—Chemistry, Properties and Green Packaging Technology: A Review. Int. J. Food Prop. 2011, 14, 37–58. [Google Scholar] [CrossRef]
  28. Saeidlou, S.; Huneault, M.A.; Li, H.; Park, C.B. Poly(lactic Acid) Crystallization. Prog. Polym. Sci. 2012, 37, 1657–1677. [Google Scholar] [CrossRef]
  29. Suganuma, K.; Asakura, T.; Oshimura, M.; Hirano, T.; Ute, K.; Cheng, H.N. NMR Analysis of Poly(Lactic Acid) via Statistical Models. Polymers 2019, 11, 725. [Google Scholar] [CrossRef] [Green Version]
  30. Luo, F.; Fortenberry, A.; Ren, J.; Qiang, Z. Recent Progress in Enhancing Poly(Lactic Acid) Stereocomplex Formation for Material Property Improvement. Front. Chem. 2020, 8, 688. [Google Scholar] [CrossRef] [PubMed]
  31. Morehouse, K.; Komolprasert, V. Irradiation of Food and Packaging: Recent Developments; American Chemical Society: Washington, DC, USA, 2004; Volume 875. [Google Scholar]
  32. Sommers, C.H.; Fan, X. Food Irradiation Research and Technology; John Wiley & Sons: Hoboken, NJ, USA, 2008. [Google Scholar]
  33. Loo, J.S.C.; Ooi, C.P.; Boey, F.Y.C. Degradation of poly(lactide-co-glycolide) (PLGA) and poly(l-lactide) (PLLA) by electron beam radiation. Biomaterials 2005, 26, 1359–1367. [Google Scholar] [CrossRef] [PubMed]
  34. Huang, Y.; Gohs, U.; Müller, M.T.; Zschech, C.; Wiessner, S. Electron Beam Treatment of Polylactide at Elevated Temperature in Nitrogen Atmosphere. Radiat. Phys. Chem. 2019, 159, 166–173. [Google Scholar] [CrossRef]
  35. Malinowski, R. Effect of High Energy β-Radiation and Addition of Triallyl Isocyanurate on the Selected Properties of Polylactide. Nucl. Instrum. Methods Phys. Res. Sect. B Beam Interact. Mater. At. 2016, 377, 59–66. [Google Scholar] [CrossRef]
  36. Shin, B.Y.; Han, D.H.; Narayan, R. Rheological and Thermal Properties of the PLA Modified by Electron Beam Irradiation in the Presence of Functional Monomer. J. Polym. Environ. 2010, 18, 558–566. [Google Scholar] [CrossRef]
  37. Adamus-Wlodarcyzk, A.; Wach, R.A.; Ulanski, P.; Rosiak, J.M.; Socka, M.; Tsinas, Z.; Al-Sheikhly, M. On the Mechanisms of the Effects of Ionizing Radiation on Diblock and Random Copolymers of Poly(Lactic Acid) and Poly(Trimethylene Carbonate). Polymers 2018, 10, 672. [Google Scholar] [CrossRef] [Green Version]
  38. Ashfaq, A.; Clochard, M.-C.; Coqueret, X.; Dispenza, C.; Driscoll, M.S.; Ulański, P.; Al-Sheikhly, M. Polymerization Reactions and Modifications of Polymers by Ionizing Radiation. Polymers 2020, 12, 2877. [Google Scholar] [CrossRef]
  39. Benyathiar, P.; Selke, S.E.; Harte, B.R.; Mishra, D.K. The Effect of Irradiation Sterilization on Poly(Lactic) Acid Films. J. Polym. Environ. 2021, 29, 460–471. [Google Scholar] [CrossRef]
  40. Melski, K.; Kubera, H.; Głuszewski, W.; Zimek, Z. Effect of Ionizing Radiation on the Properties of PLA Packaging Materials. Nukleonika 2011, 56, 65–69. [Google Scholar]
  41. Paragkumar, N.T.; Edith, D.; Six, J.-L. Surface Characteristics of PLA and PLGA Films. Appl. Surf. Sci. 2006, 253, 2758–2764. [Google Scholar] [CrossRef]
  42. Migliaresi, C.; Cohn, D.; De Lollis, A.; Fambri, L. Dynamic Mechanical and Calorimetric Analysis of Compression-Molded PLLA of Different Molecular Weights: Effect of Thermal Treatments. J. Appl. Polym. Sci. 1991, 43, 83–95. [Google Scholar] [CrossRef]
  43. C16 Committee. Test Methods for Water Vapor Transmission of Materials; ASTM International: West Conshohocken, PA, USA, 2005. [Google Scholar] [CrossRef]
  44. Von Sonntag, C. (Ed.) Free-Radical-Induced DNA Damage and Its Repair: A Chemical Perspective; Springer: Berlin/Heidelberg, Germany, 2006; pp. 77–86. [Google Scholar] [CrossRef]
  45. Oliveira, J.E.; Mattoso, L.H.C.; Orts, W.J.; Medeiros, E.S. Structural and Morphological Characterization of Micro and Nanofibers Produced by Electrospinning and Solution Blow Spinning: A Comparative Study. Adv. Mater. Sci. Eng. 2013, 2013, e409572. [Google Scholar] [CrossRef] [Green Version]
  46. Enumo, A.; Gross, I.P.; Saatkamp, R.H.; Pires, A.T.N.; Parize, A.L. Evaluation of Mechanical, Thermal and Morphological Properties of PLA Films Plasticized with Maleic Acid and Its Propyl Ester Derivatives. Polym. Test. 2020, 88, 106552. [Google Scholar] [CrossRef]
  47. Garlotta, D. A Literature Review of Poly(Lactic Acid). J. Polym. Environ. 2001, 9, 63–84. [Google Scholar] [CrossRef]
  48. Torres-Huerta, A.; Del Angel, D.; Domínguez-Crespo, M.A.; Palma Ramírez, D.; Perales-Castro, M.; Flores-Vela, A. Morphological and Mechanical Properties Dependence of PLA Amount in PET Matrix Processed by Single-Screw Extrusion. Polym.-Plast. Technol. Eng. 2016, 55, 1132433. [Google Scholar] [CrossRef]
  49. Braun, B.; Dorgan, J.R.; Dec, S.F. Infrared Spectroscopic Determination of Lactide Concentration in Polylactide: An Improved Methodology. Macromolecules 2006, 39, 9302–9310. [Google Scholar] [CrossRef]
  50. Saeidlou, S.; Huneault, M.A.; Li, H.; Sammut, P.; Park, C.B. Evidence of a Dual Network/Spherulitic Crystalline Morphology in PLA Stereocomplexes. Polymer 2012, 53, 5816–5824. [Google Scholar] [CrossRef]
  51. Shao, J.; Xu, L.; Pu, S.; Hou, H. The Crystallization Behavior of Poly(l-Lactide)/Poly(d-Lactide) Blends: Effect of Stirring Time during Solution Mixing. Polym. Bull. 2021, 78, 147–163. [Google Scholar] [CrossRef]
  52. Tsuji, H. Poly(Lactic Acid) Stereocomplexes: A Decade of Progress. Adv. Drug Deliv. Rev. 2016, 107, 97–135. [Google Scholar] [CrossRef] [PubMed]
  53. Yasuniwa, M.; Tsubakihara, S.; Sugimoto, Y.; Nakafuku, C. Thermal Analysis of the Double-Melting Behavior of Poly(L-Lactic Acid). J. Polym. Sci. Part B Polym. Phys. 2004, 42, 25–32. [Google Scholar] [CrossRef]
  54. Yasuniwa, M.; Satou, T. Multiple Melting Behavior of Poly(Butylene Succinate). I. Thermal Analysis of Melt-Crystallized Samples. J. Polym. Sci. Part B Polym. Phys. 2002, 40, 2411–2420. [Google Scholar] [CrossRef]
  55. Yasuniwa, M.; Tsubakihara, S.; Ohoshita, K.; Tokudome, S. X-Ray Studies on the Double Melting Behavior of Poly(Butylene Terephthalate). J. Polym. Sci. Part B Polym. Phys. 2001, 39, 2005–2015. [Google Scholar] [CrossRef]
  56. Optically Active Polymers; Selegny, E. (Ed.) Springer: Dordrecht, The Netherlands, 1979. [Google Scholar] [CrossRef]
  57. Wang, Y.; Zhang, H.; Li, M.; Cao, W.; Liu, C.; Shen, C. Orientation and Structural Development of Semicrystalline Poly(Lactic Acid) under Uniaxial Drawing Assessed by Infrared Spectroscopy and X-ray Diffraction. Polym. Test. 2015, 41, 163–171. [Google Scholar] [CrossRef]
  58. Picard, E.; Espuche, E.; Fulchiron, R. Effect of an Organo-Modified Montmorillonite on PLA Crystallization and Gas Barrier Properties. Appl. Clay Sci. 2011, 53, 58–65. [Google Scholar] [CrossRef]
  59. Aliotta, L.; Cinelli, P.; Coltelli, M.B.; Righetti, M.C.; Gazzano, M.; Lazzeri, A. Effect of Nucleating Agents on Crystallinity and Properties of Poly (Lactic Acid) (PLA). Eur. Polym. J. 2017, 93, 822–832. [Google Scholar] [CrossRef]
  60. Bhatia, A.; Gupta, R.K.; Bhattacharya, S.N.; Choi, H.J. Analysis of gas permeability characteristics of poly(lactic acid)/poly(butylene succinate) nanocomposites. J. Nanomater. 2012, 2012, 249094. [Google Scholar] [CrossRef] [Green Version]
  61. Halasz, K.; Hosakun, Y.; Csóka, L. Reducing water vapor permeability of poly(lactic acid) film and bottle through layer-by-layer deposition of green-processed cellulose nanocrystals and chitosan. Int. J. Polym. Sci. 2015, 2015, 954290. [Google Scholar] [CrossRef]
  62. Karkhanis, S.S.; Stark, N.M.; Sabo, R.C.; Matuana, L.M. Water vapor and oxygen barrier properties of extrusion-blown poly(lactic acid)/cellulose nanocrystals nanocomposite films. Compos. Part Appl. Sci. Manuf. 2018, 114, 204–211. [Google Scholar] [CrossRef]
  63. Shogren, R. Water vapor permeability of biodegradable polymers. J. Environ. Polym. Degrad. 1997, 5, 91–95. [Google Scholar] [CrossRef]
  64. Kantoǧlu, Ö.; Güven, O. Radiation induced crystallinity damage in poly(L-lactic acid). Nucl. Instrum. Methods Phys. Res. Sect. B Beam Interact. Mater. At. 2002, 197, 259–264. [Google Scholar] [CrossRef]
Figure 1. Characterization of unirradiated PLA. (a) Average DSC cycle 1; (b) average cycle 2; (c) XRD diffractogram; (d) FTIR spectra (labels: 2994.96, 1746.74, 1451.68, 1080.44, 866.86 cm−1).
Applsci 12 01819 g001
Figure 2. (ac) Time series of EPR spectra for PLA irradiated at 4 different doses: 5 kGy (red), 10 kGy (blue), 15 kGy (pink), and 20 kGy (green). There were three time points used: (a) same day as irradiation (day 0); (b) day following irradiation (day 1); (c) second day following irradiation (day 2). (df) Dose–yield plots over the first three days. These measurements were taken twice at 5 kGy, twice at 10 kGy, four times at 15 kGy, and twice at 20 kGy. (d) Day 0; (e) day 1; (f) day 2.
Applsci 12 01819 g002
Figure 3. Time dependence radical concentration decay for PLA samples after irradiation at 5 kGy, 10 kGy, 15 kGy, and 20 kGy. The values at day 0 on the x-axis correspond to spectra that were taken a couple of hours after irradiation and kept in dry ice.
Applsci 12 01819 g003
Figure 4. Proposed mechanism for chain scission of PLA after electron beam irradiation.
Applsci 12 01819 g004
Figure 5. Stereoregular forms of PLA: (a) poly-D-lactic acid; (b) poly-L-lactic acid; (c) copolymer of P(DL)LA with equal proportions L and D subunits.
Applsci 12 01819 g005
Figure 6. FTIR spectra from samples irradiated at 0, 5, 10, 15, and 20 kGy in the absence of oxygen, followed by exposure to air after irradiation. (a) Comparison of spectra within the range of the C=O peak; (b) comparison of spectra within the range of the C-O peak; (c) full spectra.
Applsci 12 01819 g006
Figure 7. (a) Average cycle 1; (b) average cycle 2 for the unirradiated, 5 kGy, and 20 kGy samples.
Applsci 12 01819 g007
Figure 8. Diffractograms for unirradiated and 20 kGy irradiated PLA.
Applsci 12 01819 g008
Figure 9. Number average molar mass distributions for the unirradiated sample (black) and samples irradiated at doses of 5 kGy (green), 10 kGy (orange), 15 kGy (blue), and 20 kGy (red). The lines represent the number average molar mass Mn value (center) of each trace at the peak of the distribution.
Applsci 12 01819 g009
Figure 10. (a) Polymer dispersity as a function of absorbed dose of 0, 5, 10, 15, and 20 kGy, where dispersity is the weight average over number average molar mass; (b) number average molar mass Mn versus absorbed dose of 0, 5, 10, 15, and 20 kGy.
Applsci 12 01819 g010
Figure 11. Water vapor transmission rate of PLA at 5 different doses: 0 kGy (light green), 5 kGy (dark blue), 10 kGy (light blue), 15 kGy (pink), 20 kGy (yellow). Each point represents the average of samples measured at each dose.
Applsci 12 01819 g011
Table 1. The OIs of the C-O bond, using the peak at approximately 1100 cm−1, and the C=O bond, using the peak at approximately 1750 cm−1. Calculated using the CH3 peak at approximately 1450 cm−1 as a reference [49].
SampleOxidation Index of C-OOxidation Index of C=O
Unirradiated6.27 ± 0.1315.4 ± 0.31
5 kGy6.64 ± 0.1318.5 ± 0.37
10 kGy7.57 ± 0.1520.1 ± 0.40
15 kGy6.97 ± 0.1418.4 ± 0.37
20 kGy7.24 ± 0.1418.0 ± 0.37
Table 2. Average values of key thermal properties and crystallinity changes as a function of irradiation dose, calculated using DSC spectra obtained from the second heating cycle.
SampleGlass Transition (°C)Softening Point (°C)Percent Crystallinity (%)
Unirradiated60.8 ± 1.2153.3 ± 2.21.2 (negligible)
5 kGy59.6 ± 0.7152.3 ± 1.52.4 ± 0.12
20 kGy59.5 ± 0.9151.2 ± 0.87.3 ± 0.4
Publisher’s Note: MDPI stays neutral with regard to jurisdictional claims in published maps and institutional affiliations.

