Article

Comparative Agent-Based Simulations on Levels of Multiplicity Using a Network Regression: A Mobile Dating Use-Case

1
Massive Data Institute, McCourt School of Public Policy, Georgetown University, 37th and O Streets NW, Old North, Suite 100, Washington, DC 20057, USA
2
Department of Computational and Data Sciences, George Mason University, 4400 University Drive, Fairfax, VA 22030, USA
*
Author to whom correspondence should be addressed.
These authors contributed equally to this work.
Submission received: 14 January 2022 / Revised: 7 February 2022 / Accepted: 7 February 2022 / Published: 14 February 2022
(This article belongs to the Special Issue Multi-Agent Systems)

Abstract

:
We demonstrate the use of agent-based models to simulate the interactions of two mobile dating applications that possess divergent interaction features. We reproduce several expected outcomes when compared to extant literature. We also demonstrate the use of a standard social network analysis technique—the network regression, Multiple Regression Quadratic Assignment Procedure—in conducting a principled and interpretable comparison between the two models with strong results. This combined approach is novel and allows complex system modelers who utilize agent-based models to reduce their reliance on idealized network structures (small world, scale-free, erdos-renyi) when applying underlying network interactions to agent-based models that can often skew results and mislead from a full picture of system-level properties. This work serves as a proof-of-concept in the integration of classical social network analysis methods and contemporary agent-based modeling to compare software designs and to enhance the policy-generation process of online social networks.

1. Introduction

Complex systems and especially complex networks are difficult to model and even more difficult to compare in a principled fashion [1,2]. A renewed interest in the study of complex systems and the analytical methods used to study them (e.g., agent-based modeling, social network analysis, and network science) has reinvigorated numerous technical discussions [3,4]. Our effort focuses on developing a principled comparison of network agent-based models of mobile dating applications using off-the-shelf techniques as a use-case. Dating applications provide ideal conditions for a demonstration of these techniques in an agent-based framework as they reduce the sample space of interactions that an agent may take into but a few possibilities—making them easier to model than full-fledged social systems unconstrained by software interfaces. Interfaces—the graphical design of applications—constrain interactions of agents by restricting choices, and as a consequence, render behaviors amenable to modeling efforts through a variety of techniques. Recent efforts in modeling dating applications through an agent-based methodology have succeeded in further illuminating this area of inquiry [5,6,7] and serve as a rich intersection of scholarship in agent-based methodology, network science, and social network analysis.
Our approach is to showcase a principled comparison of agent-based simulations through a network regression [8,9,10]. The approach of comparing, validating, and calibrating agent-based simulations through external equation-based models has been shown possible [11,12]. However, none have proposed a similar pathway specific to network simulations where predominant classical approaches fail to model the dyadic nature of networked datasets [13,14]. One type of network regression—the multiple regression quadratic assignment procedure (MRQAP)—allows for a baseline comparison of cross-sectional networks that emerge a collected dataset and thus from a specified dynamically simulated process [15,16,17,18]. Networks carry unique features of non-independent and dyadic observations making them especially difficult to model under common assumptions. Moreover, since dating systems are practically matching systems in bargaining games [19,20,21,22,23,24,25] with possible analytical solutions under assumptions of homogeneity and uniformity [26,27,28], dynamics of heterogeneous agents possessing wide-ranging preferences challenge analytical models to reproduce real-world patterns. Our approach is inclusive of the potential for heterogeneous agents in the simulation phase, and with MRQAP, is sensitive to heterogeneity in the analytical phase.

1.1. Online Dating

The importance of mobile dating applications cannot be overstated. Mobile dating applications have experienced significant growth in user adoption with 15 of the most popular commercial instances acquiring 247 million downloads in 2018 [29]. Roughly 15% of all U.S. adults report using a dating application to find a mate. By 2021–2022, the market focused on virtual matching is expected to reach $3–$5 Billion (U.S.) and year-over-year growth of 25% [30,31]. The surge in mobile dating growth is driven by several factors, including more accepting social norms, better accessibility and online disinhibition effects [32,33]. 44% of Americans indicated that “online dating is a good way to meet people” [34]. By 2013, 59% agreed with this statement and 21% indicated that “online dating has lost much of its stigma”.
Today’s mainstream mobile dating applications offer common features and a market-driven universal user interface, but they continue to vary in levels of multiplicity—that is—the number of features available to users in order to achieve some desired result. Often, the desired result is finding a suitable mate but other outcomes are sometimes intended [35]. Although previous research has explored several aspects of online dating, e.g., recommender systems [36,37], online disinhibition [32,38], mate preferences [20,21,39], and self-presentation [40,41,42,43], few works have tended towards a system-level agent-based modeling approach (see [24,44]).
Tinder is one popular mobile dating application partly due to its simple and user-friendly interface. Tinder generates an estimated 15 million matches daily [30] and has been the subject of several empirical review studies [45,46,47,48]. Once installed on a mobile device new users are prompted to create a profile to showcase themselves to potential matches. Profiles consist of images uploaded by the user and a single text-based input field that can be used as a profile summary. More recently, a field in the user interface for “Interests” was also incorporated. Upon completion of a profile, users can choose matching preferences based on age, gender, distance, location and other attributes. Users sort sequentially through profiles of potential matches shown to them by the application’s recommendation algorithm. Users can then perform an action to either accept (like) or reject (dislike) any given profile presented to them by the embedded algorithm. After each decision action has been made, a user is presented with a new profile and the acceptance/rejection process is repeated. Consequently, when two users ‘like’ each other, a notification is displayed. This is deemed a ‘match’ and users can then communicate directly in a virtual private messaging room.
Other mobile dating applications have continuously emerged with unique features and interfaces. Hinge—another popular mobile dating application—allows users multiple pathways to match, extending the Tinder-like accept/reject functionality while providing more powerful search features. Hinge-like applications allow users the option to create more detailed profiles that specify ethnicity, political views, desire to have children, and other common attributes and preferences. Users can also enrich their profiles with clever prompts that enhance their appeal to visitors; profile visitors can ‘like’ these or comment on them. Like Tinder, when mutual likes occur users are then ‘matched’ and personal interactions can proceed. A key difference between Tinder-like applications and Hinge-like applications is the requirement that users mutually ‘like’ one another prior to activating communication features. Distinctively, Hinge-type applications allow users to send messages concurrently with ‘like’ actions if they desire, while Tinder-type applications require a match before communication can occur. This enables communication as an embedded feature in the ‘like’ request for applications similar to Hinge and allows for more specialized matching strategies. The ability to send a message with a like request differentiates Hinge-type from Tinder-type applications in important ways and creates more decision pathways to reach a match, which we dub, multiplicity. We argue that the multiplicity of dating applications plays a principal role in aggregate system outcomes and the overall experiences of users. Moreover, we argue that users can navigate the range of available applications to maximize their dating potential and match utility based on the advantages or disadvantages of the system-level multiplicity of considered applications. To that end, users who have not generated much interest when using Tinder-type applications can opt to utilize a user interface that allows for a more specialized matching strategy; perhaps one that places more emphasis on tailored personal messages rather than strict personal attributes (e.g., age, ethnicity, education). A more specialized strategy can only be undertaken on dating systems that allow for multiple pathways to matching—those with a higher multiplicity. Consequently, multiplicity could be directly correlated with match success for non-majority groups who must select a specialized mate-selection strategy often divergent from the mainstream.
How users of online dating platforms evaluate each other is still considered an open question [49]. Principally, online dating relies on attraction between two individuals. Zang et al. [50] propose that objective attraction based on user interaction correlates with ratings of personal photographs posted on online dating platform. The evidence to support that photographs play an important role is strong indeed. However, the evaluation process is much more complex with race [51], income [52], education [53], and trustworthiness [54]. However, one dominant social process emerges from the myriad of factors governing dating dynamics: With variable degree. online dating users often possess homophilic and assortative tendencies in attractiveness, education, race, income and other important attributes [55,56,57,58,59,60,61,62,63,64,65] with few exceptions [66].
Thus, we rely on homophily [67,68,69,70] as a primas inter pares foundational driver for our virtual experiments. We incorporate this sociological framework in our models though, admittedly, ancillary sociological processes contribute to the overall potential of matching and mate selection on online dating platforms. The principle of homophily implies that “people’s personal networks are homogeneous with regard to many sociodemographic, behavioral, and interpersonal characteristics” [71]. Homophily is a powerful social dynamic which often indicates that agents prefer those who are similar to themselves in many areas of social, economic, and cultural discourse. As a cognitive process, it is shown to be correlated with incentives for positive interactions resulting from shared knowledge, beliefs, and attributes. In the context of online dating, perceived similarity has been shown to correlate with positive attraction. For example, Fiore et al. [72] measure the effects of homophily in mate selection by sampling a pool of users on an online dating application and compared their preferences for potential partners over a range of selection categories. In this study, an analysis of similarities such as desire for children, level of education, and physical appearance explains selection criteria for online dating users. They report that similarity increases the likelihood of a match. There is much evidence that support these findings [64,73,74,75]. Our approach incorporates general notions of homophily in age, physical attractiveness, and ethnicity using a mix of discrete uniform categorical (ethnicity, gender) and continuous uniform (age, attractiveness) input attributes to generate an agent-based simulation. Since we intend this as a demonstration of principled comparison of two agent-based models, restricting our model to uniformity in the generation of agents’ attributes provides a baseline of analysis and reduces the possibility that our conclusions are influenced by our agent population generative choices. Thus, homophily is a reasonable choice as the theoretical framework for model design.

1.2. Our Approach

Presented are principal models of two dating application agent-based simulations, one with a low multiplicity representing applications such as Tinder, and another with a higher level representing applications such as Hinge. We dub them Multiplicity Level 1 (M1) and Multiplicity Level 2 (M2), respectively. Both models were assigned rule-sets with the purpose of replicating their respective real-world counterparts. Our approach combines agent-based modeling and classical social network analysis as our go-to analytical frameworks. As outputs from our simulation models we construct networks containing various link types reflecting agent interactions through the simulated mobile dating application. We define a ‘like’ interaction as a one-sided, directed tie representing interest of a sender agent to some receiving agent, a ‘match’ as dyadic interest of two agents (two-directional ‘like’ links), a ‘dislike’ as a directed rejection, and a ‘message’ as a combination interaction (mechanistically, we model this as a ‘like’ with a higher probability of a response). Through implementation of numerous simulations we investigate the contribution of various mechanisms in generating matches. Figure 1 presents the interplay of various mechanism as a multi-layer network with the visibility network unrecorded by our simulation and the like and match networks being central to our comparisons and overall analysis.
This paper advances the state of the art in social network simulations in several ways. Primarily, the paper relies on social science theory to simulate an application’s interface using well-studied social effects drawn from peer-reviewed literature. Although this approach is not common in the social sciences it is common in the applied sciences. We utilize two forms of public datasets variously. The first is aggregate data from non-peer reviewed sources, much of which is not held to high empirical standards in collection or reporting, mitigating proper and standard evaluations of data integrity. Much of this data contains summary totals of likes and matches listed on online sources. It has been shown that the connection between aggregate data sources and agent decision rule probabilities is generally non-linear and mathematically intractable [1] rendering such data sub-optimal and we use them as a guide rather than as a rule for developing agent decision-rule probabilities. The second form—which we utilize in a stylized manner—is drawn from empirically reviewed sources (e.g., [76]), and this collection of data and models offer statistical agent attribute and behavioral insights into the mechanics of online mate selection. We consider them sufficient in offering insights towards our central question: How does the multiplicity of dating applications affect agent and aggregate matching outcomes through a comparison using network regressions?

2. Materials and Methods

We use the Python programming language and the NetworkX module [77] to build our model and run simulations. We use NetworkX’s node functionality to represent the agents of our model, and the link functionality to represent interactions between the agents (likes or messages) (Our model code is published on Github: https://github.com/Jophelias/ABM-MRQAP-Dating-Model, accessed on 1 February 2022). To test the effects of multiplicity on agent behaviors using a comparison regression we chose to allow agents in M1 to reject or like other agents, but in M2 to reject, like, or like/message other agents. Importantly, this means that mechanics of the M2 model (similar to Hinge-type applications) also allow for agents consider previous likes or messages from agents under consideration. If agents discover previous positive interactions then the probability of them reciprocating positively is increased.
To ease the process of comparing outputs from our models, the number of agent attributes were kept to a plausible minimum and kept consistent across both models. Agent populations were endowed with a binary gender (male and female), a generic ethnicity chosen from 4 categories, physical attractiveness (between 0 and 1), and age (18–65). All agent attributes were assigned uniformly with some being assigned globally such as threshold for an interaction. Table 1 details our agent attribute selections across both M1 and M2 simulation models.
In both model variations (M1 and M2), we restrict population size to 1000 agents. To duplicate users’ time constraints and in some instances online applications’ fixed limits (Tinder fixes the number of likes per day that a user can generate under their basic plan), 40 agents are viewed by each agent in the simulation for evaluative purposes in every turn of the simulation. Additionally, dating applications will often present users with profiles within a set age range and so agents in our models are only presented with those who are within 10 years of age difference. Finally, each agent evaluates a compatibility score of the considered agent and records an appropriate ‘like’ or ‘dislike’ response based on globally set thresholds. At conclusion of each simulation run, rejects, likes, messages, and matches are tallied along with the attributes of the agents generating them.

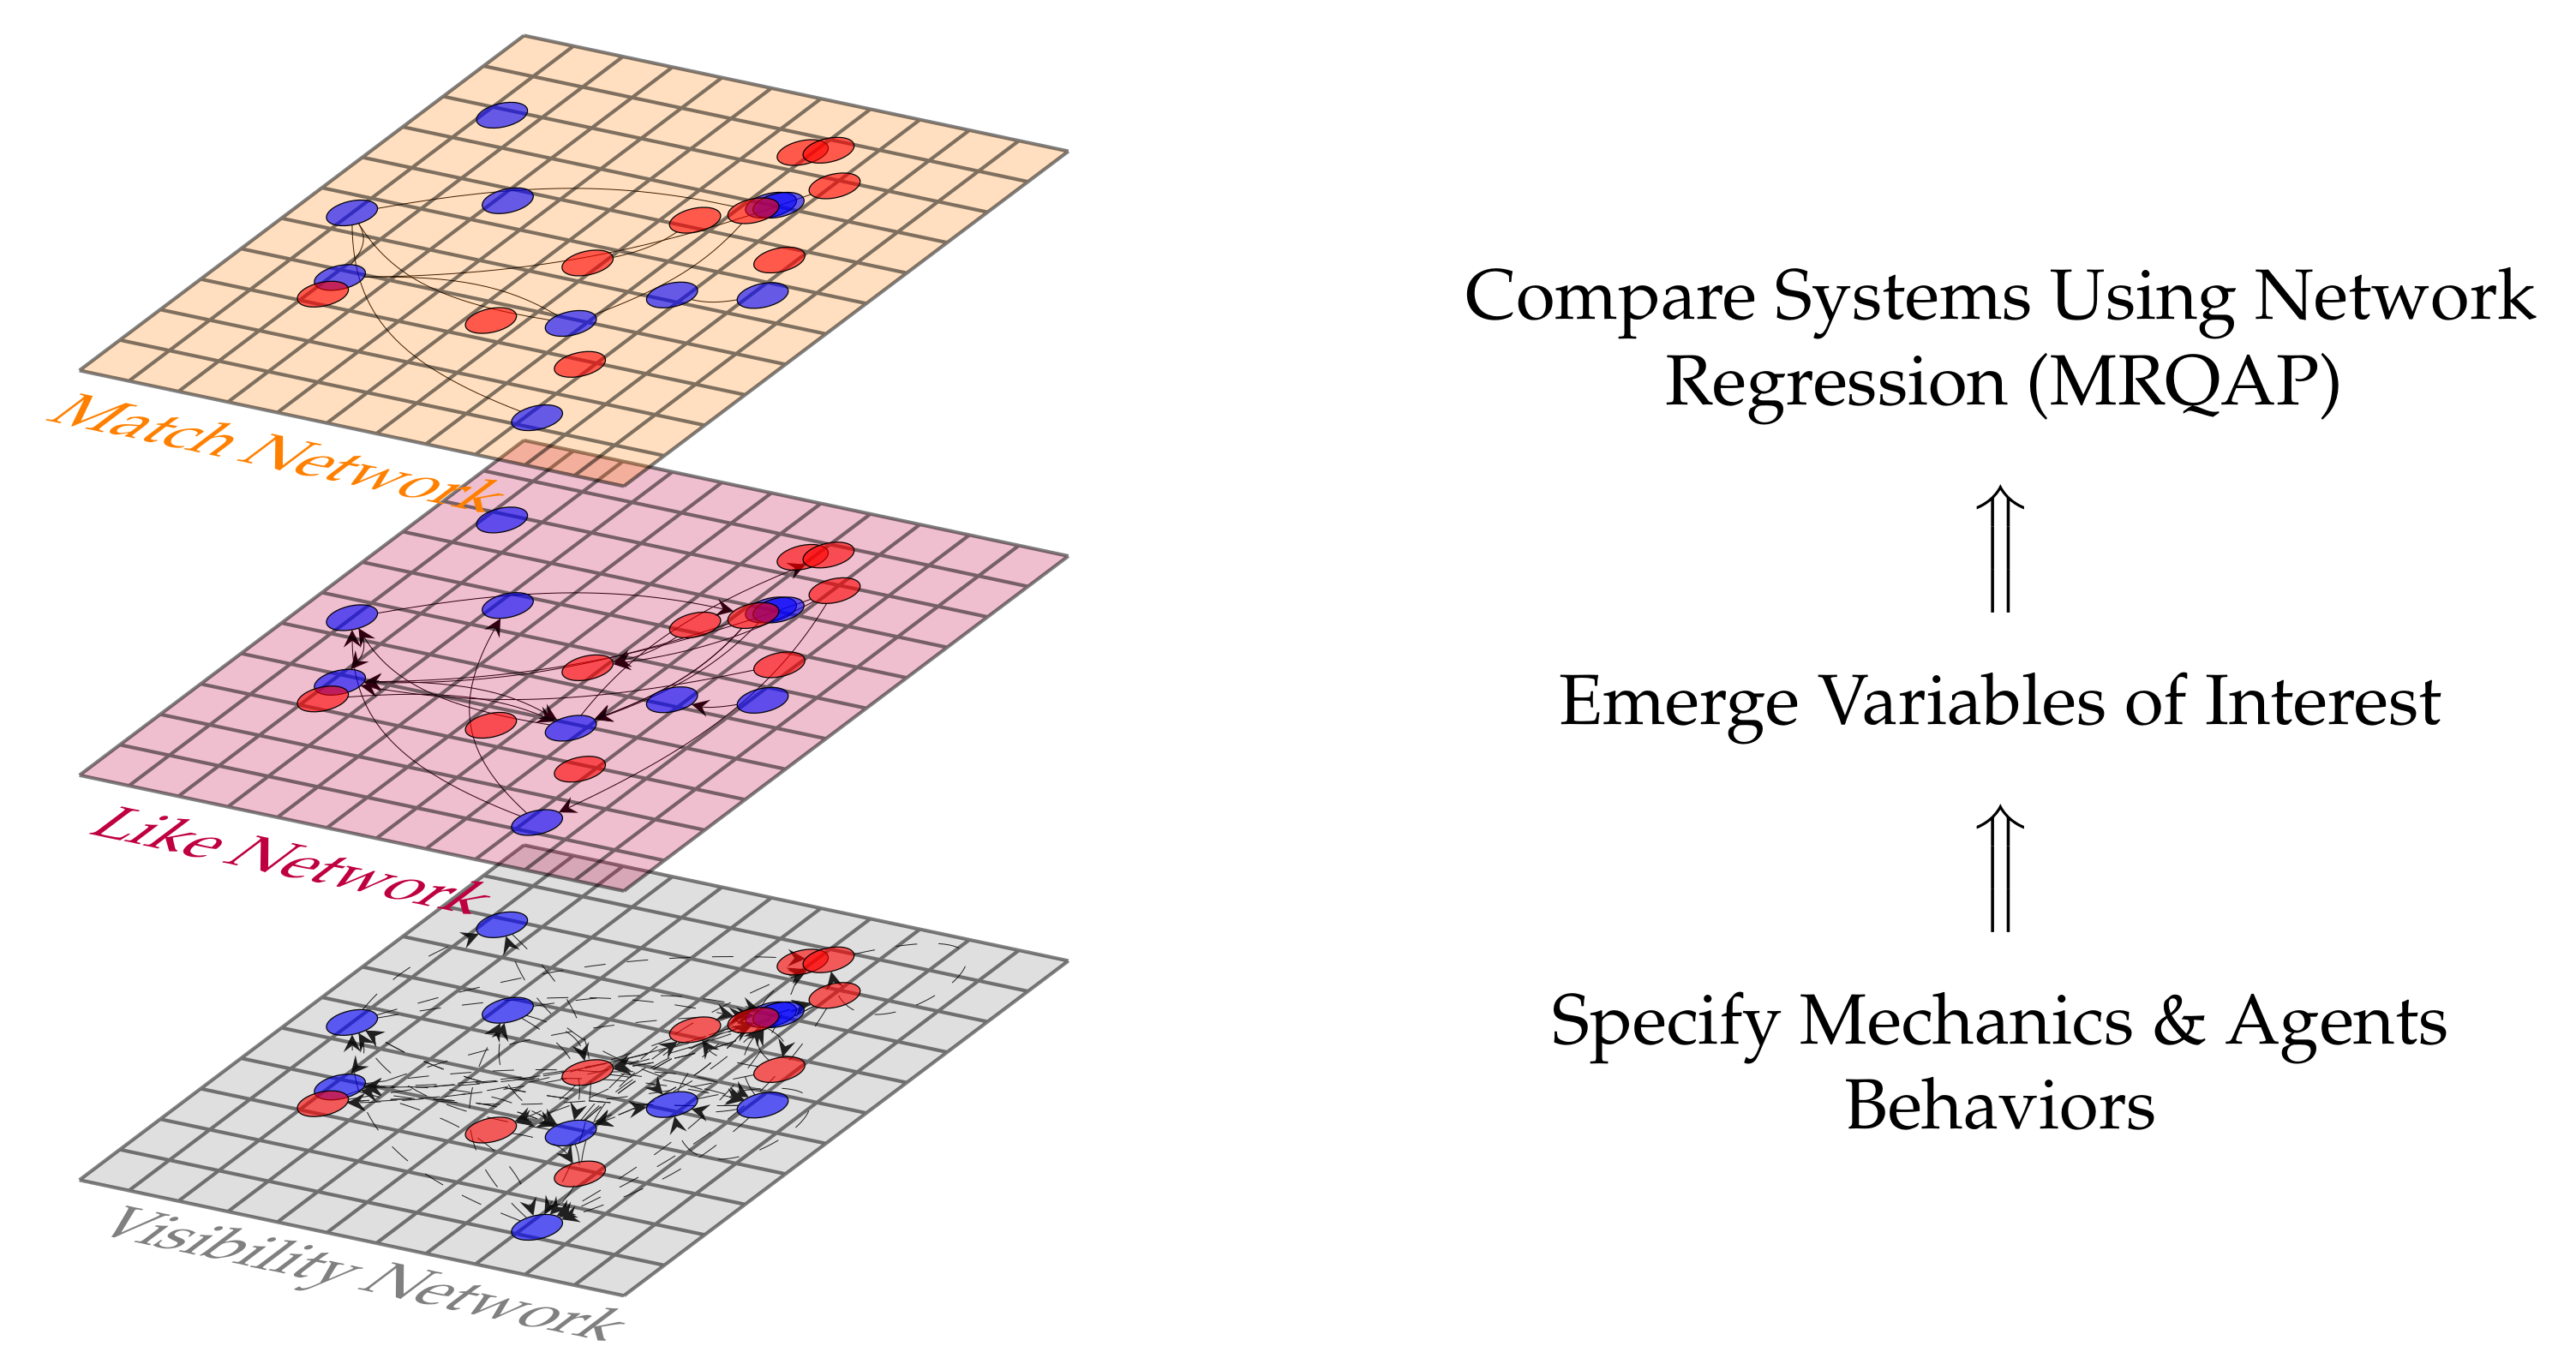
2.1. Principal Model Mechanics

In line with homophily as our model’s foundational driver we incorporate a scoring mechanism that governs agent decisions. And, as the score increases, a greater likelihood of a like and potentially a match between any two agents occurs. The model’s scoring mechanism assigns a compatibility score based on the attributes of alter (receiving agent) and the preferences of ego (sending agent). Applying a basic threshold criteria, if a given compatibility score exceeds ego’s compatibility threshold C , the probability of a ‘like’ is set to some maximum-allowed parameter value. If this threshold is not reached, the probability of a “like” is minimized but remains non-zero to account for other factors not included in our simulation. We chose probability parameters arbitrarily in the absence of micro-data from application developers, but relied upon intuition to guide their relative magnitudes. If assembled agents record a bi-directional “like”, a “match” is recorded. This threshold assignment is consistent with social threshold models [78] and their dating counterparts [20].
Detailed program schematics are presented in Figure 2, Figure 3 and Figure 4. Of note is the reduction of the M2 model to M1 once message capability and previous encounters are removed. Thus, M2 is of a higher multiplicity than M1. Furthermore, in order to ensure our regression comparisons are equivalent, we ensure that the sum of conditional probabilities of a reject, like and like/message are consistent across both models and thus that the probability for every agent in either simulation model receiving a response of a positive nature is equivalent. This was further verified by conducting a verification to be presented in the next section.

2.2. Agent Preferences

Table 2 summarizes all agent rule calculations in formulaic form. As shown model behavioral rules remain consistent with homophily as the total compatibility score is generated from homophily in race, attractiveness, and age with some detailed parameter estimates used in age preferences (males preferring younger female and females preferring older males). As agents are randomly selected in every turn of the model they will evaluate whether to like each other based on these attributes and comparison with a globally set threshold C . Generally, threshold levels determine the likelihood of a like or dislike event occurring and the resultant probabilities are detailed in Figure 3 and Figure 4.
Parameter estimates are drawn from several peer-reviewed sources from within the literature on online dating. To begin, male agents were given a Gaussian preference for younger female agents where the mean difference was 3.996 years, and female agents were given a preference for older males with a mean difference of 2.046 years [79]. The compatibility score is intended to ensure that maximum score contributed by age resides at this mean, and the greater the difference from this mean difference, the lower the contribution of age to the total compatibility score. Physical attractiveness and ethnicity are based on similar principles. As we have noted, agents evaluate ethnicity and attractiveness based on the concept of homophily with much higher scores attributed when two agents of the same ethnicity or a similar attractiveness interact.
We also utilized a weighing mechanism for both male and female agents as genders value attributes differently when conjoint with more attributes. The weights are multiplied by the agent-agent interaction scores then summed to yield a total score. Total compatibility score, S T o t a l , is then compared to a threshold value, C , to determine the occurrence probability of a like or like/message relation. In line with Greenlees et al.’s [80] study showing that males value physical features more than females, male agents were given a higher weight ( β 3 M = 0.4 ) for attractiveness preference than for female agents ( β 3 F = 0.3 ). Fisman et al. [81] concludes that females place greater weight in finding a potential match within their own ethnicity and so we adjusted the weighing and contribution for ethnicity to account for this ( β 1 F = 0.4 , β 1 M = 0.3 ). Finally, the weighing of scores on age by both genders remained the same (0.3) as there was little evidence that the contribution to a total score was gender-divergent even in light of different age preferences for males ( μ = 4.0 ) than for females ( μ = 2.05 ).
Since our model is subject to theoretical matching system fundamentals [27], synthetic population structure and heterogeneity play an important role in model specification. In this regard, the choice of male to female agent ratios could, if chosen unwisely, create unintended consequences and artifacts in our model. Thus, we rely on McGrath’s work [34]: The author reports that Tinder’s user base is roughly 60% male and 40% female. Though this statistic is a rough estimate drawn from non-peer-reviewed sources, we consider it a guide (and not a rule) to our implementation and model specification. As a result, we chose population proportion parameters consistent with the overall notion that there are many more males than females on dating applications at a rate of 68% men and 32% women in line with the general principle of a 2:1 ratio.
Once agents are presented with a profile to evaluate, they proceed with said evaluation ( S [ 0 , 1 ] ) against a pre-set parameter to determine whether they will reject, like, like/message the considered agent. These threshold parameters are assigned according to the following intuitive patterns:
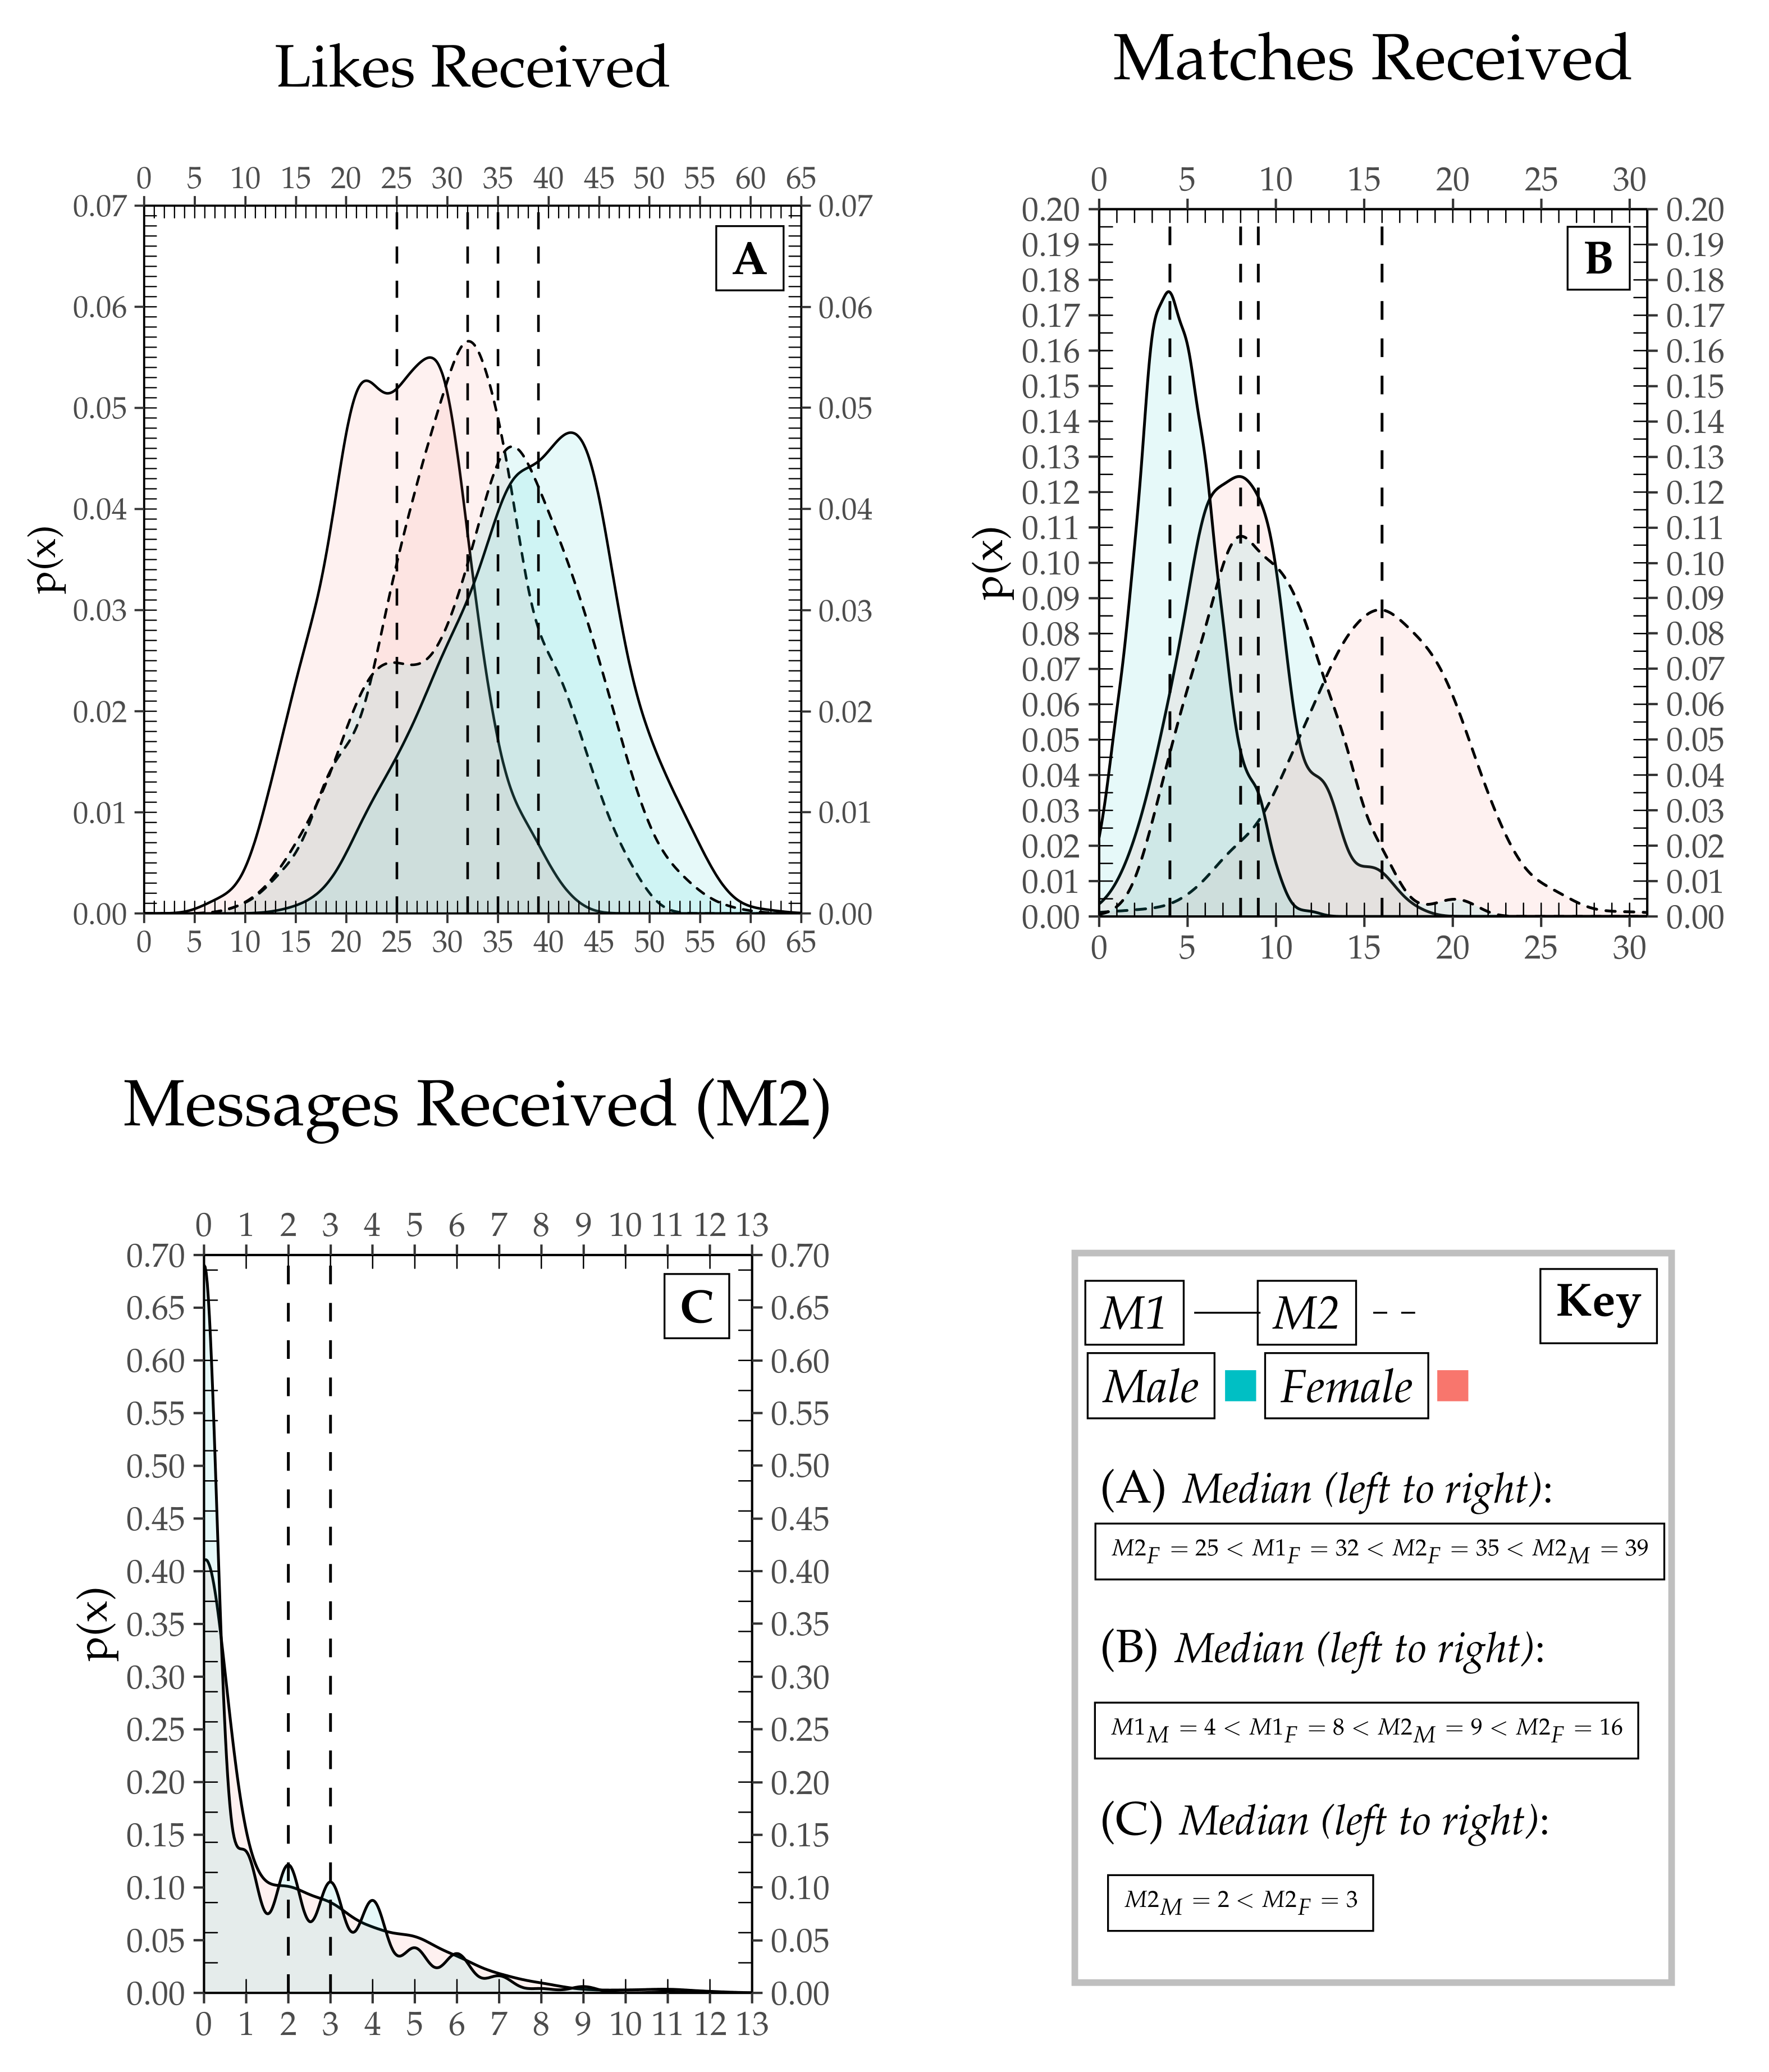
  • Female agents threshold for a ‘like’ are higher than male agents [82]. [M1 & M2]
  • The probability of a ‘like’ when the compatibility threshold is not achieved ( ( C ) < S T o t a l ) is non-zero. It is reduced but a reject, like, and like/message may still occur. [M1 & M2]
  • A like with a message is still subject to the same aforementioned compatibility thresholds, but increases the probability of a reciprocal like event. [M2]
  • Previous positive interactions (reciprocity) increases the probability values of like and like/message. [M2]
All thresholds, probabilities, and decision junctures are summarized in Figure 2, Figure 3 and Figure 4. Furthermore, while threshold levels and probabilities are homogeneous, each agent’s compatibility score for every other considered agent is heterogeneous and dependent on both ego and alter’s attributes. This ensures that agents’ internal standard for acceptance of a potential mate are antecedents in maintaining individual and independent preferences in agent-agent interactions. To illustrate, consider a female agent F 1 with ethnicity = E, age = 30, and attractiveness = 0 or {E, 30, 0} who evaluates a male agent M 1 with attributes {E, 32.046, 0}. Given our model rules F 1 will calculate that M 1 ’s compatibility with her is 0.4 0.5 + x U [ 0 , 1 ] 2 + 0.3 ( 1 ) + 0.3 ( 1 ) . If we assume that x U [ 0 , 1 ] = 0.4, then F 1 will view her compatibility with M 1 as 0.3 + 0.3 + 0.3 = 0.9 or 90%. The M1 model specifies that since her compatibility score is greater than the designated threshold, 0.4 (Figure 3), then there is an 80% probability of a ‘like’ occurring. If the compatibility score was less than 0.4, the probability of a ‘like’ would be 30%.
This previous example illustrates the general mechanics of the M1 model (e.g., Tinder) where a message may not be sent with each like interaction. In model M2’s specification (e.g., Hinge) two key differences exist. Firstly, agents may choose to send a ‘like’ or a ‘like with a message’. We assume that a like with a message increases the probability of a reciprocated like (we assume messages are positive and well-suited). Consequently, it should be evident that the second key difference between our specified M1 and M2 Models is that ego in M2 considers the like of the alter in their decision to like alter. This latter effect is known as reciprocity [83] and is a direct result of the difference in our hypothetical application’s user interfaces and multiplicity—the difference being that applications such as Hinge (M2) allow users to attach a message with a like prior to matching, while applications such as Tinder (M1) do not. This forces users to evaluate incoming interactions not only based on the sender’s attributes, but on the message attached to the interaction as well. We chose to specify all decision points as Bernoulli tests in (U[0, 1]) and that coefficients attached to our formulaic rules (Figure 1) scale the compatibility score to be within [0, 1] to ensure a one-to-one comparison scheme.

3. Model Comparison

As we have noted, our objective is to compare two models with varied multiplicity levels in terms of aggregate outcomes. We chose to focus our effort on matches that agents accumulate in each model. We carried out a formal inquiry of the statistical parameters and distributions of likes, messages, and matches as well as evaluated conditional distributions through a network regression—the Multiple Regression Quadratic Assignment Procedure—a suitable method for our analysis that accounts for our model’s rule dependencies without inappropriate assumptions. While the literature on methods of network comparisons is copious [84], we chose MRQAP for its minimal assumptions, ability to include heterogeneous agent profiles, and for its relative ease of interpretation, reducing output comparisons to a comparison of coefficients of a regression model.
The Multiple Regression Quadratic Assignment Procedure (MRQAP) is used to test for significance in an observed correlation where dependency between two or more dyadic relations may exist [17]. MRQAP relies on a non-parametric permutation-based test that preserves the integrity of the observed network structure to report confidence. This approach was originally developed by Mantel and colleagues [15] to identify geographic clustering of diseases [17]. Mantel et al. noted that covariates in geographic datasets are highly co-dependent and typically not independently and identically distributed (i.i.d.) due to a co-evolution of relational processes. Consequently, the covariates are unsuitable for regression models that assume independence of observations—such as the method of Ordinary Least Squares (OLS).
MRQAP has been developed and deployed as a mainstream network analysis tool. The procedure is particularly useful when calculating coefficient magnitudes and parameter estimates, and as a corollary, the strength of social effects through permutations of network statistics. Since our synthetic population samples, rules, attributes, and mechanisms are not i.i.d., we relied on this standard social network analysis model to compare outputs from our simulations. To summarize the method’s mechanics: MRQAP provides regression coefficients as does classical regression models (ordinary least squares), but its’ assumptions do not fall within the General Linear Model (GLM). Since we cannot guarantee some of the basic assumptions of OLS when considering relational data structures—assumptions such as bivariate normality or the independence of observations—MRQAP calculates coefficient estimates as does a linear regression procedure, but permutes the dependent and independent variables on the structure of the network [85] yielding conditional p-values. Simply put, MRQAP answers: How likely is a model description given a randomization of the dependent variable on the network’s structure?
As we have explained, MRQAP is well-suited for our comparative aims: Consider that M1 (Figure 3) emulates the simplest dating application interface—an example we repeatedly cite is Tinder. We begin our analysis by considering likes and matches as edges in a network (ties), and thus we frame our output analysis as a network analysis with edges within both simulations’ code-base reflecting all temporal interactions through the application’s interface as edges in a network. Our analysis is then conducted using the cross-sectional network emerged from the temporal interactions. Framing our analysis in this way allows for the use of MRQAP and its powerful permutation-based statistical assumptions while accounting for non-independence in our model with minimal interfering assumptions.
To compare M1 to M2, we consider their shared output; In this case the common output is matches. We ensure that inputs among the two models are identical for a one-to-one comparison. A synthetic population instantiated for M1 can apply M2’s behavioral rules without loss of generality and vice versa. We use ethnicity, age, physical attractiveness as input attributes, and likes as an input variable in the network regression model. In turn, if we observe a statistical difference in the models’ parameter estimates, given that we have randomly generated synthetic populations in both models according to the same rules, then this difference must be due to the difference in agent behaviors between the two models and not due to the attributes of the agent population. In our case, the difference between M1 and M2 lies squarely in an increase in multiplicity. The M2 model allows for the sending of a message with a like and M1 does not—hence, reciprocity as a social effect. In the Section 4, we present typical results from a representative run of 1000 nodes for both model types and Figure 3 and Figure 4 contain visualizations of the agent decision processes in both simulations.

Internal Validation

Our primary process of internal validation was to ensure that all synthetic populations were generated to our strict requirements of uniformity for attractiveness [0,1], age [18–65], and ethnicity (categorical) [A, B, C, D]. Table 3 and Table 4 show the results of a representative comparison between generations of a synthetic population. The tables show agreement with our expectations and supply confidence that our code-base is reflective of our models’ specifications. Since our goal is to quantify the difference of the models based on the given multiplicity of dating applications or the structure of this particular system, no further statistical validation of agent attributes was necessary since the outputs-given-structural-differences is the measure of comparison in this case.
To elaborate further, we would expect that the mean attractiveness for our population would be roughly 0.5 since we designated this variable as U[0, 1], ≈42 years of age as the mean value between 18 and 65, and for ethnicity—a categorical variable—to be equally scaled among the 0th, 25th, 50th, and 75th percentiles (lower bounds). This is clearly shown in our reported tables.

4. Results

As a summary measures comparison may indicate preliminary differences between models, we consider the general shape and location of the probability distributions of likes (Figure 5A). This distribution was similar by design in both M1 and M2 with male agents generating more likes than female agents M 2 F = 25 < M 1 F = 32 < M 2 F = 35 < M 2 M = 39 . Male and female agents in both models liked and rejected other agents according to a bell-shaped distribution. Because both models can essentially be viewed as matching processes, lower counts of female agents meant that male agents will like more frequently given a fixed amount of activity per turn. Overall, there was no statistical difference in the total number of likes when comparing M1 to M2 without conditioning on gender between the models. Table 5 shows the result of a paired t-test comparing the mean difference between statistics in M1 and M2. Excepting like relations, which we designated to be equivalent in both simulations, we found statistical differences between the model types in matches and in like/messaging; the latter by design and the former as an emergent phenomenon. This is an early indication that while we ensured similar like distribution profiles for M1 and M2, with a verifiable identical visibility and liking process (refer to Figure 1) the agents’ behaviors produced divergent pattern in the matching distribution.
Thus, similarity in the liking distribution did not result in similarity in matching distributions (Figure 5B) either by gender or by model type. In fact, even with M1 males receiving more likes in M1 than all other agents by median values, males in M1 received less matches than all others across both genders and simulations ( M 1 M = 4 < M 1 F = 8 < M 2 M = 9 < M 2 F = 16 )—an interesting emergent phenomenon.
Furthermore, Table 6 and Table 7 show that dispersion was greater for both agent genders in M1 when compared to counterparts in M2 simulations implying a less focused matching procedure with less specialized strategies as we know to be so. Interestingly, the probability distribution for female agent matches exhibited a longer tail, with top female agents receiving 2–3 times the number of matches of median males in M1 and 3–5 times the median male agents in M2. This implies a greater clustering of matches for female agents than for male agents. However, the median number of matches for male agents in M1 was lower but much more probable than either its female agent analogue with male agent median value in M1 representing 17% of sample compared with 12% for female agents and 11% and 8% for M2 agents, respectively.
Messaging distribution (Figure 5C) analysis was relatively straightforward to consider since agents in M1 simulations did not possess the ability to send messages. M2 agents received a median of 2 messages for male agents and 3 messages for female agents and the messaging probability distribution carried a right skew with some agents receiving more than 10 message per simulation run. Of central interest is the mean number of matches ( μ ) generated by M1 when compared to M2—almost precisely double. What is of additional significance is the variance reduction and shorter tail of M2. Specifically, the coefficient of variation for M1 is 0.42 while for M2 we calculate it as 0.53. This suggests a more even and equal distribution of matches among nodes—or in real-world terms, agents who were previously unsuccessful in receiving many matches in M1 receive more matches in M2, hinting towards the emergence of specialized strategies.

4.1. Networks & Regression Models

By framing our outputs as networks of interactions between agents, the resultant networks shown in Figure 6 gain additional significance. Since much of the model mechanism of underlying agent rules was intentionally stochastic so would be our outputs. Nevertheless, non-random structure is evident and it can be presumed as having emerged from model rules. M1’s match network produced a large component and many isolates, indicating that small preferences (in age for example) can produce clusters of nodes where there is high matching probability. The M2 match network showed highly dyadic structure (rather than transitive, as in in M1) suggesting that agents matched with one or two other agents, but not within larger clusters of agents as in M1. Interestingly, the like networks of both models are characterized by an even distribution of likes along a few large components with M2 also including many small isolates and isolated dyads.
To ensure a principled comparison, we utilized the network regression technique—MRQAP [15]—to investigate the relationship of our monadic and dyadic covariates. MRQAP requires that we convert node attributes such as attractiveness, age, and ethnicity into difference (or similarity) adjacency matrices. Intended as a one-to-one comparison, the models in Table 8 included the ‘like’ network, attractiveness difference, age difference and ethnicity difference as independent/predictor variables and the ‘match’ network as the dependent variable. We consider the effects of covariate inputs on producing a match as an output given the multiplicity of our two model types.
Reported are three models of interest—a single model describing M1 simulation results and two models for M2 simulation runs, the first of which is a model without an effect for messaging—a false model—the second of which (M2-T) includes the ‘message’ network as an independent variable. Of note are the order of magnitude for all parameter estimates, which tend towards remarkably small values. For example, the M1 like relation estimate is 0.255; Assuming variable independence and given in absolute terms, it took roughly 4 likes to produce a match for M1 agents. This is in line with expectations about the density of the like network when compared to the density of the match network—the former expected to be more dense and the latter more sparse.
Confidence in the reported parameter estimates is conveyed by the proportion of network permutations that meet lower-end one-tailed P r ( > = ) , upper-end one-tailed P r ( < = ) , and two-tailed tests Pr(>|=|). These reports communicate important features of the simulated systems. For example, 100% of the ensemble of networks permuted by M1 regression resulted in parameters for the like relation that were smaller ( < = b ) ) than the observed effect size of 0.255 and that were larger than ( > = b ) ) −0.0061 for M2-F and −0.0061 for M2-T. This represents high confidence that this parameter differs significantly from a random observation of the same structural network. Further reported is a two-tailed measure of confidence (Pr(>|=|)) expressing the skewness of the sampling distribution of estimates.
The three models presented in Table 8 explore a true model for M1 with all available monadic and dyadic effects, a false model for M2 (M2-F) without the messaging network, and a second model for M2 with messaging included. It was clear that all models are significant when compared to random. M2-F generated a model with a much higher standard error (0.25) when compared with M1 (0.097) and the true M2-T model (0.076). The coefficient of determination for the M1 model ( R 2 = 0.18 ) was greater than both M2 model equivalents, given that the number of agent decision points needed to achieve a match are more numerous in the M2 model regressions. Each of these decision points are subject to additional (uniform) random draws. This increases the amount of uniform random noise in simulation runs but leaves the reliability of the models intact.
Beyond model-level reliability and validity, our virtual experiment provides agreeable results. We rank coefficient estimates in Table 9 by order of contribution (from positive estimates to negative estimates) and by coefficient size (magnitude). Here we are observant of the coefficient estimates and the direction and distribution of likely parameters generated by the permutations of the quadratic assignment procedure. That is, we are interested in rank order (of appearance), magnitude (absolute value), and the ensemble of networks with an exact structure to our observed network. Figure 7, Table 8 and Table 9 summarize these quantities.
The M1 regression model produces a straightforward linear system where more ‘like’ activity produces more matches. This is due to a positive intercept, positive like parameter estimate with a valid test statistic extant on the upper tail ( P r ( b <=)), and greater differences in attractiveness. We find that only 55% of networks produced higher estimates than observed. Primarily, this is due to the systemic differences in how male and female agents evaluate age with males preferring slightly younger females and females preferring slightly older males. As a consequence, estimates are centered in a range that describe opposing positive and negative difference in age. By rank order of contribution, the like variable is the largest contributor to matches, followed by attractiveness, ethnicity, and then age. Ranked by magnitude, the like relation is the primary contributor to matches, while attractiveness and ethnicity contribute along the same rank, and age contributes (in absolute terms) roughly 5 times less than whether an agent likes another of an ideal difference in age versus 3 or more standard deviations away, placing it 3rd in magnitude rank.
It was a useful exercise in model validity to report two models for the M2 dating system—one which included the messaging network (M2-T) and one which omitted it (M2-F). The first clue in the non-applicability of M2-F’s regression model is the relatively high residual standard error (0.25) when compared to the true model (0.076), an order of magnitude of difference. The non-inclusion of the messaging network as an independent variable caused the quadratic assignment procedure to shift the (positive) estimate for attractiveness and ethnicity to a negative estimate and assigned the parameter estimate for ethnicity a much smaller weighing (from 10 6 to 10 4 ). Under conditions where this data may have been gathered from a real-world sample, one may be inclined to accept these differences at face-value, but because we know that a proper model must be inclusive of the messaging network—included in M2-T—since the behavior was incorporated in the simulation’s specifications, we know that it must be false. The greater clue comes from the rankings of effects by magnitude (Table 9) which shows that M1 and M2-T have emerged the same order of effect ranking—that is, the variables contribute similar amount to the creation of a match for agents, while M2-F conveyed a differing order.
Greater confidence in M2-T as a valid model begins with the standard error of the model, which was roughly equivalent to M1 (0.076, 0.097, respectively). M2-T produced estimates for the like and messaging networks that were strong by rank (first) followed by attractiveness and ethnicity (second) and finally, age (third). This ranking of parameter estimates for M2-T is identical to M1 with excepting the messaging network rank which is not applicable in the case of the M1 model. The order of contribution was divergent however; While the like network was the strongest predictor of a match in the M1 regression model by (positive value, by order 1st), the like network was the weakest predictor of a match in the M2-T model (negative value, by order 5th). Agents in M2 could not rely on ‘liking’ alone to generate a match—in fact, liking many profiles resulted in less matches overall. This is a direct result of the additional multiplicity of the model, i.e., the addition of the messaging feature. Interestingly, attractiveness (by order, 2nd) held its order position in both models. Age was more relevant in M2 (by order, 3rd) than in M1 (by order, 4th) and messaging did not exist in M1 but was ranked 4th in M2, by rank order.
The third component of our findings was the likelihood function of parameter estimates describing the ensemble of networks permuted by MRQAP. Figure 7 summarizes those results through a direct comparison of the 3 models. The intercept likelihood sub-Figure 7 uniquely represents the divergence of Tinder-like applications and Hinge-like applications with intercept estimates for the M2 dating system far exceeding M1. This indicates that M2 agents initialize with a higher likelihood of matching—holding all else equal—but due to negative parameter estimates for liking and messaging must be more tactical with liking and messaging decisions than M1 agents. This hypothesis is uniformly confirmed through an increased variance of estimated parameters for all M1 (Tinder-like model) variables and increased certainty of estimates in both M2-F (false Hinge-like model) and M2-T (true Hinge-like model) estimates. In general, M2 parameter estimates for the 100 permuted networks under consideration were more likely and in some cases (age and ethnicity) were twice as likely as their M1 counterparts. The increased likelihood and less variant distribution of parameter estimates for the M2 system specifies a narrower corridor of conditions that must be met in order for matches to occur and as a consequence agents should employ specialized strategies in messaging. This finding is robust despite that agents in either simulation models are zero-intelligence (see [87]).

4.2. Sensitivity Analysis

To ensure that our results were independent of our parameter choices, we tested an elementary adaptation of each model simulation using a single agent rule. Agents in this base model evaluate the overall attractiveness of other agents through the uniformly assigned physical attractiveness attribute. The attractiveness score is then adopted as the overall score rather than combined additively with other scores. Analysis of the base model helps to determine the likelihood of bias due to design artifacts in our model. Similarly to our previous approach, we simulated both a Tinder-like application (M1) (Table 10) and a Hinge-like application (M2) (Table 11). Since our aim is not to compare our simulations to extant data but to each other, this step is not wholly necessary but is useful for model validity.

5. Discussion

Under the generally uniform choices we imbued agents, we would not expect that messaging distribution outputs be skewed or heavy tailed. Importantly, that was precisely the conditions emerged shown in Figure 5C and what is evidenced from peer-reviewed literature in Hitsch et al. [20]. Hitsch and colleagues found a right-skewed distribution of message interactions that yield a match and this is also directly confirmed in Tyson et al. [76]. Additionally, our own finding that many agents received few matches while a minority received many matches is confirmed by the findings in Hitsch et al. as well [20]. Furthermore, in Tyson et al. [76] interaction data provides the relative proportion of likes and matches, showing that the number of likes compared to the number of matches is larger by 2 or 3 orders of magnitude, consistent with Table 6 and Table 7, and Figure 5.
Though we surmise that skewness—as a system property—likely depends on the scale of dating platforms (e.g., the number of active subscribers) it is likely that if the number of agents were to be larger by an order of magnitude or more, then by sheer chance alone, the proportion of agents receiving no matches would be higher—as top agents would continually gather a larger share of all available matches. Nominally, whether the well-studied scale-free (power law degree distribution) property [88] is an adage of our system is an interesting theoretical question that arises here. With ever-larger scale (Tinder is larger in membership count than Hinge), the skewness and consequently the tails of our like statistical distribution approach some extreme-value and heavy-tailed habitat that represents some biased social process. In the case of the classical scale-free property, the underlying social process is generally taken to be preferential attachment when the dataset under question is analyzed as a network. Though this question provokes a revision to our consideration of skewness as being a sufficiently reproducible stylized fact, it is assumed that even under conditions of preferential attachment (that produce highly skewed, heavy tailed output distributions), there will exist some internal balancing act (algorithmic) by dating service providers to ensure that, for example, an entire city does not subsequently match with a single user and that no single user is to receive unlimited matches. Thus, our assumption of skewness without extending said assumption to require outputs to be of an extreme value nature seems realistic and sufficient in the absence of additional data.
Figure 5 show that male agents received more likes than female agents while female agents received more matches and messages than male agents while sending less messages than male agents. This reproduced collection of facts is directly confirmed by [89]. More male agents populated dating services [20] and also many more male agents were likely to receive no likes, matches, or messages than female agents [90]. This was also reproduced by our reported agent-based model.
Focusing our attention on the parameter estimates of our observed networks from M1 and M2-T, we see the effect of gaining additional multiplicity given in the form of an additional feature to send messages with likes. We found that both M1 and M2-T simulations produced positive estimates for the intercepts and M2-T produced negative estimates for the like and message networks as well as the age difference covariate. One interpretation of the change in sign is that the M1 regression model describes a positively increasing regression model where more activity by M1 agents (more right swipes) helped agents produce more matches, contrasting M2-T’s decreasing-slope regression model where M2 agents could not simply increase their activity levels to increase the likelihood of a match. That is, agents engaging in non-strategic activity produced less matches overall in M2-T. The implications are profound: Agents, when presented with additional features, must employ strategies that reflect the availability of features and often these strategies must be more specialized. M2 agents were presented with a random sample of other agents for consideration and their messaging behavior, for the sake of comparison, was also assigned randomly. If we were to assign messaging behavior to be in line with total compatibility scores it would endow M2 agents with strategic behavior, and yet the regression models revealed this as a condition of success without the additional endowment. Hamilton et al. and Best et al. [91,92] discuss examples of online daters integrating more specialized behaviors in line with what we have produced.
Additionally, consider that for the M1 and M2-T models, the ranking of estimates remained invariant to the increase in multiplicity (Table 9). With both M1 and M2-T ranking the like network first concurrent with the messaging network (for M2-T), then attractiveness difference and ethnicity difference, and finally age difference, while simultaneously describing divergent system behaviors where more (random) likes imply a better chance of a match in the M1 system but did not in the M2-T system. We can conclude that while we produced the same systems in terms of effect importance, we also produced a clear divergence in their overall behaviors. Doubtless, effects are transformed when the option for reciprocity through an increased multiplicity is considered in M2-T by order (from positive to negative for example) but not by rank.
The overall divergence in aggregate system behavior is further demonstrated by the likelihood of parameter estimates generated by the quadratic assignment procedure and shown in Figure 7, clearly demonstrating that most parameter estimates for M1 and M2-T had similar properties excepting the intercept parameter estimate. Furthermore, M1’s likelihood estimates were more variable as denoted by a wider functional form.
The interpretation of our combined results is based on two key indicators: The first is that the order of importance by coefficient effect size changed between M1 and M2-T—but not by rank order—even when given similar agent rules. The second is that we have successfully reproduced divergent system-level behavior in line with what would be expected from a pure matching market (Tinder) in comparison to a market where specialized strategies (e.g., messaging) can be adopted by agents. Remarkably, we did so by considering only the multiplicity of the applications rather than advanced psychological or sociological theories—a zero-intelligence approach.

Limitations

While we have confirmed our hypothesis, we must acknowledge there are limitations to our interpretations and consequently to our approach. The first of which is our use of agent attributes that did not conform precisely to what is known about dating application subscribers. For example, we use age intervals that we chose uniformly from a specified range, and for our main comparison we used ethnic identities that were evenly assigned. It is reasonable to assume that neither of these attribute assignment choices are realistic but were merely convenient. However, these choices were intended to be uninformed [93] in order to ensure that the attributes of agents cannot interfere in our statistical comparisons. Our goal herein was to issue a comparison of the relative size of parameter estimates, not to estimate the parameters themselves. If we had chosen non-uniform attributes, then there exists a possibility that model artifacts would disturb our model comparisons. As a result, isolating the effects due to a differing multiplicity would be more difficult.
While our method does achieve our intended results, in time a better methodological comparison may be possible. It should be noted that a comparison of datasets from two independent collections of observations is trivial to conduct in numerous ways. One need only consider the scientific inquiry in the statistics book of knowledge available since Gosset’s t-statistic (1876) to find an overwhelming number of procedures that can be used to compare one set of observations to another. However, this is not what is being considered here; Here we are considering network effects as a representation of one dynamical system and attempting a comparison with a slightly different dynamical system through those same network effects—a less intuitive challenge. Nonetheless, the comparison yielded results, a robust and interpretable conclusion, a demonstration of how to compare two network agent-based models in a principled fashion in light of extant literature.

6. Conclusions

In this paper, we have shown how agent-based simulations and a robust statistical method of comparison can be used to examine additional features of a dating application. Through this effort, we have discovered that inclusion of even one additional feature can cause divergent outputs and differing aggregate outcomes. We described this addition as increasing the multiplicity of an online dating application. In this instance, overall matches and the underlying social effects that govern matching dynamics were transformed, and naturally emerging were the basic properties of Tinder-like and Hinge-like dating application systems in a clear and demonstrable way. The M1 and M2 simulation models legislate clear differences in agent behaviors and in-turn their personal experiences. From this proof-of-concept, bridging our model to large-scale data and real world applications is not improbable and could enhance the design and development of more successful dating applications and matching environments for users as well as enrich the study of human–computer interactions. Surely, many who desire love (and better software) would praise this effort.
As we conclude our report, it is most opportune to discuss an inherent assumption in our overall analysis which is best included along with our concluding remarks. This assumption is that “many who desire love”, as we have dubbed them, desire quantity of matches as an important output, and seemingly as the output of choice. Consider Sumter et al.’s [45] superb analysis of a sample of Tinder users: In this study, of over 160 active Tinder users, an exploratory factor analysis reveals that out of six strong categories that explain users’ behavior on Tinder, finding “love” was as important as finding “casual sex”. In fact, the sub-scale of this analysis openly divulges that “to have a one-night stand” (0.808) exceeded the explanatory strength of “to find a romantic relationship” (0.807). Importantly, from all six and including the four remaining categories (ease of communication, self-worth validation, thrill of excitement, and trendiness), self-worth validation “was the only motivation that was significantly related to higher Tinder use”. Minimally, one can safely assume that while quality of matches is always an intended target, because dating platforms have become a versatile collection of virtual meeting spaces used in different ways by different users hoping for different outcomes, all said outcomes are centered on the provision of more viable mating strategies—with an emphasis on more rather than viable. Not considering quality of matches, thus, can be described as a limitation of our approach only when assuming that “love” is the only important factor governing mating behavior on online platforms.
In any case, here we have demonstrated the use of agent-based models to simulate the interactions of mobile dating application users and produced expected outcomes when compared to extant literature. We have also demonstrated the use of a standard social network analysis technique—the network regression, MRQAP—to conduct a principled and interpretable comparison between the two models with strong results. This combined approach is novel and it allows complex system modelers who utilize agent-based models to reduce their reliance on idealized network structures (small world, scale-free, erdos-renyi) when combining with agent interactions that can often skew results and not present a full picture of system-level properties.
Henceforth, there are many directions we could pursue along this line of inquiry, including using network regressions to calibrate our social effects, models, inclusion of weighted dyadic relationship—and most importantly—using some reference micro-dataset as a validation tool. The latter represents our work’s greatest limitation since much of these data are considered private by commercial entities. We hope to be able to pursue these avenues in future papers, nonetheless.

Author Contributions

Conceptualization, J.A.E.S.; Data curation, J.A.E.S., C.H. and L.M.; Formal analysis, J.A.E.S., C.H. and L.M.; Investigation, J.A.E.S.; Methodology, J.A.E.S.; Project administration, J.A.E.S. and L.M.; Resources, J.A.E.S.; Software, J.A.E.S., C.H., S.H. and F.A.; Supervision, J.A.E.S.; Validation, J.A.E.S.; Visualization, F.A.; Writing—original draft, J.A.E.S., L.M. and S.H.; Writing—review & editing, J.A.E.S. and L.M. All authors have read and agreed to the published version of the manuscript.

Funding

This research received no external funding.

Institutional Review Board Statement

Not applicable.

Informed Consent Statement

Not applicable.

Data Availability Statement

Model code is provided at https://github.com/Jophelias/ABM-MRQAP-Dating-Model, accessed on 1 February 2022.

Acknowledgments

The methodological portions of this research were supported by an appointment to the Intelligence Community Postdoctoral Research Fellowship Program at Georgetown University for primary author (1).

Conflicts of Interest

The authors declare no conflict of interest.

Abbreviations

The following abbreviations are used in this manuscript:
MRQAPMultiple Regression Quadratic Assignment Procedure

References

  1. Epstein, J.M. Agent-based Computational Models and Generative Social Science. Complexity 1999, 4, 41–60. [Google Scholar] [CrossRef]
  2. Axtell, R. Why Agents? On the Varied Motivations for Agent Computing in the Social Sciences. Cent. Soc. Econ. Dyn.-Brook. Inst. 2000, 1–23. [Google Scholar] [CrossRef]
  3. Janssen, S.; Sharpanskykh, A.; Curran, R.; Langendoen, K. Using Causal Discovery to Analyze Emergence in Agent-Based Models. Simul. Model. Pract. Theory 2019, 96, 101940. [Google Scholar] [CrossRef]
  4. DeAngelis, D.L.; Diaz, S.G. Decision-Making in Agent-Based Modeling: A Current Review and Future Prospectus. Front. Ecol. Evol. 2019, 6, 237. [Google Scholar] [CrossRef] [Green Version]
  5. Zhang, Z.; Zhang, H.; Zhou, L.; Li, Y. Analyzing the Coevolution of Mobile Application Diffusion and Social Network: A Multi-Agent Model. Entropy 2021, 23, 521. [Google Scholar] [CrossRef] [PubMed]
  6. Zhou, L.; Lin, J.; Li, Y.; Zhang, Z. Innovation Diffusion of Mobile Applications in Social Networks: A Multi-Agent System. Sustainability 2020, 12, 2884. [Google Scholar] [CrossRef] [Green Version]
  7. Todd, P.M. Searching for the Next Best Mate. In Simulating Social Phenomenon; Springer Publishing: Berlin/Heidelberg, Germany, 1997; pp. 419–436. [Google Scholar] [CrossRef]
  8. Butts, C.T. A Dynamic Process Interpretation of the Sparse ERGM Reference Model. J. Math. Sociol. 2018, 43, 40–57. [Google Scholar] [CrossRef]
  9. Hunter, D.R.; Handcock, M.S.; Butts, C.T.; Goodreau, S.M.; Morris, M. Ergm: A Package to Fit, Simulate and Diagnose Exponential-Family Models for Networks. J. Stat. Softw. 2008, 24, nihpa54860. [Google Scholar] [CrossRef] [PubMed]
  10. Snijders, T.A.B.; Pattison, P.E.; Robins, G.L.; Handcock, M.S. New Specifications for Exponential Random Graph Models. Sociol. Methodol. 2006, 36, 99–153. [Google Scholar] [CrossRef]
  11. Ligmann-Zielinska, A.; Siebers, P.O.; Magliocca, N.; Parker, D.C.; Grimm, V.; Du, J.; Cenek, M.; Radchuk, V.; Arbab, N.N.; Li, S.; et al. ‘One Size Does Not Fit All’: A Roadmap of Purpose-Driven Mixed-Method Pathways for Sensitivity Analysis of Agent-Based Models. J. Artif. Soc. Soc. Simul. 2020, 23, 6. [Google Scholar] [CrossRef] [Green Version]
  12. Carrella, E.; Bailey, R.; Madsen, J. Calibrating Agent-Based Models with Linear Regressions. J. Artif. Soc. Soc. Simul. 2020, 23, 7. [Google Scholar] [CrossRef]
  13. Borgatti, S.P.; Everett, M.G.; Johnson, J.C. Analyzing Social Networks; Sage: Los Angeles, CA, USA, 2018. [Google Scholar]
  14. Krackhardt, D. Predicting with Networks: Nonparametric Multiple Regression Analysis of Dyadic Data. Soc. Netw. 1988, 10, 359–381. [Google Scholar] [CrossRef]
  15. Mantel, N. The Detection of Disease Clustering and a Generalized Regression Approach. Cancer Res. 1967, 27, 209–220. [Google Scholar]
  16. Hubert, L.J. Combinatorial Data Analysis: Association and Partial Association. Psychometrika 1985, 50, 449–467. [Google Scholar] [CrossRef]
  17. Krackhardt, D. QAP Partialling as a Test of Spuriousness. Soc. Netw. 1987, 9, 171–186. [Google Scholar] [CrossRef]
  18. Dekker, D.; Krackhardt, D.; Snijders, T.A.B. Multicollinearity Robust QAP for Multiple Regression. In Proceedings of the NAACSOS Conference, Pittsburgh, PA, USA, 17 July 2003; pp. 1–5. [Google Scholar]
  19. Altman, E.; De Pellegrini, F.; Wang, H. Activation Games in Online Dating Platforms. In Proceedings of the 2015 IEEE International Conference on Communication Workshop (ICCW), London, UK, 8–12 June 2015; pp. 1593–1599. [Google Scholar] [CrossRef] [Green Version]
  20. Hitsch, G.J.; Hortaçsu, A.; Ariely, D. What Makes You Click? Mate Preferences in Online Dating. Quant. Mark. Econ. 2010, 8, 393–427. [Google Scholar] [CrossRef]
  21. Simão, J.; Todd, P.M. Emergent Patterns of Mate Choice in Human Populations. Artif. Life 2003, 9, 403–417. [Google Scholar] [CrossRef]
  22. Roth, A.E.; Sotomayor, M. Chapter 16. Two-sided Matching. In Games and Economic Behavior; Elsevier: Amsterdam, The Netherlands, 1992; Volume 4, pp. 485–541. [Google Scholar] [CrossRef]
  23. Mumcu, A.; Saglam, I. Marriage Formation/Dissolution and Marital Distribution in a Two-Period Economic Model of Matching with Cooperative Bargaining. J. Artif. Soc. Soc. Simul. 2008, 11, 3. [Google Scholar]
  24. Shiba, N. Analysis of Asymmetric Two-Sided Matching: Agent-based Simulation with Theorem-Proof Approach. J. Artif. Soc. Soc. Simul. 2013, 16, 1–14. [Google Scholar] [CrossRef]
  25. Bennett, E. Consistent Bargaining Conjectures in Marriage and Matching. J. Econ. Theory 1988, 45, 392–407. [Google Scholar] [CrossRef]
  26. Ismail, S. The Mutual Sequential Mate Search Model under Nonhomogenous Preferences. Marriage Fam. Rev. 2019, 55, 530–543. [Google Scholar] [CrossRef]
  27. Mortensen, D.T. The Matching Process as a Noncooperative Bargaining Game. In The Economics of Information and Uncertainty; National Bureau of Economic Research: Washington, DC, USA, 1982; Volume I, pp. 173–203. [Google Scholar]
  28. Becker, G.S. A Theory of Marriage. Econ. Fam. Marriage Child. Hum. Cap. 1974, 1, 299–351. [Google Scholar] [CrossRef]
  29. Koch, L. Dating App Growth Slows, but Advertisers Should Not Ignore Hopeful Singles. 2019. Available online: https://www.emarketer.com/content/dating-app-growth-slows-but-advertisers-shouldnt-ignore-hopeful-single-users (accessed on 1 February 2022).
  30. Lin, M. Online Dating Industry: The Business of Love. 2019. Available online: https://www.toptal.com/finance/business-model-consultants/online-dating-industry (accessed on 1 February 2022).
  31. Wendel, M. An Analysis of the Online Dating Industry and How Startups Can Compete. Ph.D. Thesis, Copenhagen Business School, Copenhagen, Denmark, 2015. [Google Scholar]
  32. Suler, J. The Online Disinhibition Effect. Cyberpsychol. Behav. 2004, 7, 321–326. [Google Scholar] [CrossRef] [PubMed]
  33. Whitty, M.T. Online Dating. In International Encyclopedia of the Social & Behavioral Sciences; Elsevier: Amsterdam, The Netherlands, 2015; pp. 212–216. [Google Scholar] [CrossRef]
  34. McGrath, F. What to Know about Tinder in 5 Charts. 2015. Available online: https://blog.globalwebindex.com/trends/what-to-know-about-tinder/ (accessed on 1 February 2022).
  35. Zytko, D.; Grandhi, S.A.; Jones, Q. Frustrations with Pursuing Casual Encounters through Online Dating. In Proceedings of the 33rd Annual ACM Conference Extended Abstracts on Human Factors in Computing Systems, Seoul, Korea, 18–23 April 2015; pp. 1935–1940. [Google Scholar] [CrossRef]
  36. Brozovsky, L.; Petricek, V. Recommender System for Online Dating Service. arXiv 2007, arXiv:cs/0703042. [Google Scholar]
  37. Pizzato, L.; Rej, T.; Chung, T.; Koprinska, I.; Kay, J. RECON: A Reciprocal Recommender for Online Dating. In Proceedings of the 4th ACM Conference on Recommender Systems (RecSys’10), Barcelona, Spain, 26–30 September 2010; pp. 207–214. [Google Scholar] [CrossRef]
  38. Ellison, N.; Heino, R.; Gibbs, J. Managing Impressions Online: Self-Presentation Processes in the Online Dating Environment. J. Comput.-Mediat. Commun. 2006, 11, 415–441. [Google Scholar] [CrossRef]
  39. Miller, G.F.; Todd, P.M. Mate Choice Turns Cognitive. Trends Cogn. Sci. 1998, 2, 190–198. [Google Scholar] [CrossRef]
  40. Hancock, J.T.; Toma, C.L. Putting Your Best Face Forward: The Accuracy of Online Dating Photographs. J. Commun. 2009, 59, 367–386. [Google Scholar] [CrossRef]
  41. Hall, J.A.; Park, N.; Song, H.; Cody, M.J. Strategic Misrepresentation in Online Dating: The Effects of Gender, Self-Monitoring, and Personality Traits. J. Soc. Pers. Relatsh. 2010, 27, 117–135. [Google Scholar] [CrossRef] [Green Version]
  42. Guadagno, R.E.; Okdie, B.M.; Kruse, S.A. Dating Deception: Gender, Online Dating, and Exaggerated Self-Presentation. Comput. Hum. Behav. 2012, 28, 642–647. [Google Scholar] [CrossRef]
  43. Toma, C.L.; Hancock, J.T.; Ellison, N.B. Separating Fact from Fiction: An Examination of Deceptive Self-Presentation in Online Dating Profiles. Personal. Soc. Psychol. Bull. 2008, 34, 1023–1036. [Google Scholar] [CrossRef]
  44. Simão, J.; Todd, P.M. Modeling Mate Choice in Monogamous Mating Systems with Courtship. Adapt. Behav. 2002, 10, 113–136. [Google Scholar] [CrossRef] [Green Version]
  45. Sumter, S.R.; Vandenbosch, L.; Ligtenberg, L. Love Me Tinder: Untangling Emerging Adults’ Motivations for Using the Dating Application Tinder. Telemat. Inform. 2017, 34, 67–78. [Google Scholar] [CrossRef]
  46. Silva, R.R.; Koch, M.L.; Rickers, K.; Kreuzer, G.; Topolinski, S. The Tinder Stamp: Perceived Trustworthiness of Online Daters and Its Persistence in Neutral Contexts. Comput. Hum. Behav. 2019, 94, 45–55. [Google Scholar] [CrossRef]
  47. Gillett, R. Intimate Intrusions Online: Studying the Normalisation of Abuse in Dating Apps. Women’s Stud. Int. Forum 2018, 69, 212–219. [Google Scholar] [CrossRef] [Green Version]
  48. Gatter, K.; Hodkinson, K. On the Differences between Tinder™ versus Online Dating Agencies: Questioning a Myth. An Exploratory Study. Cogent Psychol. 2016, 3, 1162414. [Google Scholar] [CrossRef]
  49. Zytko, D.; Grandhi, S.A.; Jones, Q. Online Dating Coaches’ User Evaluation Strategies. In Proceedings of the 2016 CHI Conference Extended Abstracts on Human Factors in Computing Systems, San Jose, CA, USA, 7–12 May 2016; pp. 1337–1343. [Google Scholar] [CrossRef]
  50. Zang, X.; Yamasaki, T.; Aizawa, K.; Nakamoto, T.; Kuwabara, E.; Egami, S.; Fuchida, Y. How Competitive Are You: Analysis of People’s Attractiveness in an Online Dating System. In Proceedings of the 2017 IEEE International Conference on Multimedia and Expo (ICME), Hong Kong, China, 10–14 July 2017; pp. 973–978. [Google Scholar] [CrossRef]
  51. Potârcă, G.; Mills, M. Racial Preferences in Online Dating across European Countries. Eur. Sociol. Rev. 2015, 31, 326–341. [Google Scholar] [CrossRef]
  52. Ong, D.; Wang, J. Income Attraction: An Online Dating Field Experiment. J. Econ. Behav. Organ. 2015, 111, 13–22. [Google Scholar] [CrossRef]
  53. Ong, D. Education and Income Attraction: An Online Dating Field Experiment. Appl. Econ. 2016, 48, 1816–1830. [Google Scholar] [CrossRef]
  54. McGloin, R.; Denes, A. Too Hot to Trust: Examining the Relationship between Attractiveness, Trustworthiness, and Desire to Date in Online Dating. New Media Soc. 2018, 20, 919–936. [Google Scholar] [CrossRef]
  55. Xia, P.; Ribeiro, B.; Chen, C.; Liu, B.; Towsley, D. A Study of User Behavior on an Online Dating Site. In Proceedings of the 2013 IEEE/ACM International Conference on Advances in Social Networks Analysis and Mining, Niagara Falls, ON, Canada, 25–28 August 2013; p. 5. [Google Scholar]
  56. Wotipka, C.D.; High, A.C. An Idealized Self or the Real Me? Predicting Attraction to Online Dating Profiles Using Selective Self-Presentation and Warranting. Commun. Monogr. 2016, 83, 281–302. [Google Scholar] [CrossRef]
  57. Wiederhold, B.K. Twenty Years of Online Dating: Current Psychology and Future Prospects. Cyberpsychol. Behav. Soc. Netw. 2015, 18, 695–696. [Google Scholar] [CrossRef]
  58. Whyte, S.; Torgler, B. Things Change with Age: Educational Assortment in Online Dating. Personal. Individ. Differ. 2017, 109, 5–11. [Google Scholar] [CrossRef]
  59. Tsunokai, G.T.; McGrath, A.R.; Kavanagh, J.K. Online Dating Preferences of Asian Americans. J. Soc. Pers. Relatsh. 2014, 31, 796–814. [Google Scholar] [CrossRef]
  60. Suna, T.; Hardey, M.; Huhtinen, J.; Hiltunen, Y.; Kaski, K.; Heikkonen, J.; Ala-Korpela, M. Self-Organising Map Approach to Individual Profiles: Age, Sex and Culture in Internet Dating. Sociol. Res. Online 2006, 11, 114–129. [Google Scholar] [CrossRef] [Green Version]
  61. Sritharan, R.; Heilpern, K.; Wilbur, C.J.; Gawronski, B. I Think I like You: Spontaneous and Deliberate Evaluations of Potential Romantic Partners in an Online Dating Context. Eur. J. Soc. Psychol. 2010, 40, 1062–1077. [Google Scholar] [CrossRef]
  62. McGrath, A.R.; Tsunokai, G.T.; Schultz, M.; Kavanagh, J.; Tarrence, J.A. Differing Shades of Colour: Online Dating Preferences of Biracial Individuals. Ethn. Racial Stud. 2016, 39, 1920–1942. [Google Scholar] [CrossRef]
  63. Lee, S. Effect of Online Dating on Assortative Mating: Evidence from South Korea: Effect of Online Dating on Assortative Mating. J. Appl. Econom. 2016, 31, 1120–1139. [Google Scholar] [CrossRef]
  64. Klofstad, C.A.; McDermott, R.; Hatemi, P.K. The Dating Preferences of Liberals and Conservatives. Political Behav. 2013, 35, 519–538. [Google Scholar] [CrossRef]
  65. Huber, G.A.; Malhotra, N. Political Homophily in Social Relationships: Evidence from Online Dating Behavior. J. Politics 2017, 79, 269–283. [Google Scholar] [CrossRef] [Green Version]
  66. Plumm, K.M.; Sommer, S.; Uhl, C.; Stone, K. Single Parent Seeking Single Parent? The Effects of Parental and Previous Relationship Status on Perceptions of Online Dating Profiles. J. Relatsh. Res. 2016, 7, e9. [Google Scholar] [CrossRef]
  67. Hills, T.; Todd, P. Population Heterogeneity and Individual Differences in an Assortative Agent-Based Marriage and Divorce Model (MADAM) Using Search with Relaxing Expectations. J. Artif. Soc. Soc. Simul. 2008, 11, 5. [Google Scholar]
  68. Aral, S.; Muchnik, L.; Sundararajan, A. Distinguishing Influence-Based Contagion from Homophily-Driven Diffusion in Dynamic Networks. Proc. Natl. Acad. Sci. USA 2009, 106, 21544–21549. [Google Scholar] [CrossRef] [PubMed] [Green Version]
  69. Reagans, R.E. Close Encounters: Analyzing How Social Similarity and Propinquity Contribute to Strong Network Connections. Organ. Sci. 2011, 22, 835–849. [Google Scholar] [CrossRef] [Green Version]
  70. Centola, D. The Social Origins of Networks and Diffusion. Am. J. Sociol. 2015, 120, 1295–1338. [Google Scholar] [CrossRef] [Green Version]
  71. McPherson, M.; Smith-Lovin, L.; Cook, J.M. Birds of a Feather: Homophily in Social Networks. Annu. Rev. Sociol. 2001, 27, 415–444. [Google Scholar] [CrossRef] [Green Version]
  72. Fiore, A.T.; Donath, J.S. Homophily in Online Dating: When Do You like Someone like Yourself? In Proceedings of the Conference on Human Factors in Computing Systems, Portland, OR, USA, 2–7 April 2005; pp. 1371–1374. [Google Scholar] [CrossRef]
  73. Ibarra, H. Homophily and Differential Returns: Sex Differences in Network Structure and Access in an Advertising Firm. Adm. Sci. Q. 1992, 37, 422. [Google Scholar] [CrossRef]
  74. Gibbons, D.; Olk, P.M. Individual and Structural Origins of Friendship and Social Position among Professionals. J. Personal. Soc. Psychol. 2003, 84, 340–351. [Google Scholar] [CrossRef]
  75. Griffin, E.M.; Fingerman, K.L. Online Dating Profile Content of Older Adults Seeking Same- and Cross-Sex Relationships. J. GLBT Fam. Stud. 2018, 14, 446–466. [Google Scholar] [CrossRef]
  76. Tyson, G.; Perta, V.C.; Haddadi, H.; Seto, M.C. A First Look at User Activity on Tinder. In Proceedings of the 2016 IEEE/ACM International Conference on Advances in Social Networks Analysis and Mining, ASONAM 2016, Davis, CA, USA, 18–21 August 2016; pp. 461–466. [Google Scholar] [CrossRef] [Green Version]
  77. Hagberg, A.A.; Schult, D.A.; Swart, P.J.; Varoquaux, G.; Vaught, T.; Millman, J. Exploring Network Structure, Dynamics, and Function Using NetworkX. In Proceedings of the 7th Python in Science Conference (SciPy2008), Pasadena, CA, USA, 19–24 August 2008; pp. 11–15. [Google Scholar]
  78. Granovetter, M. Threshold Models of Collective Behavior. Am. J. Sociol. 1978, 83, 1420–1443. [Google Scholar] [CrossRef] [Green Version]
  79. Conway, J.R.; Noë, N.; Stulp, G.; Pollet, T.V. Finding Your Soulmate: Homosexual and Heterosexual Age Preferences in Online Dating. Pers. Relatsh. 2015, 22, 666–678. [Google Scholar] [CrossRef]
  80. Greenlees, I.A.; Mcgrew, W.C. Sex and Age Differences in Preferences and Tactics of Mate Attraction: Analysis of Published Advertisements. Ethol. Sociobiol. 1994, 15, 59–72. [Google Scholar] [CrossRef]
  81. Fisman, R.; Iyengar, S.S.; Kamenica, E.; Simonson, I. Gender Differences in Mate Selection: Evidence from a Speed Dating Experiment. Q. J. Econ. 2006, 121, 673–697. [Google Scholar] [CrossRef] [Green Version]
  82. Bruch, E.E.; Newman, M.E.J. Aspirational Pursuit of Mates in Online Dating Markets. Sci. Adv. 2018, 4, eaap9815. [Google Scholar] [CrossRef] [Green Version]
  83. Altman, I. Reciprocity of Interpersonal Exchange. J. Theory Soc. Behav. 1973, 3, 249–261. [Google Scholar] [CrossRef]
  84. Tantardini, M.; Ieva, F.; Tajoli, L.; Piccardi, C. Comparing Methods for Comparing Networks. Sci. Rep. 2019, 9, 1–19. [Google Scholar] [CrossRef]
  85. Dekker, D.; Krackhardt, D.; Snijders, T.A.B. Sensitivity of MRQAP Tests to Collinearity and Autocorrelation Conditions. Psychometrika 2007, 72, 563–581. [Google Scholar] [CrossRef] [Green Version]
  86. Blondel, V.D.; Guillaume, J.L.; Lambiotte, R.; Lefebvre, E. Fast Unfolding of Communities in Large Networks. J. Stat. Mech. Theory Exp. 2008, 10008, 6. [Google Scholar] [CrossRef] [Green Version]
  87. Gode, D.K.; Sunder, S. Allocative Efficiency of Markets with Zero-Intelligence Traders: Market as a Partial Substitute for Individual Rationality. J. Political Econ. 1993, 101, 119–137. [Google Scholar] [CrossRef]
  88. Barabási, A.L.; Albert, R. Emergence of Scaling in Random Networks. Science 1999, 286, 509–512. [Google Scholar] [CrossRef] [Green Version]
  89. Kreager, D.A.; Cavanagh, S.E.; Yen, J.; Yu, M. “Where Have All the Good Men Gone?” Gendered Interactions in Online Dating: Gendered Interactions in Online Dating. J. Marriage Fam. 2014, 76, 387–410. [Google Scholar] [CrossRef] [Green Version]
  90. Fiore, A.R.T. Romantic Regressions: An Analysis of Behavior in Online Dating Systems. Ph.D. Thesis, Massachusetts Institute of Technology, Cambridge, MA, USA, 2004. [Google Scholar]
  91. Hamilton, N.F. Romantic Relationships and Online Dating. In Applied Cyberpsychology; Attrill, A., Fullwood, C., Eds.; Palgrave Macmillan: London, UK, 2016; pp. 144–160. [Google Scholar] [CrossRef]
  92. Best, K.; Delmege, S. The Filtered Encounter: Online Dating and the Problem of Filtering through Excessive Information. Soc. Semiot. 2012, 22, 237–258. [Google Scholar] [CrossRef]
  93. Grazzini, J.; Richiardi, M.G.; Tsionas, M. Bayesian Estimation of Agent-Based Models. J. Econ. Dyn. Control 2017, 77, 26–47. [Google Scholar] [CrossRef] [Green Version]
Figure 1. The different layers of network interactions starting with the visibility network of which likes can occur and then matches. Our approach is to specify the model mechanics, emerge variables of interest and compare using network regressions.
Applsci 12 01982 g001
Figure 2. Program schematic for M1 and M2 simulations. Agents in both models are allotted attributes at instantiation of the simulation. A compatibility score for each agent i is calculated for each agent j and compared to global threshold. M1 agents can choose to reject or ‘like’ other agents, where M2 agents can choose to reject, like, or message while considering reciprocal interactions.
Applsci 12 01982 g002
Figure 3. M1 detailed simulation schematic and logic diagram. Note P M ( R , L | . ) = 1 while maintaining female preference for higher levels of rejection make agents and choice inclusive of compatibility score threshold.
Applsci 12 01982 g003
Figure 4. M2 detailed simulation schematic and logic diagram. Note P M ( R , L | . ) = 1 and prior P M 1 ( L | . ) = P M 2 ( L + L / M | . ) , the overall probability of receiving a like (M1) or a like or a like/Message (M2) verified in Tables 6 and 7 is maintained.
Applsci 12 01982 g004
Figure 5. Simulation analysis for M1 (solid line distributions) and M2 (dashed line distribution) for both male (blue) and female (salmon) agents. (A) Like distributions highlighting median values conditioned on gender and simulation results. Median like values in all models for female agents were lower, but females received more total likes. (B) Male and female agents received more median matches in M2 when compared to M1 even when considering that the median number of likes combined with likes/messages overall was equitable with M1. Median matches for males was lower than median matches for female agents. (C) Only M2 agents can send messages with a low probability with the majority of agents not receiving any messages and a small minority receiving almost 5 times the median values.
Applsci 12 01982 g005
Figure 6. Network visualizations of like network (top) for M1 (left) and M2 (right) and the equivalent Match Networks (bottom) where distinctive colors represent community detection by Louvain method [86]. (A) Like network of M1 agents showing roughly even distribution of likes with 3 components. (B) Like network of M2 agents showing many isolated dyads and one single large component. (C) Match network for M1 model with one large component, few smaller components and many isolated dyads. (D) Match network for M2 showing the disappearance of large components and the appearance of many smaller dyadic and triadic matches in small disparate communities.
Applsci 12 01982 g006
Figure 7. Likelihood functions for each parameter estimate by standardized scores drawn from Quadratic Assignment Procedure regression permutations.
Applsci 12 01982 g007
Table 1. Assignment of agent attributes across all simulation models.
InputVariable TypeAssignment
Gender ( G )Discrete Binary { M , F } : [ 0.68 , 0.32 ]
Ethnicity ( E )Discrete Uniform U [ 0 , 1 , 2 , 3 ]
Age ( A )Continuous Uniform U [ 18 , 65 ]
Physical Attractiveness ( P )Continuous Uniform U [ 0 , 1 ]
Compatibility Threshold ( C )Constant C M : 0.3
C F : 0.4
Table 2. Rules applied by agents for calculation of overall compatibility (total score). Compatibility is assigned as the additive accumulation of all assigned attributes (age, attractiveness, ethnicity). Second column conveys conditions under which the rule calculation is presumed. All value calculations and parameters are assigned such that they will produce a maximum partial score of 1. Independent compatibility scores are then added to produce overall compatibility score. Description column contains parameter values chosen for a typical run. [Key: ⊤: (same as), ⊥: (different from)].
Model AttributeConditionValueDescription
Compatibility
Score (ethnicity)
G M G F
G M G F
S e = ( X 2 ) + 0.5 S e = ( X 2 ) Applsci 12 01982 i001 X [ 0 , 1 ]
Compatibility
Score (age)
G = = M S M A = 1 ( 2 ) ( | N ( A ) c d f | 0.5 )
N ( A ) c d f = 1 2 [ 1 + e r f ( x μ σ 2 ) ]
Applsci 12 01982 i002 μ = 3.996 σ = 3.317 x = A M A F
Compatibility
Score (age)
G = = F S M A = 1 ( 2 ) ( | N ( A ) c d f | 0.5 )
N ( A ) c d f = 1 2 [ 1 + e r f ( x μ σ 2 ) ]
Applsci 12 01982 i003 μ = 2.046 σ = 2.906 x = A F A M
Compatibility
Score
(attractiveness)
S M P = 1 ( 2 ) ( | N ( P ) c d f | 0.5 )
N ( P ) c d f = 1 2 [ 1 + e r f ( x μ σ 2 ) ]
Applsci 12 01982 i004 μ = 0 σ = 0.341 x = A M A F
Total Score S T o t a l M = β 1 M S e M + β 2 M S M P + β 3 M S M A
S T o t a l F = β 1 F S e F + β 2 F S F P + β 3 F S F A
β 1 M = 0.3   β 1 F = 0.4
β 2 M = 0.3   β 2 F = 0.3
β 3 M = 0.4   β 3 F = 0.3
Table 3. Validation of simulation inputs for M1 model including type of statistic, mean, and quartiles.
StatisticN μ σ 0th25th75th100th
Attractiveness10000.5120.2930.0010.2570.7780.999
Age100042.08813.06319315464
Ethnicity10002.4621.1221134
Table 4. Validation of simulation inputs for M2 model including type of statistic, mean, and quartiles.
StatisticN μ σ 0th25th75th100th
Attractiveness10000.4830.2840.0010.2290.7231.000
Age100040.87913.98918285365
Ethnicity10002.4951.1011234
Table 5. Statistical comparison of M1 and M2 models using a paired t-test. Shown are the parameter difference Δ b , the t-statistic, p-value and confidence interval of the parameter estimate. This table shows no mean difference in the number of likes yet a statistically significant mean difference in the number of matches between M1 and M2.
Relation Type Δ b M tp95% CI
‘Like’0.0010.0021.00[−0.81, 0.8]
‘Dislike’3.9011.530.12[−1.07, 8.87]
‘Match’5.8531.35p < 0.001[5.48, 6.21]
‘Like Message’−2.874−43.57p < 0.001[−3.00, −2.7]
Table 6. M1 Model Run Summary Statistics including type of statistic, mean, standard deviation, and quartiles.
StatisticN μ σ 0th25th75th100th
‘Like’ Count100033.0308.50410273958
‘Dislike’ Count1000146.60060.62448105207.2264
‘Match’ Count100011.6945.029081531
‘Message’ Count10000.0000.0000000
Table 7. M2 Model Run Summary Statistics including type of statistic, mean, standard deviation, and quartiles.
StatisticN μ σ 0th25th75th100th
‘Like’ Count100033.0299.9837264161
‘Dislike’ Count1000142.69953.13455108.8198.2251
‘Match’ Count10005.8443.11204818
‘Message’ Count10002.8742.08601412
Table 8. Multiple regression model of monadic and dyadic covariates using the quadratic assignment procedure. One model for Tinder-type applications (M1) and two models for Hinge-like applications (M2) are shown. The Message relation covariate is only included in the second model of the M2 model for comparison. Reported are the parameter estimates and p-value estimates for each effect. P r ( < = ) conveys the proportion [0, 1] of networks generated/permuted with identical structure to the observed network with a parameter value less than or equal to the reported estimate. P r ( > = ) conveys the reverse with the proportion of permuted networks with a parameter value greater than observed. Pr(>|=|) reveals symmetrical properties of the parameter distribution with nil indicating perfect symmetry and other values indicating skewness.
M1M2 (False)M2 (True)
like network2.55 × 10 1 −6.05 × 10 3 −6.06 × 10 3
   Pr(<=b)(1.0)(0.0)(0.0)
   Pr(>=b)(0.0)(1.0)(1.0)
   Pr(>=|b|)(0.0)(0.0)(0.0)
message network −4.35 × 10 3
   Pr(<=b) (0.0)
   Pr(>=b) (1.0)
   Pr(>=|b|) (0.0)
attractiveness (difference)2.04 × 10 4 −6.87 × 10 4 1.64 × 10 4
   Pr(<=b)(0.8)(0.93)(0.92)
   Pr(>=b)(0.2)(0.07)(0.01)
   Pr(>=|b|)(0.45)(0.14)(0.1)
age (difference)2.02 × 10 7 1.64 × 10 4 −4.96 × 10 6
   Pr(<=b)(0.55)(0.01)(0.01)
   Pr(>=b)(0.45)(0.99)(0.99)
   Pr(>=|b|)(0.99)(0.03)(0.03)
ethnicity (difference)1.24 × 10 4 −4.00 × 10 6 2.14 × 10 4
   Pr(<=b)(0.70)(0.78)(0.8)
   Pr(>=b)(0.30)(0.22)(0.2)
   Pr(>=|b|)(0.65)(0.38)(0.42)
intercept3.15 × 10 3 5.88 × 10 3 5.90 × 10 3
   Pr(<=b)(1.0)(1.0)(1.0)
   Pr(>=b)(0.0)(0.0)(0.0)
   Pr(>=|b|)(0.0)(0.0)(0.0)
Permutation(s)100100100
R 2 0.18090.0002050.000218
Adjusted R 2 0.18090.000200.00021
Residual Std. Error (df = 998,995)0.0970.250.076
F Statistic (df = 4; 998,995)55,17051.2443.59
Note: models are statistically significant at the p < 0.0001 level.
Table 9. Parameter estimates ordered by contribution to match network (left compartment) from large values to smaller values (including negative values), and by magnitude rank (overall contribution), e.g., while the like relation for the M2-T model was a top contributor to the match dependent variable (rank by magnitude = 1), it was also a negative parameter estimate placing it 5th in the order of contribution.
Order of ContributionRank by Magnitude
M1M2-FM2-TM1M2-FM2-T
like network Applsci 12 01982 i005 Applsci 12 01982 i005 Applsci 12 01982 i005
message network Applsci 12 01982 i005
attractiveness (difference) Applsci 12 01982 i006 Applsci 12 01982 i006 Applsci 12 01982 i006
age (difference) Applsci 12 01982 i007 Applsci 12 01982 i006 Applsci 12 01982 i007
ethnicity (difference) Applsci 12 01982 i006 Applsci 12 01982 i007 Applsci 12 01982 i006
interceptXXXXXX
Table 10. M1 sensitivity model run summary statistics including type of statistic, mean, standard deviation, and quartiles.
StatisticN μ σ 0th25th75th100th
‘Like’ Count100011.3653.900191426
‘Dislike’ Count1000146.58161.16849108203.2268
‘Match’ Count100012.8105.558091632
‘Message’ Count10000.0000.0000000
Table 11. M2 sensitivity model run summary statistics including type of statistic, mean, standard deviation, and quartiles.
StatisticN μ σ 0th25th75th100th
‘Like’ Count100032.8759.64510264061
‘Dislike’ Count1000140.70756.23250103200251
‘Match’ Count10005.6823.03603716
‘Message’ Count10002.8412.06801414
Publisher’s Note: MDPI stays neutral with regard to jurisdictional claims in published maps and institutional affiliations.

