Article

Development and Characterization of Tailored Polyurethane Foams for Shock Absorption

by
Boumdouha Noureddine
1,*,
Safidine Zitouni
1,
Boudiaf Achraf
1,
Chabane Houssém
2,
Duchet-Rumeau Jannick
3 and
Gerard Jean-François
3
1
Laboratoire Génie des Matériaux, Ecole Militaire Polytechnique, BP 17, Bordj El-Bahri 16111, Algeria
2
Laboratoire de Chimie Macromoléculaire, Ecole Militaire Polytechnique, BP 17, Bordj El-Bahri 16111, Algeria
3
UMR CNRS 5223 Ingénierie des Matériaux Polymères, Université de Lyon, INSA Lyon, 20, Avenue Albert Einstein, 69621 Villeurbanne, France
*
Author to whom correspondence should be addressed.
Submission received: 30 December 2021 / Revised: 16 January 2022 / Accepted: 18 January 2022 / Published: 20 February 2022

Abstract

:
In this paper, different types of polyurethane foams (PUR) having various chemical compositions have been produced with a specific density to monitor the microstructure as much as possible. The foam may have a preferential orientation in the cell structure. The cellular polyurethane tends to have stubborn, typical cellular systems with strong overlap reversibility. Free expansion under atmospheric pressure enables formulas to grow until they are refined. Moreover, the physicochemical characterization of the developed foams was carried out. They later are described by apparent density, Shore hardness, Raman spectroscopy analysis, X-ray diffraction analysis, FTIR, TGA, DSC, and compression tests. The detailed structural characterization was used by scanning electron microscope (SEM) and an optical microscope (MO) to visualize the alveolar polymer’s semi-opened cells, highlighting the opened-cell morphology and chemical irregularities. Polyurethane foams with different structural variables have a spectrum characterization that influences the phase separation and topography of polyurethane foam areas because their bonding capability with hydrogen depends on chain extender nature. These studies may aid in shock absorption production; a methodology of elaboration and characterization of filled polyurethane foams is proposed.

Graphical Abstract

1. Introduction

Human protection systems such as bullet vests, frames, and helmet or nonlethal projectile weapons are increasingly used [1]. Protection materials must be resistant to fire and shock to reduce accidental injuries caused by explosives usage. In addition to their advantage and usefulness (costs, infrastructure, ease of handling, superior performance), polymers can offer the design of safer and cheaper protection systems with suitable fire resistance and shock resistance. Polymer foams, thanks to their cellular structure made up of open or closed cells, are promising candidates with strong shock absorption, excellent acoustic and thermal isolation, and the ability to achieve intumescence [2]. The optimization of properties requires considering the relationship between microstructure and properties. The mechanical response of such materials is based on the nature and the intrinsic characteristics of polymer cell walls such as thickness, distribution, and cell type, which are the basic units for the foam architecture [3]. The mechanical properties can also be tuned by mixing high and low densities [4].
Polyurethane foams can be made of various chemicals and are very tunable. The alveolar polyurethanes are produced by combining poly(isocyanate) with polyols in a blowing agent [5,6]. Flexible, rigid or semirigid foams can be designed according to the composition and chemistry of the reagents in use. Angèle Chomard examined the NCO/OH ratio effects between 1.00 and 1.06 [7]. The fatigue resistance was enhanced and the final polyurethane molar weight was increased, along with strength, variability, and better-controlled alternating flexible segments (SS) and rigid segments (SR) [8]. A high ratio increases the risk of cracking. Thus, a balance between mechanical strength and usage must be established. The number of urethane and urea bonds is usually increased when the ratio of NCO/OH increases, thus raising the possibility of hydrogen bonding. This effect increases the amount of the rigid segments, leading to an increase of elastic module E, an increase of the crystallinity degree to which rigid segments crystallize, and a decrease in the elongation of the polymer [7]. With a ratio of NCO/OH less than 1, mechanical properties (modulus, tension, and stress at break) are poor because of the low molar mass of the shaped PU chains [9]. The improvement in the total NCO/OH ratio a small amount above 1 gives the possibility to compensate for the lack of isocyanate feature by side reactions and therefore provide a higher modulus by optimizing the chain’s elongation and growing the intensity of the urethane bonding device [10]. Recently, one of the main facets of change in the processing of polyurethane products is the exclusion of hazardous substances from the production method and their substitution with environmentally safe ones [11].
Concerns about materials derived from petroleum resources are common owing to their environmental and healthcare implications. That is why scientists were keen to develop polyurethane foam of vegetable origin. Ghasemlou et al. studied the biosynthetic pathways for synthesizing cyclic carbonates and non-isocyanate polyurethanes (NIPUs) [12]. Luca Bossa et al. prepared Mannich-based polyol for hard foams [13] and the promotion of a homogeneous dispersion of fillers within the polymer matrix [14]. Ghasemlou et al. used synergistic interactions to fabricate transparent and mechanically robust nanohybrids based on starch, non-isocyanate polyurethanes, and cellulose nanocrystals (CNCs) for the development of sustainable, high-performance materials [15].
Since Kistler suggested the manufacture of silica aerogels in the 1930s [16], great attention has been paid to new advancements in fillers with alumina (Al2O3) [17,18] and multilayered fillers mainly from clays [19,20]. Their unique form impacts polyurethane foam, leading to extremely exceptional durability and stability. Their low-cost, nonflammable and nonreactive character with superior damping properties makes it suitable for applications in the military field and home, aerospace, and automotive applications. Increasing concern has been raised about the evolution of loaded polyurethane foam using the sol-gel method. The foams obtained showed improved thermal resistance and heat insulation compared with conventional polyurethane foam [21]. But this is not sufficient without improving the structural properties and particularly the shock resistance [22,23]. Alumina and bentonite are effective structural additives and are also flame retardants at the same time in comparison to other materials. Chen et al. prepared, PVA-based aerogels including silica plus montmorillonite by a freeze-drying process and conducted a comprehensive and structured assessment to study the stability of the PVA compounds [24].
Moreover, the flammability of polymers such as polystyrene, polypropylene, and polyamide can be improved by dissolving the combined silica aerogel as a flame resistance additive [25]. Both bentonite and alumina can improve the physical properties of polymer foams by providing lamellar roughness. The present work describes a new strategy for manufacturing polyurethane foams having given densities. Different proportions of structural fillers are incorporated using the combined process, i.e., homogeneous mixing and free expansion. Other contents of bentonite and alumina fillers are mixed in the polyurethane matrix. The follow-up of the polymerization of co-monomers, alone or in the presence of fillers, is made by FTIR analysis. At the same time, the company and the excellent scattering of the stuffing in the polymer foam are confirmed by scanning electron microscopy. Generally, polyurethane foams are made as the foam is being made. Nevertheless, the challenge is the promotion of homogeneous dispersion of fillers within the monomers before the polymerization and the foaming. Even though previous studies have provided significant insights on improving shock absorption capacity, thermal stability, and insulation, the efficiency of alumina and bentonite on the shock-absorbing effect of polyurethane foams was not investigated [5,26].

2. Materials and Methods

2.1. Materials

The polyol P0010 provided by Confortchem (Pointe-Claire, QC, Canada), is a polyether polyol (POPE) grafted by 10% styrene-acrylonitrile (SAN) chains. At RT, its density is 1.1 g cm−3, and its viscosity is 5.842 Pas.
The diisocyanate is a polymeric methane diphenyl diisocyanate (PMDI) containing 30% NCO, which BASF provided.
Four catalysts were used: Tetramethylenediamine (TMD) solid catalyst acquired from Merck KGaA - Strasbourg; Triethylenediamine (A-33), with a concentration by 33% in dipropylene glycol (DPG) provided from Struktol (Stow, OH, USA); (bis(2-dimethylaminoethyl) ether (A-1), a potent amine catalytic agent, with a concentration of 70% in DPG, obtained from Niax (Waterford, NY, USA); 2-Tin ethylhexanoate (A19) from Niax exploited due to its ability to stimulate the secondary isocyanate-hydroxyl reaction and on its excellent solubility in polyether polyols.
The crosslinking agent used as a chain extender is glycerol C3H8O3 (GCO) from PanReac (Darmstadt, Germany). The molar mass is 92.10 g·mol−1.
The surfactant used is a non-hydrolyzable silicone (L-580 Aspect (HS) oil) for cellular polytheistic PUR from Niax. Its density at RT is 1.026 g·cm−3.
The blowing agent is dichloromethane (CH2Cl2), at 99.8% purity supplied by AcroSeal (Illkirch-Graffenstaden, France).
Hydrochloric acid (HCl) is a hydrogen chloride aqueous solution, 37%, were received from Biochem Chemopharma France, and hydrogen peroxyde 10%, was acquired from Saidal (Algiers, Algeria).
The selected Coloring Agent (AO) is conventionally used in the polyurethane industry, and the microparticle (pigment) is distributed into a polyether polyol (with main OH groups), supplied by Evonik Industries (Essen, Germany).
The plasticizer used is dibutyl phthalate (DBP) with the chemical formulation C₆H₄ (CO₂C₄H₉)₂ and a purity of 99%, acquired from Interchimie (Compans, France).
We selected aluminum oxide Al2O3 (Alumina), bulk density is 3.69 g/cm3 made of refractory clays based on a mixture of silica-alumina bricks by Mountain Debbagh halloysite and Tamazert’s kaolin. The bentonite (BNT) used in the context of this work is natural, extracted from the Hammam Boughrara deposit of Maghnia, and which has a trade name of “Bentonite Brute”, consisting essentially of montmorillonite and with a bulk density of 2.2–2.4 g/cm3, acquired from Bental (Mostaganem, Algeria).
We did the chemical modification Na-MMT; after that, MMT (25 g) was put in a 400 mL flask, followed by distilled water (400 g), and OTAC (6.77 g) was added. The response temperature was maintained at 350 K for 3 h and then filtered. Finally, organically adjusted montmorillonite was washed 3–5 times with distilled water, positioned in an oven, and dried for 6 h at 370 K. Finally, we got OMMT ground (montmorillonite that was changed organically).

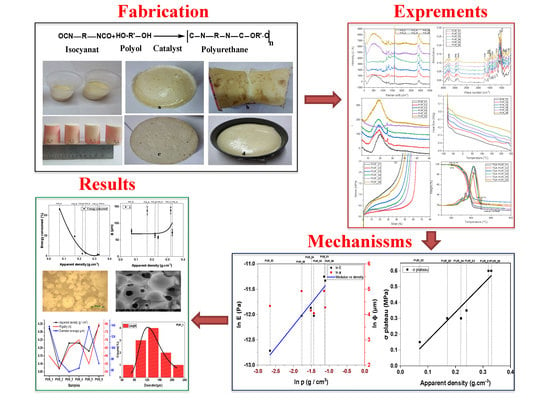
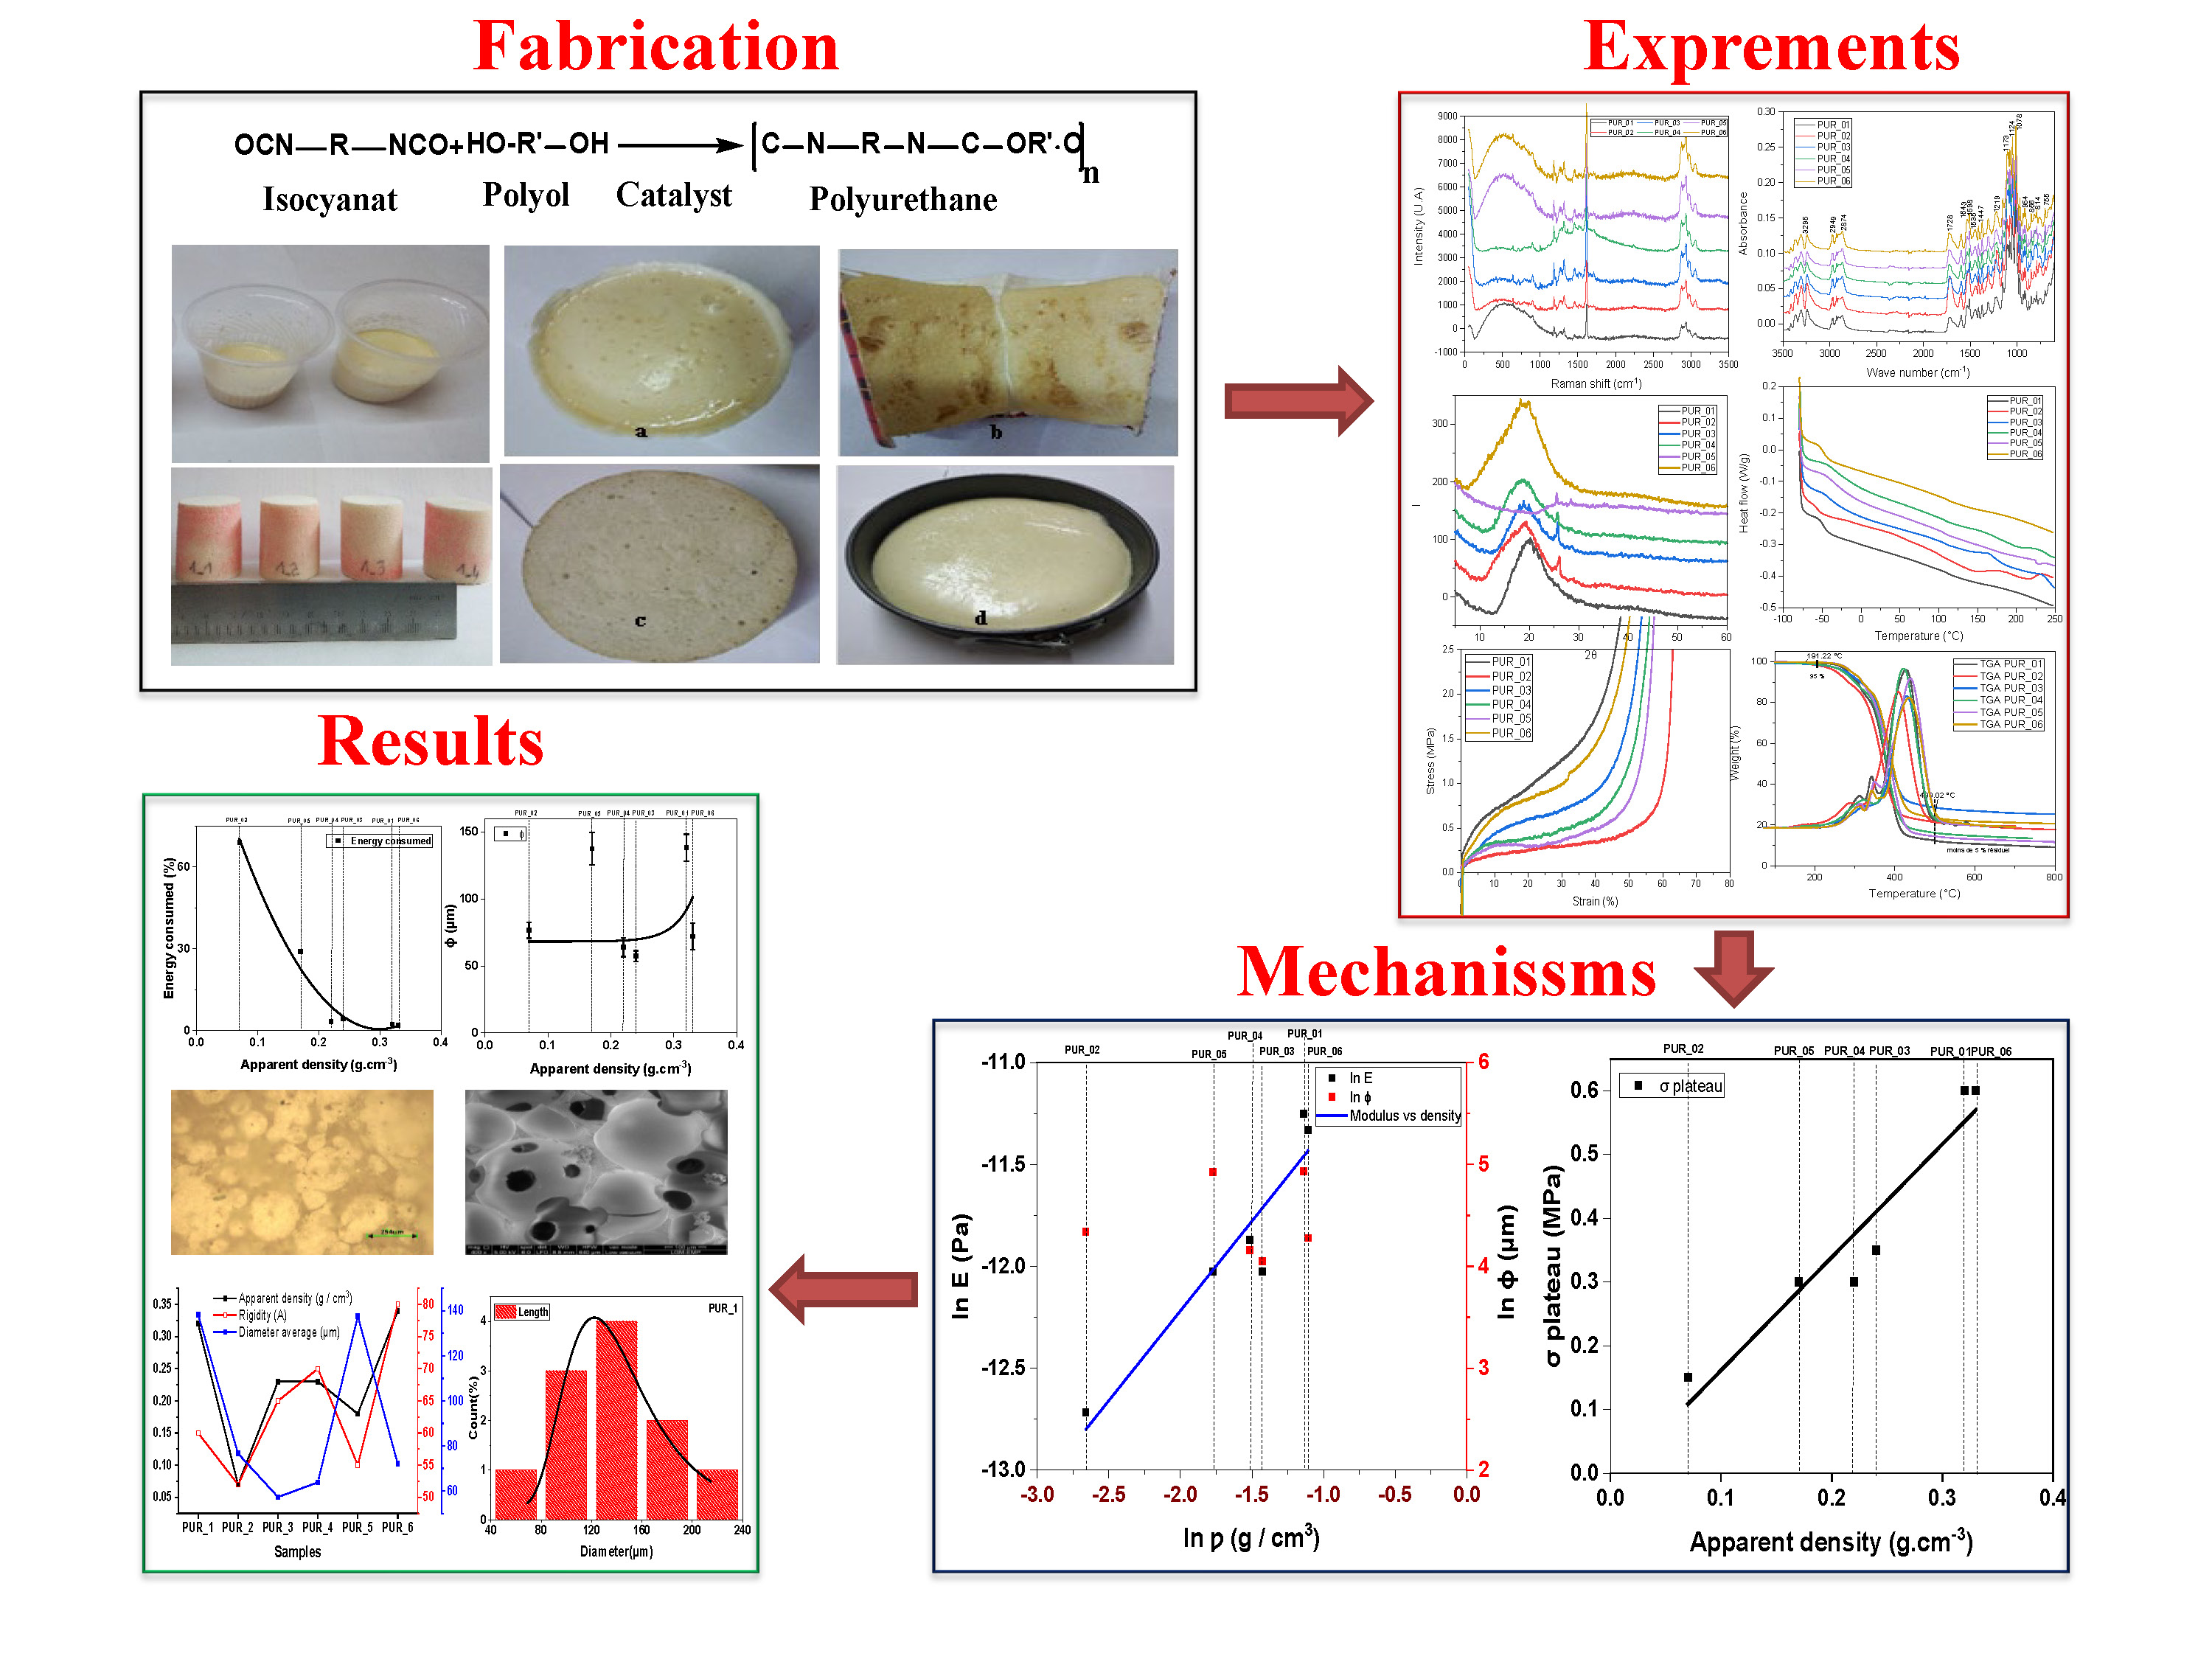
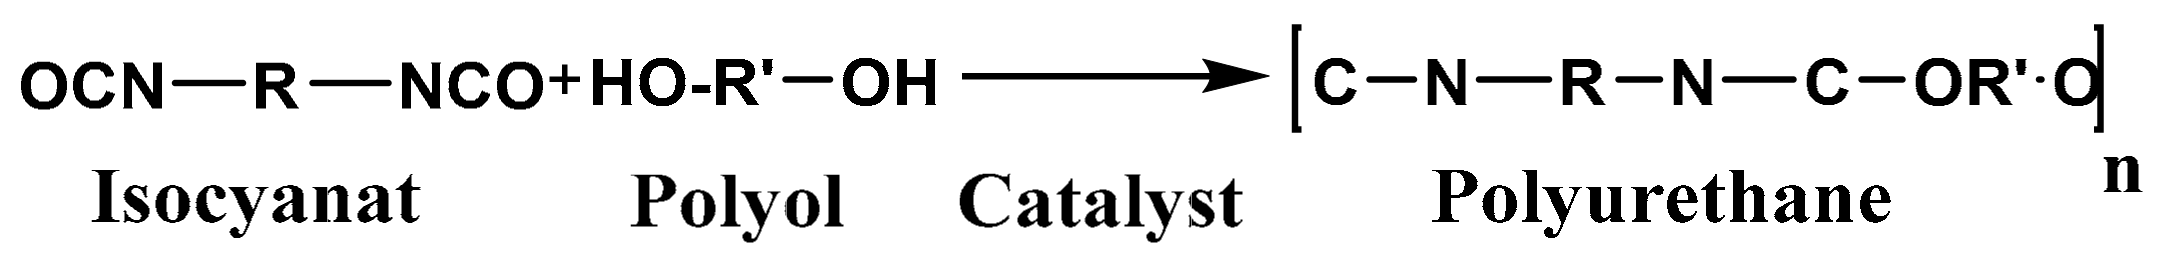
2.2. Processing of Polyurethane Foams (PUR)

The polyurethane foam is formed from various components undergoing two simultaneous reactions. As seen in Figure 1, polyol and diisocyanate react to generate polyurethane macromolecules [27]. The response is exothermic, and the heat is used to evaporate volatile liquids, i.e., blowing agents responsible for the expansion and the processed foam. Carbon dioxide is formed through auxiliary reactive chemicals vaporized during the reaction to provide additional gases that blow the liquid polymer, as shown in Figure 1.
In this mechanism, a carbamic acid is formed as an intermediate. This reaction produces 197 kilojoules of heat per mole of water. Reacting with another isocyanate group gives disubstituted urea or urea, or urine. An isocyanate can react with disubstituted urea to form a substituted biuret. Several authors have published kinetic experiments on the carbon dioxide formation rate [28]. Isocyanates react with labile hydrogen compounds in a sophisticated way that produces hydrogen cyanide as a byproduct. Allophanates are formed when isocyanates combine with urethanes between 100 and 140 °C (Figure 2d). An analysis of the literature explains the complicated reaction pathways related to the isocyanate function. Many of these methods are still speculative, and their validation takes considerable time [29].
The choice of polyol, isocyanate rules the processing of flexible polymer foam materials and the most suitable catalyst to achieve a reliable recipe leading to a flexible foam with the desired characteristics. Catalysis is necessary for processing material in an economically viable period, from an industrial point of view [30], i.e., no more than 10 min. PUR development in free expansion mode is carried out at atmospheric pressure using a 300 mL reactor with a mechanical stirrer with 2500 rpm speed. After the thickening of the PUR and its cooling, the foam is removed from the mold. After 24 h in the open (to harden), the remolded product is kept away from light and moisture for later evaluation. The diagram displays our experimental approach in Figure 1 in support information (SI).
All formulations are summarized in Table 1. Bentonite was added to neat polyurethane formulations to improve the intumescence and stiffness of foams. Other additives such as stabilizers and technological adjuvants are added to modify the properties of foams. The formulations are according to the following code PURNCO/OH/Catalyst/BNT/Al2O3 in Table 1.
We investigated the influence of the catalyst and surfactant NCO/OH ratios and the effect of additives on the kinetics of the expansion process and the shape and stiffness of the polyurethane foam.

2.2.1. Influence of the NCO/OH Ratio

To optimize the free expansion formulation of PUR, we used the ratio of NCO/OH made with catalysts: BDMAEE (5 wt.% POPE)/2-TEH (2.5 wt.% POPE), described as the relationship of -NCO number per kg of -OH functions per kg, recognizing that the ratio of the PUR varies from 1.01 to 1.1. The marginal NCO excess will lead to lower characteristics, especially modulus, since the reaction will be thus incomplete. The two remaining formulae were chosen to minimize the number of available NCO functions and processed at a 1.06 NCO/OH ratio. PUR formulations with an NCO/OH ratio of PUR_2, PUR_ 5, and PUR_1 achieved our objective, including open cells. The foam resulting from PUR_3 had a stiff feature and homogenous cell dispersion. The PUR_4 based foam was still stiff, but the cells’ distribution was more or less homogenous. The foam resulting from PUR_6 looked pretty rigid, but it was still dense and sticky. We set the PMDI, polyol, and glycerin concentrations and changed the additives’ ratio to small quantities (summary in Table 2).

2.2.2. Influence of the Catalyst

Four catalysts were used while keeping the NCO/OH proportion. Since the resulting foam was in a semirigid shape, whatever the type and mass of the catalyst, adding A33 alone at 5% of the polyol (POPE) mass resulted in a relatively good expansion reaction, which created an intact semirigid substance (Figure 3a). Adding A33 and EO at 5 and 0.5% of POPE resulted in a speedy cream expansion of fewer than 12 s (Figure 3b). Lastly, the essential components were not even correctly combined. For both catalysts, adding A33 and EA1 at 2.5% of POPE resulted in a versatile substance with slight expansion due to low reaction acceleration (see Figure 3c). The inclusion of A33 and TMD at 5% and 0.5% of POPE, respectively, resulted in an exceedingly slow growth with a 320-s improvement. Therefore, it can be inferred that the benefit of adding TMD is the position of an expansion retardant. Still, its crucial downside is the reaction with isocyanates to urea, which is why the spray looks very sticky (Figure 3d).

2.3. Physical-Chemical Characterization

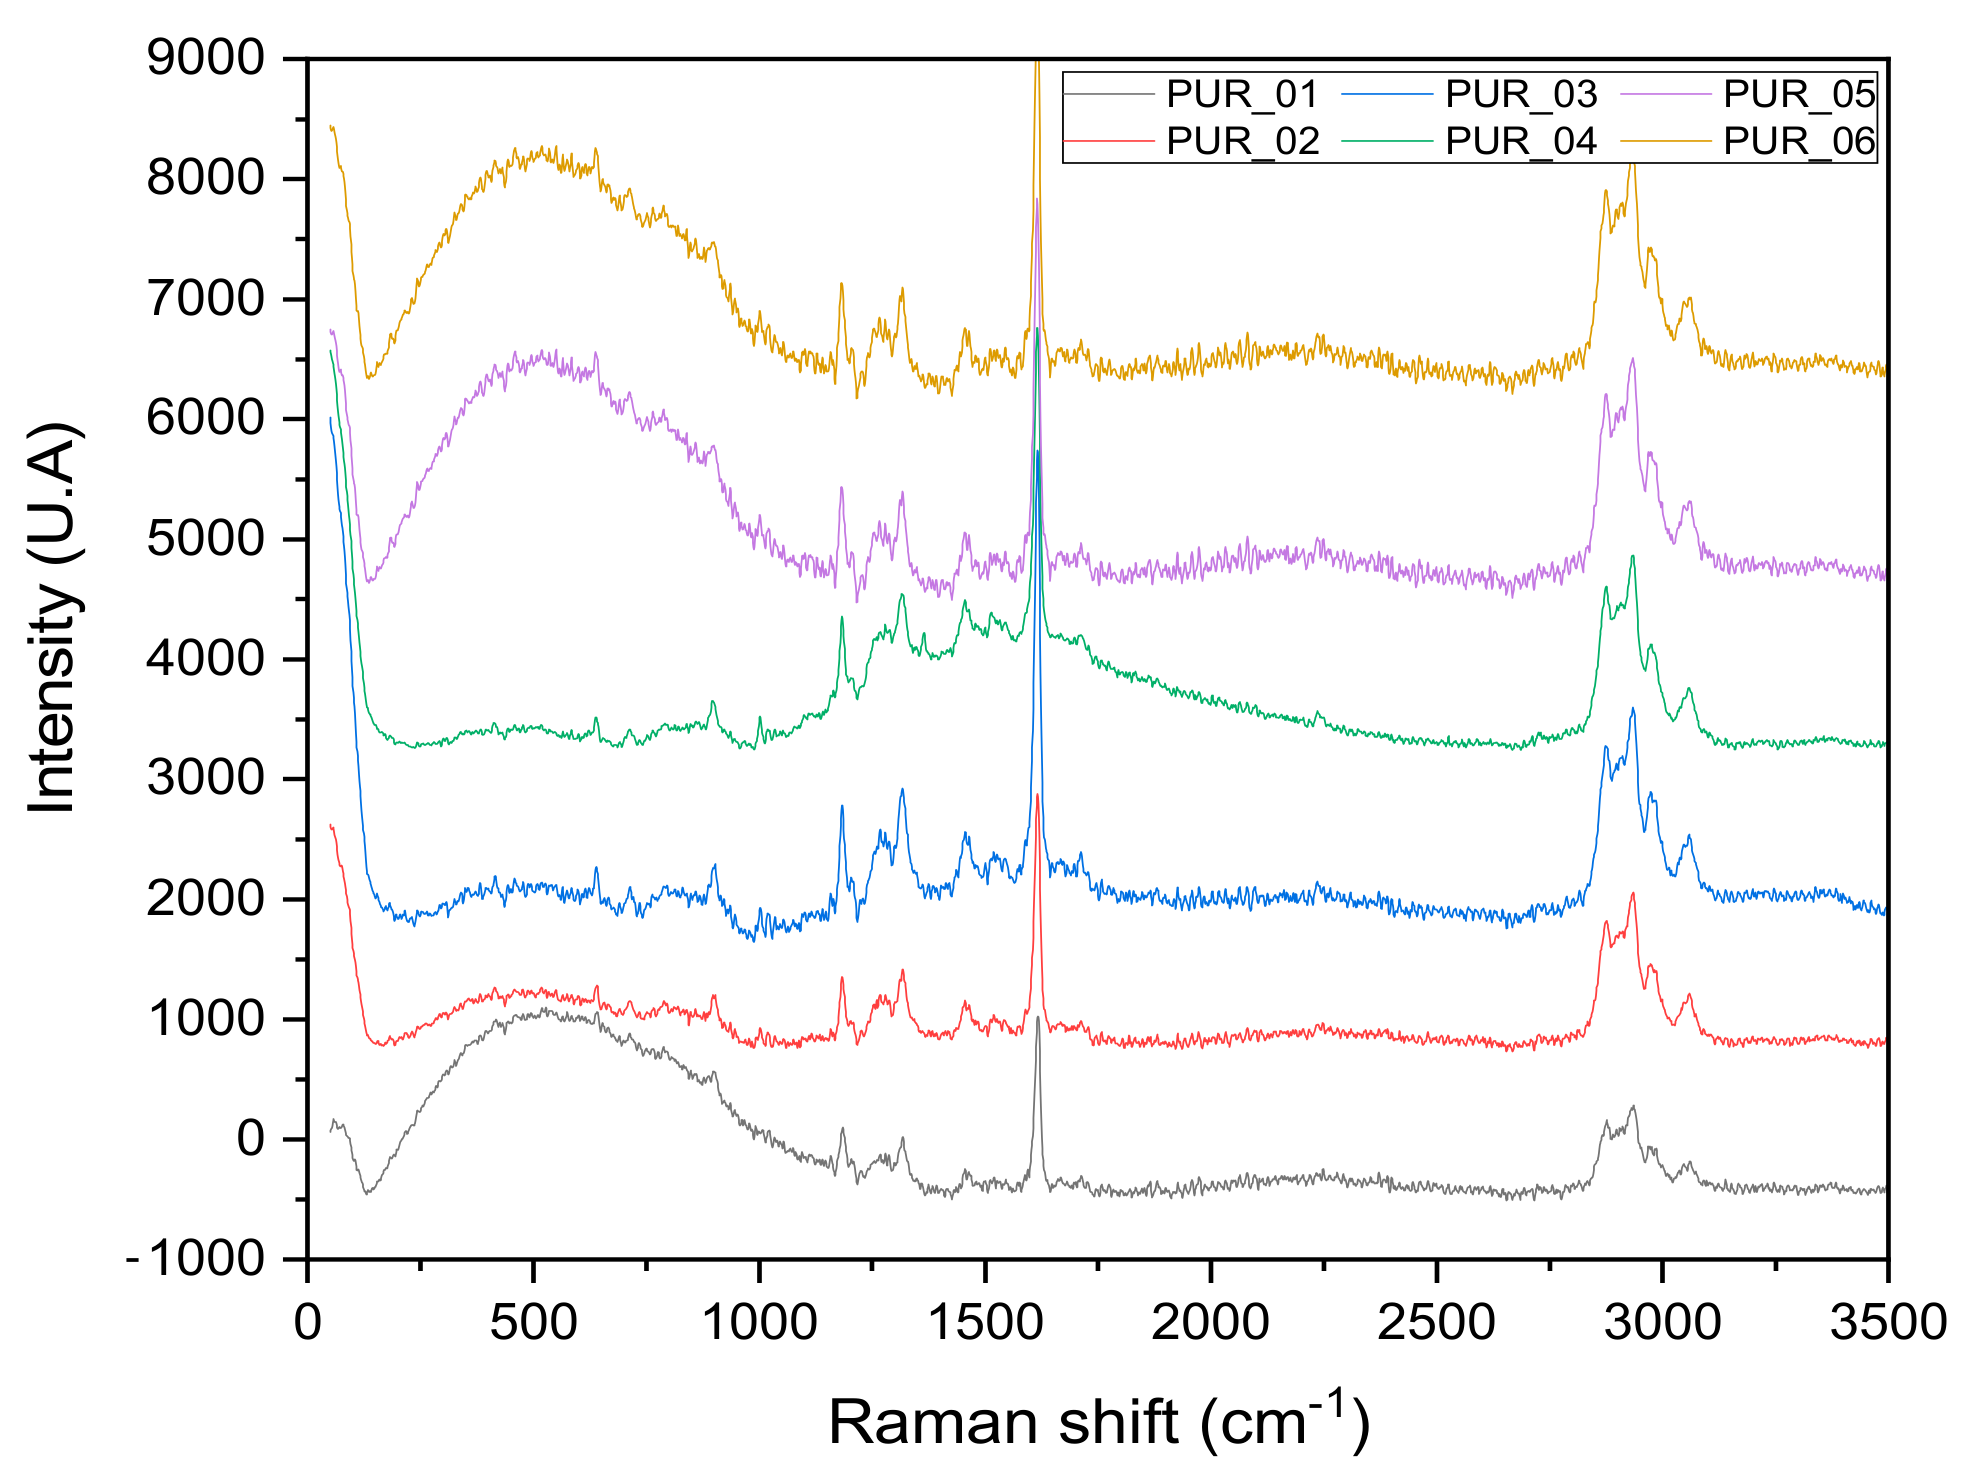
2.3.1. Raman Spectroscopy

We used a model Forman 685-2 Foster spectrometer for Raman characterization, powered by 685-2 software form, and a laser diode emitting red bright by 685 nm wavelength. Raman’s offsets 400–2000 cm−1 range were calculated. The parameters of acquisition used were 532 nm green laser with 1% power, x50 microscope objective, the woven spectral range of 100 toward 3200 cm−1, 10 s exposure time, three accumulations for respective spectrum. The spectra obtained were broken up by the TA Universal Analysis and Dmfit2011 software [31].

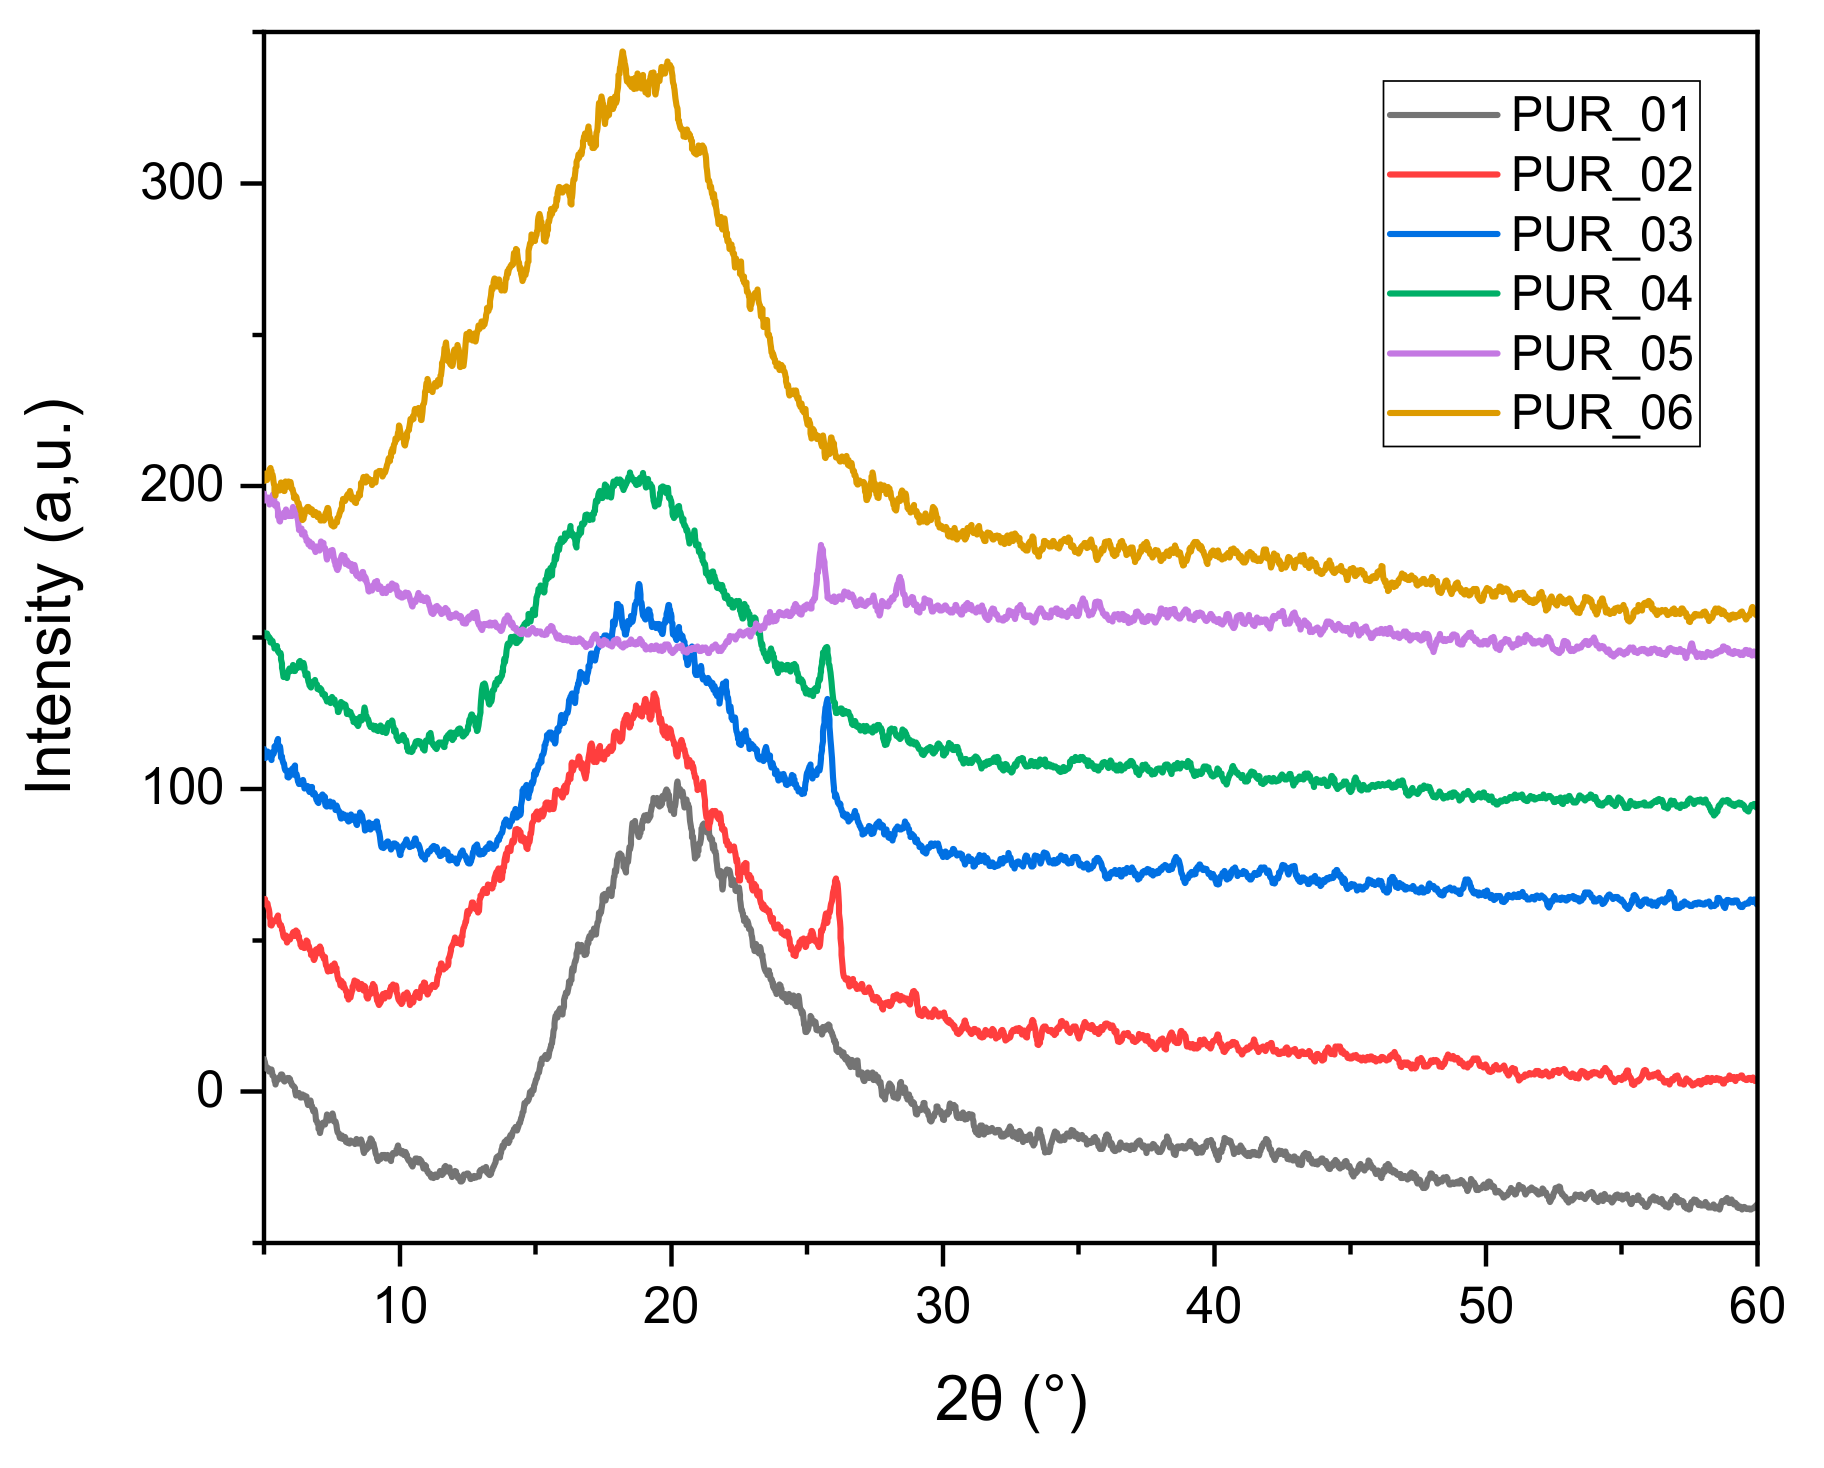
2.3.2. X-ray Scattering (WAXS)

Porous phase dimensional characterization was mainly achieved by X-ray diffraction (XRD). This device has a GD 2000 goniometer and is managed by WinDust32. The diffractogram was deconvolved with the Gaussian function to compute the amorphous and crystalline phases. The peak areas were calculated using WinAcq32. The radiation used was of CuKα type with a voltage of 40 kV and 30 mA and an angle speed of 0.01°/s. The fillers bentonite and alumina were crystalline. The software WinDust 32 and WinSearch indicated a tetragonal crystalline system with mesh a = b = 3.78 and c = 9.51 for bentonite. In addition, the hexagonal system for alumina with parameters of mesh a = b = 4.98 Å and c = 17.02 Å.

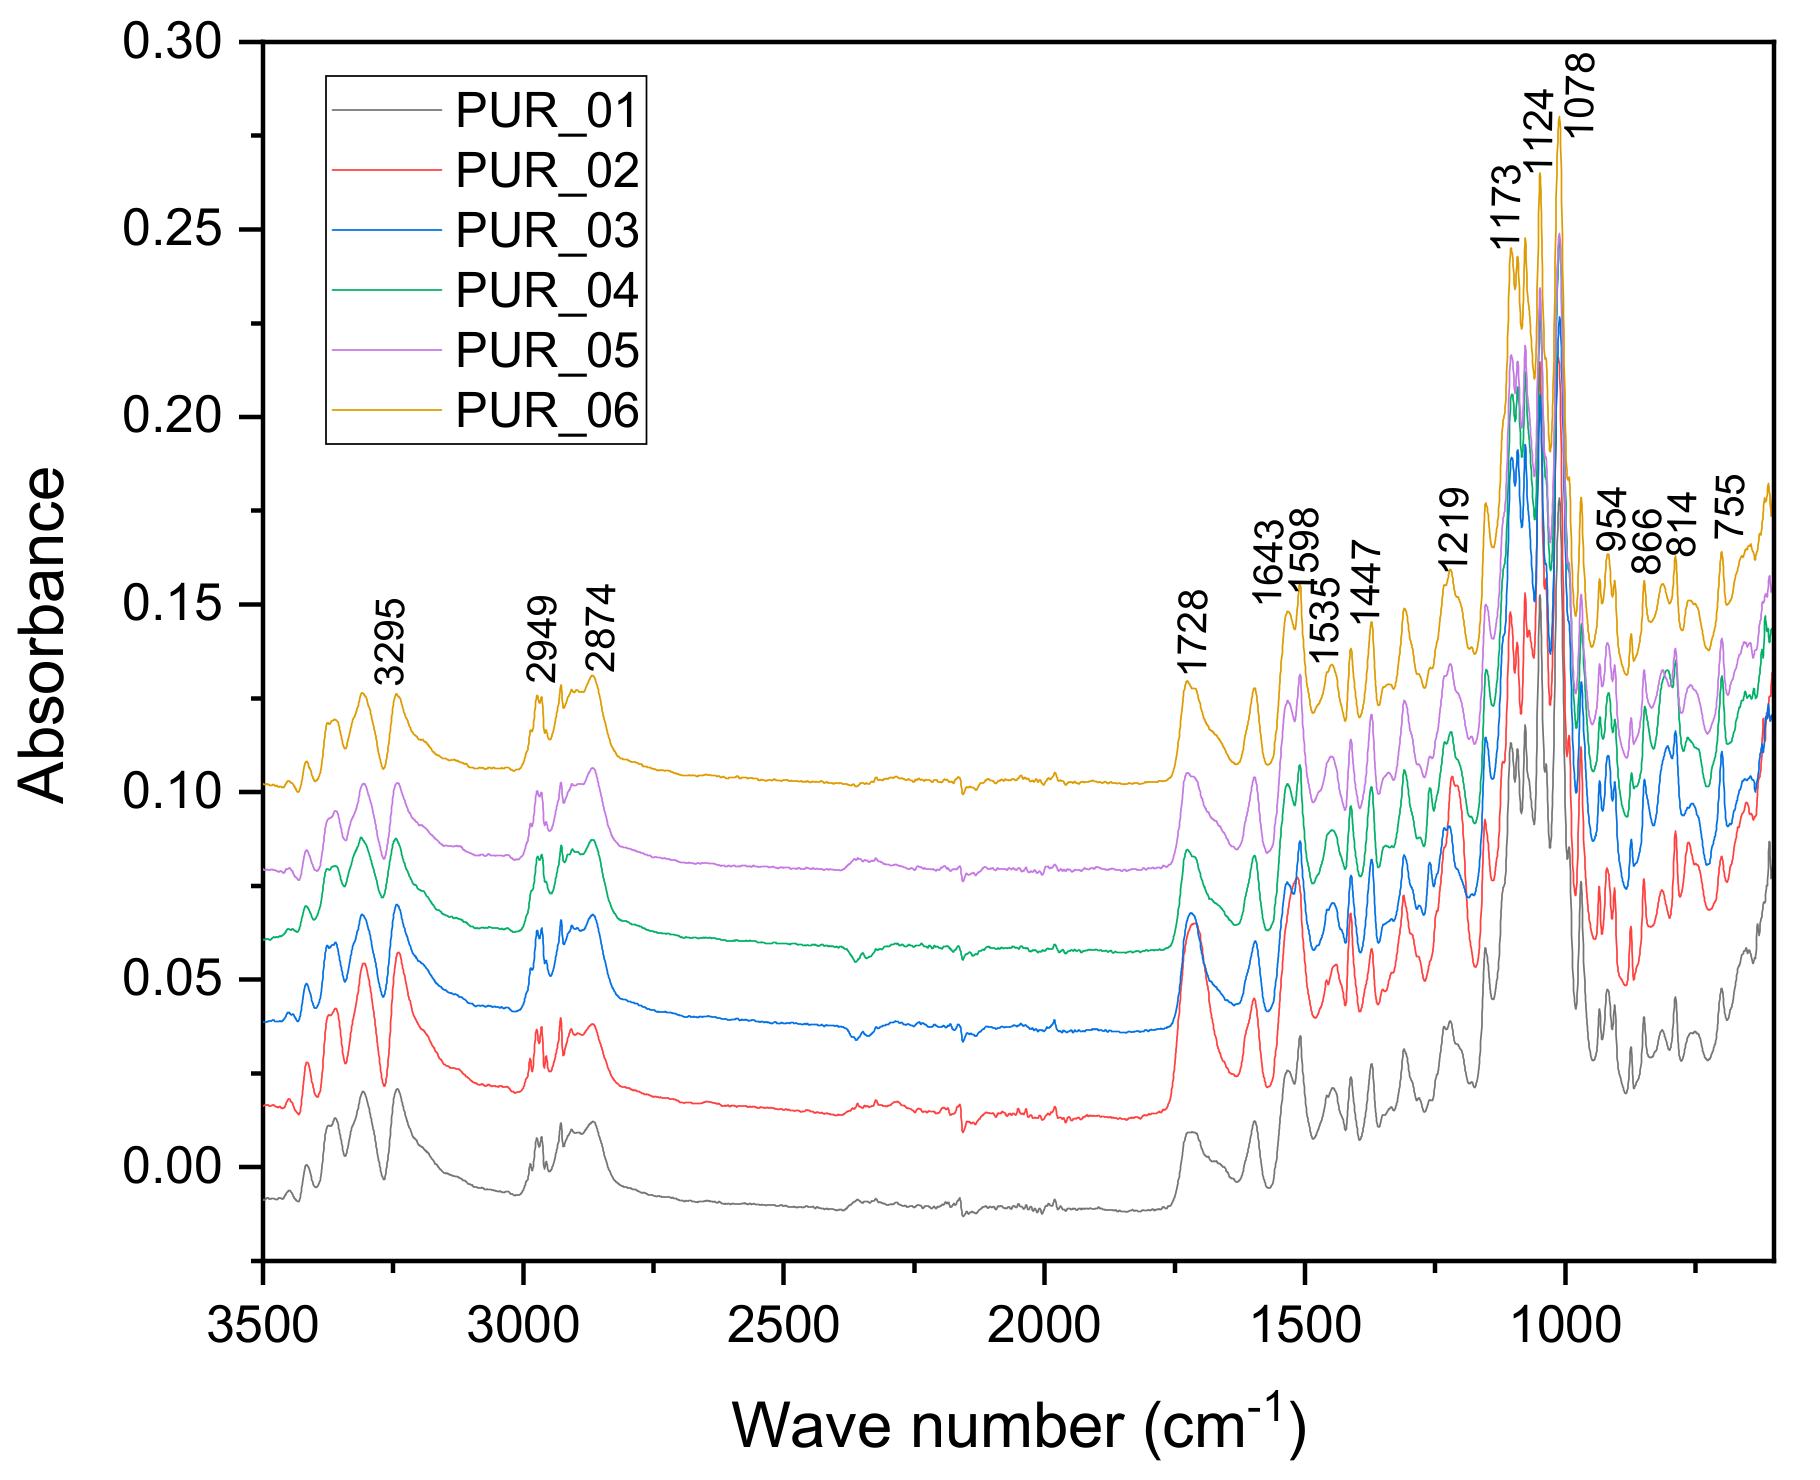
2.3.3. Analyses Spectroscopy FTIR

Fourier’s Infrared Transform Spectroscopy (FTIR) is a well-developed analytical method for hydrogen bonding analysis and phase separation phenomena [32].
The spectrophotometer is a SHIMADZU, type 8400 S. The analytical range is about 500–3500 cm−1 with 60 scans and 2 cm−1 resolutions. A mass of 2 mg of samples was compacted under a 60 kN press.

2.3.4. Thermogravimetric Analysis

Thermogravimetric analyses (TGA) were conducted under a nitrogen flow and performed with a TA Instruments Q50. The weight of the sample ranged from 3 to 4 mg. This thermal degradation took place in inert or oxidizing gas atmospheres. Samples were heated at 10 °C·min−1 from 20 °C to 500 °C.

2.3.5. Differential Scanning Calorimetry (DSC)

DSC was performed on a TA Instruments Q100 under a nitrogen flow. Nonhermetic aluminum capsules were used for 3–5 mg samples. The heating of the first ramp was made at 10 °C·min−1 up to 125 °C. The sample was cooled down at 10 °C·min−1 up to −100 °C. The heating second ramp was performed with the speed of 10 °C·min−1 up to 250 °C, 200 °C or 150 °C depending on the sample degradation temperature.

2.4. Microstructural Characterization

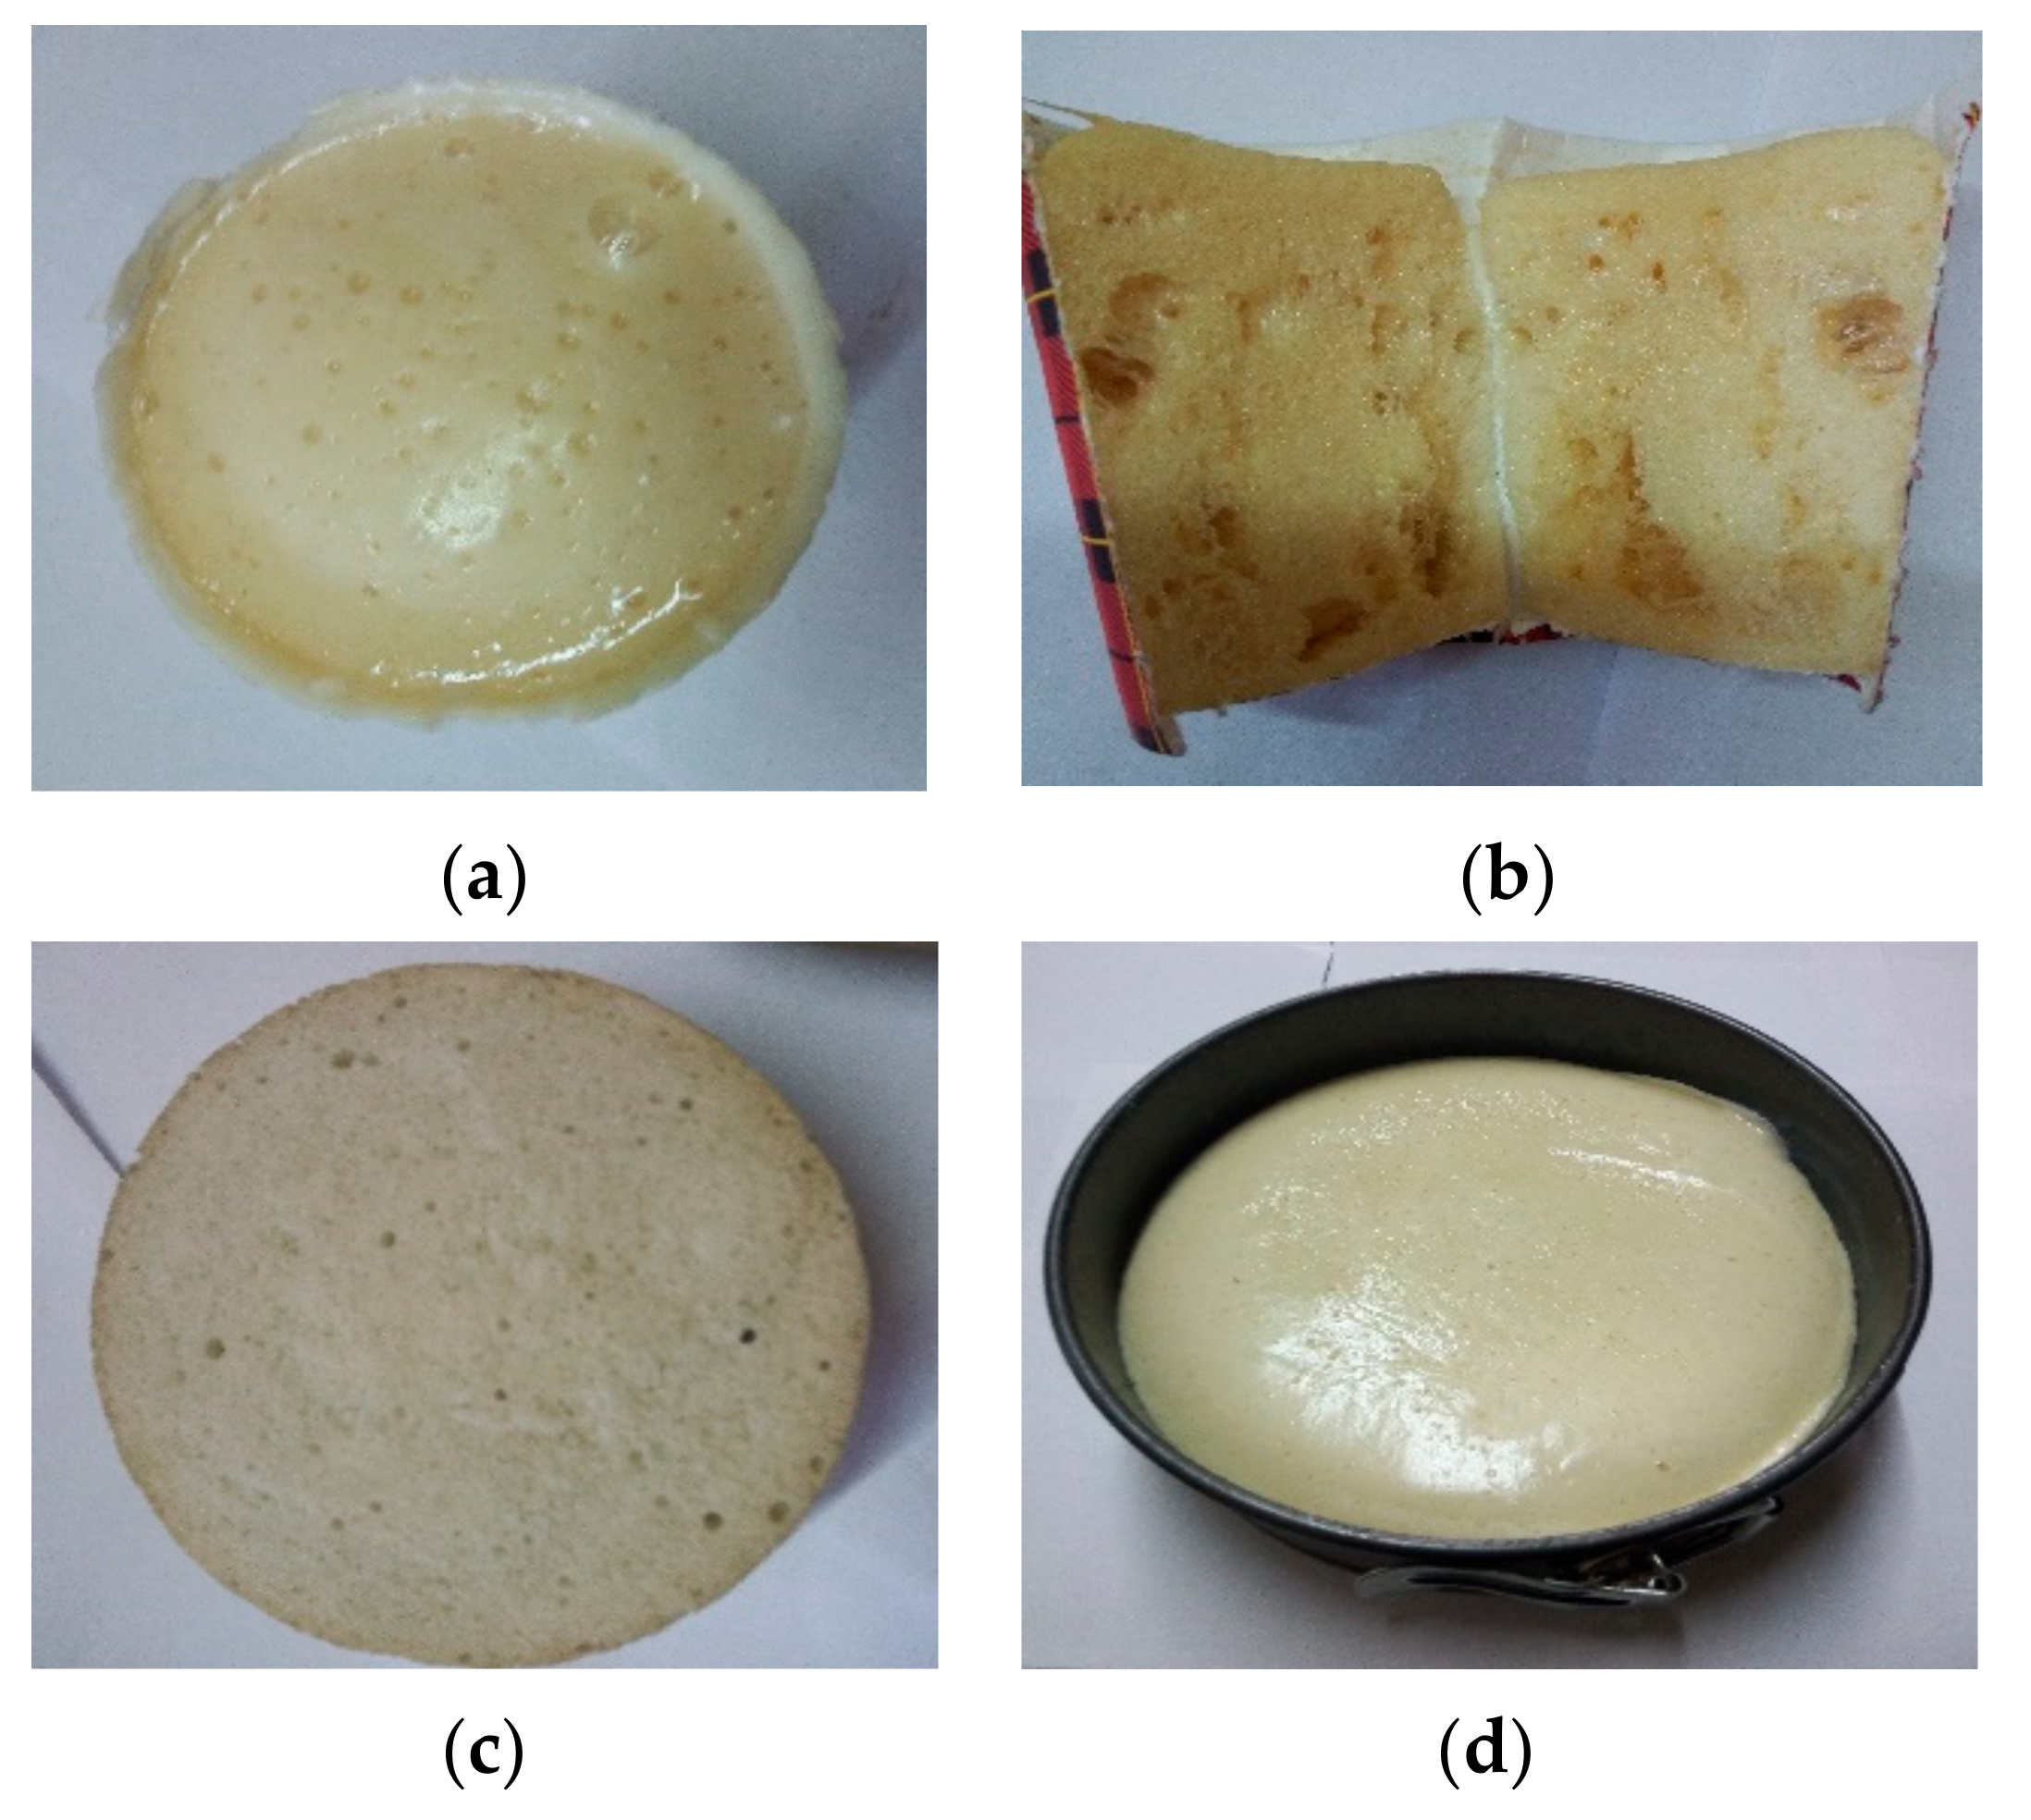
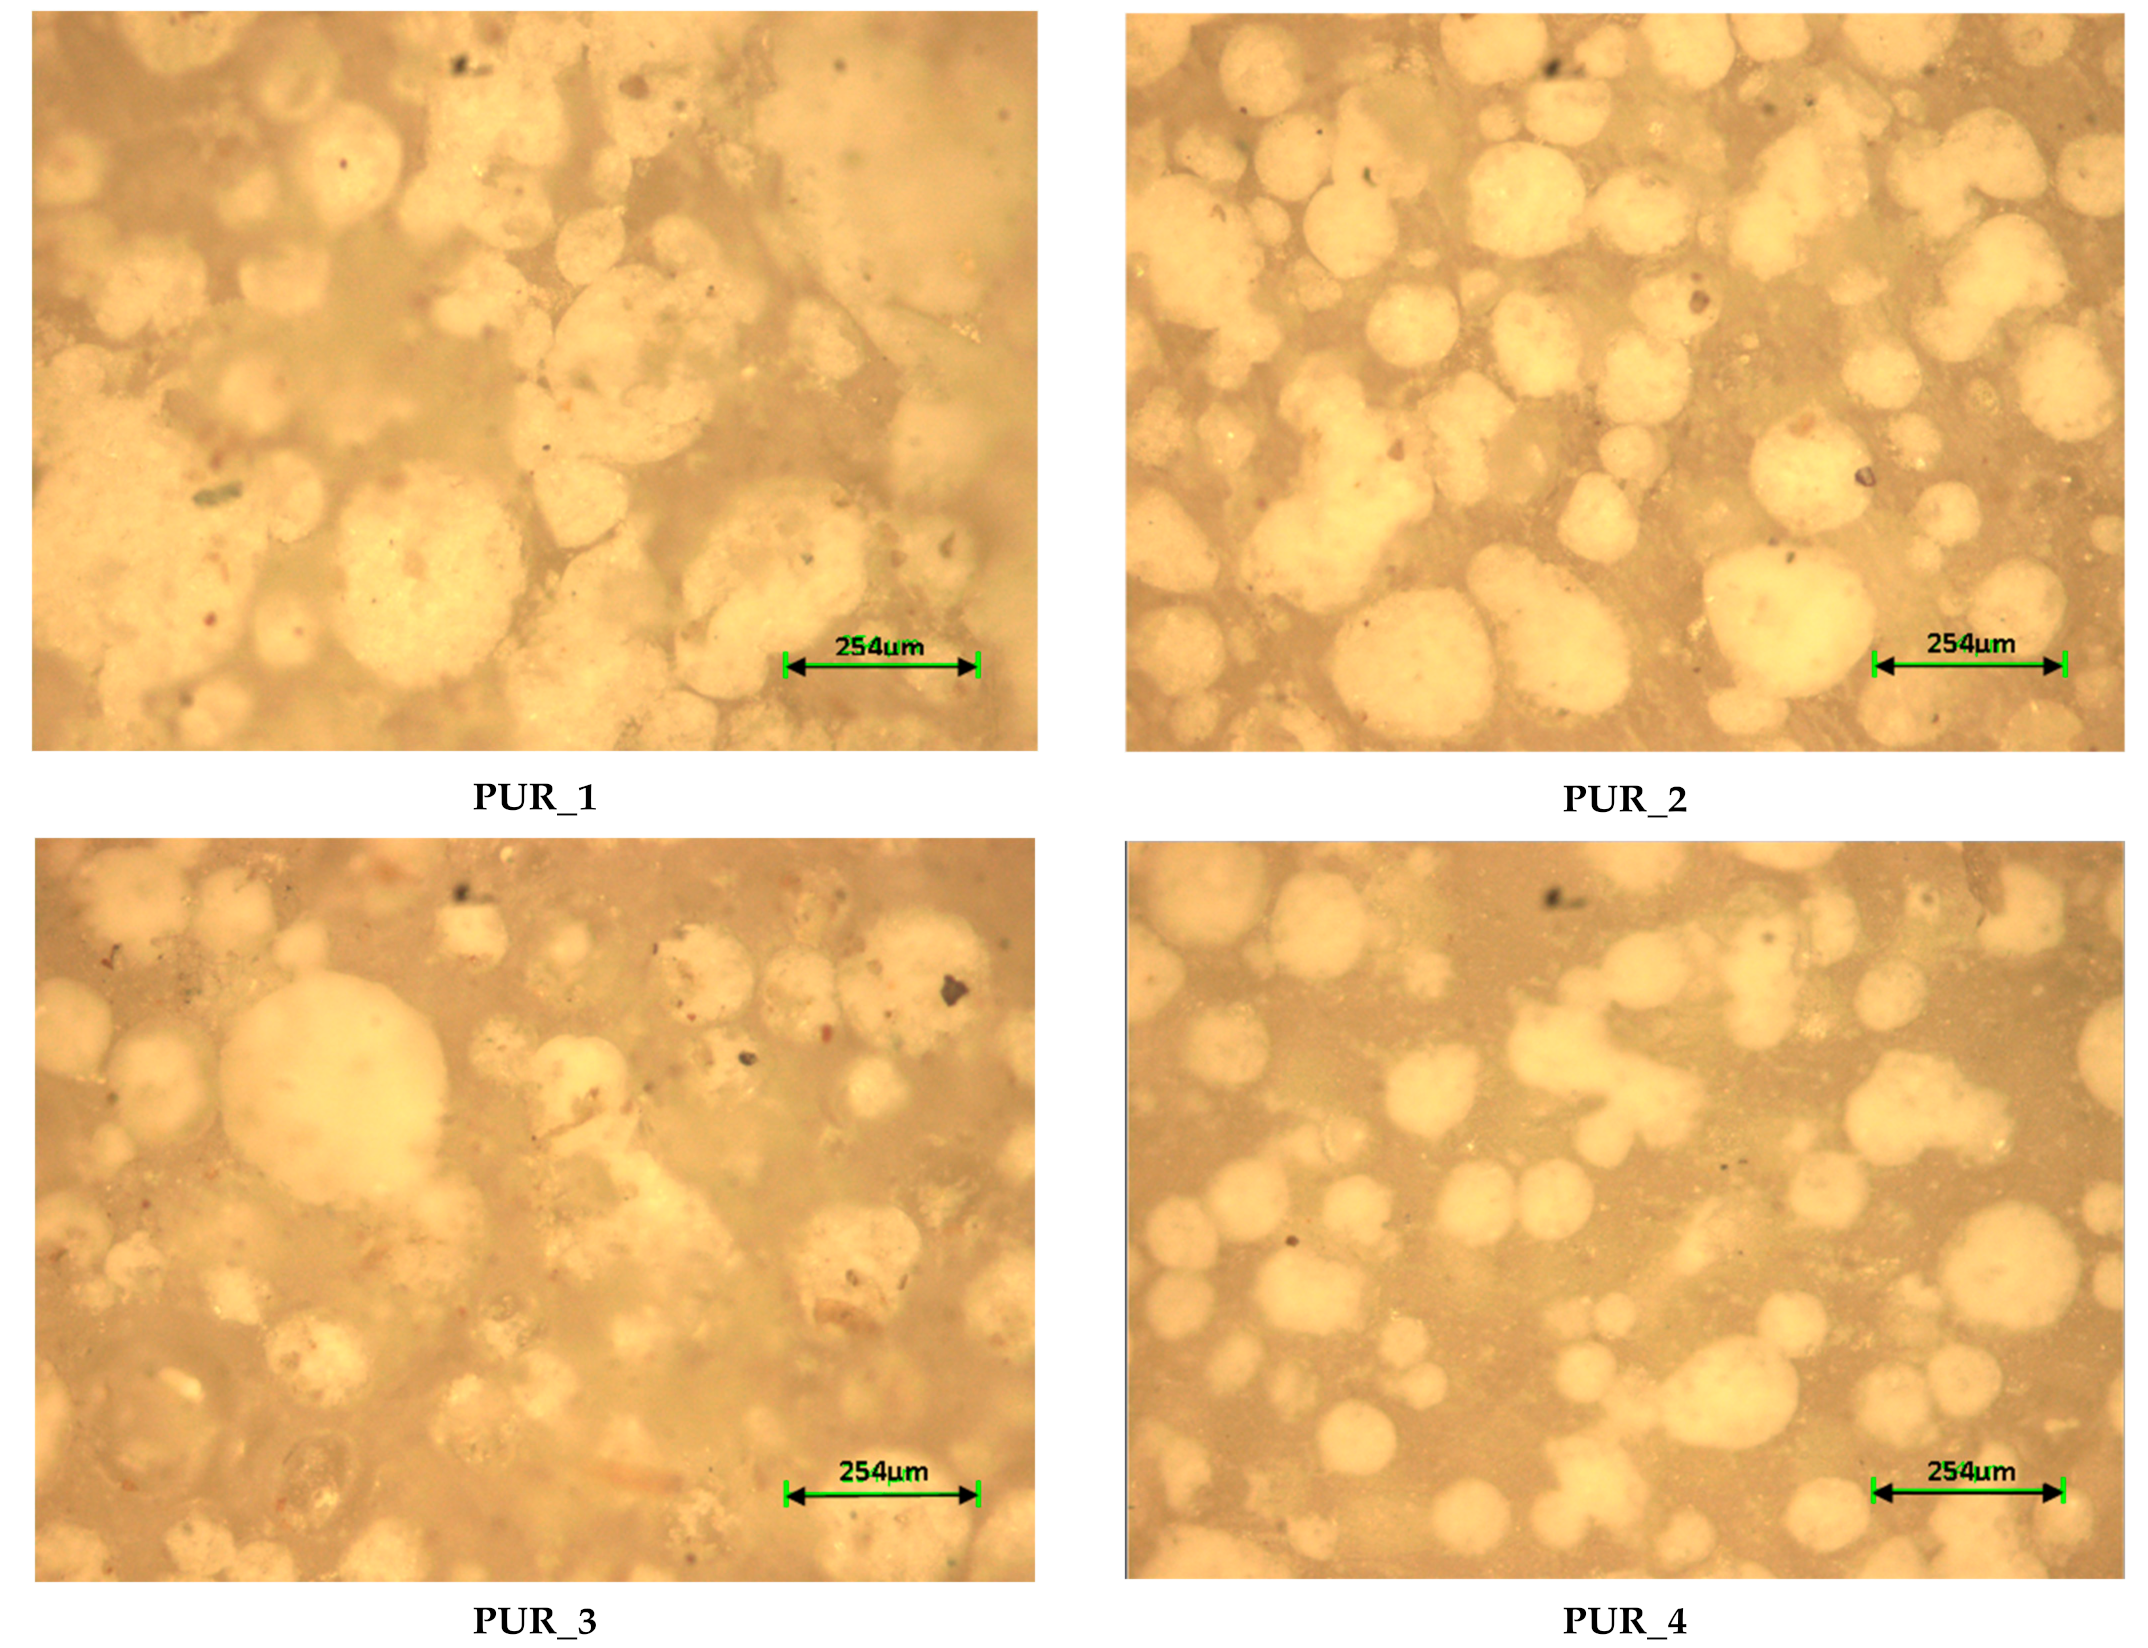
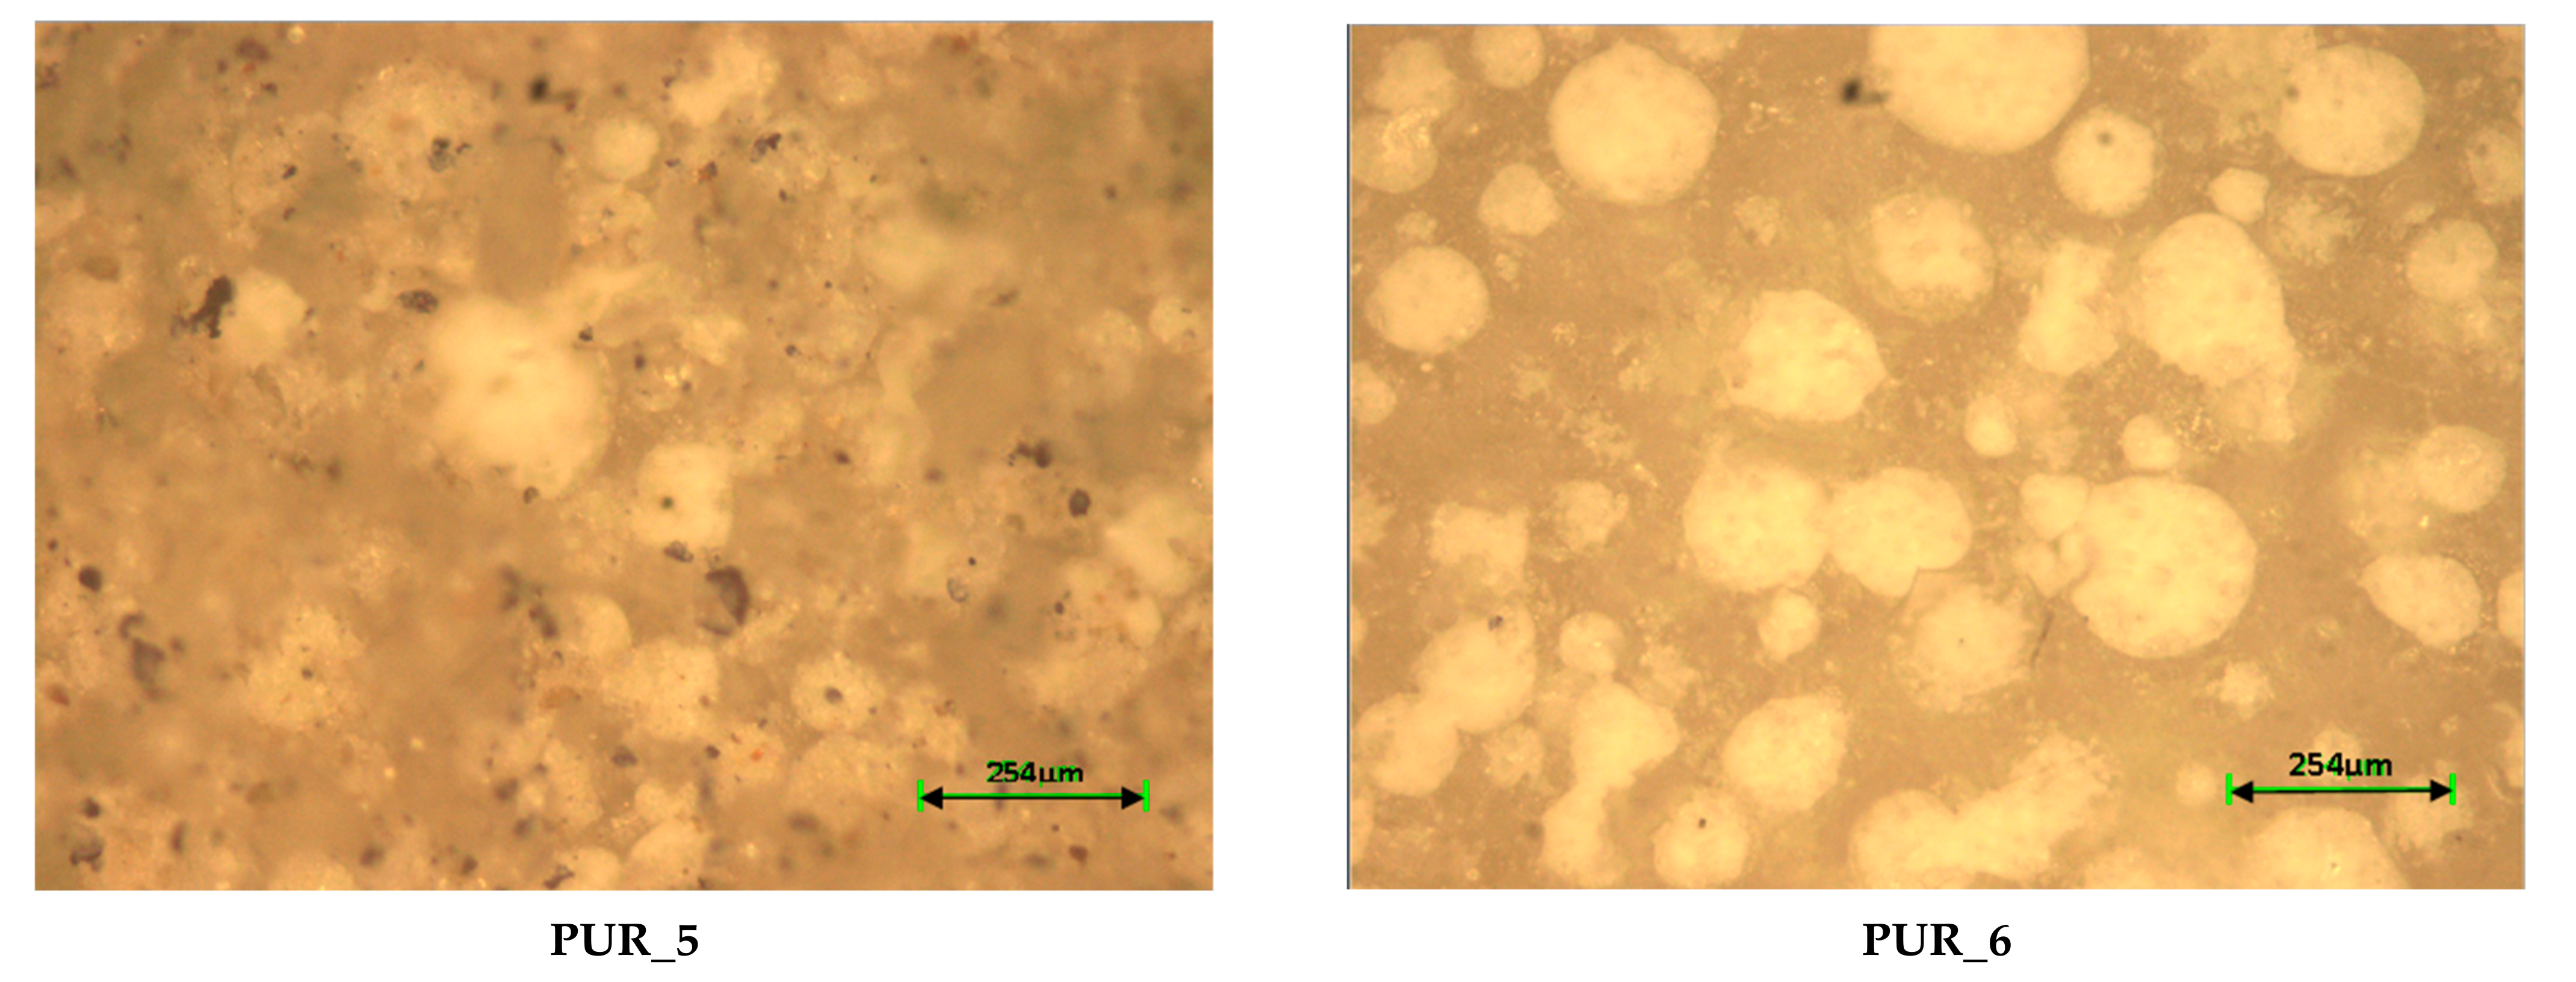
2.4.1. Optical Microscopy

Microstructural analysis was performed using an optical microscope OPTO-EDU A12.1502-T Advanced Compound Trinocular. Optical microscopic depth limits indicate that low magnifications are suitable for the three-dimensional nature of foams.

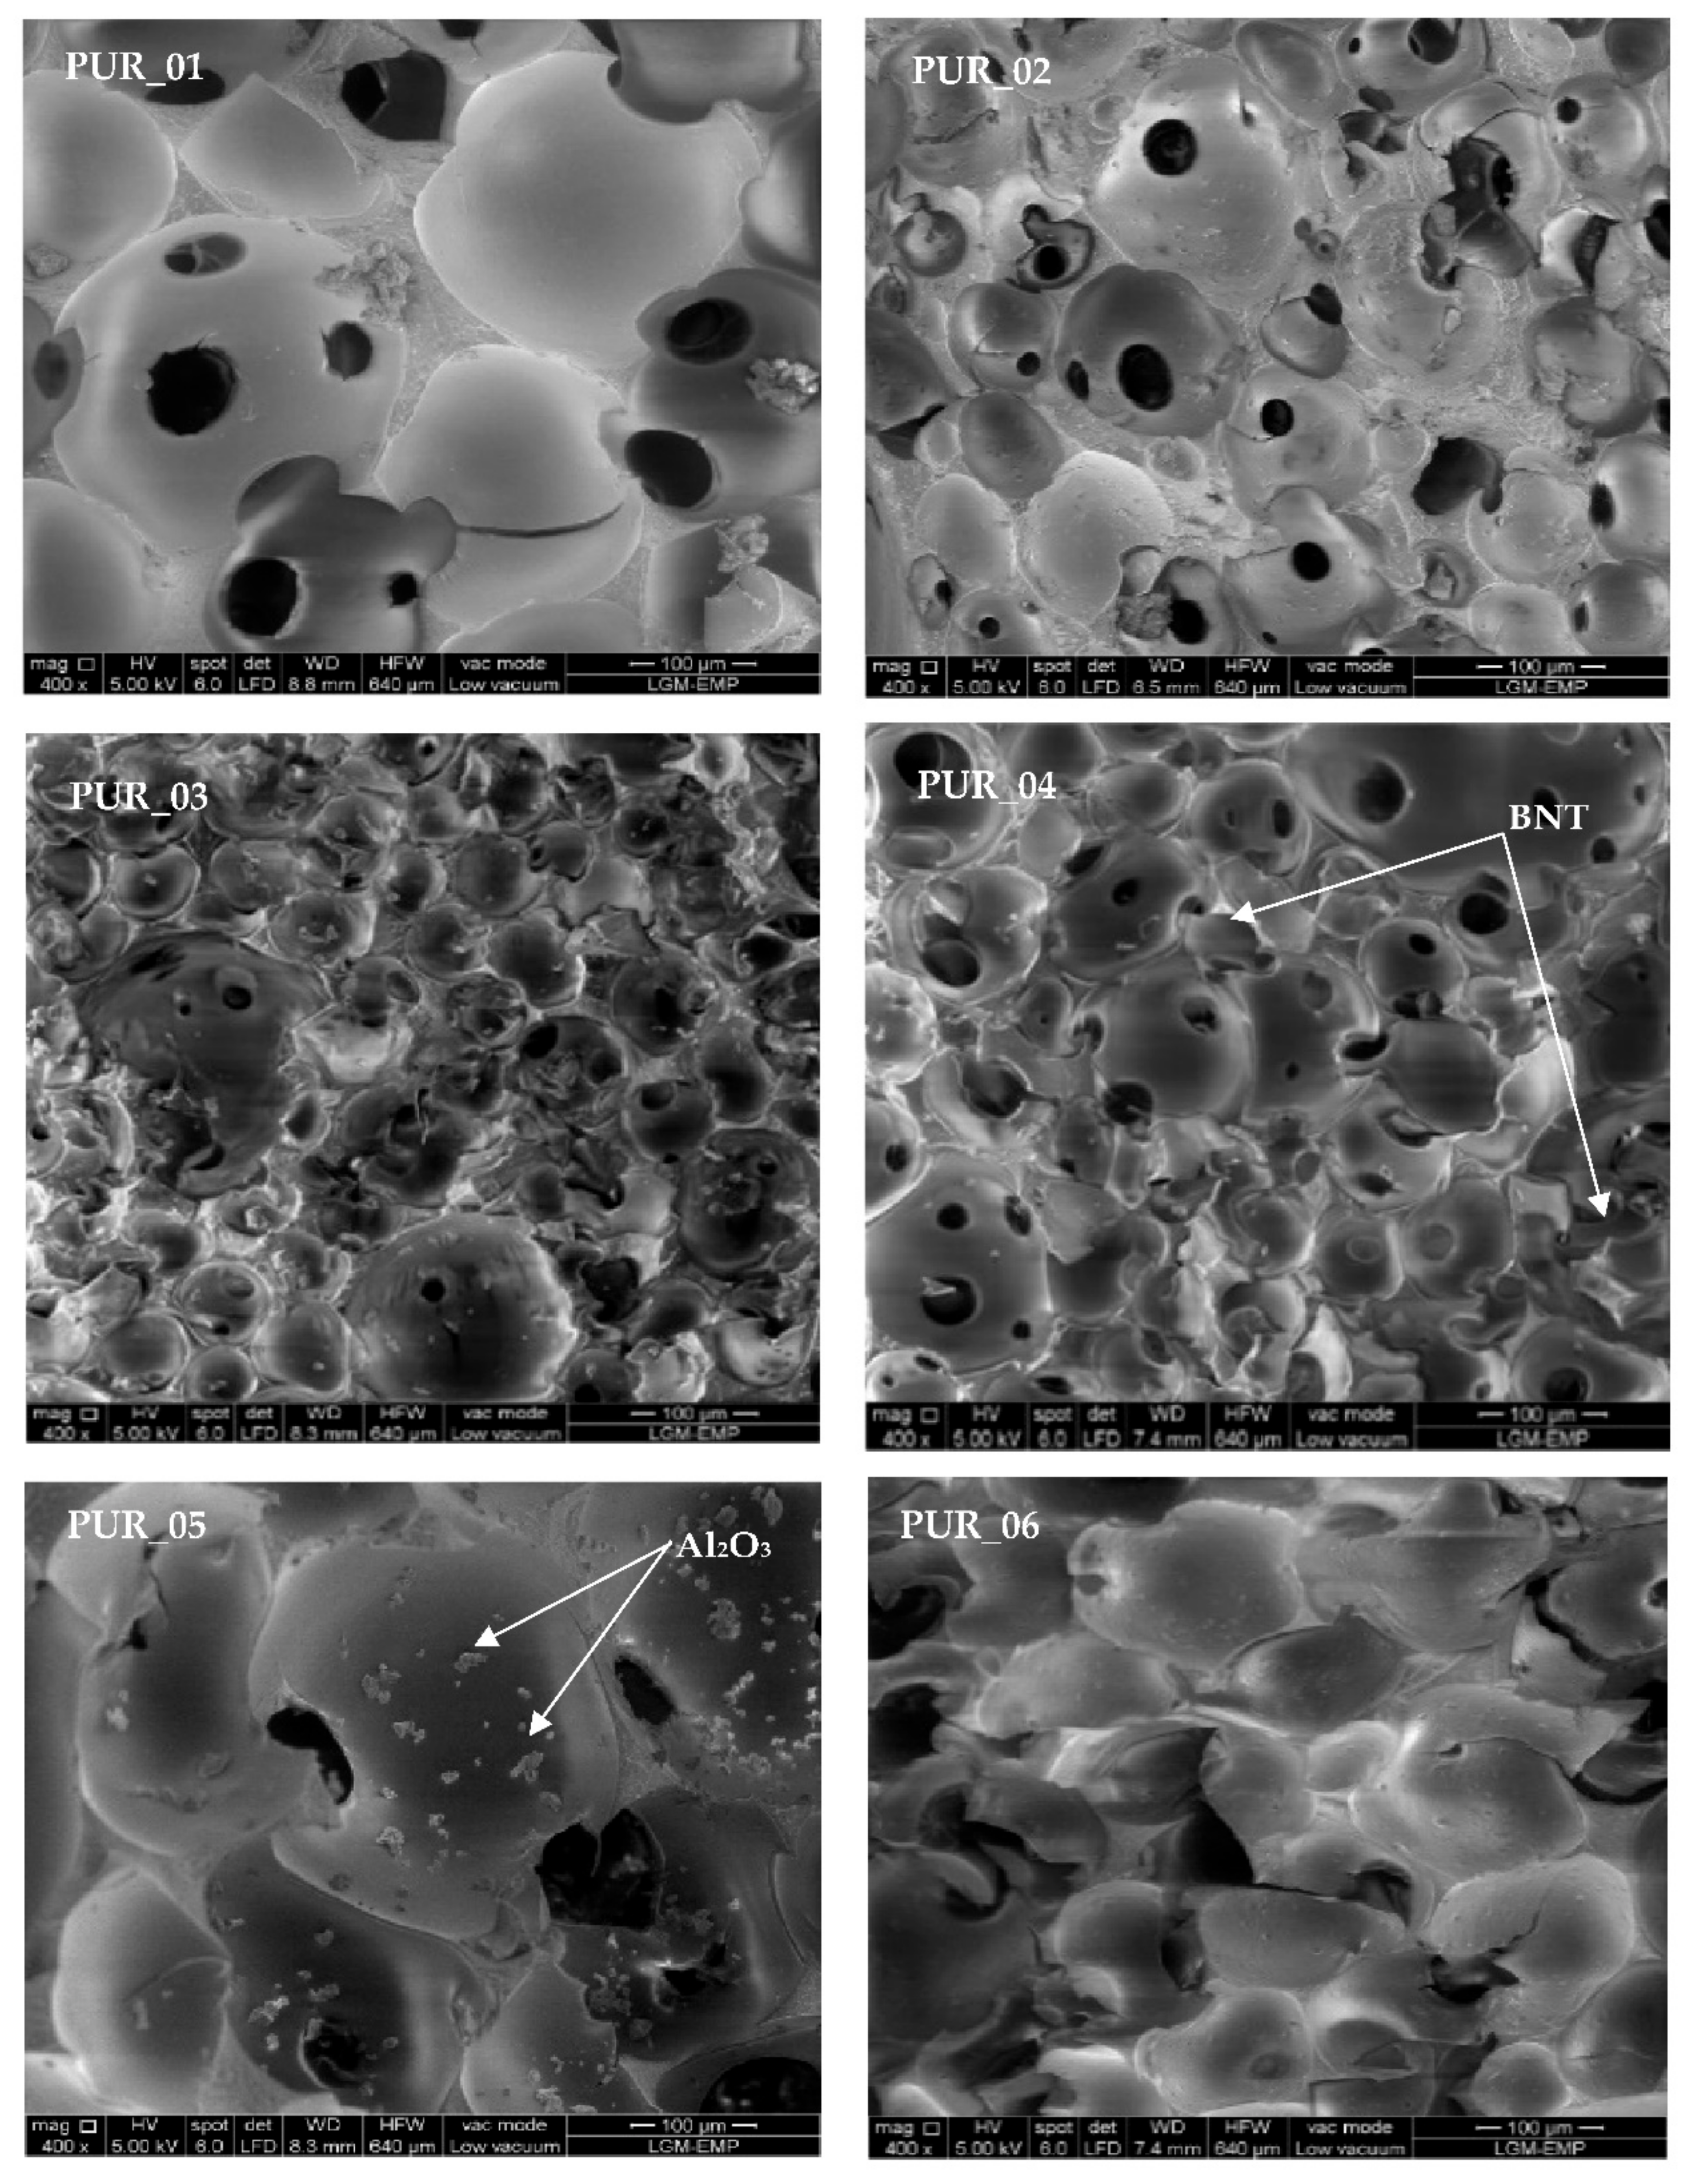
2.4.2. Electron Scanning Microscopy (SEM)

Backscattered images from electrons were obtained from a scanning electron microscope (SEM), a Jeol JSM-5410LV coupled with Isis Dispersive Energy X-ray Spectrometer EDS in conjunction with an EMA probe Oxford Link. The SEM used was the FEI brand, QUANTA 600, with a maximum voltage of 10 KV under a high vacuum HV. The sample preparation included cutting foam samples in bits of around 5 × 3 × 2 mm3, using a scalpel blade. Each piece was mounted on an aluminum sample holder. Metallization with gold was required to get a conductive coating to cover the sample surface and thus prevent the phenomenon of accumulation of charges.

2.5. Mechanical Behavior of Foams

2.5.1. Compression Tests

Six series of test pieces were cut following two different directions, that is to say, in the horizontal and vertical directions. Each series included four cylindrical specimens prepared from previously described formulations (Figure S3 in SI). The sample was compressed between the two compression plates until a strain was established. A force sensor measured and recorded the variation in the stress applied to distort the piece. The apparatus used for the compression tests was a 40 T dynamometer, which can be used in tension and compression. The mechanical compression tests were carried out according to standard ASTM D3574 [33]. This test involved compressing the sample to 80% of its specific thickness at a displacement rapidity of 3.33 × 10⁻⁵ m/s. Compression was maintained for 900 s. The stress-strain curve and the final stress value after 60 s, defined as compressive strength, were recorded. Dimensions of compression samples were cylindrical. This test involved compressing the sample to 80% of its specific thickness at a 2 mm/min displacement pace. Dimensions of polyurethane foam samples for compression test are in Table S1 in SI.

2.5.2. Resilience Impact

Impact tolerance is one of the mechanical qualities of polymer materials often sought and used directly for reinforcement. A shocking test of the CHARPY type was used according to the ISO 179-1 standard.
Hardness Shore A tests were made with a MITUTOYO brand type A durometer, model 811-315-01; at room temperature, Shore A spreads on a measurement scale from 0 to 100 (100 = overall hardness: 0 = overall penetration). Ten measurements were made on each sample. The final compliance value was determined according to the ASTM D2240 standard.

3. Results

3.1. Physical–Chemical Characterization

3.1.1. Raman Spectroscopy

Raman spectroscopy allows checking the polyurethane structure of the foam, whatever the formulation and no-no side reactions led to other undesirable products. Figure 4 demonstrates that the addition of the additives did not alter the PUR essential characteristics. Some authors [34] assign the peak at 1530 cm−1 to 4,4′ para MDI isomers in the MPDI. Others claim it accounts for a third of the vibration of the C-C elongation of the PMDI aromatic rings in monosubstituted benzene [35].
We note that no characteristic Raman peak appeared in the 500 cm−1 range for foams containing bentonite loadings (samples PUR_02, PUR_03, and PUR_04). The fifth PUR_05 alumina-containing polyurethane foam did not have loads such as PUR_06, and PUR_01 had a distinctive crest. Writers mean that alumina with a crystalline structure dispersed in a polyurethane matrix in the condensed phase can act as a physical barrier to strengthen the foam cell walls, effectively affecting the enhancement of its shock-absorbing properties.

3.1.2. Analyses Spectroscopy FTIR

Figure 5 displays the IR spectra performed on the six formulations. The two absorption peaks at 1728 and 1124 cm−1 corresponding to C = O absorptions proved polyurethane. The absorption peaks at 1598 then 814 cm−1 indicated the existence of the isocyanate component. These peaks allowed us to recognize the existence of aromatic structures. The knowledge gained is crucial for analyzing molecular structure shifts through decay. In the spectral series of 2400 and 3700 cm−1, the rise in infrared absorption was in line with the production of hydroxyl groups of alcohol, acid groups, and amines. We also saw an improvement in the absorption band to 1535 cm−1 on the infrared spectrum. This absorption band was attributed to the NH2 group’s bending5 in-plane deformation band [36]. The growth of NH2 groups was due to urethane hydrolysis. In this scenario, isocyanates were used for polyurethane synthesis. Reduction of the absorbing band amplitude in 1727 cm−1, then 1076 cm−1, and 1126 cm−1 (Figure 5) was seen for the hydrolysis of a polyol component of polyurethane. The presence of the 733 cm−1, then 1273 cm−1, 1682 cm−1, 1189 cm−1, and 916 cm−1 absorption bands was also confirmed. Spectra of raw materials FTIR are shown in Figures S6–S13 at in SI.
Raman spectroscopy is a technology that works in conjunction with FTIR to provide additional information. The addition of clay bentonite significantly increased the overall intensity of the C-C aromatic band as measured by the Raman technique. However, its location moved to lower frequencies (about 1643 to 1535 cm−1), implying that interactions between double carbon conjugated bonds are more aromatic [37].
The following polymerized infrared absorption spectroscopy levels were allocated based on the treatment of the infrared sample polyurethane foam: 1257 cm−1 symmetrically extended, Si-CH3, Si-O-Si 1003 cm−1 protracted, 791 cm−1, 755 cm−1 -(CH2)3- rocked. The 1003 cm−1 absorption band Si-O-Si confirmed the polymerized monomers on the foam surfaces, and thus the FTIR reaction of the handled foam originated primarily from the external polymer network.

3.1.3. X-ray Scattering (WAXS)

The lowest crystallinity was the polyurethane foam formulation PUR_5. A diffraction peak was visible at higher 2θ angles (around 25°) on the recorded diffractogram. This maximum reflects delaminated structures [38]. Its XRD spectrum showed a maximum peak at 19.25°. Increasing the nanofiller content reduced its intensity (300 to 250 a.u.). As the bentonite concentration increased, the connections between stiff segments became more disturbed, resulting in more amorphous and disordered nanocomposite formations. The analysis of PUR by X-ray is reported in Figure 6.
In the PUR diffractogram, we found one sizable 2θ peak of 19.25°, corresponding to the amorphous halo of the material and another small one at 25°, corresponding to the repetition of the first peak. This peak indicates a certain degree of crystallinity assigned to a dispersion of PUR chains with a constant inter-reticular distance (d). The structural morphology of PUR is the semi-crystalline one, and the addition of additives and charges always leads to a semi-crystalline structure. The highest crystallinity was the polyurethane foam formulation PUR_6 and it decreased after alumina. The crystallinity rate measured using WinAcq32 software after subtracting the baseline, and the additional PUR rigidity are summarized below (Table 3) with the hardness measured:
WinAcq32 software used XRD patterns to measure the degree of crystallinity. The 2h scan range was set to 5–45 since this values range contained all of the strong crystalline peaks. The hard polyurethane PUR_6 had 44.55% crystallinity, whereas the soft polyurethane PUR_3% had 32.2 crystallinity (shown in PUR diffractograms in Figure 6). Our materials’ rigidity was proportional to crystallinity [39]. Notwithstanding the rigidity calculated by shore A, our elaborate PUR was semirigid.

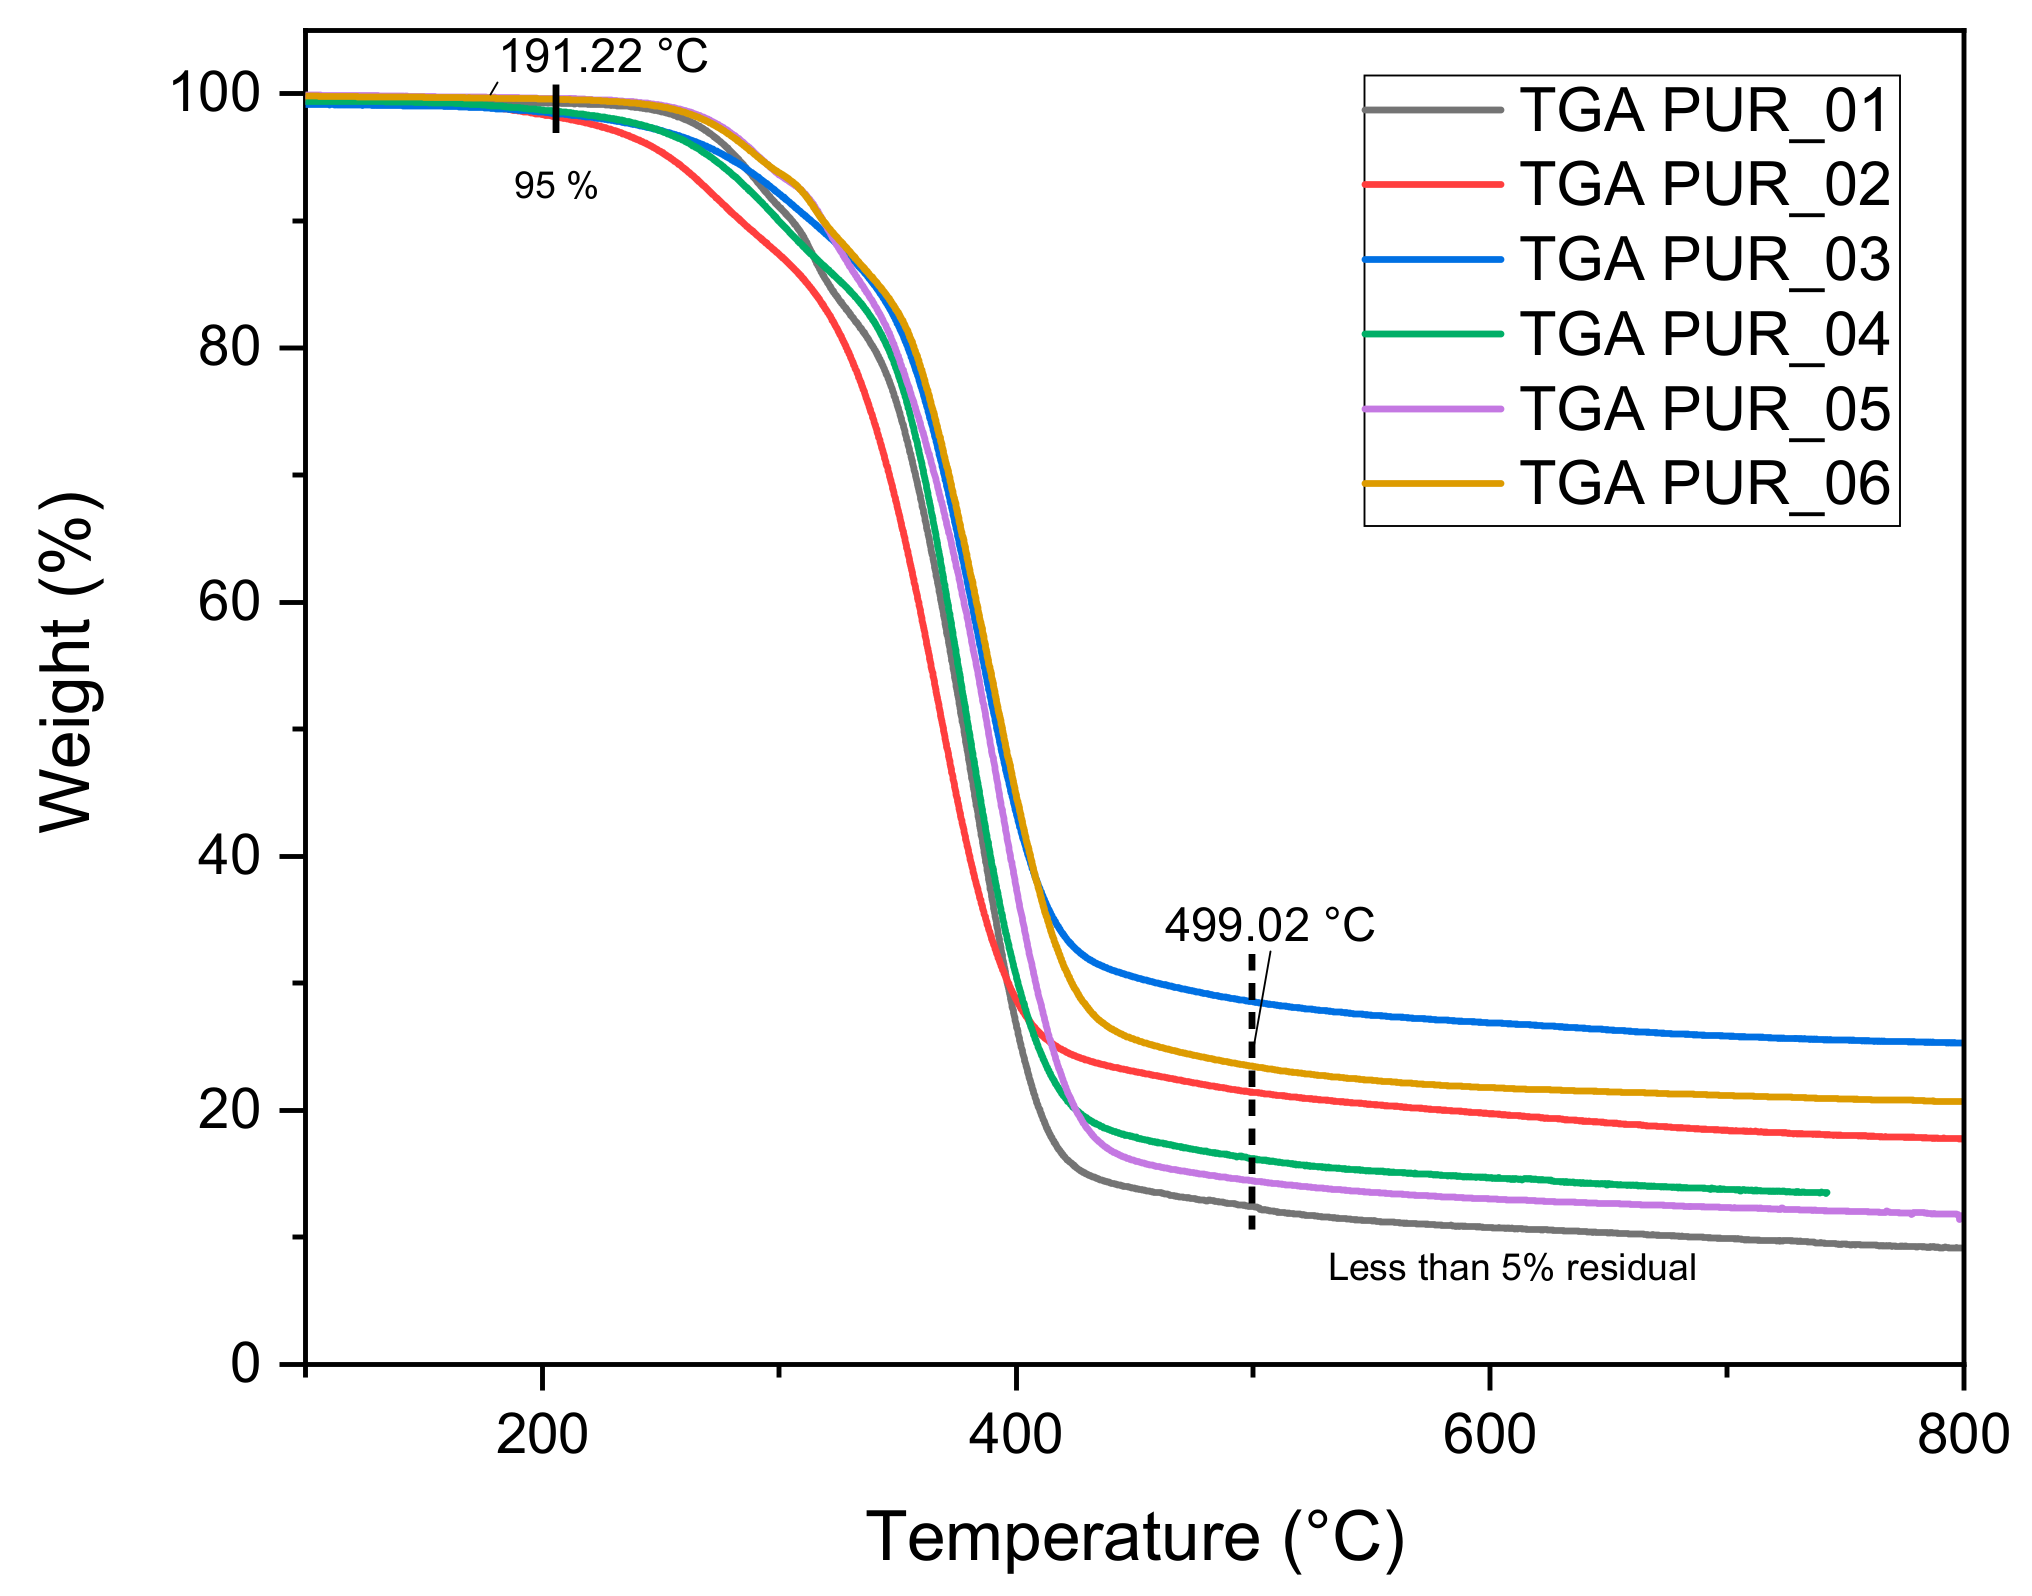
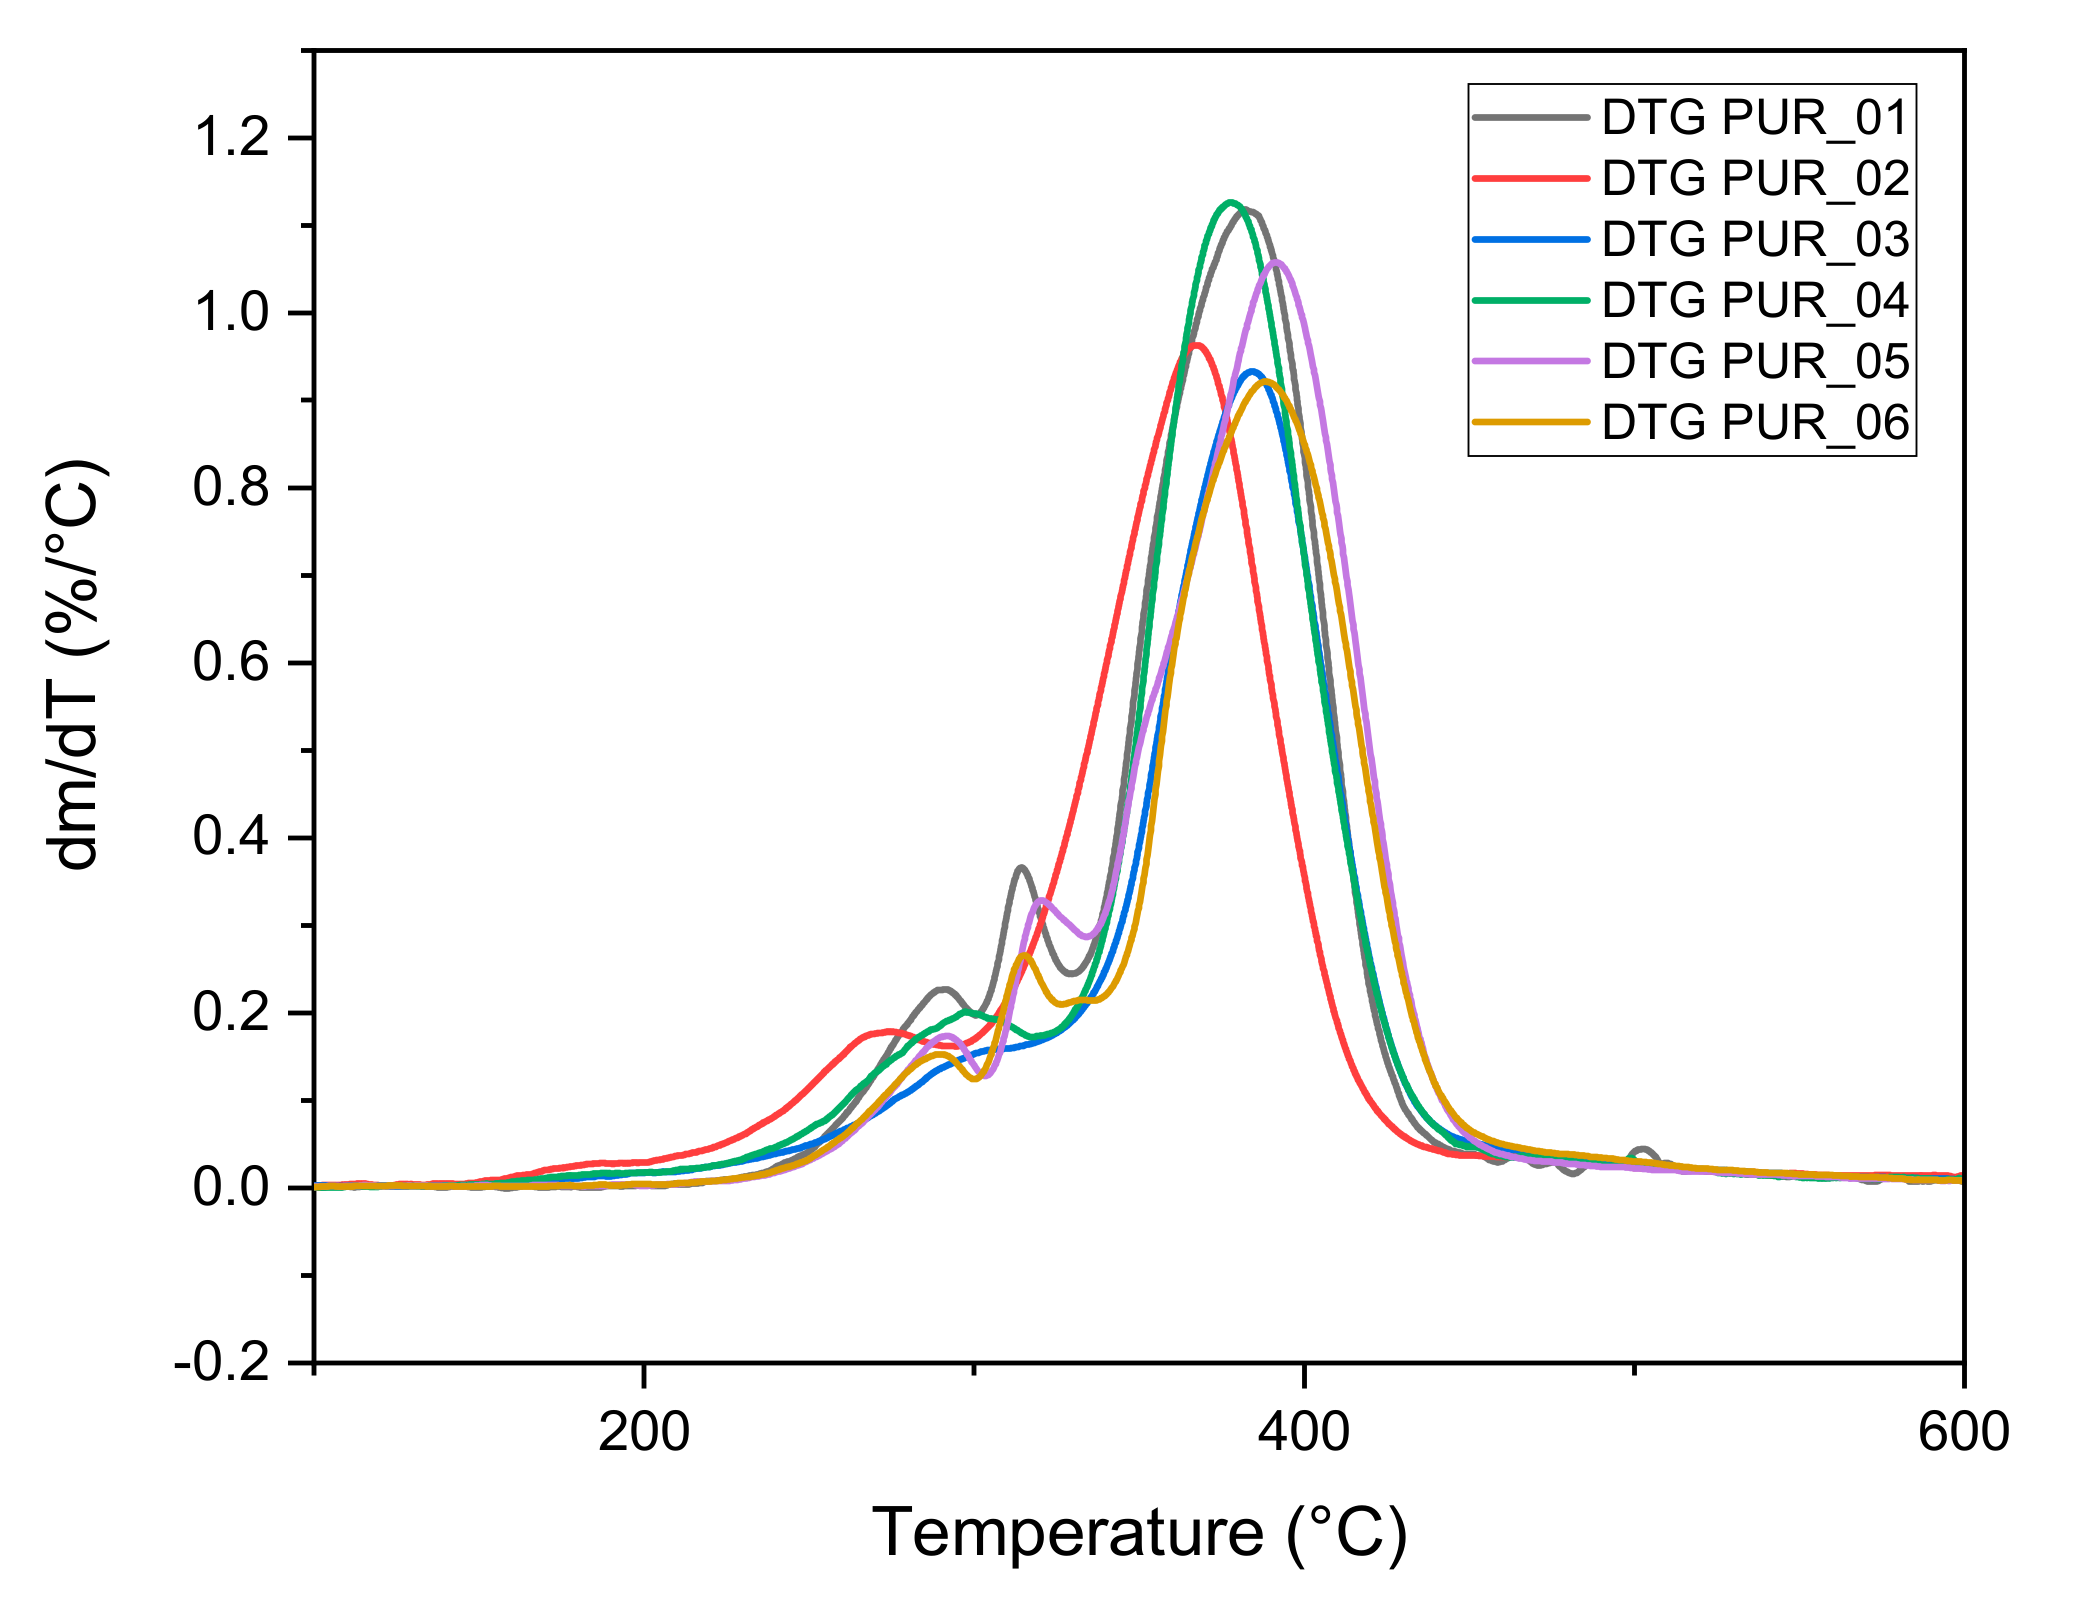
3.1.4. Thermogravimetric Analysis

The TGA analyses reported in Figure 7 and Figure 8 were carried out on the polyurethane foam samples.
The TGA curve from different samples indicates a single transition with a maximum of approximately 400 °C. The first derivative of the mass loss revealed a first mass loss at around 191 °C. This transition corresponded to a mass loss that occurred during foaming.
The polyurethane foam curve demonstrates two thermal transformations at 260 °C and 340 °C. Many authors have related these changes to various areas of the polyurethane framework [40,41]. The first transformation was the degradation of the part isocyanate, and the second was the polyol element.
The proportion of residual mass in loaded polyurethane foams was determined using the TGA curve as a reference. Bentonite decomposes at temperatures ranging from 400 °C to 800 °C. Whereas alumina decomposes at temperatures greater than 700 °C, using a filler increases the thermal stability of polyurethane and the specific gravity and toughness of polyurethane. Polyurethane foam incorporating bentonite has a higher residual mass.
All polyurethane foams undergo two separate degradation processes. The first heat breakdown process occurs as a result of urethane bond cleavage. Consequently, the initial deterioration stage happens during the thermal disintegration of the hard segments, whereas the secondary degradation step occurs during the temperature breakdown of the soft segments.
PUR_5 exhibited a higher initial temperature of decomposition (Td5%) and a higher maximum temperature of weight loss (Tdmax) than PUR_2, PUR_3, and PUR_4, which may be ascribed to the nanoparticle-PMDI bonds being broken. The thermal stability of the urethane linkages formed between polyether polyol (POPE) and polymeric methane diphenyl diisocyanate (PMDI) was reduced. Bentonite and alumina were homogeneously distributed throughout all polyurethane samples, as the proportion of leftover mass corresponded to the quantity applied.

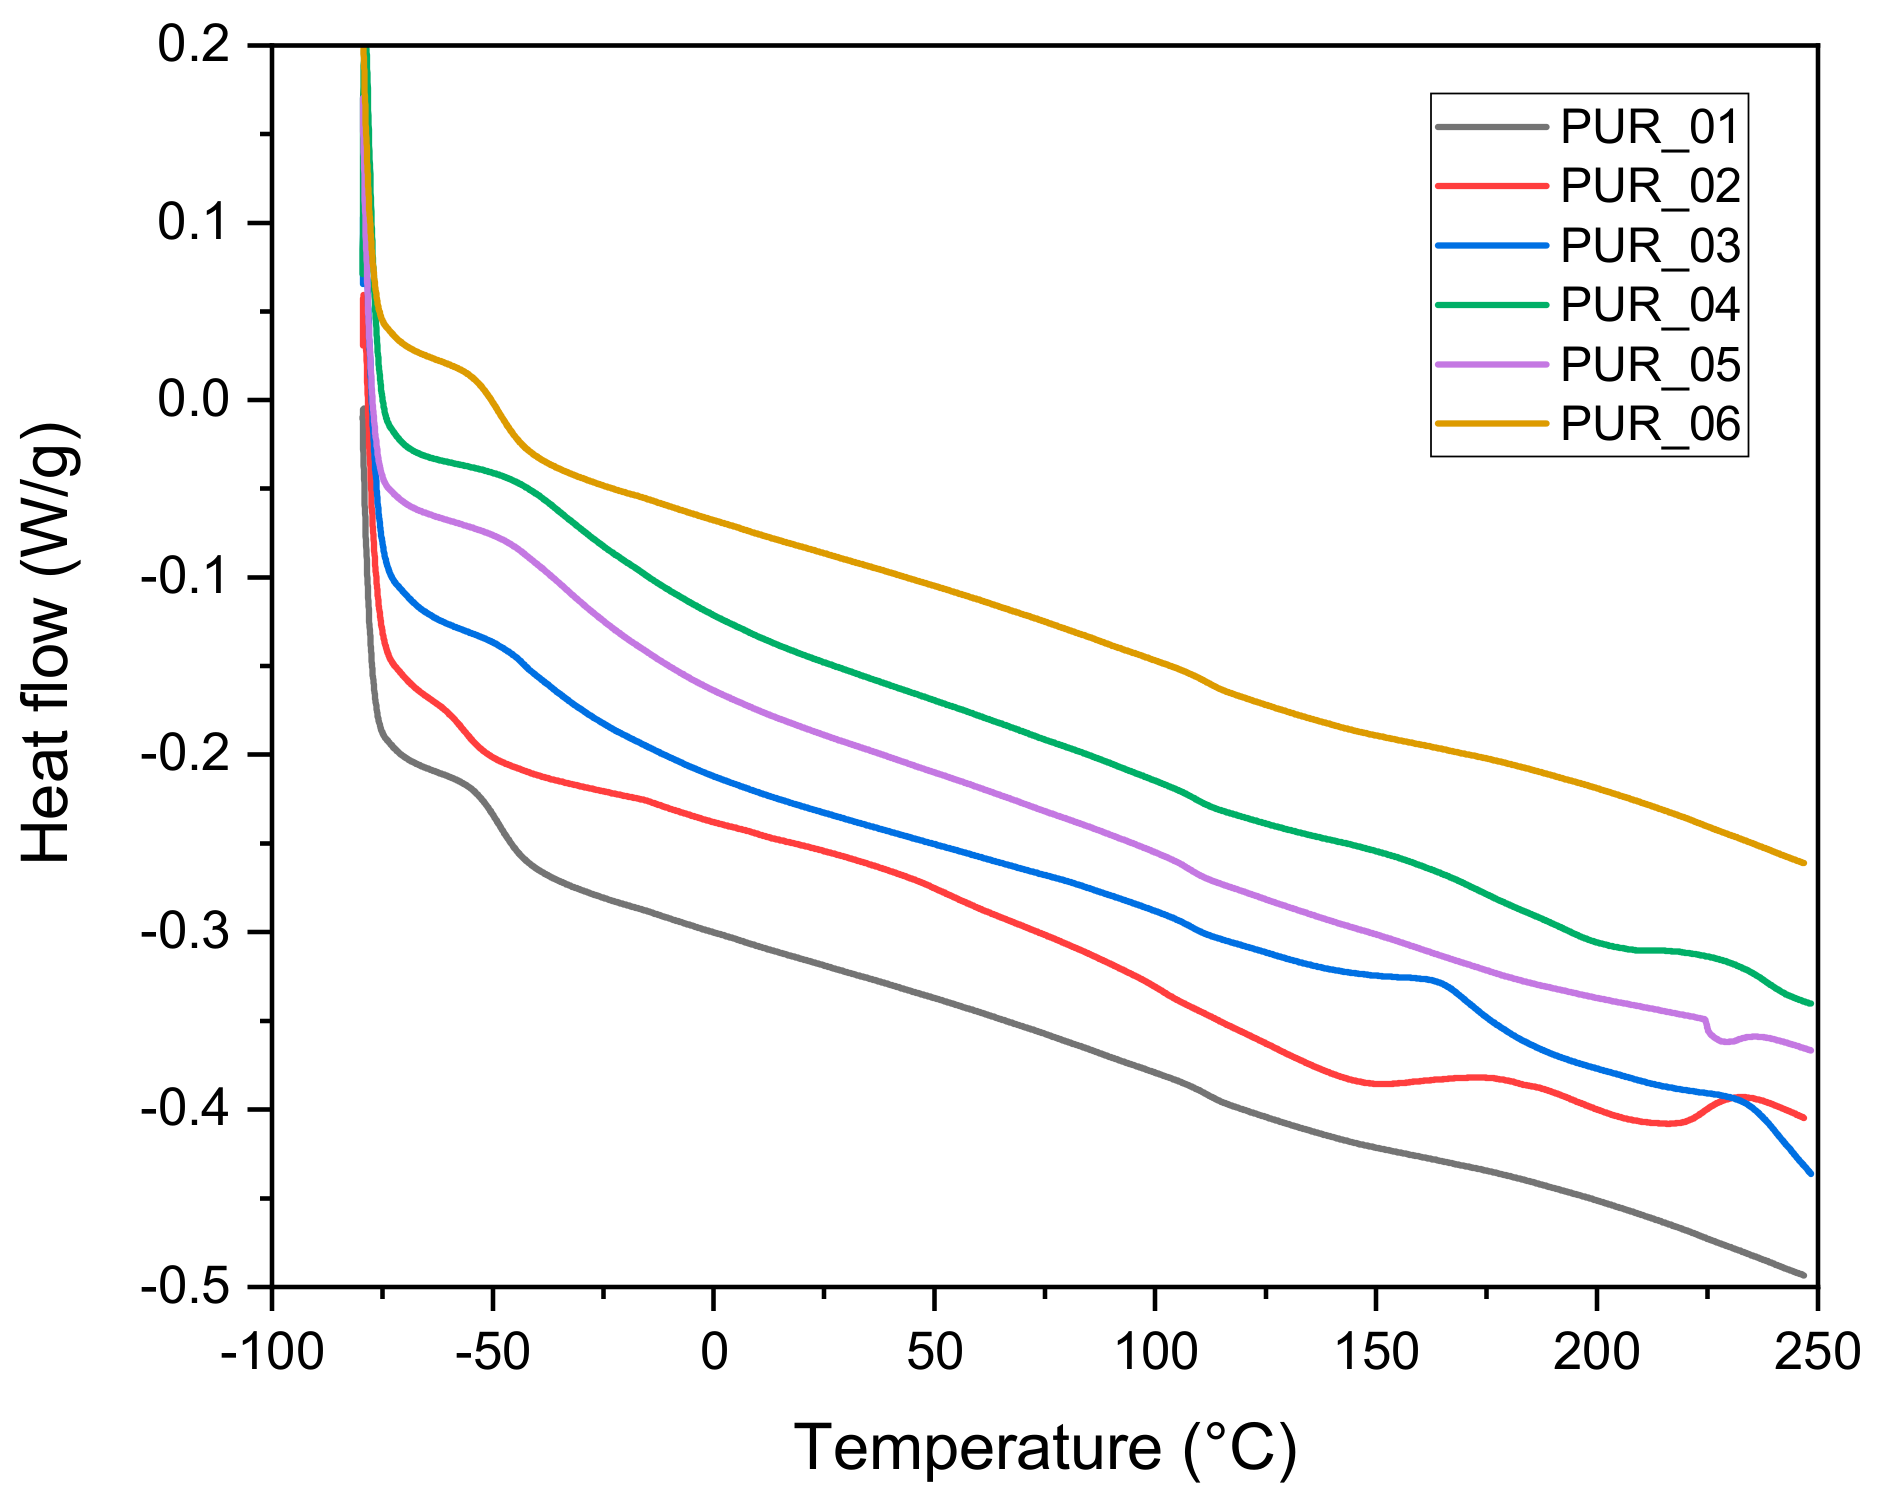
3.1.5. Differential Scanning Calorimetry (DSC)

Glass transition temperatures Tg may be determined by DSC at temperatures ranging from 40 to 80 °C [42]. The DSC thermograms of polyurethane foams are shown in Figure 9.
The flexible matrix was characterized in our case by a glass transition, which had a starting temperature of Tg =−30 °C to −60 °C. The rigid domains displayed many melting peaks at temperatures Tm1, Tm2, Tm3. A significant phenomenon occurred at an intermediate temperature Onset Tr = −51 °C and could be associated with rigid domain glass transition [43], and then with a flexible and inflexible interface micro mix [44]. Partial soft phase crystallization may be excluded [45]. These segments often have a concise chain length. These flexible segments can be crystallized at low temperatures between 20 °C and 40 °C.
Figure 9 indicates that the Tg differed with all samples tested. However, we saw a decrease for PUR_01 from −30 to −45. This reduction represents an improvement in the free volume of the polymer, which may be linked with a decrease in polymerization, crosslinking or crystallinity.
Tg refers to the average polymer molar mass under Flory–Fox law in Equation (1):
Tg =   Tg K M n ¯
In this formula, K is a related observed parameter connected to volume, and Mn is the average number of molecular weights. Tg is the maximal transitional glass temperature a particle of infinite particle weight could attain. Therefore, a reduction in the molar mass leads to a decrease of Tg, according to this equation. The Fox–Flory hypothesis considers the free volume differences between chain endpoints and the interior chain unit [46]. In our approach, chain ends were ignored.
Nonetheless, the inner block units’ free volumes and the block ends should be somewhat different. When temperatures reach these levels, the PUR blocks connected to each hard segment block are very mobile and ensure that the ends of the hard block are not constrained. The ends of hard blocks can function as free chain ends.
For polyurethane foam, a decrease of Tg is clarified by the decomposition of a previously IRTF characterized polyol causing polymer fragmentation chains, thereby reducing average molar weight, enhanced free volume, and molecular mobility. DSC specifies the transformation of the glass and melting temperatures of our PUR. The results of the different physical and chemical characterization of polyurethane foams are summarized in Table 4.
Temperature measurements at 5% mass loss (Td5%) were 254, 279, and 271 °C for PUR-Bentonite, and 292 °C for PUR-Alumina, respectively. All polyurethane samples demonstrated a significant weight loss in the 367–384 °C region (17.8%, 25.9%, and 14.3% for PU-Bentonite, respectively), indicating their exceptional heat stability. Most weight loss happens at 390 °C (11.8% for PUR-Alumina). Both PUR-Bentonite exhibited a slightly greater amount of char residue compared to PUR-Alumina. The DTG curve of PUR-Alumina is shown in (Figure 8. Additionally, there were maximum temperatures in the range of 280–450 °C associated with mass loss due to thermal decomposition.
A broad phenomenon was present with intermediate temperature Tr = −51 °C. This POPE had a rather high molar mass (3500 g/mol); hence, it had a marked crystalline character. The fluid POPE sequences were arranged about each other in a rather large mass proportion in the PUR chains, contributing to the production of crystalline phases [47]. The polyol molar mass used in a PUR synthesis reached 1000 g/mol. As in our case, “soft” sequences of the polyol of PUR chains were ordered. The usage of PMDI as a chain expansion agent does not facilitate the arrangement of rigid series, nor does it prohibit the crystallization of rigid phase. During the second temperature increase, our material’s soft phase was no longer as pure as more rigid fragments blended better with the soft phase. These glass transfer temperatures and soft domain recrystallization were higher. Flexible section recrystallization indicated the existence of the micro separation process and thereby showed the findings of the IR study. Recrystallization revealed that our PUR was only partly related, marked by a significant decrease in recrystallization enthalpy.

3.2. Mechanical Characterization

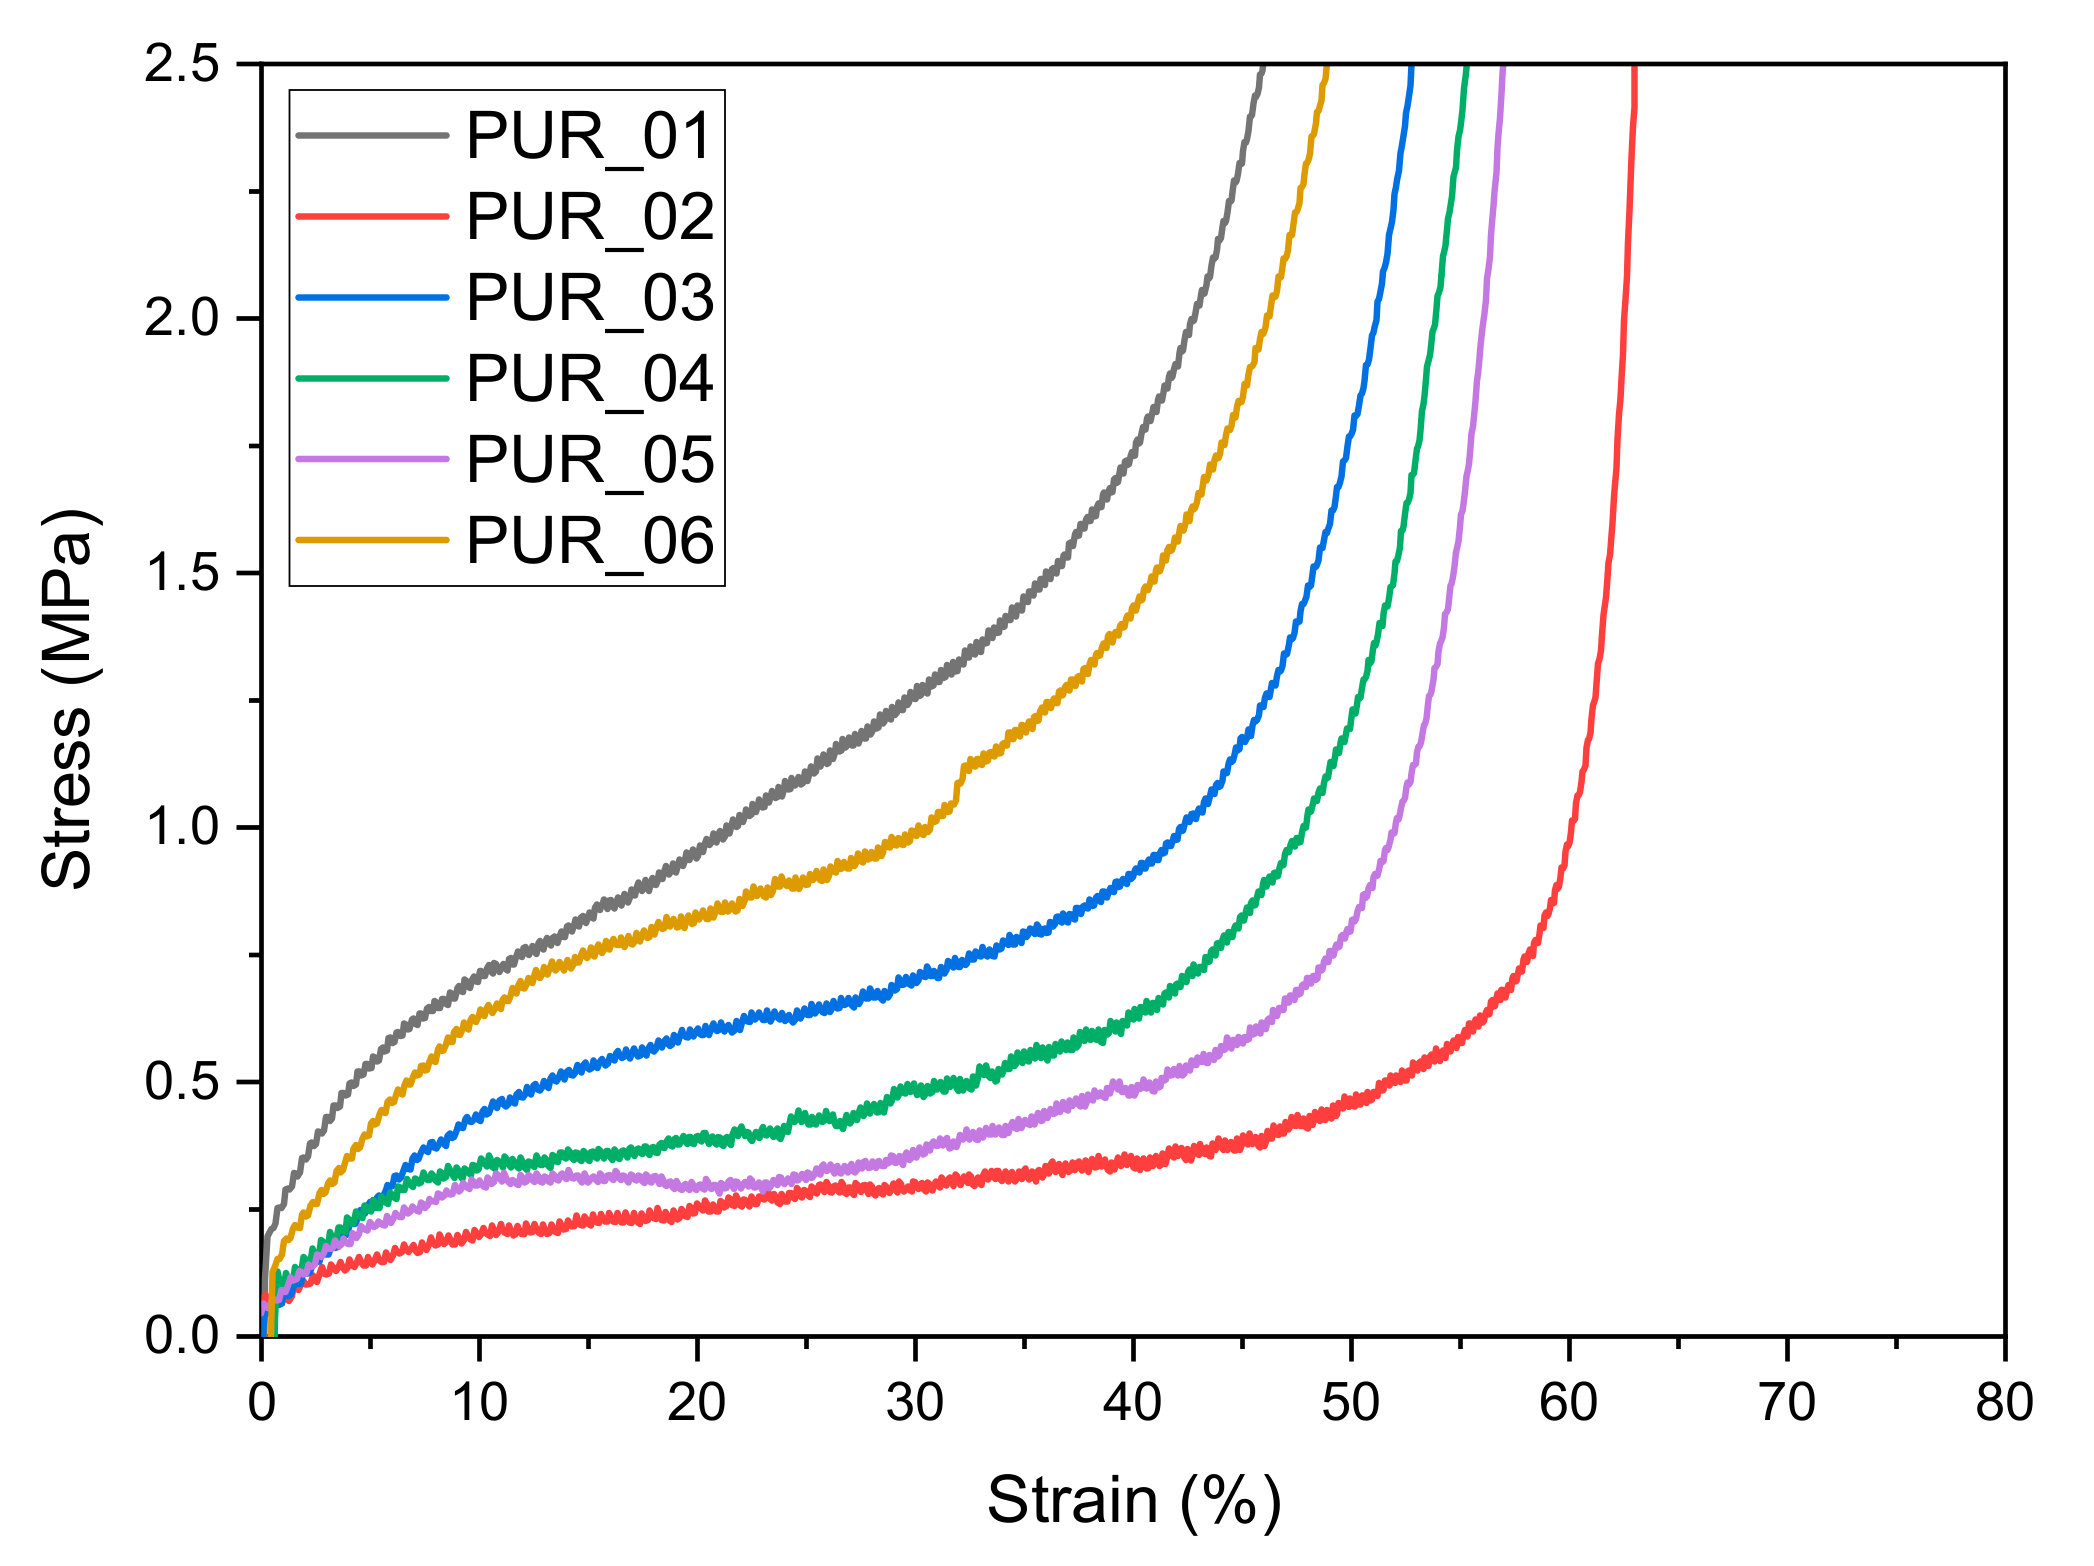
3.2.1. Compression Tests

The characteristic force-displacement curve of polyurethane foam (Figure 10) shows the three strain regimes typical of viscoelastic materials. The first part of the curve is linear and corresponds to the elastic regime. When the constraint was removed, the deformation of the sample was reversible. After the yield point, which is the end of the linear part, the stress-strain curve shows a long plateau at almost constant stress. This part corresponds to the platform. It is associated with the plastic deformation structure through a polyurethane foam brittle to the rupture of the cell walls. As the strain increased, the walls of cells came into contact with each other. When all the voids were filled, the resistance of the foam increased rapidly, proportional to the measured stress. This last section of the curve is called the densification scheme [48]. The curve representative of cellular compression shows a linear phase shadowed by a load plateau (force) and a densification step. The load increased considerably with displacement, behavior in three stages [49]. A slight dispersion was observed between the six specimens carried out under the same production conditions and tests [50].
The mechanical properties of polyurethane foam depend strongly on density, cell size and form, and the percentage of close and open cells. The foam may have a preferential orientation of the structure of the cells. Cells frequently appear elongated along the direction of expansion. It has been demonstrated that when the density of the foam increases, the elastic limit and plateau height rise [51], while the elongation of the plateau decreases [52]. This means mean that high-density foam is better at resisting the restrictions applied than low-density foam. However, the structure of a high-density foam reaches the densification regime at low deformations.
For rigid foams, the pressure increases due to condensation, and then the stress drops sharply at the end of the plateau. This medium corresponds to when the cell walls rupture and the foam structure collapses [53]. It is necessary to point out that these tests must be consolidated by studying the dynamic behavior of these elaborate foams.
The insertion of bentonite and alumina particles into the foam cells increased the initial module in the stress-stream curve. On the other hand, if the particles introduced are more significant than the cells’ dimensions, reinforcement is not effective [54]. Polyurethane foams have both stiff and flexible domains. Temperature or humidity increases degrade foam mechanical characteristics [55]. This loss of mechanical properties corresponds to a reduction in compressive strength. It is probably associated with the tear of the chains belonging to rigid domains (urea and urethane bonds) and the breaking of hydrogen bonds [56]. Determining the bulk density of the different polyurethane foams studied consists of weighing samples by an electronic balance to the accuracy of 0.01 g and calculating the volume of the test pieces. Average results obtained for untransformed (original) and loaded polyurethane foams are summarized in Table 5. Changes in mechanical properties of all studied samples before and after the tests were traced.
The state of preservation is the degree of retention of the sample in its normal shape and dimensions after the pressure test. It was judged by calculating the dimensions of the pieces and noting deformations and cracks. We denote ++ excellent condition, + good condition, and ~ average condition by the symbol.
After compression tests, the SEM images of the sample surface did not reveal the grain. However, the thickness of the foam consists of grains absent from the exterior of the samples and under appropriately high-pressure environments, the cells overlap. Sample images captured by the SEM allow the observation of additives in polyurethane with the foam surfaces and the investigation of the microscopic enhancement effect. The analyses carried out on polyurethane foam samples permitted the evolution of chemical and physical properties to be evaluated. The results showed that the polyurethane foam degradation process selected for this analysis is compatible with the evidence provided in the literature. Our pressure tests allowed the mechanical properties to be determined to be quantified at full performance. These findings would be essential to test the feasibility of improving impact tolerance as often as possible.

3.2.2. Resilience Impact

The findings of the research indicate explicitly that polyurethane foams are extremely robust. In addition, the test findings suggest that the resistance of PUR foams improves with increased hardness. The resistance coefficient of the 80 °Sh A toughness polyurethane foam is about 16% greater than that of the 70 °Sh toughness polyurethane foam. Strong durability implies decent resistance. This is what was observed, which gives them tenacity, and adding bentonite makes the foam more tenacious.
The study of the microphotographs reveals, however, that there are no indicators of elastic deformation in the tension surface of the test PUR samples. However, the surface of the higher toughness PUR samples reveals less harm, even though multiple material cracks are evident. These cracks can result from the deformation of the material cyclically (tired) during the friction phase. The structural research would not understand why the tougher polyurethanes are more resistant. The frictional properties of the materials were investigated under settings that varied according to their chemical composition and distinctive PUR-type molecular structure.
Based on the review of the testing findings, polyurethane foams will improve stability and operating efficiency instead of other polymeric materials. A study into the physical alteration of polyurethanes added to the bases of different structures would clarify their resistant mechanisms and probable technical uses in the future. The results of the Charpy tests are summarized in the following Table 6.

3.3. Microstructural Characterization

3.3.1. Optical Microscope

Figure 11 provides the findings of the description of the microstructure polyurethane foam included as reference material. The optical microscope’s picture reveals a partially open-cell foam that does not close entirely by the wall and interacts with or without other cells between the walls of specific cells and visible cell membranes. The legal age of cells, though, indicates that membranes are missing. Open-cell moisture is typically moisture soft or mid-soft. The cell structure is partly open because it is compatible with the foam’s nature.
These polymer compositions resulted in single-phase and heterophase solids that were examined morphologically. The physicochemical properties of these materials were analyzed by Raman spectroscopy. They have also been shown to detect their structure in good agreement with the standard sheets ASTM. Because of the effects obtained, the elaborated pieces appear to have stubborn regular cellular structures with significant reversibility of overlap.

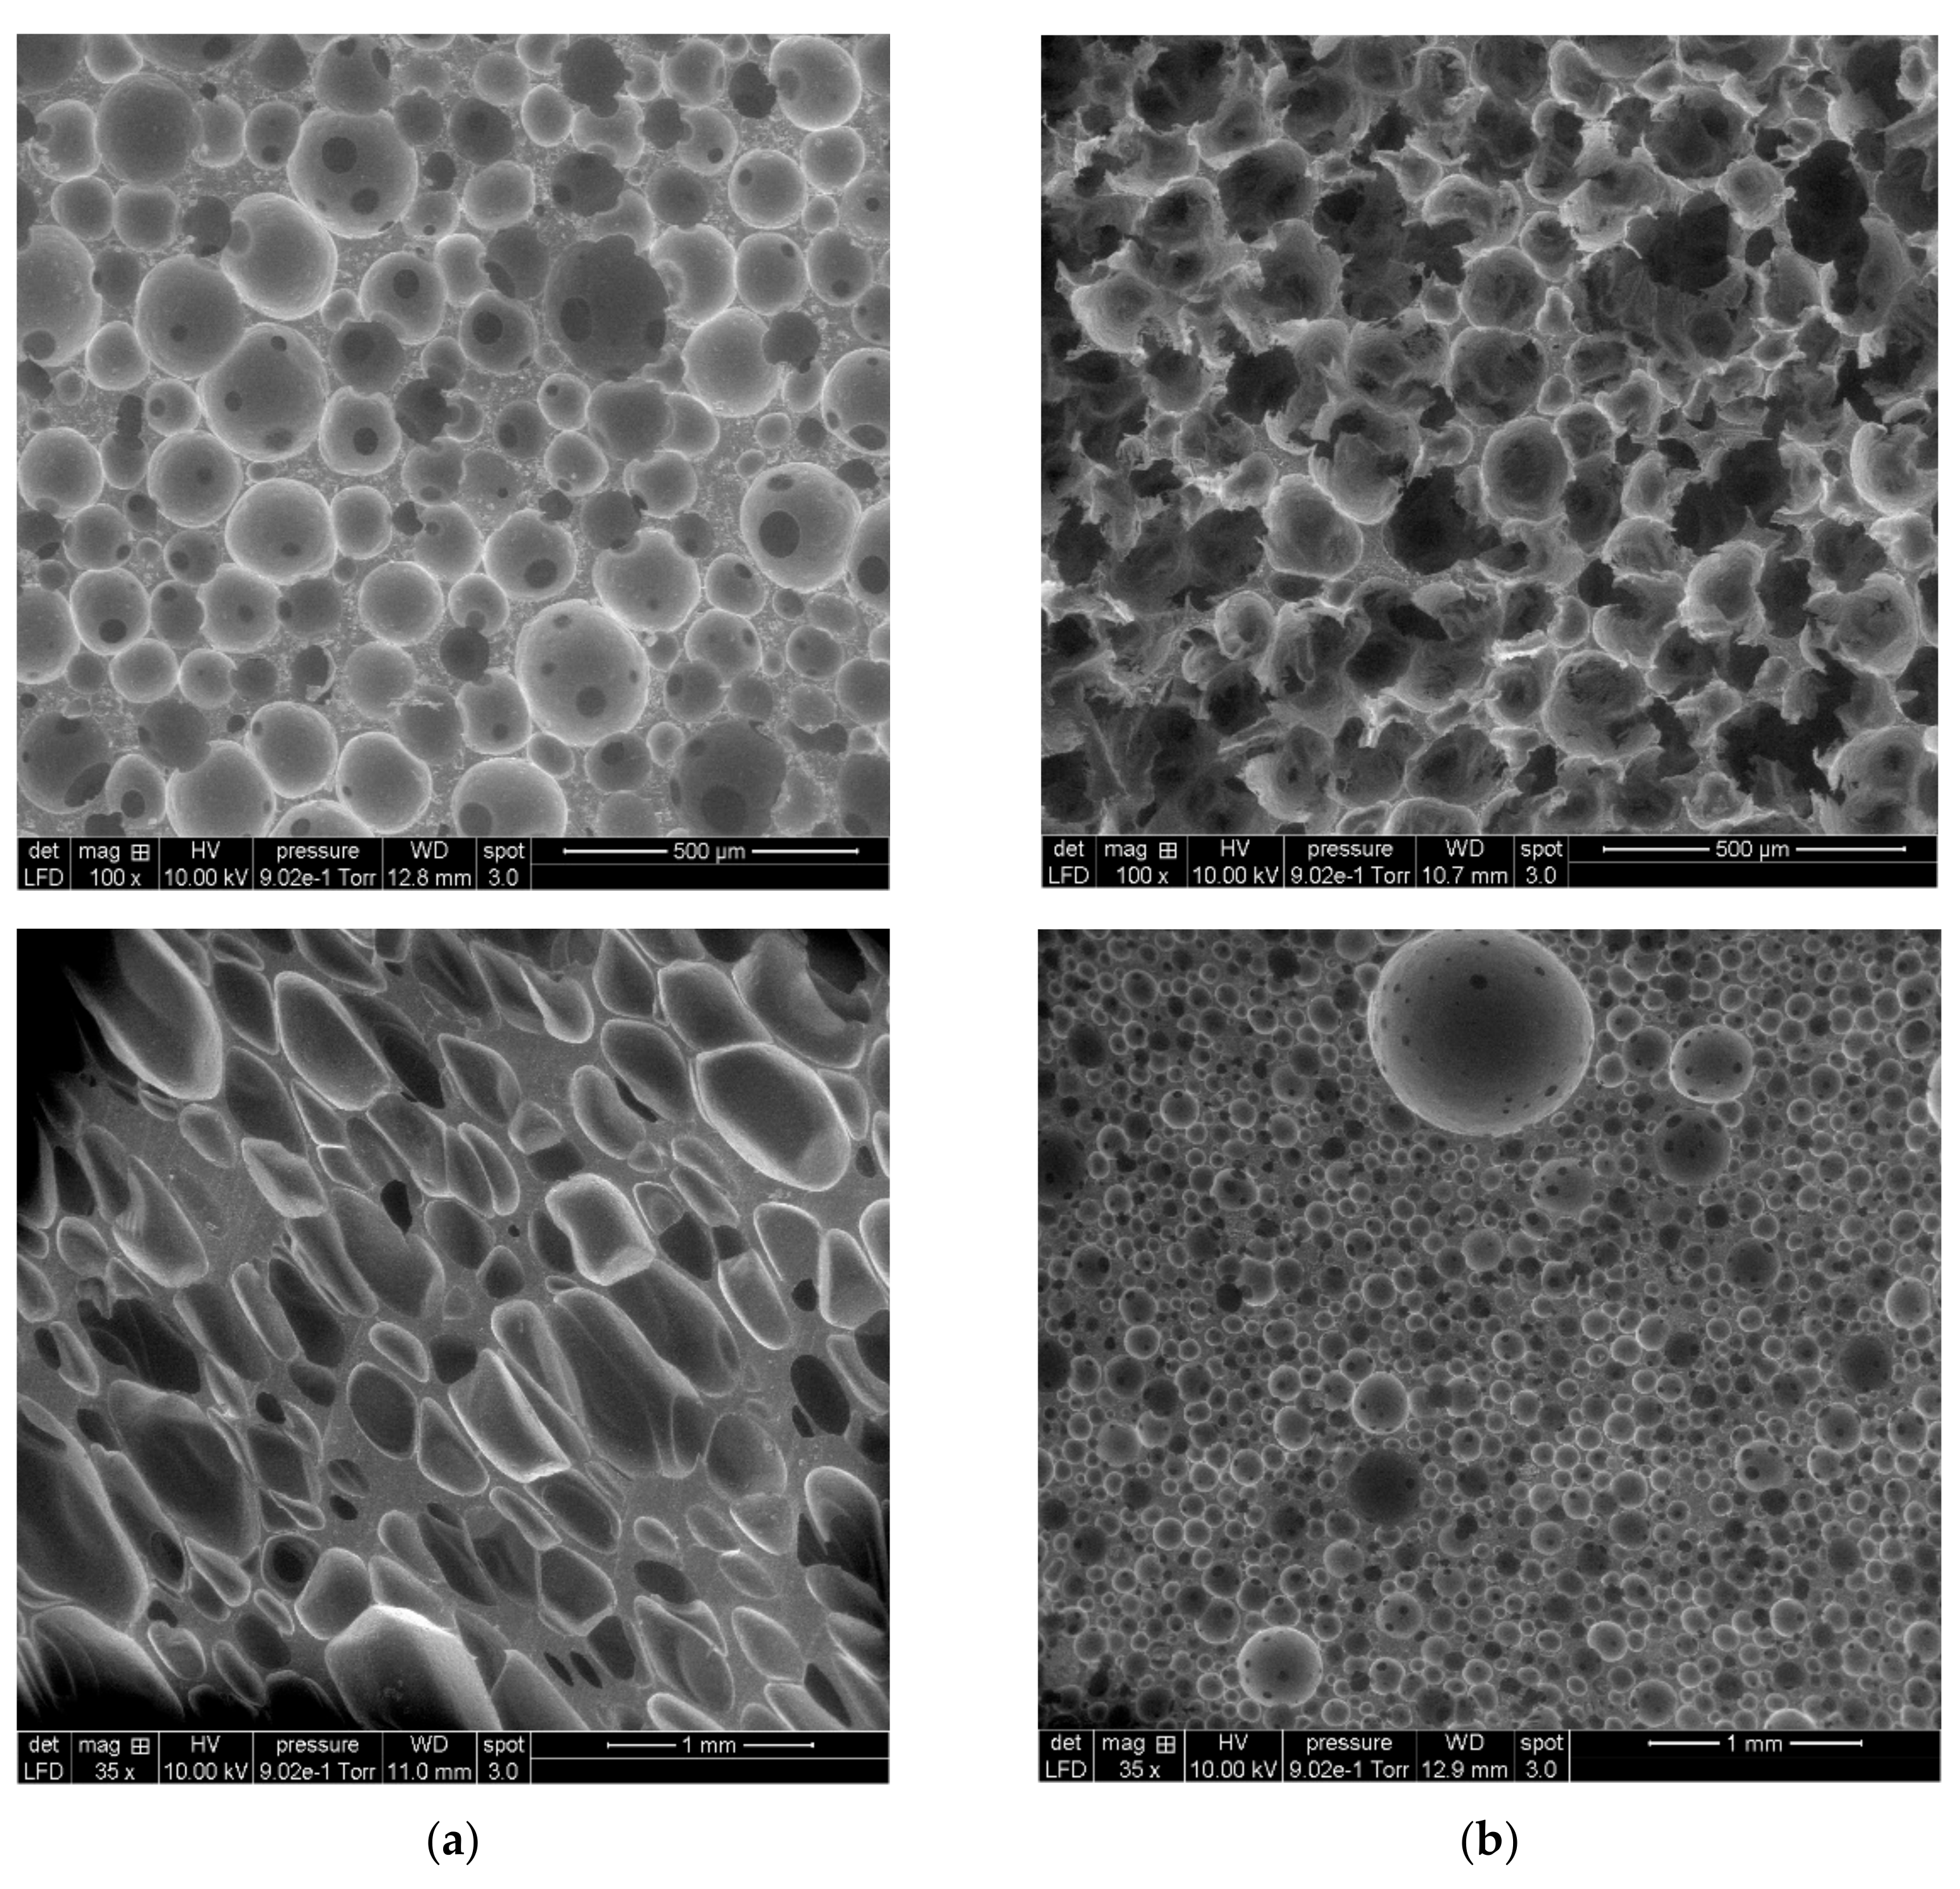
3.3.2. Scanning Electron Microscopy (SEM)

The SEM photos often demonstrate the appearance of the grains and the surfaces of the cells are rougher, and the analyses suggest that they are additives in the polyurethane foam preparation (Figure 12). We used alumina fillers with a particle size = 3 to 6 μm. We purified the bentonite, and OMMT montmorillonite extracted from it had a grain size of 1 to 2 μm in diameter. Samples of the specified sizes were cut with a band saw, i.e., vertical to the direction of foam growth, and we observed the inner section of the foams in the SEM device.
The images represent the SEM several days after the compression experiment. It was observed that after compression at the maximum deformation, the polyurethane foam began to recover because the cohesion of the cell structure was marked with a few tears on the cell walls.
The back distributed electron images permitted the deposits on the foam structure to be illuminated. The figure indicates the pictures of all the samples, flexible and solid. After compression, its shape was preserved unchanged, whereas the cell wall was weakened, and the specimen lacked its recovery properties.
Micrographs show that our PUR cells were either half-open or partly open, interacting with each other, spherical in form, oval pores, circular pores with an overall diameter below 50 μm and reasonably normal pore distribution. We analyzed the particle size for the SEM micrograph (histogram) using Image j software. We got the results as shown in the corresponding Figure 13.

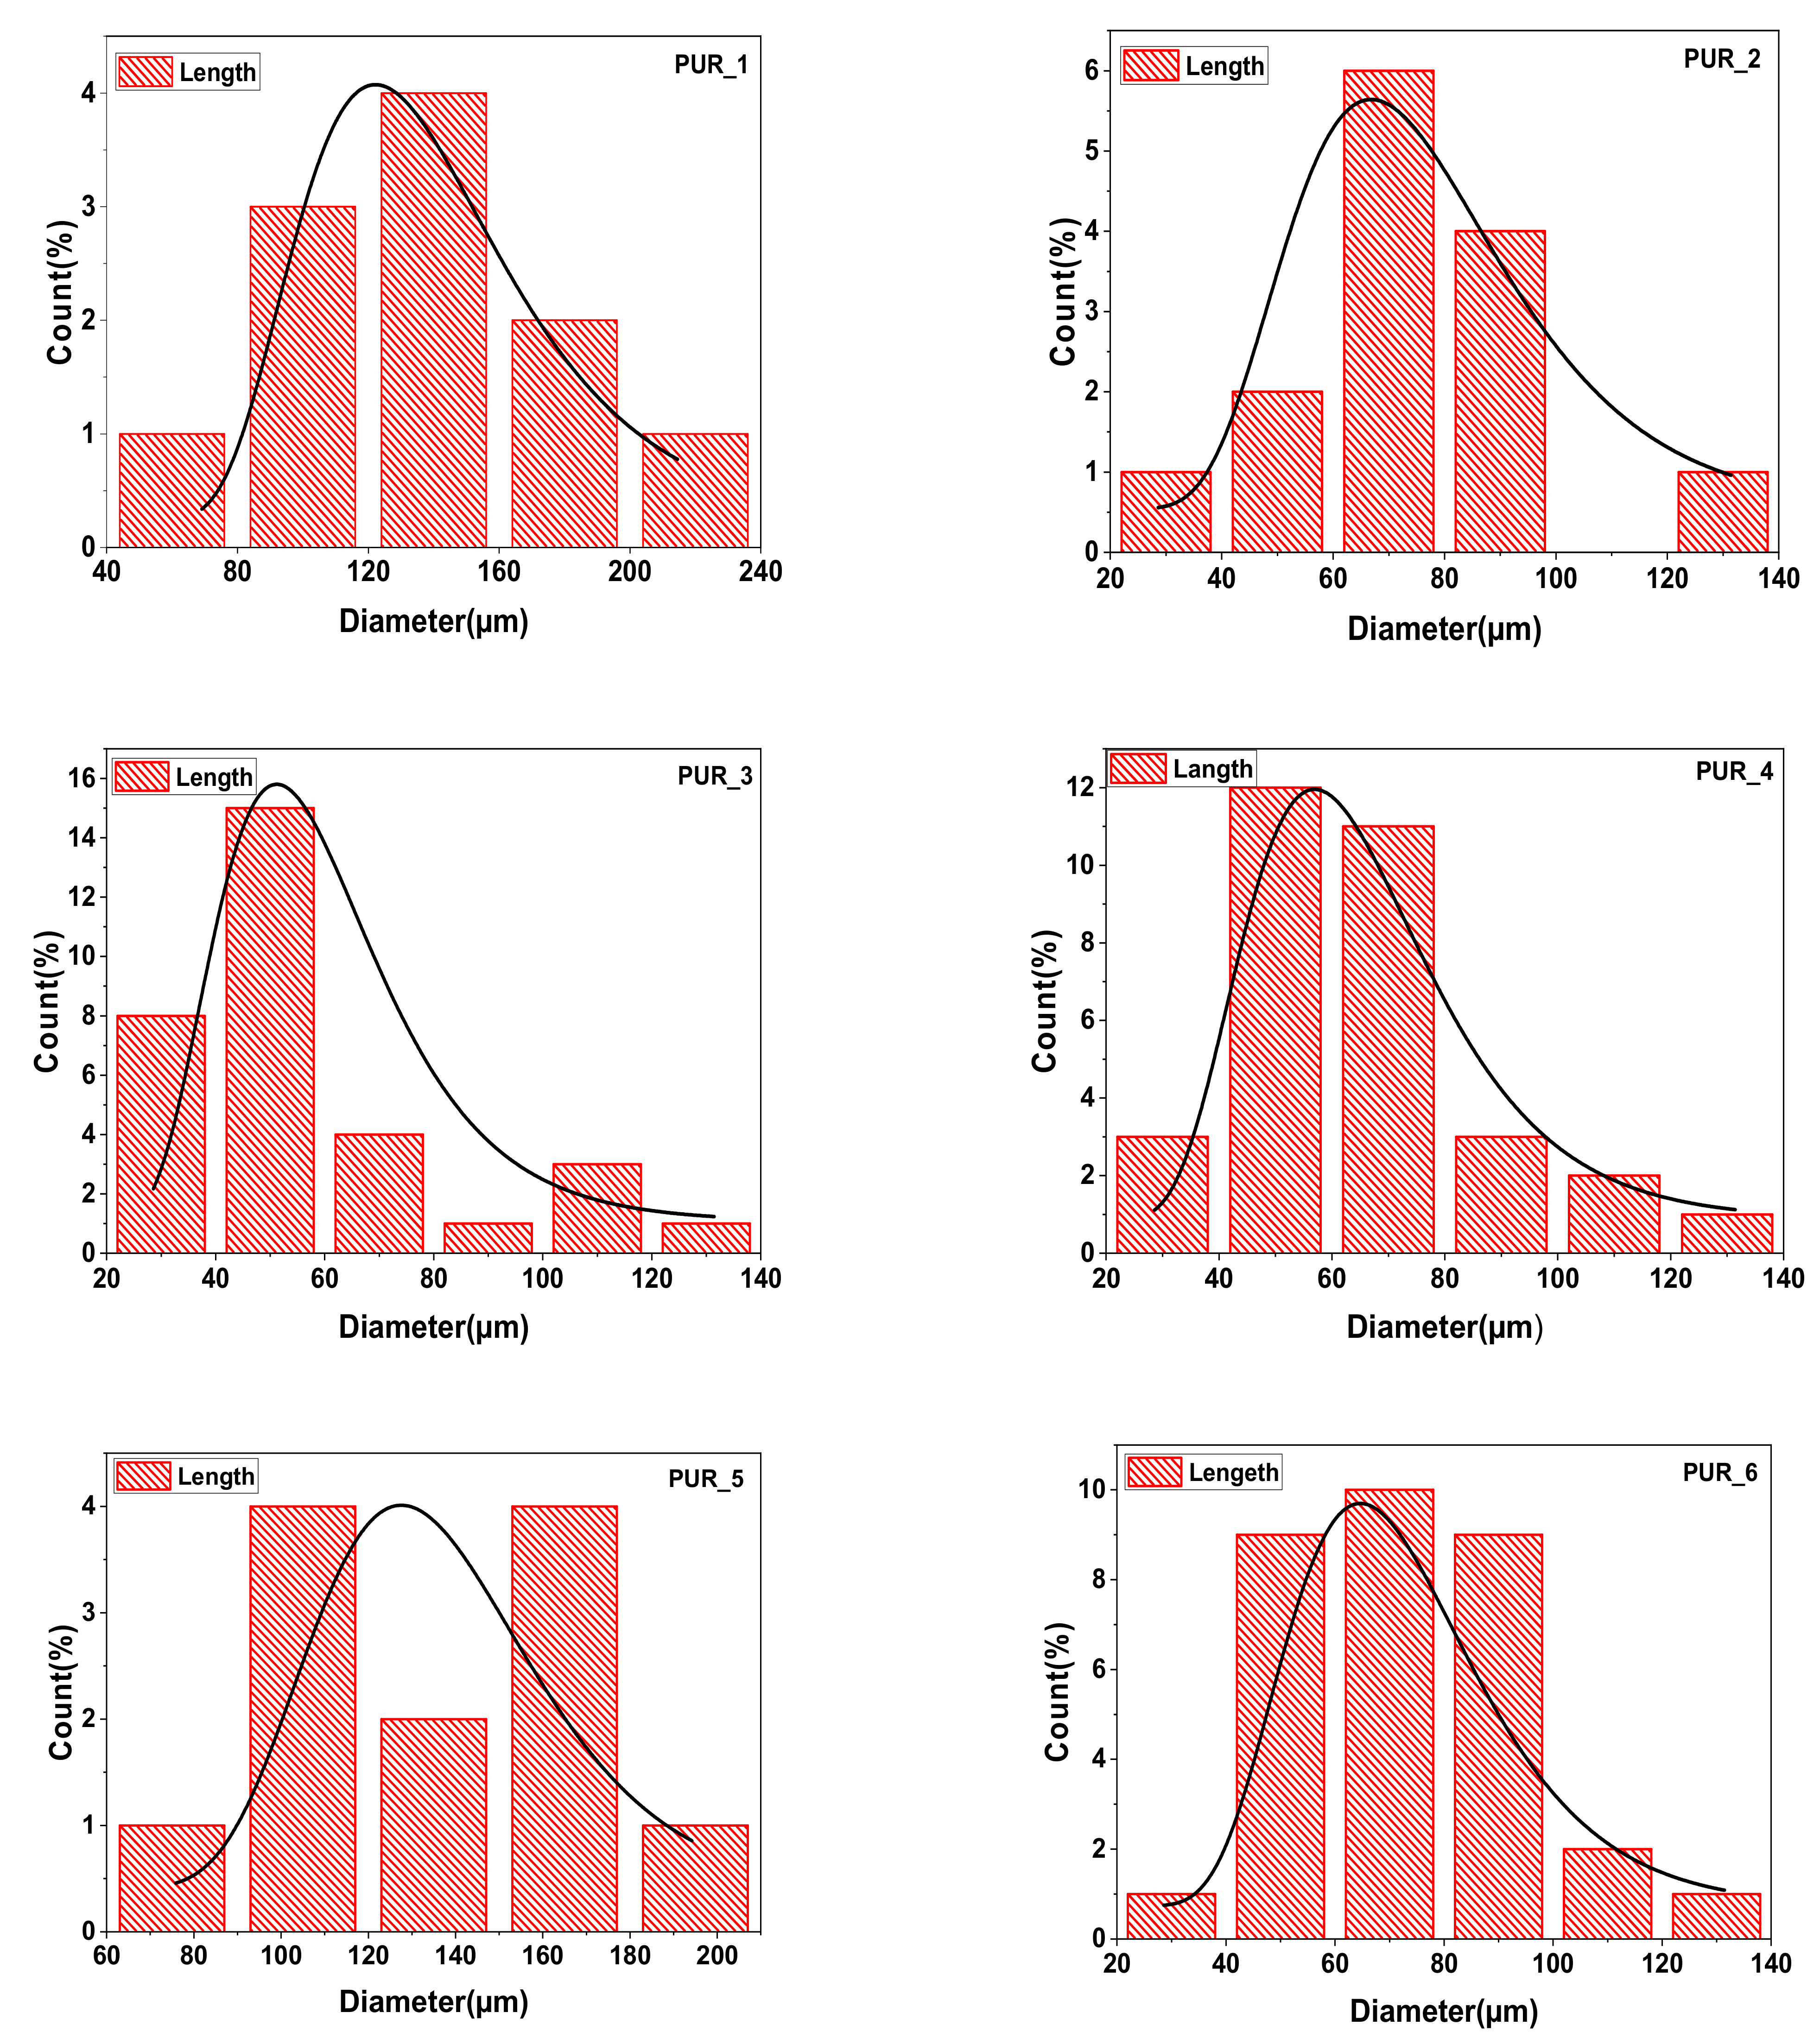
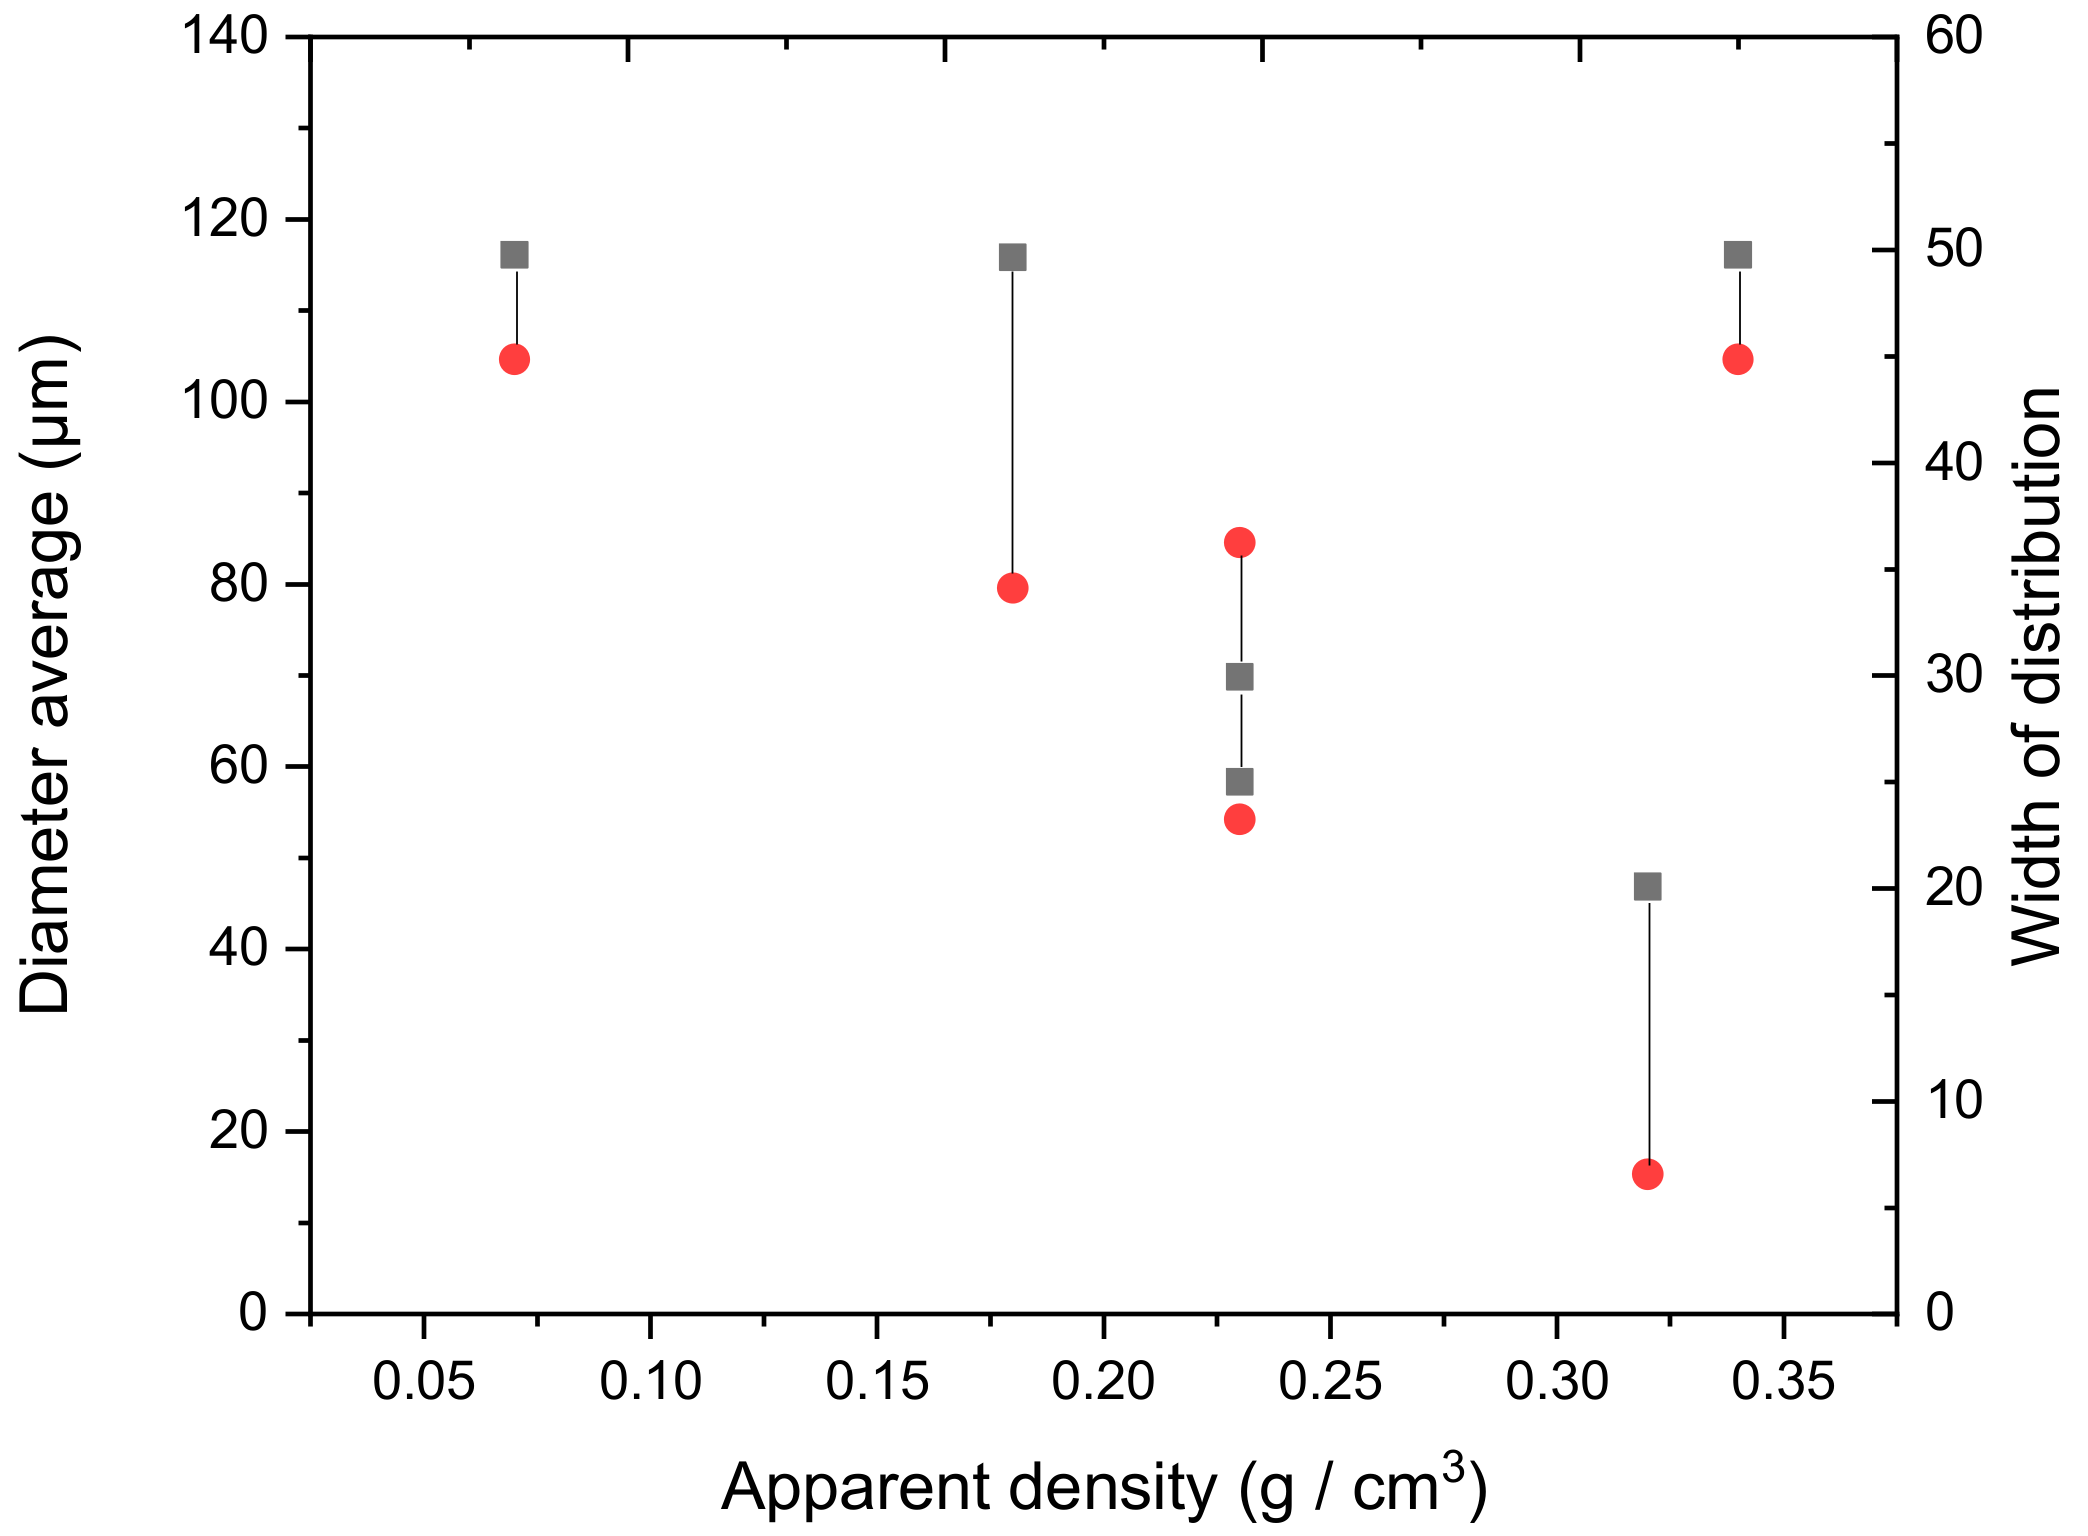
3.3.3. Descriptive Statistics

The distribution of polyurethane foam cells and filler is summarized in the corresponding Table 7.

3.4. Cellular Polyurethane Evaluation

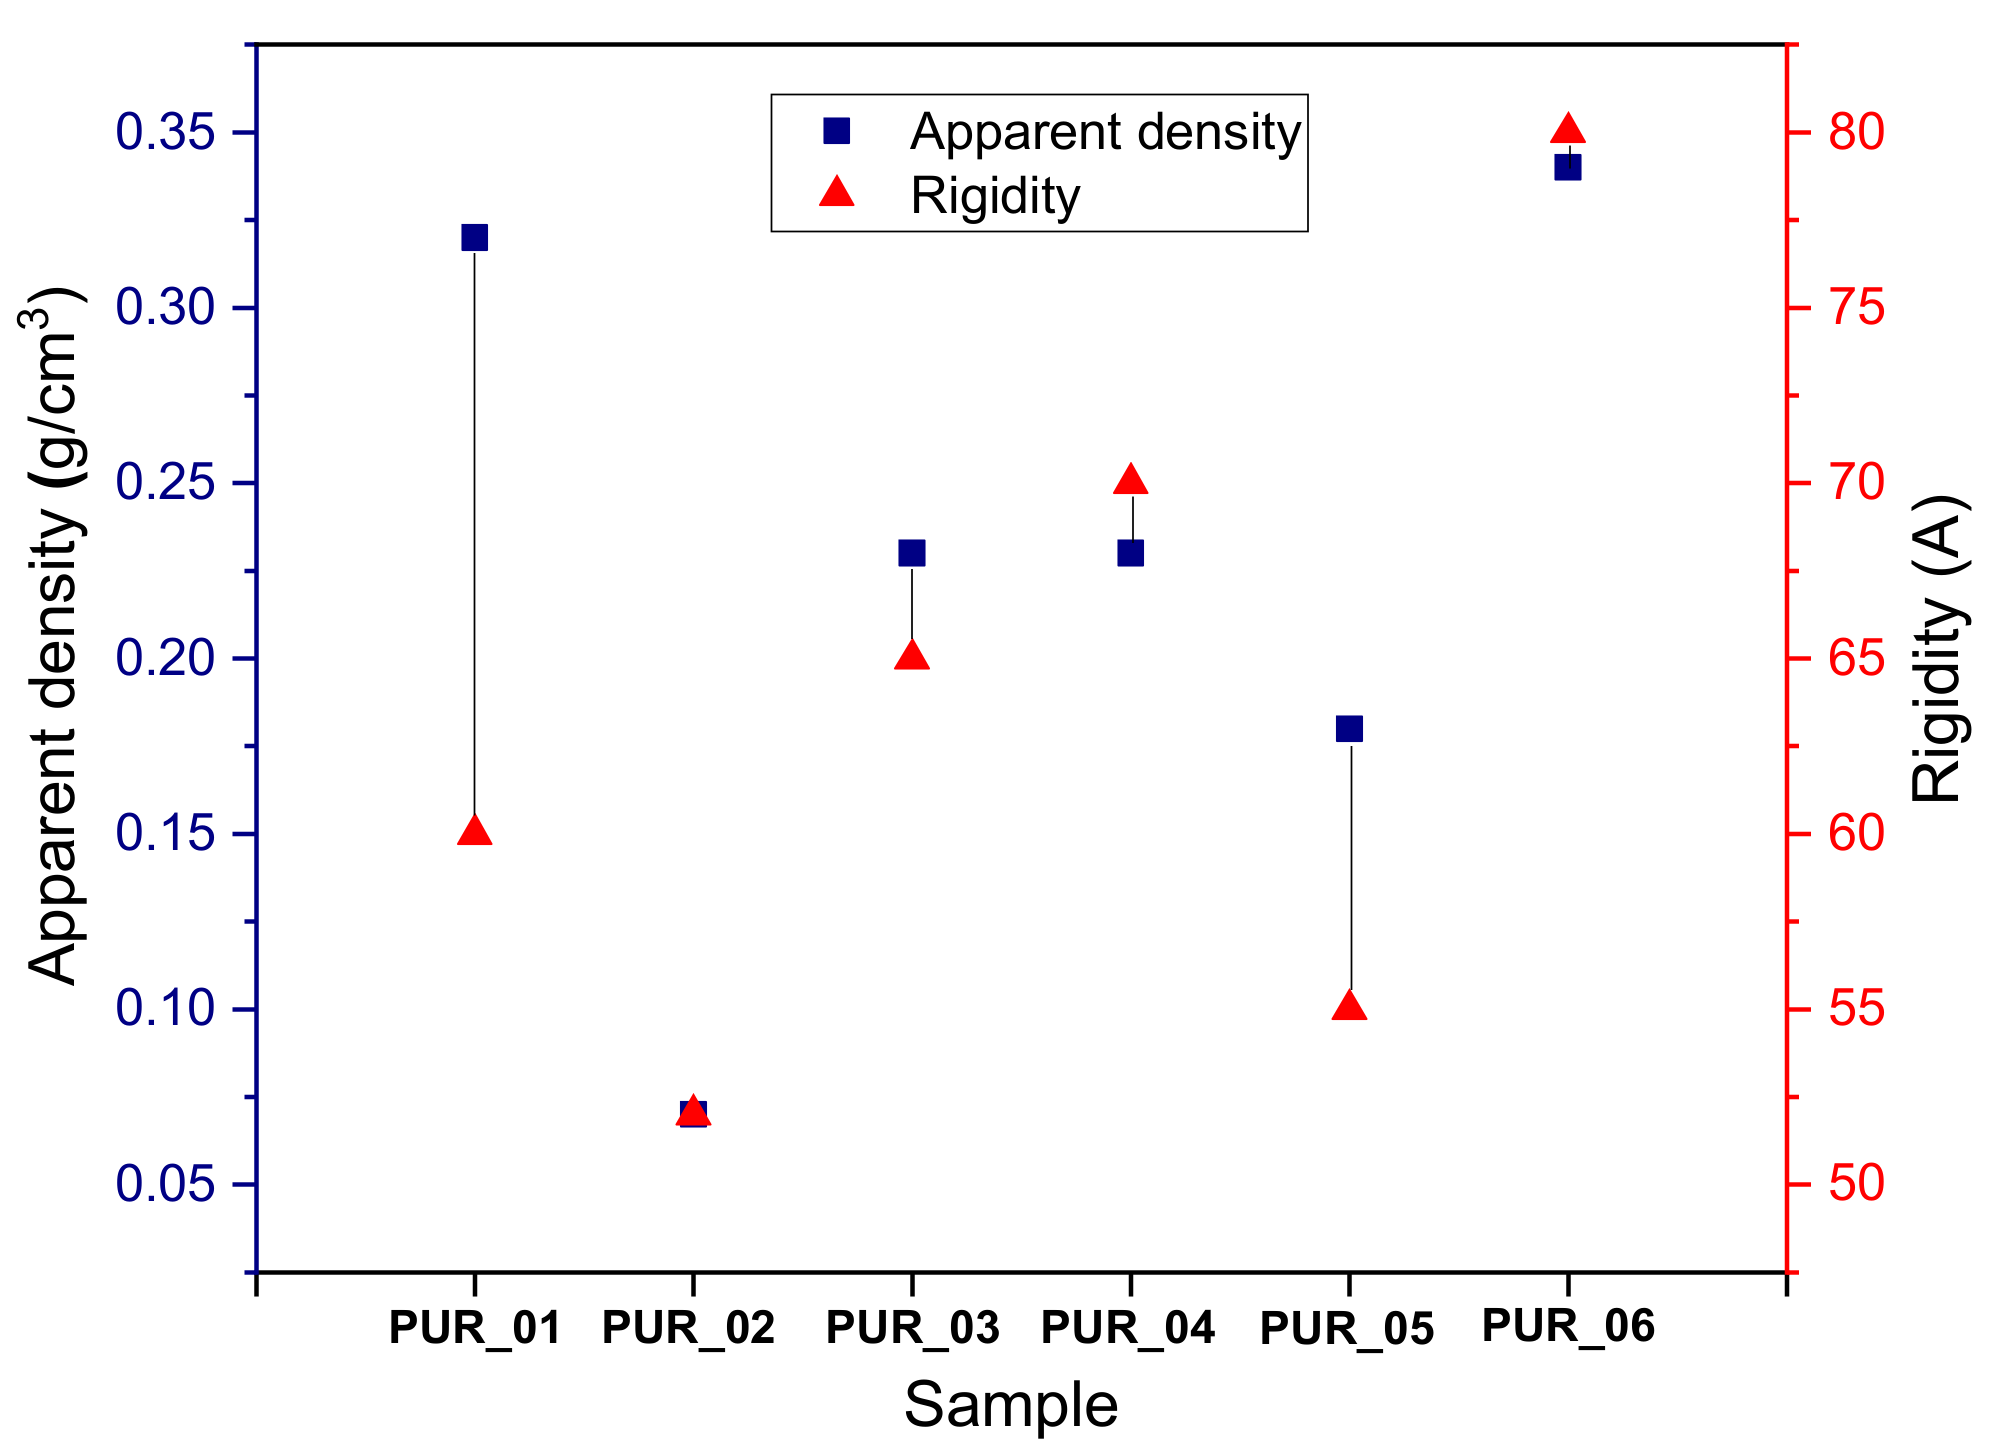
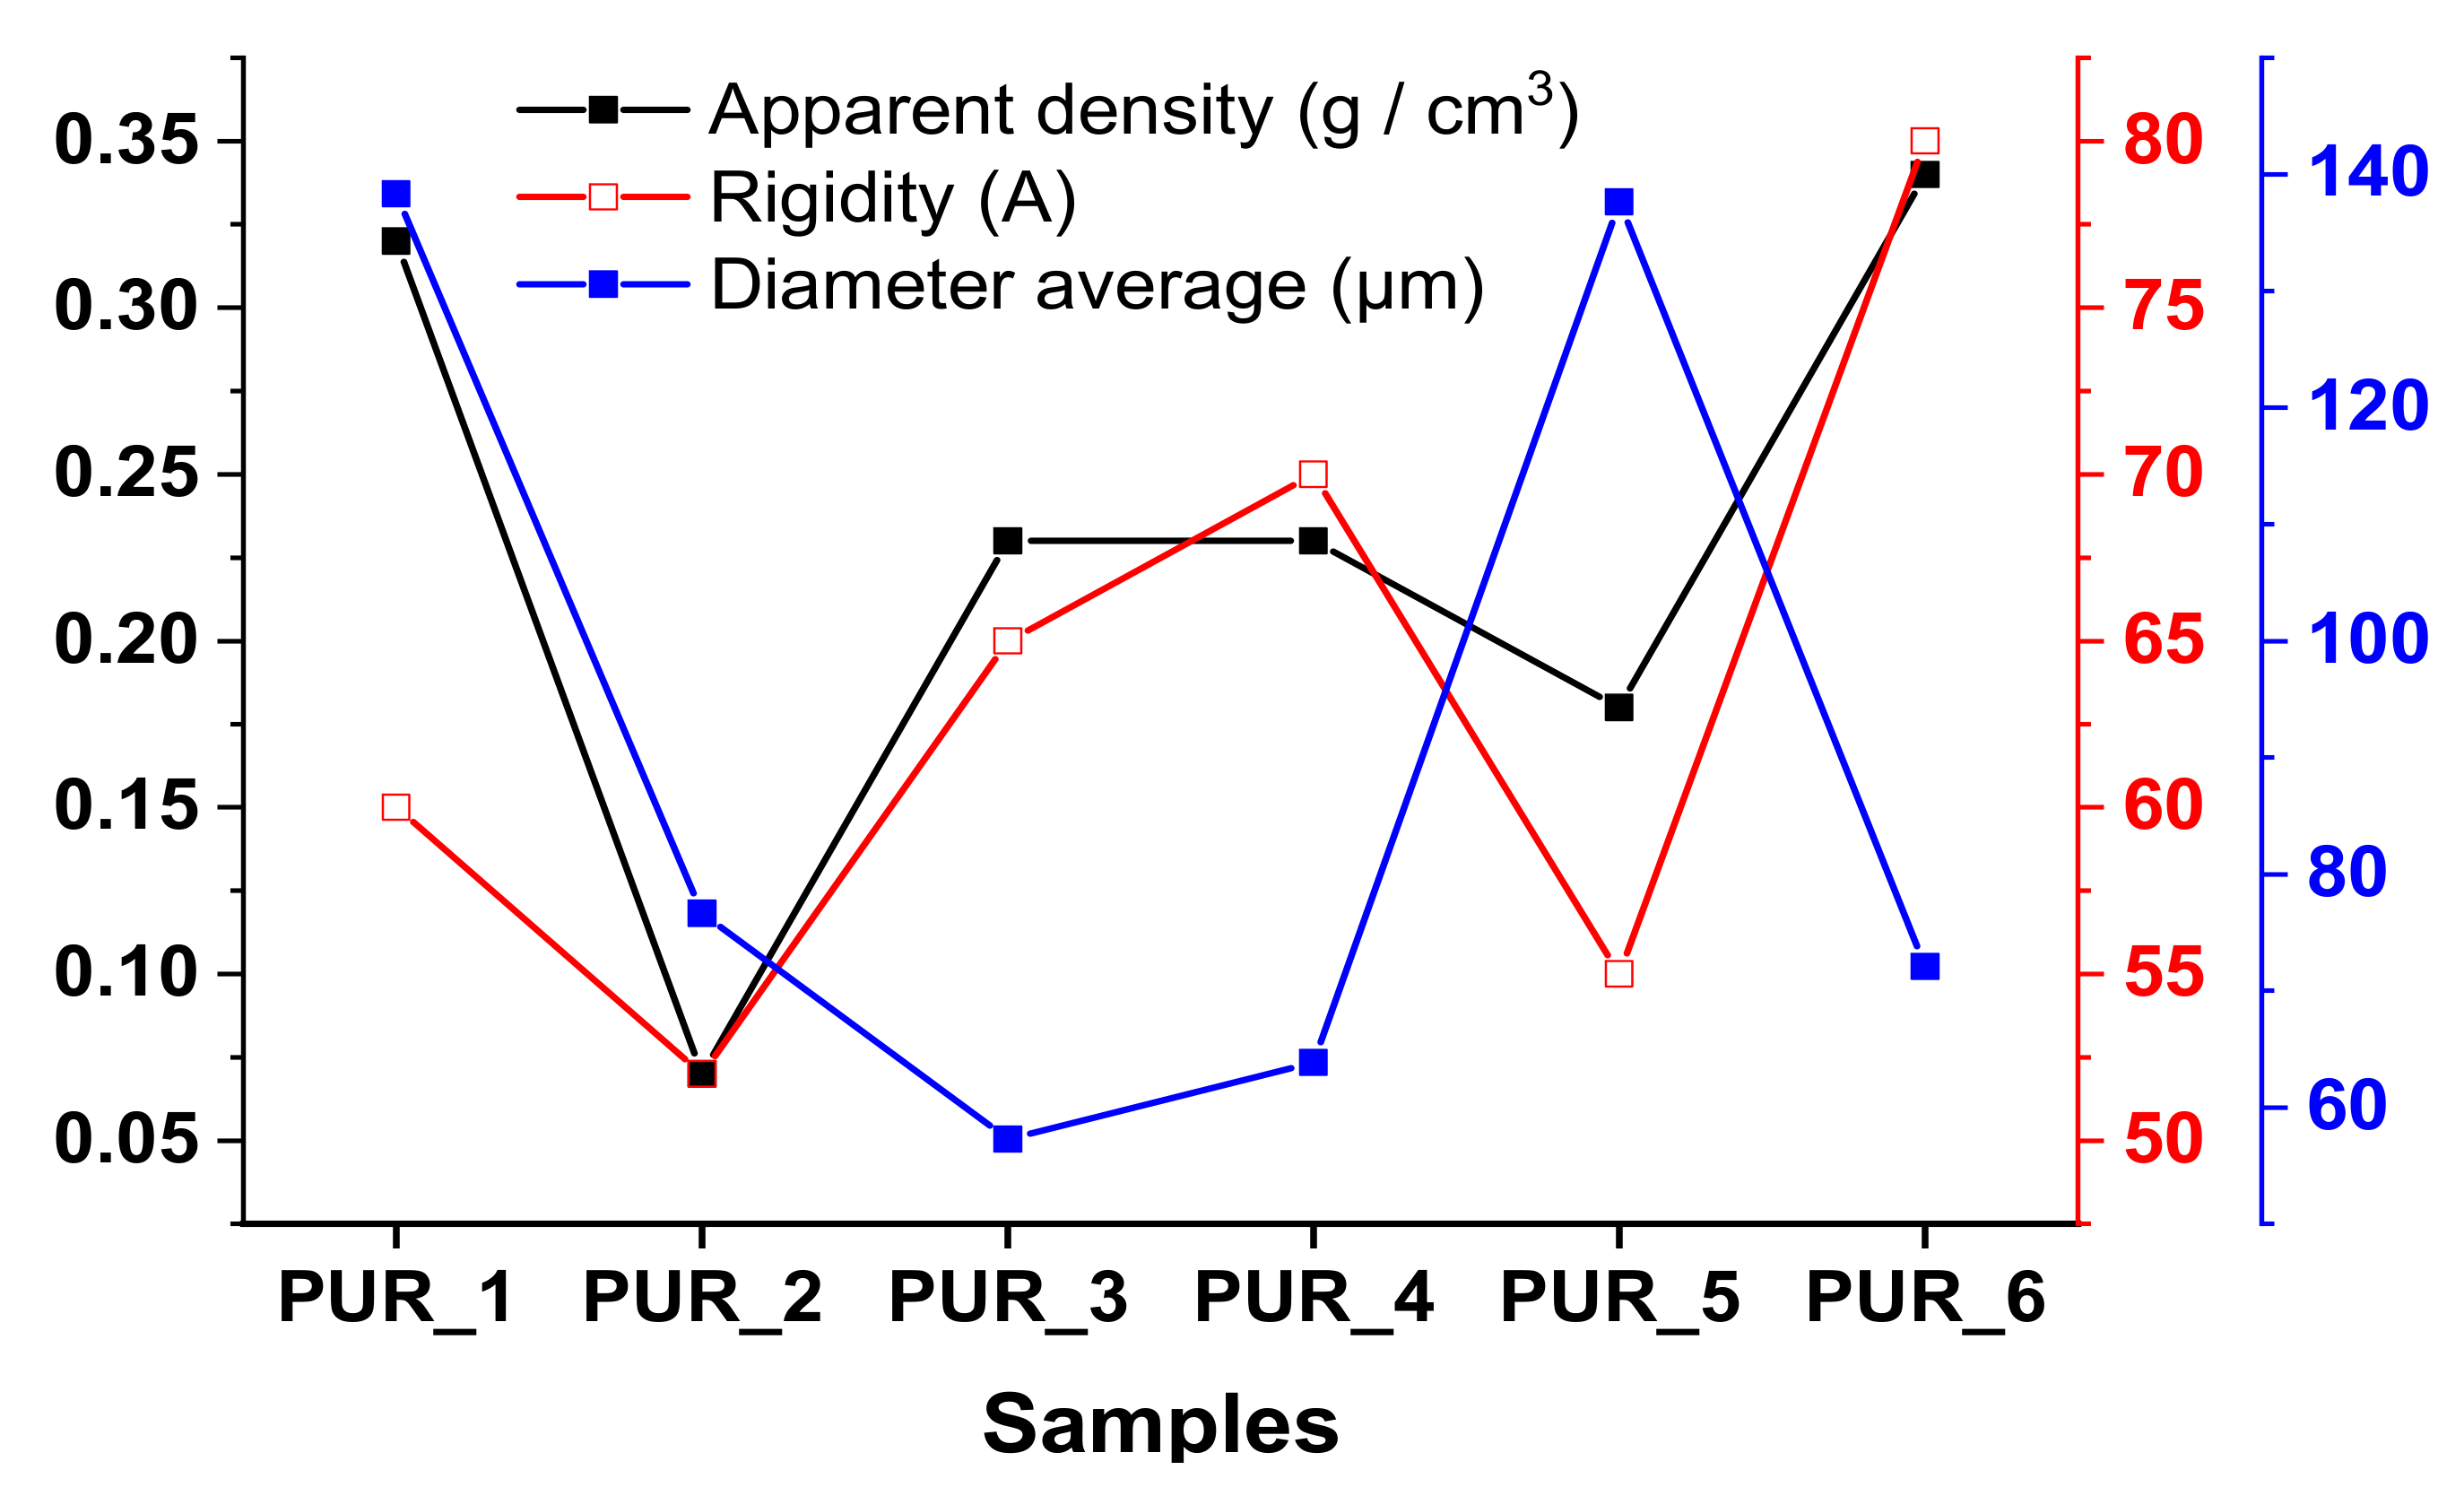
3.4.1. Evaluation of Stiffness and Apparent Density

Data demonstrate that polyurethane foam material’s evident apparent density specifically impacts the cell structure. The cell volume, compression power, and elongation at break increase with apparent density. We tested its rigidity and apparent density after creating a collection of foams of parallelepiped form. These results are described in Figure 14. The findings showed that the hardness was proportional to the density. The denser the sample was, the harder it was.
The interpretation of the bubbles involved in producing this delivery cellular of polyurethane, development, and stabilization processes is exceedingly complicated. Looking at foam structure in the examined density range can help predict mechanical characteristics more effectively [57].
The last two SEM images compare the microstructure of the second and sixth polyurethane foam samples, representing the smallest and largest apparent density ratio (Figure 15).
Foam measurements demonstrate shaped cells through scanning electron microscopy (Figure 15). The foam cells appear spherical and partially open in the studied density range (0.07–0.34). The foam density is regulated by the gas produced during the reaction. They influence the amount and scale of cells. From the cell diameter distribution (Figure 16) obtained from the picture study, the Gaussian distribution can be modified to evaluate its width and average diameter. The cell average size is 15 lm for relative density above 0.34, with a small distribution.
Foams with densities from 0.18 to 0.23 all have a cell-size distribution that increases as the density declines, and their typical size is far greater than that of foam of 80 lm. The average size of the lowest density foam (0.07) for an equal distribution is 105 lm.

3.4.2. Mechanical Behavior Modelling

To obtain a perfect model, we used an electron microscope SEM. To find a mathematical–physical model requires additional investigation. All computational and experimental data were combined to compare the newest polymeric foam research findings. On the other hand, Figure 17 combines bulk density, hardness and average diameter values of the polyurethane foam samples.
The figure below shows the plateau stress ln E of the foam samples as a function of density and ln (Diameter) function of ln (apparent density). This plateau stress, also called elastic breaking stress, is essential in the design of impact-resistant polyurethane foams because it heralds the commencement of the foam microstructure’s mechanical instability. The modulus is represented as a function of polyurethane foam density. The modulus of the foam is proportional to the density of the form thru a power-law relationship.
E * = α   ρ * n
E* is the foam modulus and ρ* is the foam density. Further, n is the density proponent, and the data are well suited for a density proponent of n = 1.7 over the density range shown in Figure 18.
Figure 19 shows the logarithm of values for polyurethane foam and solid polymer of 1.2 g/cm3. A sample of average density is equivalent to a huge polymeric foam of perfect density. A single direction with a 1.6 ramp confirms the force-law connection and intersects with the coordinates of ρPUR = 1, verifying the polymer-solid modulus relationship. In this case, 2 GPa modulus is within the range of 1.5 to 2.5 GPa (PU values) [58].
In the following, the junction of the best-fit graph is utilized to calculate the solid polymer modulus. The breakdown stress at the plateau of foam samples is demonstrated as a density function in Figure 20 and Figure 21. They are critical for the impact-mitigation design of polyurethane foams because they signal the onset of structural instability in the microstructure of the polyurethane foam [59]. Additionally, it exhibits power-law dependence on the density of the polyurethane foam, even though the exponent of density 2 is somewhat more significant than the value suggested by the modulus of elasticity.
The figure shows the results of the pressure tests over the whole range of foam densities investigated. The results reveal that the material’s energy absorption capacity rises linearly with foams density. The values range from 0.03 MPa for a polyurethane foam density of 0.07 g/cm3 to 0.12 MPa for a polyurethane foam density of 0.31 g/cm3. The energy values will appear to be significantly proportional to the importance of the polyurethane foam densities. For the quasi-static compression test, brittleness and hence loss of material elasticity determine the energy values.

4. Conclusions

Our approach was focused on reverse engineering, for which we performed research on PUR material and raw materials for our potential product. To successfully render this formulation work, we used grafted polyether polyols specifically built to produce flexible foams, a PMDI-type hardener, and glycerol as a chain spreader to produce crosslinked polymer polyurethane.
The ATG study revealed the impact tolerant quality of the manufactured goods, verified these findings and showed an optimum content of 10.5 wt.% bentonites by combining all the necessary bonuses. We demonstrated that our foams are mainly covered by intumescence through the mechanical characterization of polyurethane foams via compression testing. It should also be noted that the good shockproof result, which we obtained after adding BNT and Al2O3 with a low rate of 10.5 wt.% for PUR_5, only increased the tenacity of our PUR in going from 9% shock adsorption by Charpy tests by 7.26 J.
Quasi-static compression tests were performed. Compression tests revealed normal viscoelastic behavior in three phases: linear elastic deformation, plateau, and densification. We successfully created PUR foams, which IRTF and Raman spectral analyzes verified. The critical properties of our products can be described in their low visible density (~0.3 g/cm3) and low Tg (−35 °C). The latter was also lower after incorporating BNT and Al2O3, which also have shock-absorbent properties (−33.64 °C). According to XRD results, the established PUR had semicrystalline structures, and the degree of crystallinity ranged from 32 to 44%. They also had strong thermal stability up to 270 °C (analysis of DSC and TGA). By incorporating BNT, standardized tests demonstrated the shock-absorbing function of our PUR matrix.
A microscopic examination with a scan electron microscope would then be suggested to view the semi-open cells of the alveolar polymer. According to the results obtained, cellular polymer components have stubborn, typical cell structures with substantial overlap reversibility. The microstructural analysis revealed the open-cell nature of the elaborate foam. Changes in isocyanate regions were tracked for detection. This modification produced details on the foam’s kinetic reaction and morphological evolution.
To conclude our analysis, it is evident that clay typically influences polyurethane materials. Indeed, there was a sharp rise in the system’s viscosity and increased implementation difficulties. Therefore, optimizing the clay dispersion model seems essential. Thus, while high shear does not necessarily imply exfoliation, an extruder may be preferable for spreading clays. The final physicochemical properties of materials will be enhanced. The prospects opened up by this work are therefore numerous. Several challenges need to be addressed in the short term, including incorporating the required inorganic filler for PUR. There must be an optimized balance between rigidity and hardness. This way, an analysis can be performed utilizing other cross-linkage chain extenders. Lastly, the interlinking rate of our PUR needs to be improved by generating further interlinks between macromolecular chains. By introducing different materials, the impact-resistant nature can also be strengthened.
The final properties of the foam depend on the chemical composition, the blowing agent, the process conditions, and the nature of the mold facing. Thanks to the constant developments of new formulations, polyurethane foams are today manufactured with a great variety. Proposed in this article is the development and characterization of different polyurethane foams for use as base materials for nonlethal projectiles. First, various samples were made from formulations.

Supplementary Materials

The following supporting information can be downloaded at: https://0-www-mdpi-com.brum.beds.ac.uk/article/10.3390/app12042206/s1, Figure S1: Work methodology flowchart; Figure S2: Foaming process and final; Figure S3: The range of test specimens manufactured on the polyurethane foam formulation; Figure S4: Resilience test specimens; Figure S5: X-ray diffractogram of a sample of Meghnia bentonite; Figure S6: IR spectrum of polyols; Figure S7: IR spectrum of PMDI; Figure S8: IR triethylenetetramine spectrum; Figure S9: IR tin octoate spectrum; Figure S10: IR spectrum of glycerin; Figure S11: IR spectrum of silicone oil; Figure S12: IR spectrum of dichloromethane; Figure S13: Infrared spectrum of bentonite; Table S1: Dimensions of polyurethane foam samples for compression test; Table S2: Assignments of major functional groups in the polyol FTIR spectrum; Table S3: Assignments of the Main Functional Groups of the IRDF Spectrum; Table S4: Assignments of the main functional groups of the A33 FTIR spectrum; Table S5: Assignments of the Main Functional Groups of the OE FTIR Spectrum; Table S6: Assignments of the Main Functional Groups of the Glycerin FTIR Spectrum; Table S7: Assignments of the main functional groups of the silicone oil FTIR spectrum; Table S8: Allocations of the main functional groups of the dichloromethane FTIR spectrum; Table S9: Characteristic peak allocations; Table S10: Peak assignments characteristic of the reagents used; Table S11: Essential bands of polyurethane foam infrared spectra.

Author Contributions

Conceptualization and methodology B.N., S.Z. and G.J.-F.; software, C.H. and B.N.; formal analysis, C.H. and D.-R.J.; investigation, B.A. and G.J.-F.; resources, G.J.-F. and B.N.; data curation, B.N. and G.J.-F.; writing—original draft preparation, B.N., S.Z., B.A. and G.J.-F.; writing—review and editing, B.N., G.J.-F., S.Z. and B.A.; visualization, supervision, project administration, S.Z. and G.J.-F.; funding acquisition, B.N. and B.A. All authors have read and agreed to the published version of the manuscript.

Funding

This research was funded by The General Directorate of Scientific Research and Technological Development DG-RSDT grant number #Projects PNE/2019-EMP, and was funded by the Ministry of Higher Education and Scientific Research (MESRS).

Institutional Review Board Statement

The study was conducted in accordance with the Declaration of Helsinki and approved by the Ethics Committee of Ecole Militaire Polytechnique, Algeria.

Informed Consent Statement

Informed consent was obtained from all subjects involved in the study.

Data Availability Statement

All graphs can be requested from the corresponding author ([email protected]).

Acknowledgments

The authors gratefully acknowledge the Macromolecular Chemistry Laboratory (LCM) team, the Applied Chemistry Teaching and Research Unit, at the EMP Polytechnic Military School, in collaboration with the Polymer Materials Engineering laboratory of Lyon IMP/INSA, for supervising this work.

Conflicts of Interest

The authors declare no conflict of interest.

References

  1. Boumdouha, N.; Boudiaf, A.; Safidine, Z. Mechanical and chemical characterizations of filled polyurethane foams used for non-lethal projectiles. In Proceedings of the 10 the European Symposium on Non-Lethal Weapons EWG-NLW, Brussels, Belgium, 20–23 May 2019; p. 68. [Google Scholar]
  2. Pagalank, P.; April, S.; Francisco, S.; Schwartz, D.S.; Evans, A.G. Porous and Cellular Materials for Structural Applications; Materials Research Society: Warrendale, PA, USA, 1998; Volume 521. [Google Scholar]
  3. Gibson, L.J.; Ashby, M.F. Cellular Solids: Structure and Properties; Cambridge University Press: Cambridge, UK, 1999; ISBN 0521499119. [Google Scholar]
  4. Noureddine, B.; Zitouni, S.; Achraf, B.; Amar, O.; Eddine, T.D.; Abderouf, L. Mechanical and microstructural characterization of polyurethane foams. In Proceedings of the 8th Chemistry Days JCh8–EMP, Bordj El Bahri, Algeria, 26–27 March 2019; Military Polytechnic School (EMP): Bordj El Bahri, Algeria, 2019; p. 169. [Google Scholar]
  5. Noureddine, B.; Zitouni, S.; Achraf, B.; Tria, D.; Amar, O. Élaboration et caractérisation mécanique des mousses polyuréthanes modifiés. In Proceedings of the Fourth International Conference on Energy, Materials, Applied Energetics and Pollution ICEMAEP2018, Constantine, Algeria, 29–30 April 2018; Université Frères Mentouri Constantine 1: Constantine, Algeria, 2018; pp. 136–142. [Google Scholar]
  6. Bezazi, A.; Scarpa, F. Tensile fatigue of conventional and negative Poisson’s ratio open cell PU foams. Int. J. Fatigue 2009, 31, 488–494. [Google Scholar] [CrossRef]
  7. Chomard, A.-M. Fatigue thermique des matériaux polyuréthane: Essais d’optimisation d’une formulation PU à base de polyester. Ph.D. Thesis, INSA Lyon, Villeurbanne, France, 1997; p. 210. [Google Scholar]
  8. Fuest, R.W. Polyurethane Elastomers. In Rubber Technology; Carl Hanser Verlag GmbH & Co. KG: München, Germany, 2009; Volume 89, pp. 238–263. ISBN 940112924X. [Google Scholar]
  9. Dieter, J.W.; Byrne, C.A. Aliphatic polyurethane elastomers with high performance properties. Polym. Eng. Sci. 1987, 27, 673–683. [Google Scholar] [CrossRef]
  10. Hanhi, K.; Stenberg, B. Friction and the dynamic mechanical and thermal properties of polyurethane elastomers. Microcellular polyurethanes. Prog. Rubber Plast. Technol. 1994, 10, 54–78. [Google Scholar]
  11. Jiang, M.; He, L.; Gong, W.; Dong, L.; Xie, H.; Xiong, C. Enhancement of Polymer Foam Quality by Modifying Structural and Decomposition Characteristics of Chemical Blowing Agent. Polym.-Plast. Technol. Eng. 2012, 51, 263–267. [Google Scholar] [CrossRef]
  12. Ghasemlou, M.; Daver, F.; Ivanova, E.P.; Adhikari, B. Bio-based routes to synthesize cyclic carbonates and polyamines precursors of non-isocyanate polyurethanes: A review. Eur. Polym. J. 2019, 118, 668–684. [Google Scholar] [CrossRef]
  13. De Luca Bossa, F.; Verdolotti, L.; Russo, V.; Campaner, P.; Minigher, A.; Lama, G.C.; Boggioni, L.; Tesser, R.; Lavorgna, M. Upgrading sustainable polyurethane foam based on greener polyols: Succinic-based polyol and mannich-based polyol. Materials 2020, 13, 3170. [Google Scholar] [CrossRef]
  14. De Luca Bossa, F.; Santillo, C.; Verdolotti, L.; Campaner, P.; Minigher, A.; Boggioni, L.; Losio, S.; Coccia, F.; Iannace, S.; Lama, G.C. Greener nanocomposite polyurethane foam based on sustainable polyol and natural fillers: Investigation of chemico-physical and mechanical properties. Materials 2020, 13, 211. [Google Scholar] [CrossRef] [PubMed]
  15. Ghasemlou, M.; Daver, F.; Ivanova, E.P.; Murdoch, B.J.; Adhikari, B. Use of Synergistic Interactions to Fabricate Transparent and Mechanically Robust Nanohybrids Based on Starch, Non-Isocyanate Polyurethanes, and Cellulose Nanocrystals. ACS Appl. Mater. Interfaces 2020, 12, 47865–47878. [Google Scholar] [CrossRef] [PubMed]
  16. Dorcheh, A.S.; Abbasi, M.H. Silica aerogel; synthesis, properties and characterization. J. Mater. Process. Technol. 2008, 199, 10–26. [Google Scholar] [CrossRef]
  17. Feinle, A.; Hüsing, N. Mixed metal oxide aerogels from tailor-made precursors. J. Supercrit. Fluids 2015, 106, 2–8. [Google Scholar] [CrossRef]
  18. Zu, G.; Shen, J.; Wang, W.; Lian, Y.; Zou, L.; Zhang, Y.; Liu, B.; Zhang, F. Heat-resistant, strong titania aerogels achieved by supercritical deposition. J. Supercrit. Fluids 2015, 106, 145–151. [Google Scholar] [CrossRef]
  19. Huang, P.; Fan, M. Development of facture free clay-based aerogel: Formulation and architectural mechanisms. Compos. Part B Eng. 2016, 91, 169–175. [Google Scholar] [CrossRef] [Green Version]
  20. Finlay, K.A.; Gawryla, M.D.; Schiraldi, D.A. Effects of fiber reinforcement on clay aerogel composites. Materials 2015, 8, 5440–5451. [Google Scholar] [CrossRef] [PubMed] [Green Version]
  21. Verdolotti, L.; Lavorgna, M.; Lamanna, R.; Di Maio, E.; Iannace, S. Polyurethane-silica hybrid foam by sol-gel approach: Chemical and functional properties. Polymer 2015, 56, 20–28. [Google Scholar] [CrossRef]
  22. BOUMDOUHA, N.; SAFIDINE, Z.; BOUDIAF, A. Experimental Study of Loaded Foams During Free Fall Investigation and Evaluation of Microstructure. Int. J. Adv. Manuf. Technol. 2021. [Google Scholar] [CrossRef]
  23. Noureddine, B.; Zitouni, S.; Achraf, B.; Amar, O.; Eddine, T.D. Élaboration et caractérisation mécanique des mousses polymères: Application aux projectiles non létaux. In Proceedings of the 11th Days of Mechanics JM’11–EMP; Military Polytechnic School (EMP): Bordj El Bahri, Algeria, 2011; pp. 24–33. [Google Scholar]
  24. Chen, H.B.; Wang, Y.Z.; Schiraldi, D.A. Preparation and flammability of poly(vinyl alcohol) composite aerogels. ACS Appl. Mater. Interfaces 2014, 6, 6790–6796. [Google Scholar] [CrossRef] [PubMed]
  25. Motahari, S.; Motlagh, G.H.; Moharramzadeh, A. Thermal and flammability properties of polypropylene/silica aerogel composites. J. Macromol. Sci. Part B Phys. 2015, 54, 1081–1091. [Google Scholar] [CrossRef]
  26. Noureddine, B.; Zitouni, S.; Achraf, B.; Amar, O.; Eddine, T.D.; Abderaouf, L.M. Manufacture of polyurethane foam with a certain density. In Proceedings of the The International Conference on Recent Advances in Robotics and Automation ICRARE’18, Monastir, Tunisia, 3–4 November 2018; C.E.S International Joint Conferences: Monastir, Tunisia, 2018; pp. 21–30. [Google Scholar]
  27. Camberlin, Y.; Pascault, J.P.; Letoffe, M.; Claudy, P. Synthesis and Dsc Study of Model Hard Segments From Diphenyl Methane Diisocyanate and Butane Diol. J. Polym. Sci. A1 1982, 20, 383–392. [Google Scholar] [CrossRef]
  28. Guemaz, N. Préparation et étude de la stabilité thermique des polyuréthanes. Ph.D. Thesis, Université Ferhat Abbas, Sétif, Algeria, 2018. [Google Scholar]
  29. Michel, F. Chimie et physico-chimie des polymères—2e édition—Michel Fontanille, Yves Gnanou—Google Livres, 3e éd. ed; Sciences sup Chimie Cours; Dunod: Paris, France, 2014; ISBN 978-2-10-058915-9. [Google Scholar]
  30. Kiss, G.; Rusu, G.; Peter, F.; Tănase, I.; Bandur, G. Recovery of Flexible Polyurethane Foam Waste for Efficient Reuse in Industrial Formulations. Polymers 2020, 12, 1533. [Google Scholar] [CrossRef] [PubMed]
  31. Massiot, D.; Fayon, F.; Capron, M.; King, I.; Le Calvé, S.; Alonso, B.; Durand, J.; Bujoli, B.; Gan, Z.; Hoatson, G. Modelling one-and two-dimensional solid-state NMR spectra. Magn. Reson. Chem. 2002, 40, 70–76. [Google Scholar] [CrossRef]
  32. Queiroz, D.P.; de Pinho, M.N.; Dias, C. ATR− FTIR studies of poly (propylene oxide)/polybutadiene bi-soft segment urethane/urea membranes. Macromolecules 2003, 36, 4195–4200. [Google Scholar] [CrossRef]
  33. Methods, S.T. Standard Test Methods for Flexible Cellular Materials—Slab, Bonded, and Molded Urethane Foams. ASTM 2012, 5, 1–29. [Google Scholar]
  34. Mushkin, Y.I.; Smirnova, N.F.; Tsigin, B.M.; Finkel’shtein, A.I. IR and UV spectea of diaminodiphenylmethane isomers and the corresponding diisocyanates. J. Appl. Spectrosc. 1971, 15, 1623–1627. [Google Scholar] [CrossRef]
  35. Stephenson, C.V.; Coburn, W.C.; Wilcox, W.S. The vibrational spectra and assignments of nitrobenzene, phenyl isocyanate, phenyl isothiocyanate, thionylaniline and anisole. Spectrochim. Acta 1961, 17, 933–946. [Google Scholar] [CrossRef]
  36. Wilhelm, C.; Gardette, J.L. Infrared analysis of the photochemical behaviour of segmented polyurethanes: Aliphatic poly(ether-urethane)s. Polymer 1998, 39, 5973–5980. [Google Scholar] [CrossRef]
  37. Tammer, M.G. Sokrates: Infrared and Raman characteristic group frequencies: Tables and charts. Colloid Polym. Sci. 2004, 283, 235. [Google Scholar] [CrossRef]
  38. Dresselhaus, M.S.; Dresselhaus, G. Intercalation compounds of graphite. Adv. Phys. 2002, 51, 1–186. [Google Scholar] [CrossRef]
  39. Trovati, G.; Sanches, E.A.; Neto, S.C.; Mascarenhas, Y.P.; Chierice, G.O. Characterization of polyurethane resins by FTIR, TGA, and XRD. J. Appl. Polym. Sci. 2010, 115, 263–268. [Google Scholar] [CrossRef]
  40. Malíková, M.; Rychlý, J.; Matisová-Rychlá, L.; Csomorová, K.; Janigová, I.; Wilde, H.W. Assessing the progress of degradation in polyurethanes by chemiluminescence. I. Unstabilised polyurethane films. Polym. Degrad. Stab. 2010, 95, 2367–2375. [Google Scholar] [CrossRef]
  41. Krämer, R.H.; Zammarano, M.; Linteris, G.T.; Gedde, U.W.; Gilman, J.W. Heat release and structural collapse of flexible polyurethane foam. Polym. Degrad. Stab. 2010, 95, 1115–1122. [Google Scholar] [CrossRef]
  42. Dollimore, D. Thermal Characterization of Polymeric Materials. Thermochim. Acta 1983, 60, 119–120. [Google Scholar] [CrossRef]
  43. Koberstein, J.T.; Galembos, A.F.; Leung, L.M. Compression-Molded Polyurethane Block Copolymers. 1. Microdomain Morphology and Thermomechanical Properties. Macromolecules 1992, 25, 6195–6204. [Google Scholar] [CrossRef]
  44. Saiani, A.; Novak, A.; Rodier, L.; Eeckhaut, G.; Leenslag, J.W.; Higgins, J.S. Origin of multiple melting endotherms in a high hard block content polyurethane: Effect of annealing temperature. Macromolecules 2007, 40, 7252–7262. [Google Scholar] [CrossRef]
  45. Unal, S.; Ozturk, G.; Sisson, K.; Long, T.E. Poly(caprolactone) containing highly branched segmented poly(ester urethane)s via A2 with oligomeric B3 polymerization. J. Polym. Sci. Part A Polym. Chem. 2008, 46, 6285–6295. [Google Scholar] [CrossRef]
  46. Fox, T.G., Jr.; Flory, P.J. Second-order transition temperatures and related properties of polystyrene. I. Influence of molecular weight. J. Appl. Phys. 1950, 21, 581–591. [Google Scholar] [CrossRef]
  47. Hibon, S. Elaboration de formulations Polyuréthane/Nanocharges minérales: Influence des charges sur la synthèse des prépolymères. Ph.D. Thesis, INSA Lyon, Villeurbanne, France, 2006; p. 201. [Google Scholar]
  48. Harte, A.M.; Fleck, N.A.; Ashby, M.F. The fatigue strength of sandwich beams with an aluminium alloy foam core. Int. J. Fatigue 2001, 23, 499–507. [Google Scholar] [CrossRef]
  49. Goussery-Vafiadès V Caractérisations Microstructurale Et Mécanique De Mousses De Nickel À Cellules Ouvertes Pour Batteries De Véhicules Hybrides. Ph.D. Thesis, École Nationale Supérieure des Mines de Paris, Paris, France, 2004.
  50. Bezazi, A.; Scarpa, F. Mechanical behaviour of conventional and negative Poisson’s ratio thermoplastic polyurethane foams under compressive cyclic loading. Int. J. Fatigue 2007, 29, 922–930. [Google Scholar] [CrossRef]
  51. Gong, L.; Kyriakides, S.; Jang, W.Y. Compressive response of open-cell foams. Part I: Morphology and elastic properties. Int. J. Solids Struct. 2005, 42, 1355–1379. [Google Scholar] [CrossRef]
  52. Saha, M.C.; Mahfuz, H.; Chakravarty, U.K.; Uddin, M.; Kabir, M.E.; Jeelani, S. Effect of density, microstructure, and strain rate on compression behavior of polymeric foams. Mater. Sci. Eng. A 2005, 406, 328–336. [Google Scholar] [CrossRef]
  53. Jin, H.; Lu, W.Y.; Scheffel, S.; Hinnerichs, T.D.; Neilsen, M.K. Full-field characterization of mechanical behavior of polyurethane foams. Int. J. Solids Struct. 2007, 44, 6930–6944. [Google Scholar] [CrossRef] [Green Version]
  54. Saint-Michel, F.; Chazeau, L.; Cavaillé, J.Y. Mechanical properties of high density polyurethane foams: II Effect of the filler size. Compos. Sci. Technol. 2006, 66, 2709–2718. [Google Scholar] [CrossRef]
  55. Dounis, D.V.; Wilkes, G.L. Structure-property relationships of flexible polyurethane foams. Polymer 1997, 38, 2819–2828. [Google Scholar] [CrossRef]
  56. Moreland, J.C.; Wilkes, G.L.; Turner, R.B. Viscoelastic behavior of flexible slabstock polyurethane foams: Dependence on temperature and relative humidity. I. Tensile and compression stress (load) relaxation. J. Appl. Polym. Sci. 1994, 52, 549–568. [Google Scholar] [CrossRef]
  57. Dawson, J.R.; Shortall, J.B. The microstructure of rigid polyurethane foams. J. Mater. Sci. 1982, 17, 220–224. [Google Scholar] [CrossRef]
  58. Bossert, R.G. Fibres, plastics and rubbers: A handbook of common polymers (Roff, W.J.). J. Chem. Educ. 1957, 34, 417. [Google Scholar] [CrossRef]
  59. Green, D.J. Mechanical Behavior of Cellular Ceramics. In Proceedings of the Metallurgical Society of the Canadian Institute of Mining and Metallurgy; Elsevier: Amsterdam, The Netherlands, 1988; pp. 191–192. [Google Scholar]
Figure 1. Polyurethane formation [4].
Applsci 12 02206 g001
Figure 2. Foaming reaction yielding to CO2 and amine and subsequent responses.
Applsci 12 02206 g002
Figure 3. Influence of the nature of the catalyst on the morphology of the polyurethane foams (NCO/OH = 1.1): (a) 5 wt.% TEDA; (b) TEDA (5 wt.% POPE)/2-TEH (0.5 wt.% POPE); (c) BDMAEE (5 wt.% POPE)/2-TEH (2.5 wt.% POPE); (d) TEDA (5 wt.% POPE)/TMDA (0.5 wt.% POPE).
Applsci 12 02206 g003
Figure 4. Raman spectra of the different PUR with various additives.
Applsci 12 02206 g004
Figure 5. Comparative overlay of infrared spectra for samples of polyurethane foam.
Applsci 12 02206 g005
Figure 6. X-ray diffractogram for samples of polyurethane foam.
Applsci 12 02206 g006
Figure 7. Evolution of the % loss of mass as a function of temperature for different polyurethane foams.
Applsci 12 02206 g007
Figure 8. Differential curves (DTG) of polyurethane foams.
Applsci 12 02206 g008
Figure 9. DSC thermograms of polyurethane foams (10 K·min−1).
Applsci 12 02206 g009
Figure 10. Compression curves of polyurethane foams prepared from different formulations.
Applsci 12 02206 g010
Figure 11. Cellular image of polyurethane.
Applsci 12 02206 g011aApplsci 12 02206 g011b
Figure 12. SEM micrographs showing the PUR pores and distribution of BNT and Al2O3 particles.
Applsci 12 02206 g012
Figure 13. A histogram illustrates the mean pore diameter distribution for the various PUR generated.
Applsci 12 02206 g013
Figure 14. The influence of bulk density-assigned hardness on the structure of polyurethane foams (PUR).
Applsci 12 02206 g014
Figure 15. SEM micrographs of foams. (a) Formulation PUR_6 (Density = 0.34); (b) Formulation PUR_2 (Density = 0.07).
Applsci 12 02206 g015
Figure 16. The diameter average (square) and width of distribution (circle) of the PUR foam cells function do the density.
Applsci 12 02206 g016
Figure 17. Curves with variable rigidity and bulk density with PUR are based on their additive material.
Applsci 12 02206 g017
Figure 18. The evolution of the stress at the plateau’s beginning as a function of the total density as determined by compressive tests on polyurethane foam reinforced foams.
Applsci 12 02206 g018
Figure 19. The modulus of the foams exhibits a power-law relationship with the bulk density and diameter of the cell.
Applsci 12 02206 g019
Figure 20. The mean cell diameter of the cell polyurethane foam is the relative density.
Applsci 12 02206 g020
Figure 21. The energy consumed according to the apparent density of polyurethane foams.
Applsci 12 02206 g021
Table 1. Quantity of the prepared polyurethane foams (in wt.%).
ComponentMaterialsPUR_01PUR_02PUR_03PUR_04PUR_05PUR_06
PUR1.05/0.93/0/0PUR1.1/1.25/10.52/0PUR1.04/1.25/10.43/0PUR1.08/0.97/3.52/0PUR1.05/1.89/0/10.53PUR1.01/1.74/0/0
APolyol (wt.%)62.5859.0958.4462.1758.8365.94
Glycerin (wt.%)1.382.192.152.292.281.01
Dichloromethane (wt.%)0.740001.240.82
Silicone (wt.%)0.832.071.461.541.242.75
PEG (wt.%)1.2500001.11
Catalyst BDMAEE (wt.%)0.931.261.2611.791.76
Bentonite (wt.%)010.5210.433.5200
Alumina (wt.%)000010.530
BPMDI (wt.%)32.2924.8726.2629.4924.0926.61
Table 2. The various ratios used during the PUR formula optimization.
SamplesNCO/OHNCO (mol)/PMDI (mL)NCO (mol)/GCO (mL)NCO (mol)/Additives (mL)Shore A (A)Apparent Density (at RT)
PUR_011.0544.553.139.32500.32
PUR_021.144.553.137.4370.07
PUR_031.0644.553.138.92510.23
PUR_041.0444.553.139.73760.23
PUR_051.0844.553.138.15470.18
PUR_061.0144.553.141850.34
Table 3. Diffractogram parameters and rigidity of different PUR produced.
Foamsd (nm) (2θ)Crystallinity Rate (%)Rigidity by Shore A
PUR_1 39.8260
PUR_29.2337.1152
PUR_3(9.58°)32.265
PUR_44.634.1570
PUR_5(19.26°)36.0155
PUR_6 44.5580
Table 4. Glass transition and melting temperatures of our PUR foams determined by DSC (10 K·min−1).
FoamsTg (°C)Tm1 (°C)Tm2 (°C)Tdmax (°C)Residue %Td5% (°C)
PUR_1−36--3829.5282
PUR_2−5712018836717.8254
PUR_3−43137 38425.9279
PUR_4−35--37814.3271
PUR_5−34--39011.8292
PUR_6−49--38821.0291
Table 5. Characteristics of samples before and after mechanical tests.
FoamsE (MPa) at 2%Stress @plateau (MPa)Density (g/cm3) at 0%Density after Compression (g/cm3) at 0%Deformation Max (ɛmax)Masse of
Polyurethane Foams
Compression (mg)
Mass Loss after (mg)Weight Loss
after
Compression (% mg/mg)
Conservation State
PUR_010.130.130.320.4661.611.660.030.3++
PUR_020.031.380.070.0764.272.130.136.5++
PUR_030.060.060.240.2359.816.190.040.7+
PUR_040.070.070.220.2261.96.220.050.9+
PUR_050.060.060.170.1668.44.560.071.7++
PUR_060.120.060.330.3159.749.340.080.9~
Table 6. The results of the Charpy tests.
SamplesAverage Energy Percentage Consumed %Average Consumed Energy (J)Rigidity (A)
PUR_012.3880.59760
PUR_026917.2552
PUR_034.2561.06465
PUR_043.3360.83470
PUR_0529.057.2655
PUR_061.9520.48880
Table 7. Calculation of radii values of polyurethane foam cells and filler material.
SamplesDimensionsMaximumMinimumAverage Cell
PUR_1Diameter (µm2)224.9458.59138.35 ± 22
Area (µm2)60,965.216,950.0936,449.02
PUR_2Diameter (µm2)132.2832.6576.64 ± 17
Area (µm2)16,760.993918.8910,205.01
PUR_3Diameter (µm2)122.729.1557.27 ± 11
Area (µm2)32,399.061124.846764.04
PUR_4Diameter (µm2)128.2627.0163.82 ± 17
Area (µm2)19,348.271281.347241.19
PUR_5Diameter (µm2)194.0783.72137.64 ± 22
Area (µm2)72,771.5714,014.3535,205.52
PUR_6Diameter (µm2)123.1729.0172.07 ± 22
Area (µm2)21,395.453307.812,464.61
Publisher’s Note: MDPI stays neutral with regard to jurisdictional claims in published maps and institutional affiliations.

