Article

Two-Wavelength Computational Holography for Aberration-Corrected Simultaneous Optogenetic Stimulation and Inhibition of In Vitro Biological Samples

1
Laboratory of Measurement and Sensor System Technique, Faculty of Electrical and Computer Engineering, TU Dresden, Helmholtzstraße 18, 01069 Dresden, Germany
2
Competence Center for Biomedical Computational Laser Systems (BIOLAS), TU Dresden, 01069 Dresden, Germany
3
Universitäts-Augenklinik Bonn, Department of Ophthalmology, University of Bonn, Ernst-Abbe-Straße 2, D-53127 Bonn, Germany
4
Excellence Cluster Physics of Life, TU Dresden, 01307 Dresden, Germany
5
Faculty of Physics, School of Science, TU Dresden, 01069 Dresden, Germany
*
Authors to whom correspondence should be addressed.
Submission received: 14 January 2022 / Revised: 11 February 2022 / Accepted: 19 February 2022 / Published: 22 February 2022

Abstract

:
Optogenetics is a versatile toolset for the functional investigation of excitable cells such as neurons and cardiomyocytes in vivo and in vitro. While monochromatic illumination of these cells for either stimulation or inhibition already enables a wide range of studies, the combination of activation and silencing in one setup facilitates new experimental interrogation protocols. In this work, we present a setup for the simultaneous holographic stimulation and inhibition of multiple cells in vitro. The system is based on two fast ferroelectric liquid crystal spatial light modulators with frame rates of up to 1.7 kHz. Thereby, we are able to illuminate up to about 50 single spots with better than cellular resolution and without crosstalk, perfectly suited for refined network analysis schemes. System-inherent aberrations are corrected by applying an iterative optimization scheme based on Zernike polynomials. These are superposed on the same spatial light modulators that display the pattern-generating holograms, hence no further adaptive optical elements are needed for aberration correction. A near-diffraction-limited spatial resolution is achieved over the whole field of view, enabling subcellular optogenetic experiments by just choosing an appropriate microscope objective. The setup can pave the way for a multitude of optogenetic experiments, in particular with cardiomyocytes and neural networks.

1. Introduction

Since the discovery and biophysical characterization of light-sensitive microbial ion channels [1,2] and their subsequent application to neurons [3], the field of optogenetics has experienced a rapid development as an important experimental tool in the life sciences. Optogenetics describes the control of activity of cells that ectopically express these light-sensitive membrane proteins. One of the most prominent optogenes is the cation channel Channelrhodopsin-2 (ChR2) [2]. In the last years, more and more light-sensitive proteins with improved properties have been discovered to activate cells, to inhibit cells, to optically observe the activity of cells [4,5] or even to induce intended cell death [6].
In the last decade, optogenetics was also introduced to cardiology research [7]. For example, ventricular arrhythmias are associated with significantly increased morbidity and mortality, representing an increasing problem worldwide. They are treated or investigated conventionally either medicinally by application of antiarrhythmic drugs or by means of electrophysiology such as a pacemaker and defibrillator. These approaches, however, suffer from a lack of cell specificity and insufficient local (cellular) and/or temporal resolution. Here, optogenetics has introduced a paradigm shift since it allows for stimulating cells with single-cell spatial resolution and high temporal resolution. Illumination using a defined light pattern allows to study and optically control the onset, direction, speed and chirality of distortions in the propagation of excitation wavefronts in cardiac tissue like re-entry events or spiral excitation waves [8], and to terminate such arrhythmias [9,10,11]. Applying temporal light patterns at high frame rates can pave the way to optogenetic cardiac pacing and resynchronization therapies [12]. Even though many hurdles like stimulation in deep tissue still remain unsolved, cardiac optogenetics is attributed a great potential for clinical application [7].
Furthermore, optogenetics is a powerful tool to study function and neuronal circuits in the central nervous system [3]. Human in vitro model systems consisting of such neurons allow for studying functional connectivity within neuronal circuits [13], offering a huge potential for basic and biomedical research. Such experiments can pave the way to gain a deeper insight into effects like long-term potentiation (LTP) [14] or various widespread neurodegenerative diseases like Alzheimer’s disease. However, identifying the signaling pathways and functional connectivity in networks that contain several hundreds or even thousands of neurons is a challenging task. Spontaneous neural activity is always present within the entire network and a whole-field optogenetic stimulation would only increase this global activity, making the identification of distinct pathways ambiguous or almost impossible. Standard techniques like electrical stimulation and recording using multi-electrode arrays suffer from a lack of spatial control and cannot record during the applied stimulation. The key to overcoming this problem lies in single-cell excitation using a laser beam focused to cell size. Hence, the well-defined knowledge about spatial origin of the action potentials helps to reduce these ambiguities. Occurring connections and subnetwork motifs within human random neuronal networks can be identified successfully [13,15]. Other fields using optogenetic approaches are vision restoration [16], the induction of local mechanical stress in cells [17], drug screening [18], linking of behavior and neuronal circuits in animal studies [19] or the control of intracellular mRNA mobility [20].
In conclusion, the aforementioned examples show that one key to fully exploiting the immense potential of optogenetics is the application of a well-defined spatio–temporal light field. Depending on the specific optogenetic application, several demands on the optical stimulation exist. A versatile light stimulation system should exhibit the following features:
  • Single-cell resolution. Using wide-field illumination in neural networks will lead to an overall, uncoordinated increase of action-potential activity, making it almost impossible to identify single signal paths. The local stimulation of a single cell can precisely define the origin of action potentials within a network and help to reduce ambiguity.
  • 3D stimulation. The focal spots are placed arbitrarily in 3D space. In cardio-optogenetics, many experiments were performed on cardiomyocyte monolayers, i.e., 2D samples [4,7,8,9,21,22]. Similarly, investigations on neuronal networks and network connectivity are often conducted on multi-electrode arrays in 2D cultures [23,24]. The ability to place the stimulating light focus in an arbitrary and defined depth can help to conquer the third dimension and to address single cells in multi-layer cell systems [25].
  • Patterned illumination. The concurrent activation or inhibition of a well-defined group of cells opens further possibilities in experimental studies as well as optogenetic applications. In cardio-optogenetics, a dynamic, i.e., temporally changing distributed pattern can control the propagation of the excitation wavefront in cardiac tissue and induce spiral waves of defined speed, direction and chirality [8]. Regarding implantable optogenetic defibrillators ore pacemakers, an optimized pattern can help minimize the required illumination energy and hence reduce energy consumption [10].
  • Two-wavelength illumination. The ability to express activating and inhibiting opsins at the same time in one cell or cell network opens new experimental possibilities. Activating single cells or cell groups while concurrently silencing other well-defined parts in a network can help to elucidate signaling pathways in neuronal networks or to study the propagation of the excitation wavefront at hearts. For such experiments, two patterns of different wavelengths should be displayable individually and independently.
  • Fast switching times. High temporal resolution in the millisecond range is necessary or advantageous in various experiments: In neural optogenetics, it should be of the same order of magnitude as the action-potential frequencies; in cardio-optogenetics, it is desired to achieve a smooth transition between successive images when displaying spatio–temporal patterns. Furthermore, high pattern update rates are a fundamental prerequisite in experiments that employ an optoelectronic closed-loop feedback control, e.g., in cardio-optogenetics, where the trajectory of the excitation wavefront is measured, processed and used to alter the illumination pattern [7].
The way for such a stimulation platform is paved by the rapid development of electrooptic techniques and components [26]. Light sources like fluorescence lamps or single light-emitting diodes (LEDs), available in a wide spectral range and used predominantly in the early phase of optogenetics, can hardly achieve single-cell spatial resolution due to their lack of spatial coherence. Using a laser with diffraction-limited beam quality and a two-axis galvo scanner for 2D beam steering allows for fast switching rates and single-cell resolution [26], but not for simultaneous stimulation of different cells and complex pattern illumination. This can be achieved by amplitude modulators (e.g., DMD: Digital Micromirror Devices) [26,27] for direct light projection, offering a high flexibility through Mega-pixel count. As an alternative to the combination of a laser with a subsequent light modulator, arrays of organic micro LEDs (OLEDS) are currently being investigated for application in optogenetics [28]; a linear array, e.g., was used to display a moving light pattern and place light stimuli to individual abdominal segments of Drosophila melanogaster larvae [29]. In both cases, direct pattern projection and LED arrays, the projected pattern is generated at a certain layer within the depth of focus only, restricting it to two-dimensional applications mainly. Also, due to the incoherent emission of the single emitters, LED arrays cannot be used for beam shaping purposes to achieve a focal point in different depths. Another problem that arises in many optical systems is that of system- and sample-induced aberrations like chromatic [30,31,32] or geometric [33,34] aberrations. Often, these are corrected for in silico or using dedicated devices [35].
The requirements can be fulfilled entirely by holographic light projection with spatial light modulators (SLM) as the key components, which allow for direct wavefront shaping by means of computer generated holograms (CGH) [16,36,37,38], described as digitally programmed light. These devices have already proven beneficial for light shaping in a lot of complex environments, e.g., structured light transmission through multimode fibers [39,40,41,42,43]. The scientific question is whether these methods can be employed to realize an optogenetic stimulation platform that can entirely cope with the aforementioned requirements in order to advance optogenetics studies of stem-cell-derived cell cultures. Especially, we investigated the correction of system-inherent optical aberrations with the same light-field shaping device. With the availability of such a stimulation system, we are heading towards in vitro arrhythmia investigations using cardiomyocytes (heart muscle cells) and connectivity analysis in developing neural networks.

2. Experimental Setup

Our two-wavelength optogenetic illumination setup is built around two ferroelectric liquid-crystal spatial light modulators (QXGA-3DM M175 and QXGA-R9, both by Forth Dimension Displays). Both offer an active area of 2048 × 1536 pixels at a maximum frame rate of up to 1.7 kHz, which is especially important for stimulating neurons on the time scale of their activity. High frame rates also allow for the implementation of feedback-based control loops for the analysis and manipulation of fast propagating signals in neuronal networks of tightly connected cardiomyocyte cultures. Our setup consists of two similar parts whose beam paths are marked in blue and yellow in Figure 1. Both consist of a laser source (Coherent OBIS 488 nm LS FP 80 mW, 488 nm, 80 mW; MPB 2RU-VFL-P-200-589-B1R, 589 nm, 200 mW) connected to a fiber coupler FC and lenses L to ensure a more homogeneous collimated illumination of the ferroelectric spatial light modulator (SLM). Half-wave plates ( λ / 2 ) and non-polarizing 50:50 beam splitters (BS) allow for a tuning of laser light polarization to the modulator’s preferential axis. A linear polarizer (LP) ensures binary phase modulation [38]. Both beam paths are collinearly combined using a dichroic mirror (DM); the combined beam path is marked in green in Figure 1. The collinearly superposed beams are directed onto the sample (S), which is placed in a microscope (stylized here by the microscope objective (MO) and the microscope tube lens (TL)) using two mirrors (M) to align the controlled illumination with the microscope beam path. A further lens (L), from here on called Fourier lens, between the microscope and polarizer makes this into a setup requiring computer-generated Fourier holograms. The focal length of this last lens is chosen so that the short axis of the SLMs is demagnified to match the back aperture of the microscope objective, overfilling it. A camera (C) allows for the observation of created light patterns or sample fluorescence. The maximal field of view for illumination in this configuration is determined by the microscope objective and the modulator specifications:
X m a x = f λ 2 d · f f o u r i e r f t u b e .
Without loss of generality, X m a x is the maximum deviation of a focus from the center on the sample plane with respect to one modulator axis, f is the focal length of the microscope objective, λ the laser wavelength, d the pixel pitch of the SLM and f f o u r i e r and f t u b e the focal lengths of the Fourier and tube lenses, respectively. In the case of f f o u r i e r = f t u b e and f = 45   mm (4x Objective, Olympus), the maximum field of view in the case of binary phase modulation is (1.34 × 1.34) mm2, in range of the active area of modern multielectrode arrays (MEAs). The SLMs are rotated slightly so that a beam deflected to X m a x / 2 passes along the optical axis of the setup.
Using this relation, binary Fourier holograms for a point P x y ' = ( P x ' P y ' ) on the sample plane in the coordinates of the optical axis of the system are calculated by first calculating the coordinates on a scaled grid according to Equations (2) and (3).
P x = P x ' N x d f t u b e f λ f f o u r i e r + N x 2 ,
P y = P y ' N y d f t u b e f λ f f o u r i e r + N y 2 .
For the easier calculation in numerical programs like MATLAB, the point P x y is calculated in a pixel grid the same size as the SLM with ( N x x N y ). For illumination patterns on the sample plane consisting of multiple points, these are just added. The hologram displayed on the SLM is then calculated by Fourier-transforming the scaled point pattern. Holograms of sparse patterns are binarized using thresholding, more complex holograms are calculated using a Gerchberg–Saxton algorithm with binary phase constraint in the SLM plane. A schematic of the physical hologram reconstruction as the inverse of the calculation process is depicted in Figure 2.

3. Estimation of Minimum Achievable Spot Size

Since the setup uses Fourier holograms, the achievable resolution is mainly determined by the numerical aperture N A   of the microscope objective used. For a Gaussian beam, the theoretical limitations can be derived from the beam parameter product as the lateral spatial resolution Δ x of the laser beam defined by the e 2 width of a Gaussian beam and the axial resolution Δ z as the full width at half maximum (FWHM) along the optical axis of the beam. Assuming a Gaussian beam with a 3 σ radius r 3 σ of
r 3 σ = f · N A
being focused by a lens with the numerical aperture N A and focal length f to not apodize the Gaussian profile too severely, the minimum achievable spatial resolution is then
Δ x G a u s s = M 2 λ N A
Δ z G a u s s =   3 2 M 2 λ N A 2
with the beam quality parameter M 2 . Due to the overfilling of the microscope objective, the resulting shape of the focus in the sample plane is an Airy disc whose diameter is usually defined by the first minimum of the distribution,
Δ x A i r y = 1.22 λ N A
For comparison with the Gaussian distribution, the e 2 -width of the central lobe of an Airy disc equals
Δ x A i r y , e 2 = 0.82 λ N A .
Since laser beams in general are characterized by their D 4 σ -width, we simulated the Airy patterns resulting from the diffraction of lenses with different numerical apertures. We find that the general relation for the diameter of Airy discs is
Δ x A i r y , D 4 σ = 1.14 λ N A
and thus almost equal to the minimum beam diameter according to (7). Using Equations (9) and (5) and the relation M 2 = w 0 , r e a l w 0 , t h e o r y , we can calculate the expected minimum M 2 achievable in our setup to be
  M 2 m i n = 1.14 λ / N A λ / N A = 1.14
Therefore, we can conclude the following theoretical resolution of our setup of Δ x A i r y , D 4 σ = 5.6 µm and Δ z A i r y = 55.6 µm for the blue laser and Δ x A i r y , D 4 σ = 6.7 µm and Δ z A i r y = 67.1 µm for the yellow laser, respectively.

4. Spatial Pattern Formation and Correction of System Aberrations

The light power of the system in the sample plane was measured to be 280 µW for the blue beam path and 680 µW for the yellow beam path. The field of view and spatial resolution of the setup were determined by scanning a single focus in the sample plane by displaying sets of phase gratings on the SLMs. Foci in the sample plane were magnified onto a camera using a telescope with a measured magnification of 3.95. The camera was mounted on a manual translation stage to allow axial scanning. Beam parameters were determined according to ISO 11146 using the D 4 σ beam widths of the intensity distributions on the camera and a fit of a hyperbolic function to the resulting data. System aberrations were corrected by iteratively optimizing a predefined set of Zernike polynomials (ZP). The ZP are displayed on the same ferroelectric SLMs that are used to generate the light patterns. The radius r of the polynomials was normalized to the diagonal r m a x = 2048 · 1563 2 · 8.2 µm of the SLMs. The amplitudes at r = r m a x   were normalized to 1 before multiplication by a scanning factor times π to minimize the mean e 2 beam area of all foci, defined by the number of pixels with values bigger than e 2 times the maximum pixel value per focus. ZP were tested in ANSI order from index 3 (oblique astigmatism) to index 25, determining the scan factor which minimizes the area covered by the focus for each polynomial. Before testing the next ZP, the result of the previous test was added as a phase mask to the SLM to compensate this specific aberration. The process of testing each ZP was executed twice to overcome possible cross-talk between the individual ZP. Figure 3d shows an example of this optimization process from the center of the FOV for the blue beam path. Blue bars represent the amplitude of the respective Zernike polynomial, and the orange line shows the drop in focus size by applying the respective polynomial to the overall aberration correction. It is obvious that lower order polynomials like astigmatism dominate the overall system aberrations. Correcting these, a near diffraction-limited e 2 width can be achieved, assuming a perfect Airy disc according to Equation (8). The shown optimization result does reach the diffraction limit assuming a Gaussian beam according to Equation (5). Figure 3a,b demonstrates the result of aberration correction over the whole field of view. Both plots show focus diameters along the major axes of the individual potentially astigmatic beams as ellipses centered at the position of a generated focus in the field of view. Red circles indicate the diffraction limit according to Equation (5). The relative amplitudes with respect to the maximum in the observed field of view are encoded in color. In Figure 3a, one can observe almost diffraction-limited focus sizes in some areas. Over most of the FOV, however, beam waists are much larger with no clear tendency where these deviations occur. After correction, as demonstrated in Figure 3b, foci over the whole field of view are significantly smaller, with deviations occurring mostly along the edges of the FOV, which might be the result of some remaining field curvature. Figure 3c summarizes these findings as box plots. With aberration correction, focus diameters are pushed toward the diffraction limit, and the standard deviation and outliers are greatly reduced. We calculated the mean values of focus diameters for the edges of the FOV as well as for the central 9 foci. In comparison, foci on the edges are 23% larger, which also results in a larger extent in axial direction.
Similar analyses have been performed for the 589 nm beam path, as depicted in Figure 3e,f. The respective results are summarized in Table 1. Whilst aberration correction boosted the overall performance of the blue beam path over the whole field of view, for the yellow beam path, an optimization in just one major axis can be observed at a slight loss of resolution in the other major axis. Here, foci size at the edge of the FOV increases by an average of 14% compared to the center.
From these measurements, we can estimate that the maximum power density of a single focus will be in the order of 6 Wmm−2 for the blue and 11 Wmm−2 for the yellow beam path, roughly 3 orders of magnitude more than usual power densities for optogenetics experiments.

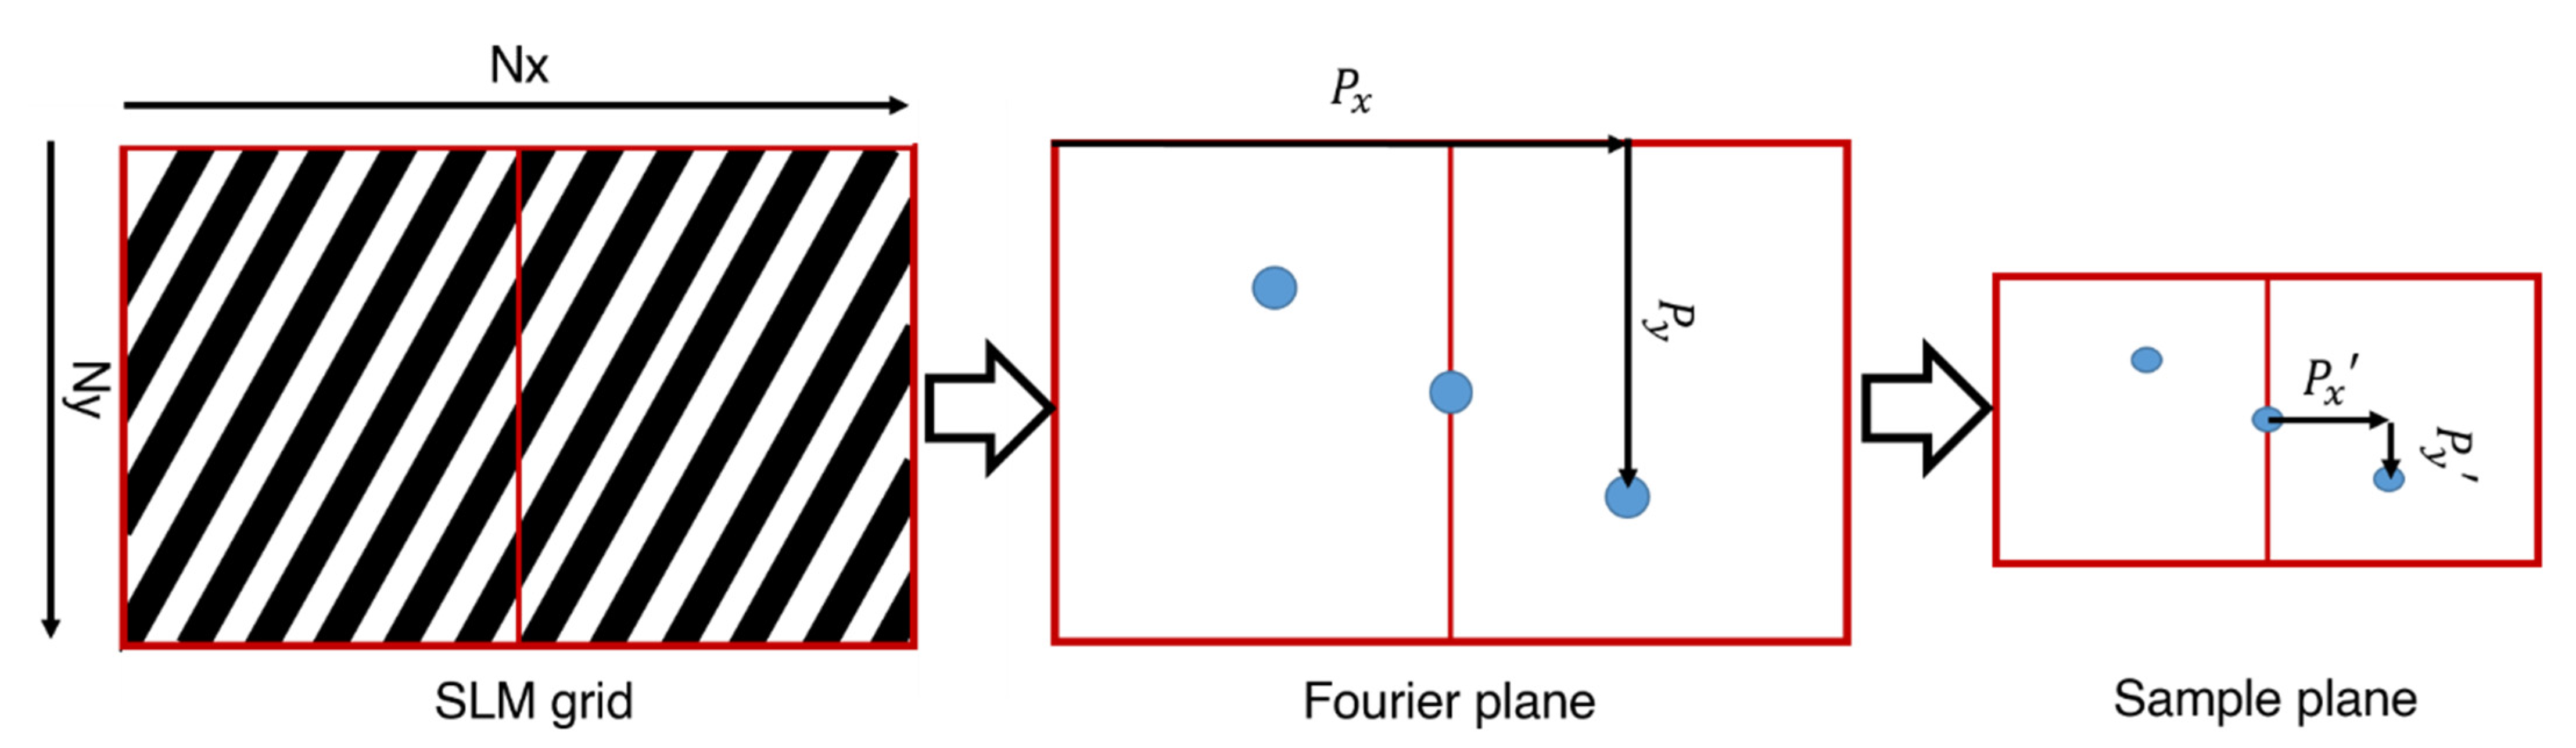
5. Generation of Multiple Spots across the Field of View

One major advantage of the presented setup is the capability of potentially activating several cells simultaneously at different freely selectable locations on a given sample. To test the capabilities of the setup, we used both beam paths to generate 1 to 100 foci at random positions in the field of view. For these measurements, the laser power was kept constant and camera acquisition times were adjusted to fully use the dynamic range. Again, we measured the D 4 σ beam widths and extracted the average gray value on the camera for each focus in a radius smaller than D 4 σ . Assuming a linear response of the camera, we normalized the resulting mean gray values to the acquisition time to get a measure for the mean intensity per focus. Theoretically, for n generated foci, the overall laser energy should split evenly, resulting in a n 1 decay of the mean intensity. As can be seen in Figure 4 on the left in a double-logarithmic plot, both beam paths are able to generate foci almost according to theory with a n 1.03 behavior up to a wavelength-dependent threshold of n = 20 for the yellow beam path and n = 60 for the blue beam path, after which mean intensities drop more quickly, resulting in a decrease in signal-to-noise ratio.
Figure 4 (right) shows the increasing diameters for an increasing number of generated foci. The increase from 1 to 100 foci is much higher for the yellow laser at 19.4% than for the blue laser at 3.8%. While no clear connection can be made from increasing focus size to the wavelength-dependent SNR drop, one can conclude that, for higher wavelengths, the setup projects higher spatial frequencies with lower fidelity than for lower wavelengths.

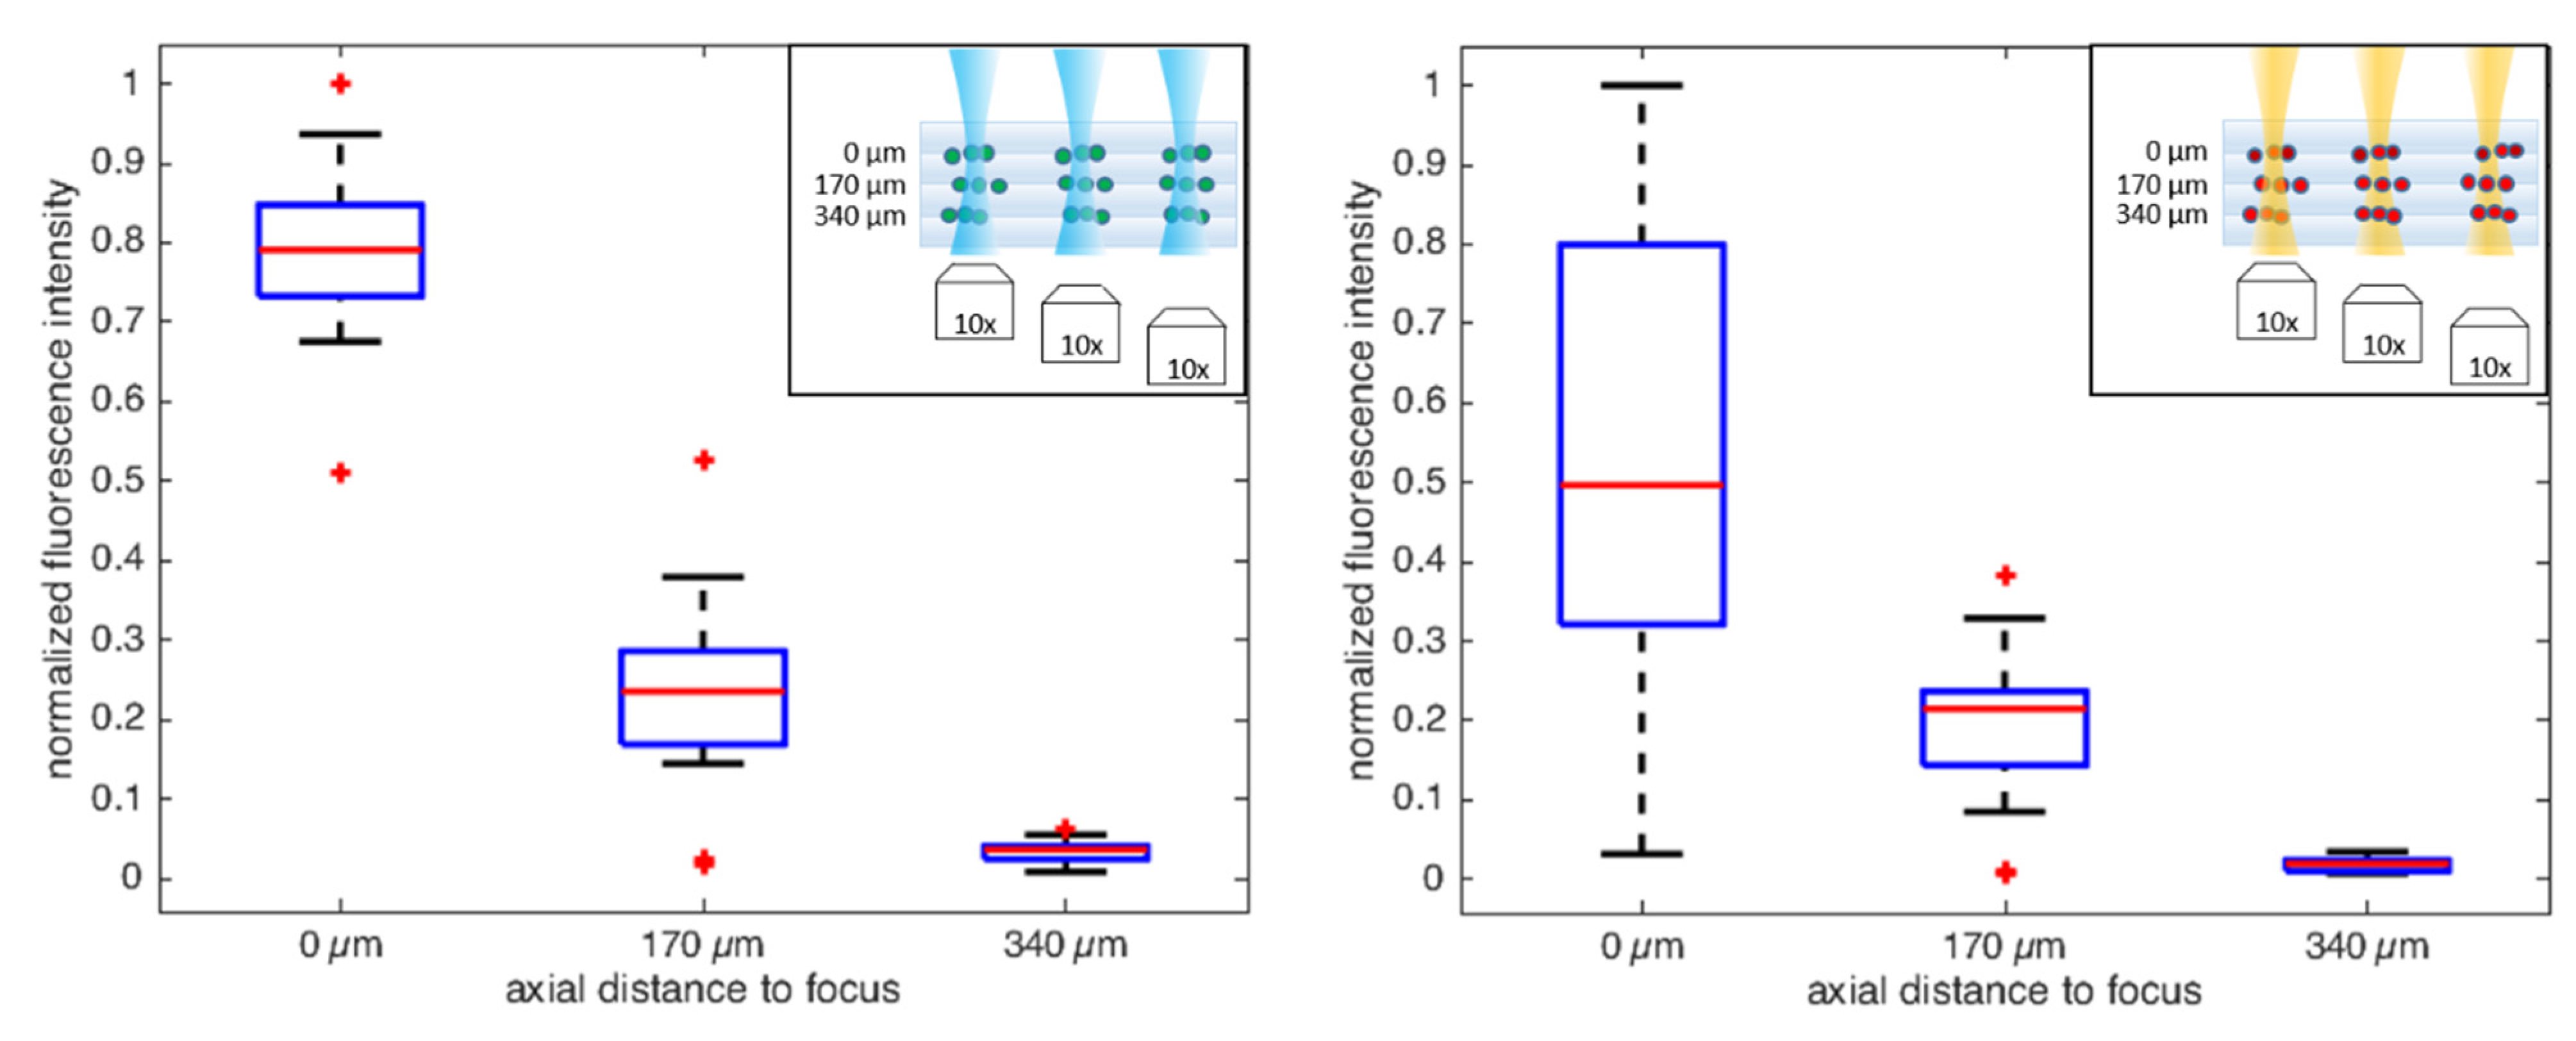
6. Excitation of Single/Multiple Fluorescent Beads in 2D/3D

To estimate the resolution of the setup in a more realistic environment, we used fluorescent beads of different color to mimic single cells in future optogenetic in vivo experiments. We used polystyrene particles (refractive index 1.59) by Spherotec with the dyes “Nile Red” (maximum absorption at 505 nm, maximum emission at 555 nm, 5.0–7.9 µm) and “Purple” (maximum absorption at 595 nm, maximum emission at 615 nm, 2.5–4.5 µm) in aqueous solution and placed 0.5 µL per layer between the microscope cover slides with a thickness of 170 µm. For multi-layer measurements, we stacked multiple slides. The layers with beads were observed in transmission using an inverted Microscope (Nikon Ti Eclipse) with 10× magnification and an additional telescope for demagnifying the resulting beam to fit a camera (IDS UI-3042SE-M). Fluorescence intensities were calculated by fitting Gaussian functions to fluorescent particle recordings, using the mean intensity of all camera pixels for distances smaller than two times the fitted standard deviation. Since laser power and illumination time were adjusted to use the full dynamic range of the camera, we normalized to both, followed by a normalization to the maximum observed value in each measurement.
We tested the capability of the setup to excite several beads in one layer simultaneously, as depicted in Figure 5 for the blue laser, by illuminating 5 to 50 fluorescent beads, adjusting the laser power to fully use the dynamic range of our camera. As can be seen in panels (a) and (b), there is only negligible cross-talk between the illuminated beads and neighboring particles, which shows that our setup at 4x magnification is capable of exciting single particles. As panel (c) shows, most of the illuminated particles, shown in red superimposed on the wide-field image of all particles within the field of view shown in blue, are closely packed with other particles. The halos around the particles can be attributed to the emitted fluorescent light being scattered by surrounding unilluminated particles and the high refractive index difference of the particles compared to water. As described in the previous section, by illuminating a number m of fluorescent beads with a holographical illumination setup, the available light energy should split evenly between the fluorescent beads, resulting in a m 1 behavior of the fluorescent light emitted by each particle. Normalizing for the used laser power, panel (d) shows the measured fluorescence intensity over the number m of illuminated particles as a double-logarithmic plot for both Nile Red and Purple beads. Linear fits reveal a m 1.37 and m 1.24 dependency for 488 nm and 589 nm illumination, respectively. The much higher standard deviations of the measured intensities for the 589 nm illumination are the result of each focus illuminating several neighboring particles simultaneously, since the diameters of the purple beads are on average only half as big as the diffraction limit.
Differences in fluorescence intensity between different layers were assessed by focusing the illumination beams for one particle in the upper layer and by observing the fluorescence intensity by axially shifting the detection optics in the microscope, as depicted in the insets in Figure 6. Fluorescence intensities were measured for 20 locations per layer with up to 4 particles being illuminated by the diverging beam in the lower layers. As can be seen in Figure 6, fluorescence intensities decay quickly for the considered distances. Fitting the normalized Lorentz function
I n o r m = 1 1 + ( z z 0 z R ) 2 + C
with the location of the beam waist z 0 , the Rayleigh length z R , the axial position z and some offset C to the median values of the resulting distributions results in Rayleigh lengths z R , 488 = 108 µm and z R , 589 = 122 µm for the blue and yellow laser, respectively, which is about twice as much as expected from theoretical estimation using Equation (6) and a refractive index of 1.53 for the microscope slides used to create the three-dimensional sample. Considering the error-prone fit of the Lorentz function to just 3 values, these results are in good agreement with the expected axial resolution of the system.

7. Conclusions

The technique presented in this paper allows for the simultaneous holographic shaping of light of different wavelengths for advanced optogenetic experiments. In the presented configuration, experiments using simultaneous stimulation by ChR2 (Channelrhodopsin 2) [2] or ChRimson [44] and inhibition by eNpHR [45], Jaws [46] or BiPOLES [47] are possible. Compared to micro-LED- or OLED-based approaches, a high lateral spatial resolution with high intensities can easily be reached by the flexible use of laser light. Other than DMD or generalized phase contrast methods, system aberrations can be controlled with the same spatial light modulator. We have shown that, using an iterative optimization scheme, the lateral spatial resolution can be pushed to less than 1.3 times the diffraction limit. However, a compromise between spatial resolution and available field of view has to be made. Diffraction-limited performance of the system is essential when sub-cellular resolution is required, for example, for probing responses to the stimulation of individual processes of single neurons. Splitting the laser beams to up to 100 individual foci using computer-generated holograms and illuminating up to 50 fluorescent beads with sizes below that of single cells, we have shown that the optical system is capable of illuminating multiple individual cells at once with high contrast, where the addressing of 20 to about 50 individual cells appears feasible. It can be expected that, using common liquid crystal on silicon SLMs, higher diffraction efficiencies and therefore higher contrast and more simultaneous foci can be achieved, the binary phase modulators used in this paper, however, offer much higher temporal resolution, and therefore higher flexibility in the temporal design of experiments. Testing on fluorescent beads, we have shown that the axial resolution with a 4 × 0.1 NA microscope objective is only suited for addressing individual cells in well-engineered low-density three-dimensional samples with about 300 µm distance between axially collinearly located cells, as can be expected for single-photon holographic illumination approaches. Under these restrictions, foci can be freely placed in a sample in three dimensions. Here, multi-photon stimulation systems [19,26] have a clear advantage. For future experiments, the setup can be adapted to employ femtosecond light sources for two-photon stimulation experiments. In conclusion, the setup presented is a dedicated computational adaptive instrument, addressing, in particular, in vitro experiments for neural network analysis or arrhythmia control of cardiomyocytes, where highly flexible optogenetic stimulation and inhibition are crucial.

Author Contributions

F.S.: experimental setup. T.H.: conduction of experiments. F.S. and T.H.: data evaluation. F.S. and L.B.: writing of manuscript. V.B. and J.W.C.: manuscript revision and supervision. All authors have read and agreed to the published version of the manuscript.

Funding

Funding by the German Research Foundation (Deutsche Forschungsgemeinschaft (DFG), grants CZ 55/39-1 and BU 2974/4-1) is greatly acknowledged.

Institutional Review Board Statement

Not applicable.

Informed Consent Statement

Not applicable.

Data Availability Statement

Data supporting the findings of this study are available from the corresponding author upon reasonable request.

Acknowledgments

The authors thank Olaf Bergmann and Wouter Derks from the Center for Regenerative Therapies (CRTD), TU Dresden, and Rouhollah Habibey from Universitäts-Augenklinik Bonn, University of Bonn, for valuable discussions.

Conflicts of Interest

The authors declare no conflict of interest.

References

  1. Nagel, G.; Ollig, D.; Fuhrmann, M.; Kateriya, S.; Musti, A.M.; Bamberg, E.; Hegemann, P. Channelrhodopsin-1: A Light-Gated Proton Channel in Green Algae. Science 2002, 296, 2395–2398. [Google Scholar] [CrossRef] [PubMed]
  2. Nagel, G.; Szellas, T.; Huhn, W.; Kateriya, S.; Adeishvili, N.; Berthold, P.; Ollig, D.; Hegemann, P.; Bamberg, E. Channelrhodopsin-2, a directly light-gated cation-selective membrane channel. Proc. Natl. Acad. Sci. USA 2003, 100, 13940–13945. [Google Scholar] [CrossRef] [Green Version]
  3. Boyden, E.S.; Zhang, F.; Bamberg, E.; Nagel, G.; Deisseroth, K. Millisecond-timescale, genetically targeted optical control of neural activity. Nat. Neurosci. 2005, 8, 1263–1268. [Google Scholar] [CrossRef] [PubMed]
  4. Hayakawa, T.; Kunihiro, T.; Ando, T.; Kobayashi, S.; Matsui, E.; Yada, H.; Kanda, Y.; Kurokawa, J.; Furukawa, T. Image-based evaluation of contraction–relaxation kinetics of human-induced pluripotent stem cell-derived cardiomyocytes: Correlation and complementarity with extracellular electrophysiology. J. Mol. Cell. Cardiol. 2014, 77, 178–191. [Google Scholar] [CrossRef] [PubMed] [Green Version]
  5. O’Shea, C.; Holmes, A.P.; Winter, J.; Correia, J.; Ou, X.; Dong, R.; He, S.; Kirchhof, P.; Fabritz, L.; Rajpoot, K.; et al. Cardiac Optogenetics and Optical Mapping—Overcoming Spectral Congestion in All-Optical Cardiac Electrophysiology. Front. Physiol. 2019, 10, 182. [Google Scholar] [CrossRef] [PubMed] [Green Version]
  6. Buckley, C.; Carvalho, M.T.; Young, L.; Rider, S.A.; McFadden, C.; Berlage, C.; Verdon, R.F.; Taylor, J.M.; Girkin, J.M.; Mullins, J.J. Precise spatio-temporal control of rapid optogenetic cell ablation with mem-KillerRed in Zebrafish. Sci. Rep. 2017, 7, 5096. [Google Scholar] [CrossRef] [PubMed] [Green Version]
  7. Entcheva, E.; Kay, M.W. Cardiac optogenetics: A decade of enlightenment. Nat. Rev. Cardiol. 2021, 18, 349–367. [Google Scholar] [CrossRef]
  8. Burton, R.A.B.; Klimas, A.; Ambrosi, C.M.; Tomek, J.; Corbett, A.; Entcheva, E.; Bub, G. Optical control of excitation waves in cardiac tissue. Nat. Photonics 2015, 9, 813–816. [Google Scholar] [CrossRef]
  9. Bingen, B.O.; Engels, M.C.; Schalij, M.J.; Jangsangthong, W.; Neshati, Z.; Feola, I.; Ypey, D.L.; Askar, S.F.; Panfilov, A.; Pijnappels, D.A.; et al. Light-induced termination of spiral wave arrhythmias by optogenetic engineering of atrial cardiomyocytes. Cardiovasc. Res. 2014, 104, 194–205. [Google Scholar] [CrossRef] [Green Version]
  10. Crocini, C.; Ferrantini, C.; Coppini, R.; Scardigli, M.; Yan, P.; Loew, L.M.; Smith, G.; Cerbai, E.; Poggesi, C.; Pavone, F.S.; et al. Optogenetics design of mechanistically-based stimulation patterns for cardiac defibrillation. Sci. Rep. 2016, 6, 35628. [Google Scholar] [CrossRef]
  11. Nyns, E.C.; Kip, A.; Bart, C.I.; Plomp, J.J.; Zeppenfeld, K.; Schalij, M.J.; de Vries, A.A.; Pijnappels, D.A. Optogenetic termination of ventricular arrhythmias in the whole heart: Towards biological cardiac rhythm management. Eur. Hear. J. 2016, 38, 2132–2136. [Google Scholar] [CrossRef] [PubMed] [Green Version]
  12. Nussinovitch, U.; Gepstein, L. Optogenetics for in vivo cardiac pacing and resynchronization therapies. Nat. Biotechnol. 2015, 33, 750–754. [Google Scholar] [CrossRef] [PubMed]
  13. Schmieder, F.; Habibey, R.; Busskamp, V.; Büttner, L.; Czarske, J.W. Analysis of human iPSC-derived neuronal networks (hiPSCNN) using holographic single cell and full field optogenetic stimulation. In Biophotonics Congress 2021; Paper BM1B.4; Optical Society of America: Washington DC, USA, 2021. [Google Scholar]
  14. Nabavi, S.; Fox, R.; Proulx, C.D.; Lin, J.; Tsien, R.Y.; Malinow, R. Engineering a memory with LTD and LTP. Nature 2014, 511, 348–352. [Google Scholar] [CrossRef]
  15. Schmieder, F.; Habibey, R.; Busskamp, V.; Büttner, L.; Czarske, J.W. Investigation of in vitro human iPSC-derived neuronal networks using holographic stimulation (Conference Presentation). In Optogenetics and Optical Manipulation; Proc. SPIE 11227, 112270D; SPIE: Bellingham, WA, USA, 2020. [Google Scholar]
  16. Reutsky-Gefen, I.; Golan, L.; Farah, N.; Schejter, A.; Tsur, L.; Brosh, I.; Shoham, S. Holographic optogenetic stimulation of patterned neuronal activity for vision restoration. Nat. Commun. 2013, 4, 1509. [Google Scholar] [CrossRef] [PubMed] [Green Version]
  17. Sui, L.; Dahmann, C. Increased lateral tension is sufficient for epithelial folding in Drosophila. Development 2020, 147, 194316. [Google Scholar] [CrossRef] [PubMed]
  18. Osaki, T.; Uzel SG, M.; Kamm, R.D. Microphysiological 3D model of amyotrophic lateral sclerosis (ALS) from human iPS-derived muscle cells and optogenetic motor neurons. Sci. Adv. 2018, 4, eaat5847. [Google Scholar] [CrossRef] [Green Version]
  19. Maschio, M.D.; Donovan, J.C.; Helmbrecht, T.O.; Baier, H. Linking Neurons to Network Function and Behavior by Two-Photon Holographic Optogenetics and Volumetric Imaging. Neuron 2017, 94, 774–789.e5. [Google Scholar] [CrossRef]
  20. Kim, N.Y.; Lee, S.; Yu, J.; Kim, N.; Won, S.S.; Park, H.; Heo, W.D. Optogenetic control of mRNA localization and translation in live cells. Nat. Cell Biol. 2020, 22, 341–352. [Google Scholar] [CrossRef]
  21. Majumder, R.; Feola, I.; Teplenin, A.S.; Vries, A.A.F.D.; Panfilov, A.V.; A Pijnappels, D. Optogenetics enables real-time spatiotemporal control over spiral wave dynamics in an excitable cardiac system. eLife 2018, 7, 41076. [Google Scholar] [CrossRef]
  22. McNamara, H.M.; Dodson, S.; Huang, Y.-L.; Miller, E.W.; Sandstede, B.; Cohen, A.E. Geometry-Dependent Arrhythmias in Electrically Excitable Tissues. Cell Syst. 2018, 7, 359–370.e6. [Google Scholar] [CrossRef] [Green Version]
  23. Klapper, S.D.; Sauter, E.J.; Swiersy, A.; Hyman, M.A.E.; Bamann, C.; Bamberg, E.; Busskamp, V. On-demand optogenetic activation of human stem-cell-derived neurons. Sci. Rep. 2017, 7, 14450. [Google Scholar] [CrossRef] [PubMed] [Green Version]
  24. Kim, J.H.; Ryu, J.R.; Lee, B.; Chae, U.; Son, J.W.; Park, B.H.; Cho, I.-J.; Sun, W. Interpreting the Entire Connectivity of Individual Neurons in Micropatterned Neural Culture With an Integrated Connectome Analyzer of a Neuronal Network (iCANN). Front. Neuroanat. 2021, 15, 746057. [Google Scholar] [CrossRef] [PubMed]
  25. Pelkonen, A.; Pistono, C.; Klecki, P.; Gómez-Budia, M.; Dougalis, A.; Konttinen, H.; Stanová, I.; Fagerlund, I.; Leinonen, V.; Korhonen, P.; et al. Functional Characterization of Human Pluripotent Stem Cell-Derived Models of the Brain with Microelectrode Arrays. Cells 2021, 11, 106. [Google Scholar] [CrossRef] [PubMed]
  26. Papagiakoumou, E. Optical developments for optogenetics. Biol. Cell 2013, 105, 443–464. [Google Scholar] [CrossRef] [PubMed]
  27. Zhu, P.; Fajardo, O.; Shum, J.; Schärer, Y.-P.Z.; Friedrich, R.W. High-resolution optical control of spatiotemporal neuronal activity patterns in zebrafish using a digital micromirror device. Nat. Protoc. 2012, 7, 1410–1425. [Google Scholar] [CrossRef]
  28. Ciccone, G.; Meloni, I.; Lahore, R.G.F.; Vierock, J.; Reineke, S.; Kleemann, H.; Hegemann, P.; Leo, K.; Murawski, C. Tailoring Organic LEDs for Bidirectional Optogenetic Control via Dual-Color Switching. Adv. Funct. Mater. 2021, 2110590, 2110590. [Google Scholar] [CrossRef]
  29. Murawski, C.; Pulver, S.R.; Gather, M.C. Segment-specific optogenetic stimulation in Drosophila melanogaster with linear arrays of organic light-emitting diodes. Nat. Commun. 2020, 11, 1–11. [Google Scholar] [CrossRef]
  30. Ferraro, P.; Grilli, S.; Miccio, L.; Alfieri, D.; De Nicola, S.; Finizio, A.; Javidi, B. Full Color 3-D Imaging by Digital Holography and Removal of Chromatic Aberrations. J. Disp. Technol. 2008, 4, 97–100. [Google Scholar] [CrossRef]
  31. Ibrahim, D. Simultaneous dual-wavelength digital holographic microscopy with compensation of chromatic aberration for accurate surface characterization. Appl. Opt. 2019, 58, 6388–6395. [Google Scholar] [CrossRef]
  32. Khodadad, D.; Bergström, P.; Hällstig, E.; Sjödahl, M. Fast and robust automatic calibration for single-shot dual-wavelength digital holography based on speckle displacements. Appl. Opt. 2015, 54, 5003–5010. [Google Scholar] [CrossRef]
  33. A Matkivsky, V.; A Moiseev, A.; Gelikonov, G.V.; Shabanov, D.V.; A Shilyagin, P.; Gelikonov, V.M. Correction of aberrations in digital holography using the phase gradient autofocus technique. Laser Phys. Lett. 2016, 13, 35601. [Google Scholar] [CrossRef]
  34. Kontenis, G.; Gailevičius, D.; Jonušauskas, L.; Jonušauskas, L.; Purlys, V. Dynamic aberration correction via spatial light modulator (SLM) for femtosecond direct laser writing: Towards spherical voxels. Opt. Express 2020, 28, 27850–27864. [Google Scholar] [CrossRef] [PubMed]
  35. Radner, H.; Büttner, L.; Czarske, J. Interferometric velocity measurements through a fluctuating phase boundary using two Fresnel guide stars. Opt. Lett. 2015, 40, 3766–3769. [Google Scholar] [CrossRef] [PubMed]
  36. Yoon, J.; Lee, M.; Lee, K.; Kim, N.; Kim, J.M.; Park, J.; Yu, H.; Choi, C.; Heo, W.D.; Park, Y. Optogenetic control of cell signaling pathway through scattering skull using wavefront shaping. Sci. Rep. 2015, 5, 13289. [Google Scholar] [CrossRef] [Green Version]
  37. Vellekoop, I.M. Feedback-based wavefront shaping. Opt. Express 2015, 23, 12189–12206. [Google Scholar] [CrossRef]
  38. Schmieder, F.; Klapper, S.D.; Koukourakis, N.; Busskamp, V.; Czarske, J.W. Optogenetic Stimulation of Human Neural Networks Using Fast Ferroelectric Spatial Light Modulator—Based Holographic Illumination. Appl. Sci. 2018, 8, 1180. [Google Scholar] [CrossRef] [Green Version]
  39. Rothe, S.; Radner, H.; Koukourakis, N.; Czarske, J.W. Transmission Matrix Measurement of Multimode Optical Fibers by Mode-Selective Excitation Using One Spatial Light Modulator. Appl. Sci. 2019, 9, 195. [Google Scholar] [CrossRef] [Green Version]
  40. Haufe, D.; Koukourakis, N.; Büttner, L.; Czarske, J.W. Transmission of Multiple Signals through an Optical Fiber Using Wavefront Shaping. J. Vis. Exp. 2017, 55407. [Google Scholar] [CrossRef]
  41. Schmieder, F.; Czarske, J.; Büttner, L. Adaptive laser-induced ultrasound generation using a micro-mirror array spatial light modulator. Opt. Express 2016, 24, 22536. [Google Scholar] [CrossRef]
  42. Buettner, L.; Thümmler, M.; Czarske, J. Velocity measurements with structured light transmitted through a multimode optical fiber using digital optical phase conjugation. Opt. Express 2020, 28, 8064–8075. [Google Scholar] [CrossRef]
  43. Kuschmierz, R.; Scharf, E.; Ortegón-González, D.F.; Glosemeyer, T.; Czarske, J.W. Ultra-thin 3D lensless fiber endoscopy using diffractive optical elements and deep neural networks. Light. Adv. Manuf. 2021, 2, 1–10. [Google Scholar] [CrossRef]
  44. Urmann, D.; Lorenz, C.; Linker, S.M.; Braun, M.; Wachtveitl, J.; Bamann, C. Photochemical Properties of the Red-shifted Channelrhodopsin Chrimson. Photochem. Photobiol. 2017, 93, 782–795. [Google Scholar] [CrossRef] [PubMed]
  45. Gradinaru, V.; Thompson, K.R.; Deisseroth, K. eNpHR: A Natronomonas halorhodopsin enhanced for optogenetic applications. Brain Cell Biol. 2008, 36, 129–139. [Google Scholar] [CrossRef] [Green Version]
  46. Chuong, A.S.; Miri, M.L.; Busskamp, V.; Matthews, G.A.C.; Acker, L.C.; Sorensen, A.; Young, A.; Klapoetke, N.; Henninger, M.A.; Kodandaramaiah, S.; et al. Noninvasive optical inhibition with a red-shifted microbial rhodopsin. Nat. Neurosci. 2014, 17, 1123–1129. [Google Scholar] [CrossRef] [PubMed] [Green Version]
  47. Vierock, J.; Rodriguez-Rozada, S.; Dieter, A.; Pieper, F.; Sims, R.; Tenedini, F.; Bergs, A.C.F.; Bendifallah, I.; Zhou, F.; Zeitzschel, N.; et al. BiPOLES is an optogenetic tool developed for bidirectional dual-color control of neurons. Nat. Commun. 2021, 12, 1–20. [Google Scholar] [CrossRef] [PubMed]
Figure 1. Schematic of the two-wavelength holographic optogenetic illumination platform. It consists of two similar holographic light projection paths marked in blue and yellow, one with a wavelength tuned to activating opsins (488 nm) and one for inhibiting opsins (589 nm). Each path consists of a solid-state laser source, beam-conditioning lenses and a fast ferroelectric spatial light modulator for wavefront shaping, pattern generation and temporal modulation. The shaped beams of the two paths are collinearly superposed by a dichroic mirror (beam path marked green), coupled into an inverted microscope and directed onto the cell sample. For further explanations, see text. FC—fiber coupler, λ / 2 —half-wave plate, L—lens, BS—non-polarizing beam splitter, SLM—ferroelectric liquid-crystal spatial light modulator, DM—dichroic mirror, LP—linear polarizer, M—mirror, TL—tube lens, MO—microscope objective, S—sample, C—camera.
Applsci 12 02283 g001
Figure 2. Schematic of the reconstruction of Fourier holograms. The hologram on the SLM is Fourier-transformed with the Fourier lens and then scaled onto the sample using the tube and objective lenses. The calculation of the hologram for the illumination of a point P x y ' in the sample plane is executed by first scaling this to the Fourier plane using Equations (2) and (3) followed by a Fourier transform.
Applsci 12 02283 g002
Figure 3. Single focus features over the field of view. Top row: 488 nm beam path D 4 σ focus diameters along the major axes of measured astigmatic beams according to ISO 11146. (a) before correction of system aberrations. (b) after aberration correction. Red circles indicate the theoretical diffraction limit of Gaussian beams (see Equation (6)). Color encodes relative brightness. Focus sizes are not to scale. (c) 488 nm foci summarized as boxplots. Beam diameters normalized to diffraction limit of a Gaussian beam before and after correction of system aberrations. (d) example of the contribution of individual Zernike polynomials to the optimization of system aberrations of the 488 nm beam in the center of the field of view. Dashed line marks the 1/e2 diffraction limit of an Airy disc (see Equation (8)). (e) 589 nm foci summarized as boxplots. Beam diameters normalized to diffraction limit of a Gaussian beam before and after correction of system aberrations. (f) 589 nm D 4 σ focus diameters along the major axes after aberration correction.
Applsci 12 02283 g003
Figure 4. Left: Distribution of average focus intensity normalized to camera acquisition time over number of generated foci as a log–log plot. Data are further normalized to the maximum at n = 1. A wavelength-dependent drop in SNR is visible for both colors starting at around n = 20 for 589 nm and n = 60 for 488 nm, which might be attributed to the differences in spatial frequencies necessary for displaying foci in a fixed field of view. Right: Increase of the mean focus diameter over the number of foci.
Applsci 12 02283 g004
Figure 5. Excitation of fluorescent beads placed as a monolayer on a microscope slide. (a,b) 5 and 50 simultaneously illuminated beads, respectively. There is negligible crosstalk between stimulated and unstimulated particles Colors inverted for better visibility. (c) Wide-field illumination of the sample showing densely packed beads in blue. Locations of illuminated beads are superposed in red. (d) Normalized mean intensity of the excited fluorescent beads over the number of simultaneously illuminated particles. Measurements for the blue laser are marked as blue squares, measurements for the yellow laser are marked as yellow crosses. Error bars show the standard deviations. Linear fits to the logarithmic data are shown as solid lines.
Applsci 12 02283 g005
Figure 6. Intensity distribution of fluorescent particles over depth in a three-layer sample. Left: Nile Red particles illuminated with 488 nm. Right: Purple particles illuminated with 589 nm. Insets show the mode of measurement: The focus of the illuminating beam is always on the first layer, while the observation assesses fluorescent particle intensities in different layers.
Applsci 12 02283 g006
Table 1. Beam waist diameters before and after aberration correction, normalized to the diffraction limit according to Equation (5).
488 nm589 nm
Before optimizationx 1.7 ± 0.4 1.2 ± 0.1
y 1.6 ± 0.3 1.2 ± 0.2
After optimizationx 1.3 ± 0.2 1.3 ± 0.2
y 1.3 ± 0.1 1.01 ± 0.08
Publisher’s Note: MDPI stays neutral with regard to jurisdictional claims in published maps and institutional affiliations.

