
An Improved Gated Recurrent Unit Neural Network for State-of-Charge Estimation of Lithium-Ion Battery


College of Mechanical and Electrical Engineering, Wenzhou University, Wenzhou 325035, China
*
Author to whom correspondence should be addressed.
Appl. Sci. 2022, 12(5), 2305; https://0-doi-org.brum.beds.ac.uk/10.3390/app12052305
Submission received: 14 January 2022
/
Revised: 17 February 2022
/
Accepted: 19 February 2022
/
Published: 22 February 2022
(This article belongs to the Special Issue Intelligent Renewable Energy System: A Focus on Hydrogen Fuel Cells and Battery Storage with AI)
Abstract
:State-of-charge (SOC) estimation of lithium-ion battery is a key parameter of the battery management system (BMS). However, SOC cannot be obtained directly. In order to predict SOC accurately, we proposed a recurrent neural network called gated recurrent unit network that is based on genetic algorithm (GA-GRU) in this paper. GA was introduced to optimize the key parameters of the model, which can improve the performance of the proposed network. Furthermore, batteries were tested under four dynamic driving conditions at five temperatures to establish training and testing datasets. Finally, the proposed method was validated on dynamic driving conditions and compared with other deep learning methods. The results show that the proposed method can achieve high accuracy and robustness.
1. Introduction
Environmental problems caused by fuel vehicles has become an inevitable issue [1]. However, this issue has stimulated the rapid development of new energy vehicle technology. As a typical representative of new energy vehicles, electric vehicles can effectively reduce exhaust emissions. Lithium batteries can provide power for electric vehicles and have the following advantages: small size, high energy density, and long service life [2,3]. In electric vehicles, battery management system (BMS) plays an important role in ensuring the safety of the vehicle and monitoring the status of the battery. As a key parameter in the BMS, accurate state of charge (SOC) can avoid the overcharge and over-discharge of batteries and can prolong the life of battery [4]. However, it is a challenge to measure SOC directly, and it can only be estimated through the observable parameters of a battery, such as battery voltage, current, and temperature [5].
At present, scholars have carried out considerable research on SOC estimation. In addition, the methods for SOC estimation can be divided into three categories: direct, model-based, and data-driven approaches [6,7,8]. The direct methods commonly used are Coulomb counting method [9] and open circuit voltage method [10]. The Coulomb counting method integrates current with time to obtain the current SOC. However, errors will accumulate with time and the accuracy of current depends on the sensor. The open circuit voltage method obtains SOC through the corresponding relationship between open circuit voltage (OCV) and SOC. Nevertheless, the battery must be rest for a long time period to achieve accurate open circuit voltage. All in all, both methods are simple and easy to implement, but they all have low precision. Moreover, the model-based methods have been proposed for SOC estimation. The battery models mainly include equivalent circuit model (ECM) [11] and electrochemical model [12], and the former is mostly used. The battery models are usually used combined in conjunction with control theory algorithms, such as Kalman filter (KF, EKF, UKF) [13,14,15], particle filter (PF) [16], and adaptive observers [17]. These filtering algorithms can update the SOC on the basis of the state-space equations of the model and the covariance matrix. However, this requires a lot of expertise, and the accuracy of SOC estimation is highly dependent on the model. In order to for shortcomings of traditional and model-based methods to be overcome, data-driven methods are applied to estimate SOC.
Data-based methods can address the strong nonlinear and time-varying issues of SOC estimation that can accurately map the observable parameters of batteries to SOC. Wu et al. [18] proposed a back-propagation neural network (BP) for SOC estimation. In [19], a support vector machine (SVM) was set up to extract model parameters for SOC, obtaining a high level of accuracy. Due to the rapid development of computer hardware, such as graphics processing unit (GPU), deep learning methods are widely used for SOC estimation. Shen et al. [20] proposed a deep convolutional neural network (DCNN) to achieve good estimation results. In consideration of the excellent performance of long short-term memory neural network (LSTM) in time series data, the LSTM-RNN has been introduced to perform SOC estimation [21]. However, due to the complex structure of LSTM, a new recurrent neural network called gated recurrent unit neural network (GRU) was applied for SOC estimation [22]. In [23], a hybrid neural network called convolution gated recurrent unit network (CNN-GRU) was proposed for SOC estimation.
The methods mentioned above all need to manually set network parameters. In order for the optimal network parameters for improving network performance to be automatically found, the genetic algorithm (GA) was proposed. In this paper, GA was used to optimize the parameters of gated recurrent unit network (GRU). Moreover, the optimized parameters included the number of GRU layers and the fully connected layers (FCL), as well as the number of neurons of the corresponding layer. The rest of this paper is organized as follows. The proposed SOC estimation method is introduced in Section 2. Then, Section 3 establishes the experimental bench for acquiring the dataset. Next, validation of the proposed model and analysis of results are carried out in Section 4. Finally, Section 5 contains the conclusions.
2. Method for SOC Estimation
2.1. Gated Recurrent Unit Neural Network
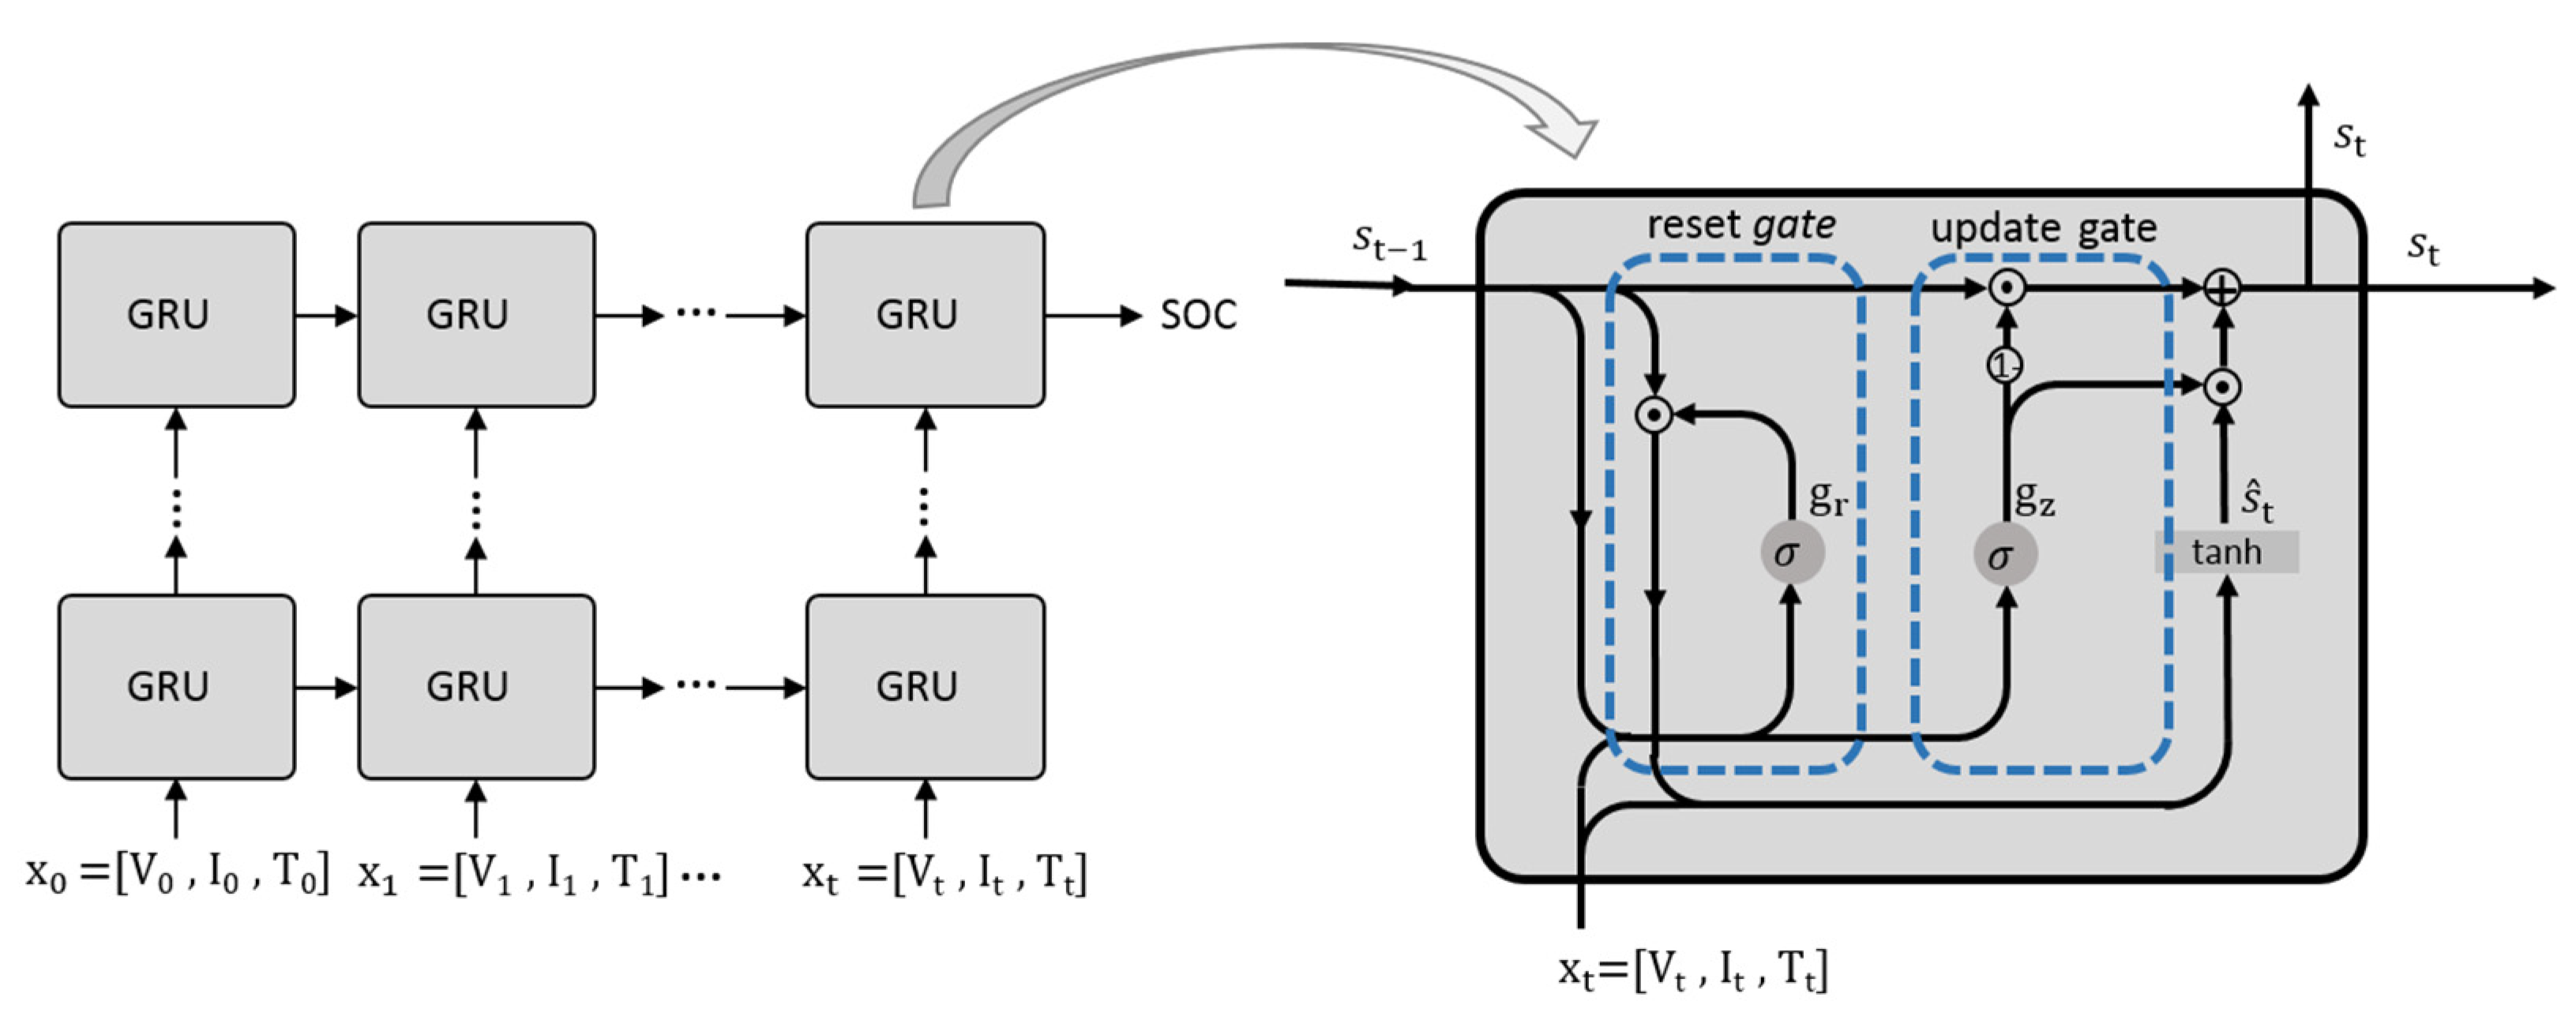
Like long short-term memory neural network (LSTM) [24], GRU is also a variant of recurrent neural network (RNN) [25,26], which is mainly proposed to solve problems such as long-term memory and gradients in backpropagation. However, compared to LSTM, GRU has a simpler structure due to one less gate. As shown in Figure 1, it is obvious that GRU has only two gates: a reset gate and an update gate, which makes the model less parameterized, less computationally expensive, and faster to train. The role of the reset gate is to control the retention of historical information. The larger the value of the reset gate, the less historical information is ignored. The update gate is used to control the effect of the previous cell state and the current new input on the current new cell state. The mathematical calculation process of GRU is as follows:
where are the reset gate, the update gate, the candidate cell state, and the current new cell state, respectively; is the input; is the weight; is the ; is the sigmoid function shown in Equation (5); and is the tanh function shown in Equation (6).
The GRU architecture performed well in processing long time series data, and can share the same parameters at different time steps. The battery data, such as battery voltage, current, and temperature, are all one-dimensional time series data. It is reasonable to use GRU to estimate SOC [27]. In this paper, the dataset was fed into the GRU network for training, wherein the input vector of the GRU was and the output value of the GRU was .
2.2. Genetic Optimization Algorithm
Genetic algorithm (GA) is a computational model of the biological evolution process that simulates the natural selection and genetic mechanism of Darwin’s theory of biological evolution. It is a method to search for optimal solutions by simulating the natural evolution process [28]. GA does not require functions to be derivable and continuous, and it adopts a probabilistic optimization method. The five elements of parameter coding, initial population setting, fitness function design, genetic operation design, and control parameter setting constitute the core content of genetic algorithm.
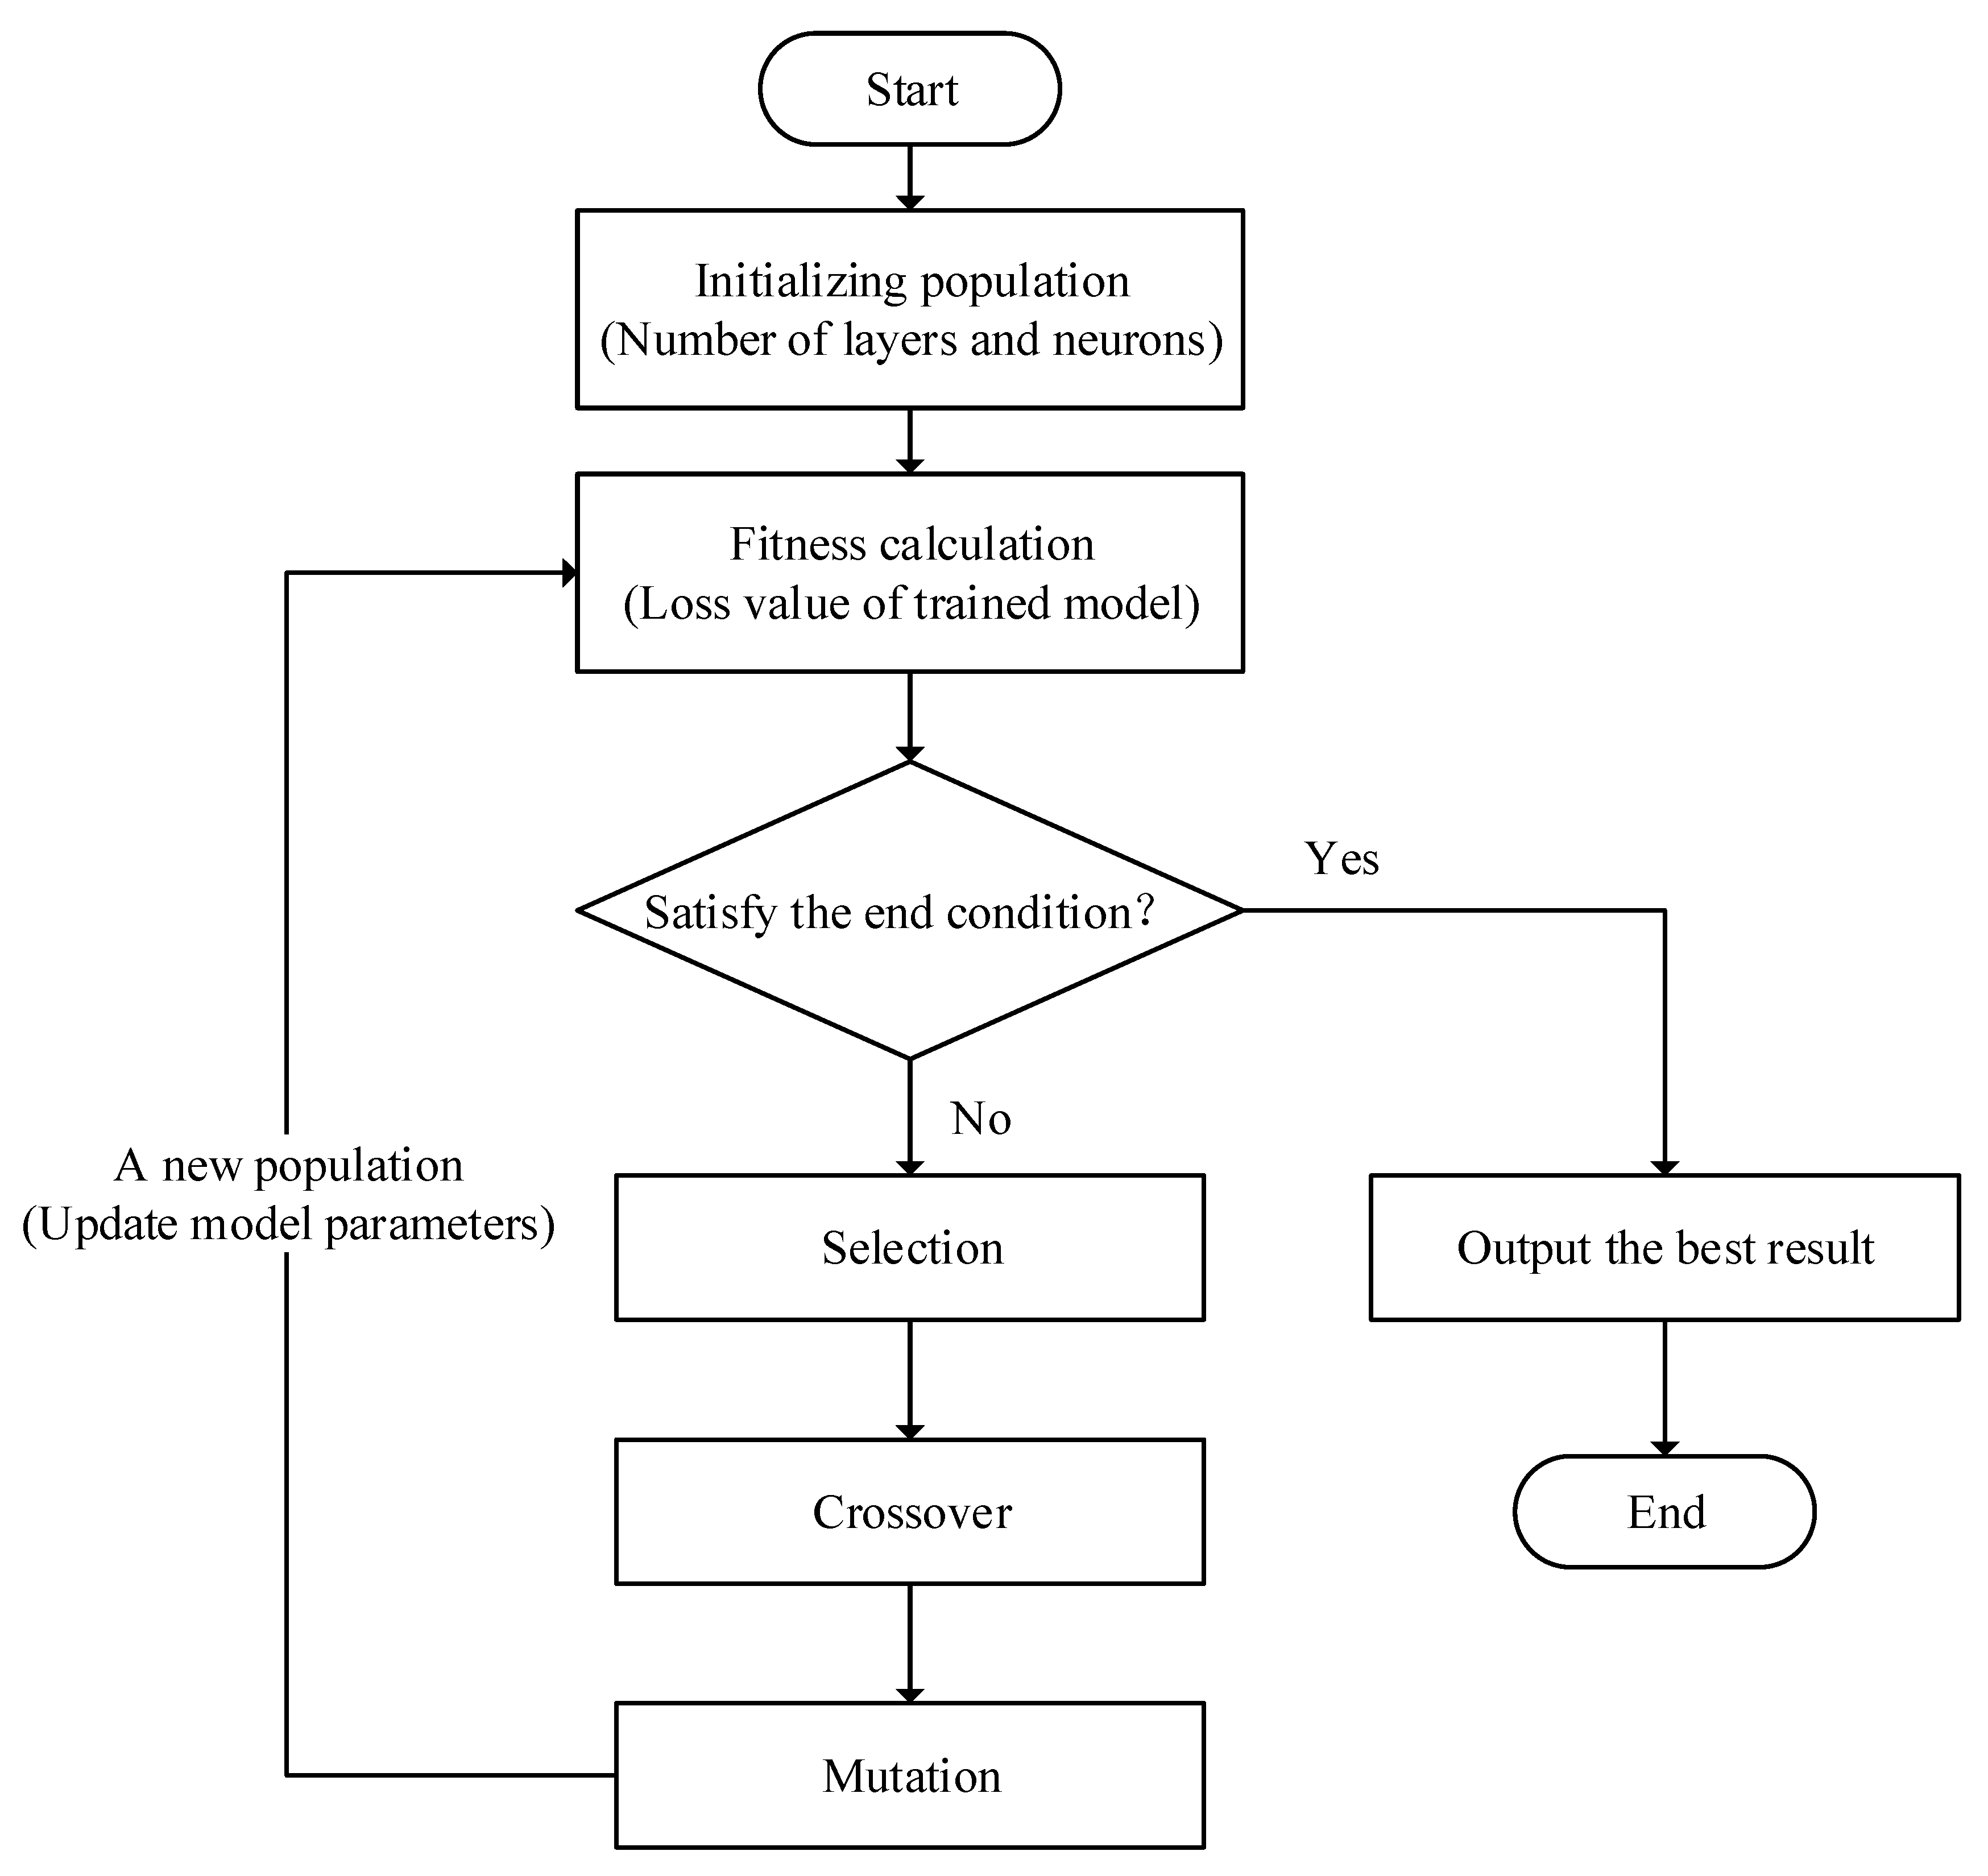
The flow chart of genetic algorithm is shown in Figure 2. Moreover, the genetic algorithm is generally implemented according to the following steps: (1) Randomly generating population. (2) Calculating the fitness of individuals and judging whether the fitness of the individuals conforms to the optimization criterion. If satisfied, the best individual and its optimal solution are output, and it is ended. Otherwise, one goes to the next step. (3) Selecting the individuals with high fitness and eliminating the individuals with low fitness. (4) Crossing the chromosomes of the selected individuals according to a certain method. (5) Mutating the chromosomes of the individuals to generate the next generation. (6) Repeating the above steps until the end condition is met. In this paper, the genetic algorithm is used to optimize the hyperparameters of GRU model.
2.3. GA-GRU for SOC Estimation
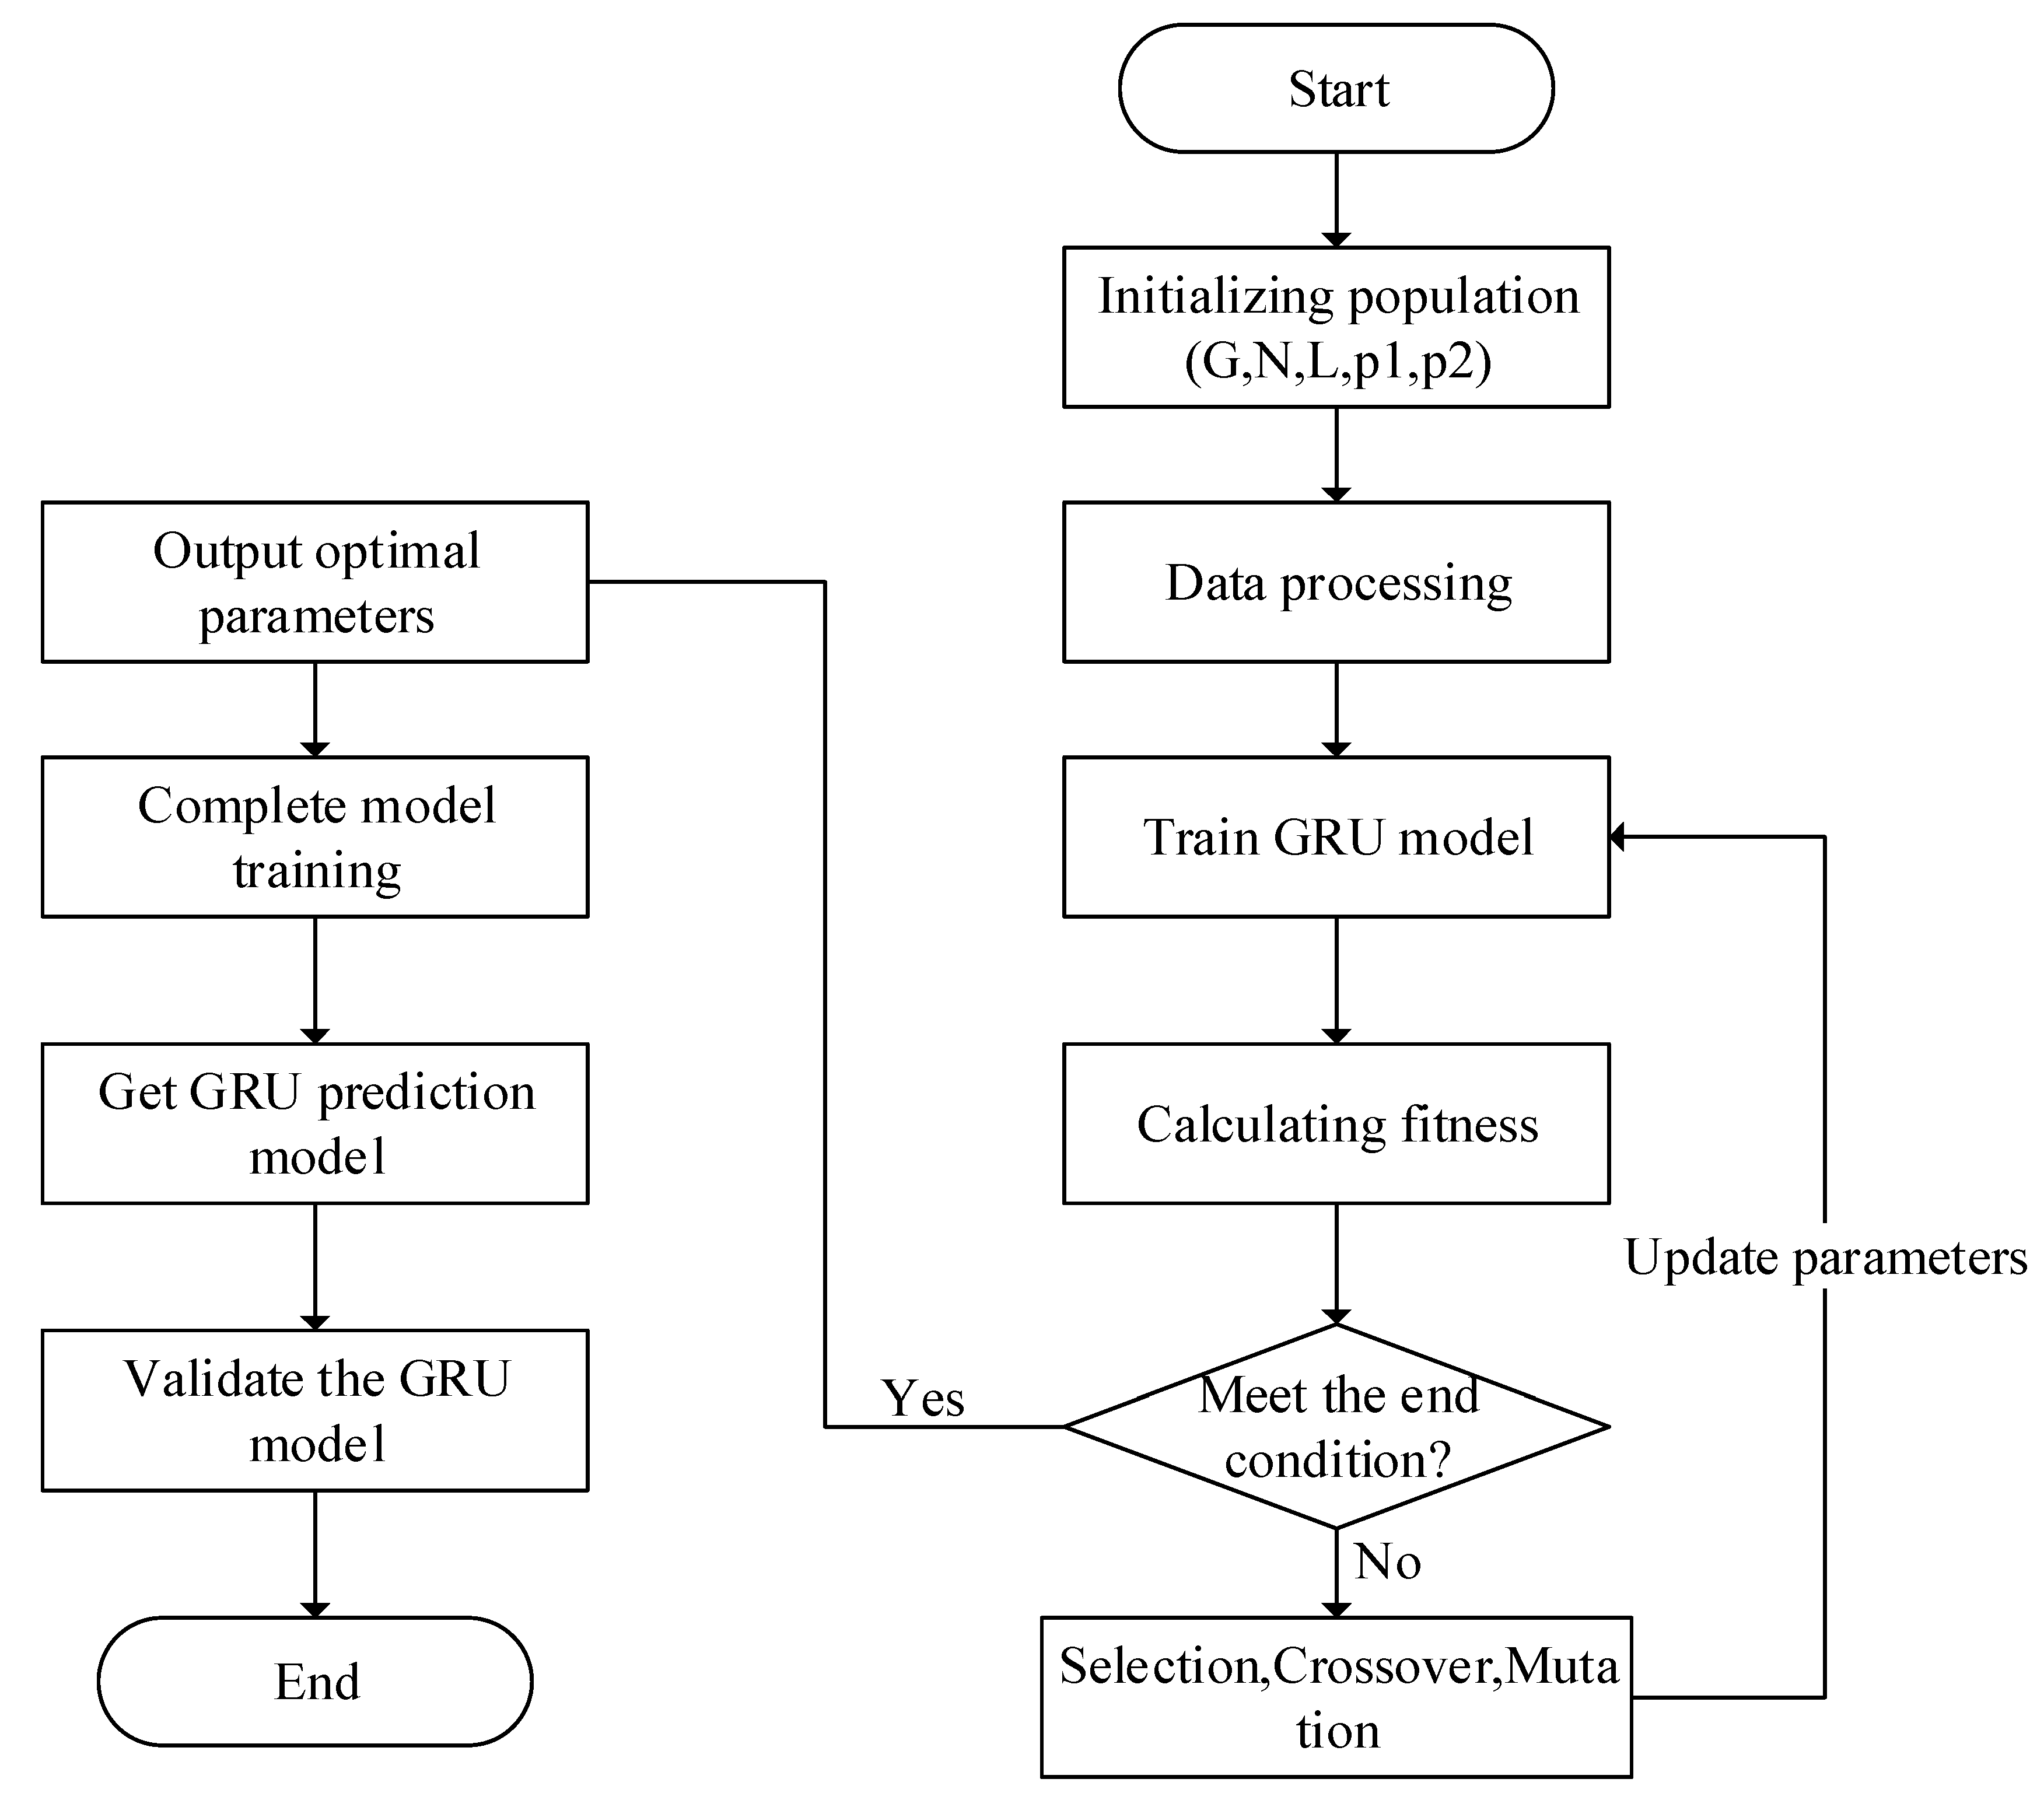
The gated recurrent unit neural network optimized by genetic algorithm (GA-GRU) is proposed to estimate battery SOC. GRU network has been widely used in many fields for its excellent long-term sequence processing capability. At the same time, it can also solve gradient problems, such as gradient explosion or disappearance. However, it is a challenge to determine suitable network parameters for GRU. In order to improve the network performance, we introduced the genetic algorithm to find the optimal parameters of GRU. The implementation process of GA-GRU is shown in Figure 3. Moreover, the specific steps of GA-GRU are as follows:
- (1)
- Initializing parameters. The number of generations (G) is set to 40. The population size (N) is set to 20. The coding length of each chromosome (L) is set to 8. The crossover probability (p1) is set to 0.5. The mutation probability (p2) is set to 0.01.
- (2)
- Data processing. The specific process about data processing is conducted in Section 3.2.
- (3)
- Training GRU model and calculating fitness. The mean square error (MSE) is chosen as the loss function of GRU model, and it is also the fitness function of genetic algorithm. The mean square error (MSE) is defined as follows:
- (4)
- Judging whether the end conditions are met. If satisfied, outputting the optimal result and end. Otherwise, going to the step (3).
- (5)
- Building GRU model with the optimal parameters from GA.
- (6)
- Validating the GA-GRU model on the test dataset.
The GA algorithm in this paper was used to optimize the number of GRU layers and its neurons, as well as the number of fully connected layers (FCL) and its neurons. In addition, the number of GRU layers and FCL layers were randomly selected from the range 1 to 3, and their neurons were randomly selected from the range 32 to 256. The optimized parameters of GA-GRU model are shown in Table 1.
3. Experiments and Data Processing
3.1. Battery Testing Platform
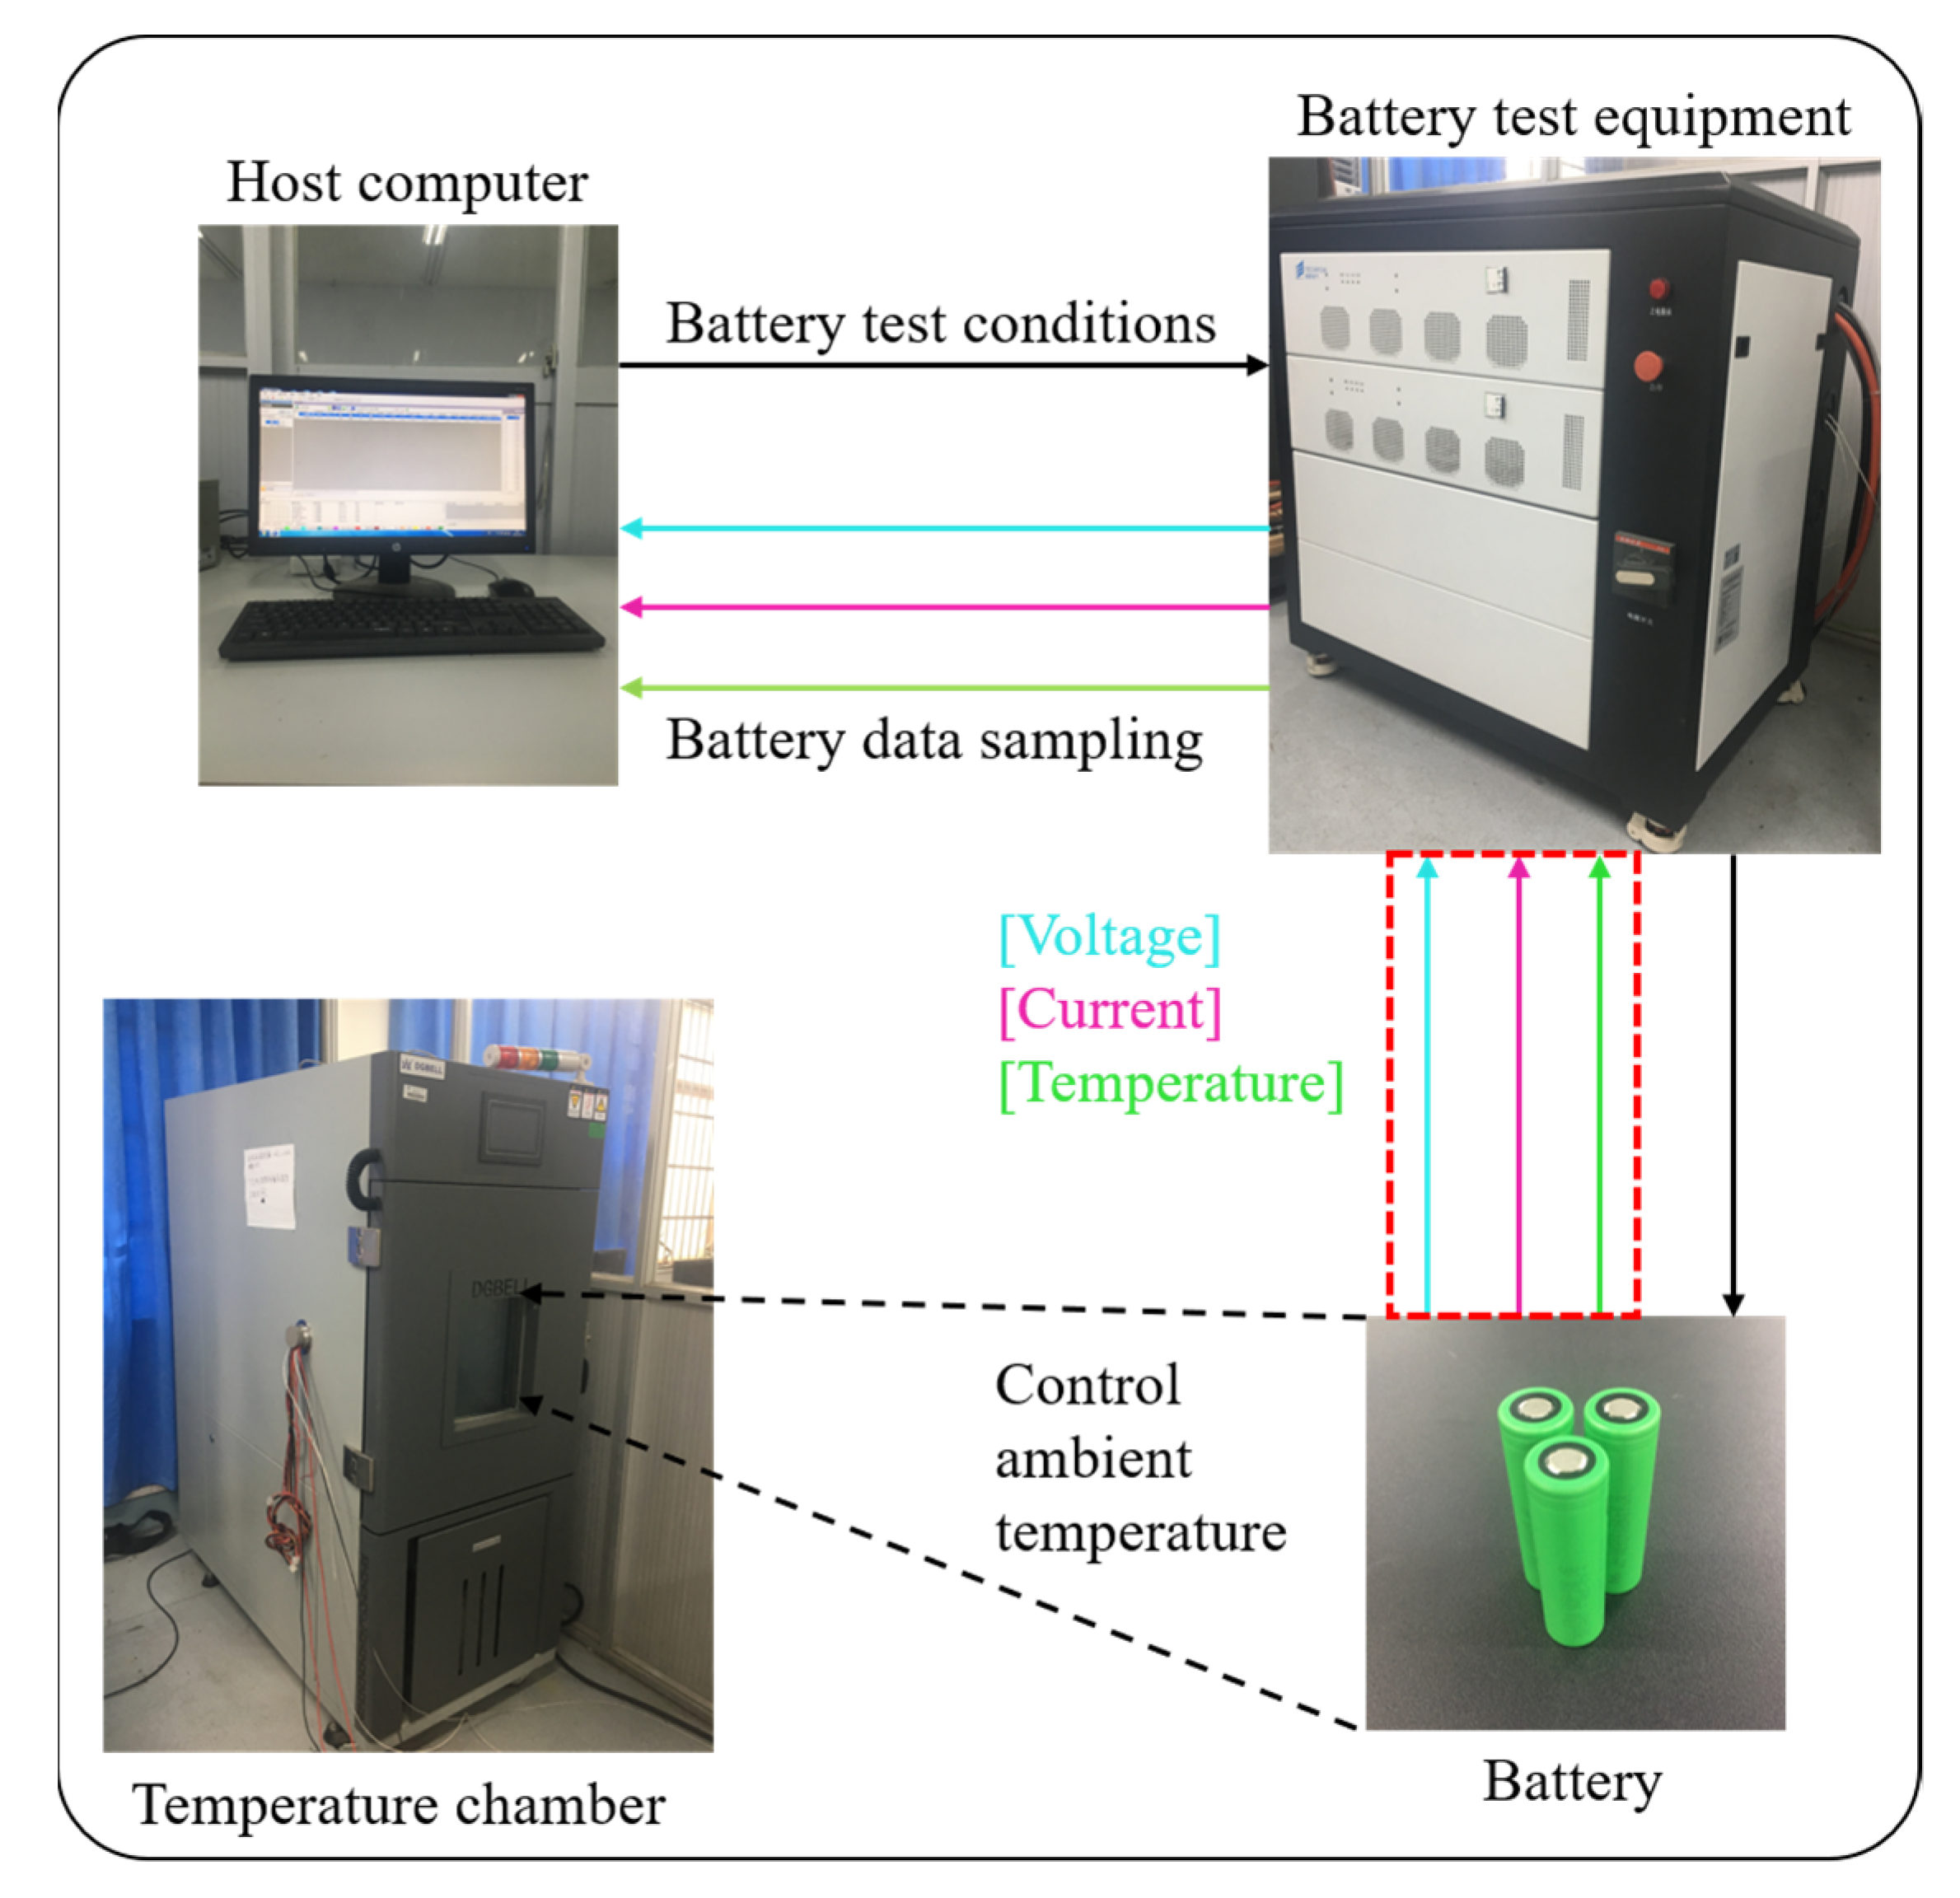
The test object of this work is a SONY lithium-ion battery called US18650VTC5. Its nominal capacity and nominal voltage are 2.5 Ah and 3.6 V, respectively. In order to create a dataset to validate the proposed algorithm, we established a battery testing platform as shown in Figure 4. It mainly consists of four parts: a host computer, battery test equipment, a temperature chamber, and batteries. The host computer is used to control the battery test equipment and collect the battery data. The battery test equipment is responsible for charging or discharging batteries under different conditions and sending battery data to the host computer. The temperature chamber is utilized to control the ambient temperature for batteries. The hardware configurations of the battery testing platform are shown in Table 2.
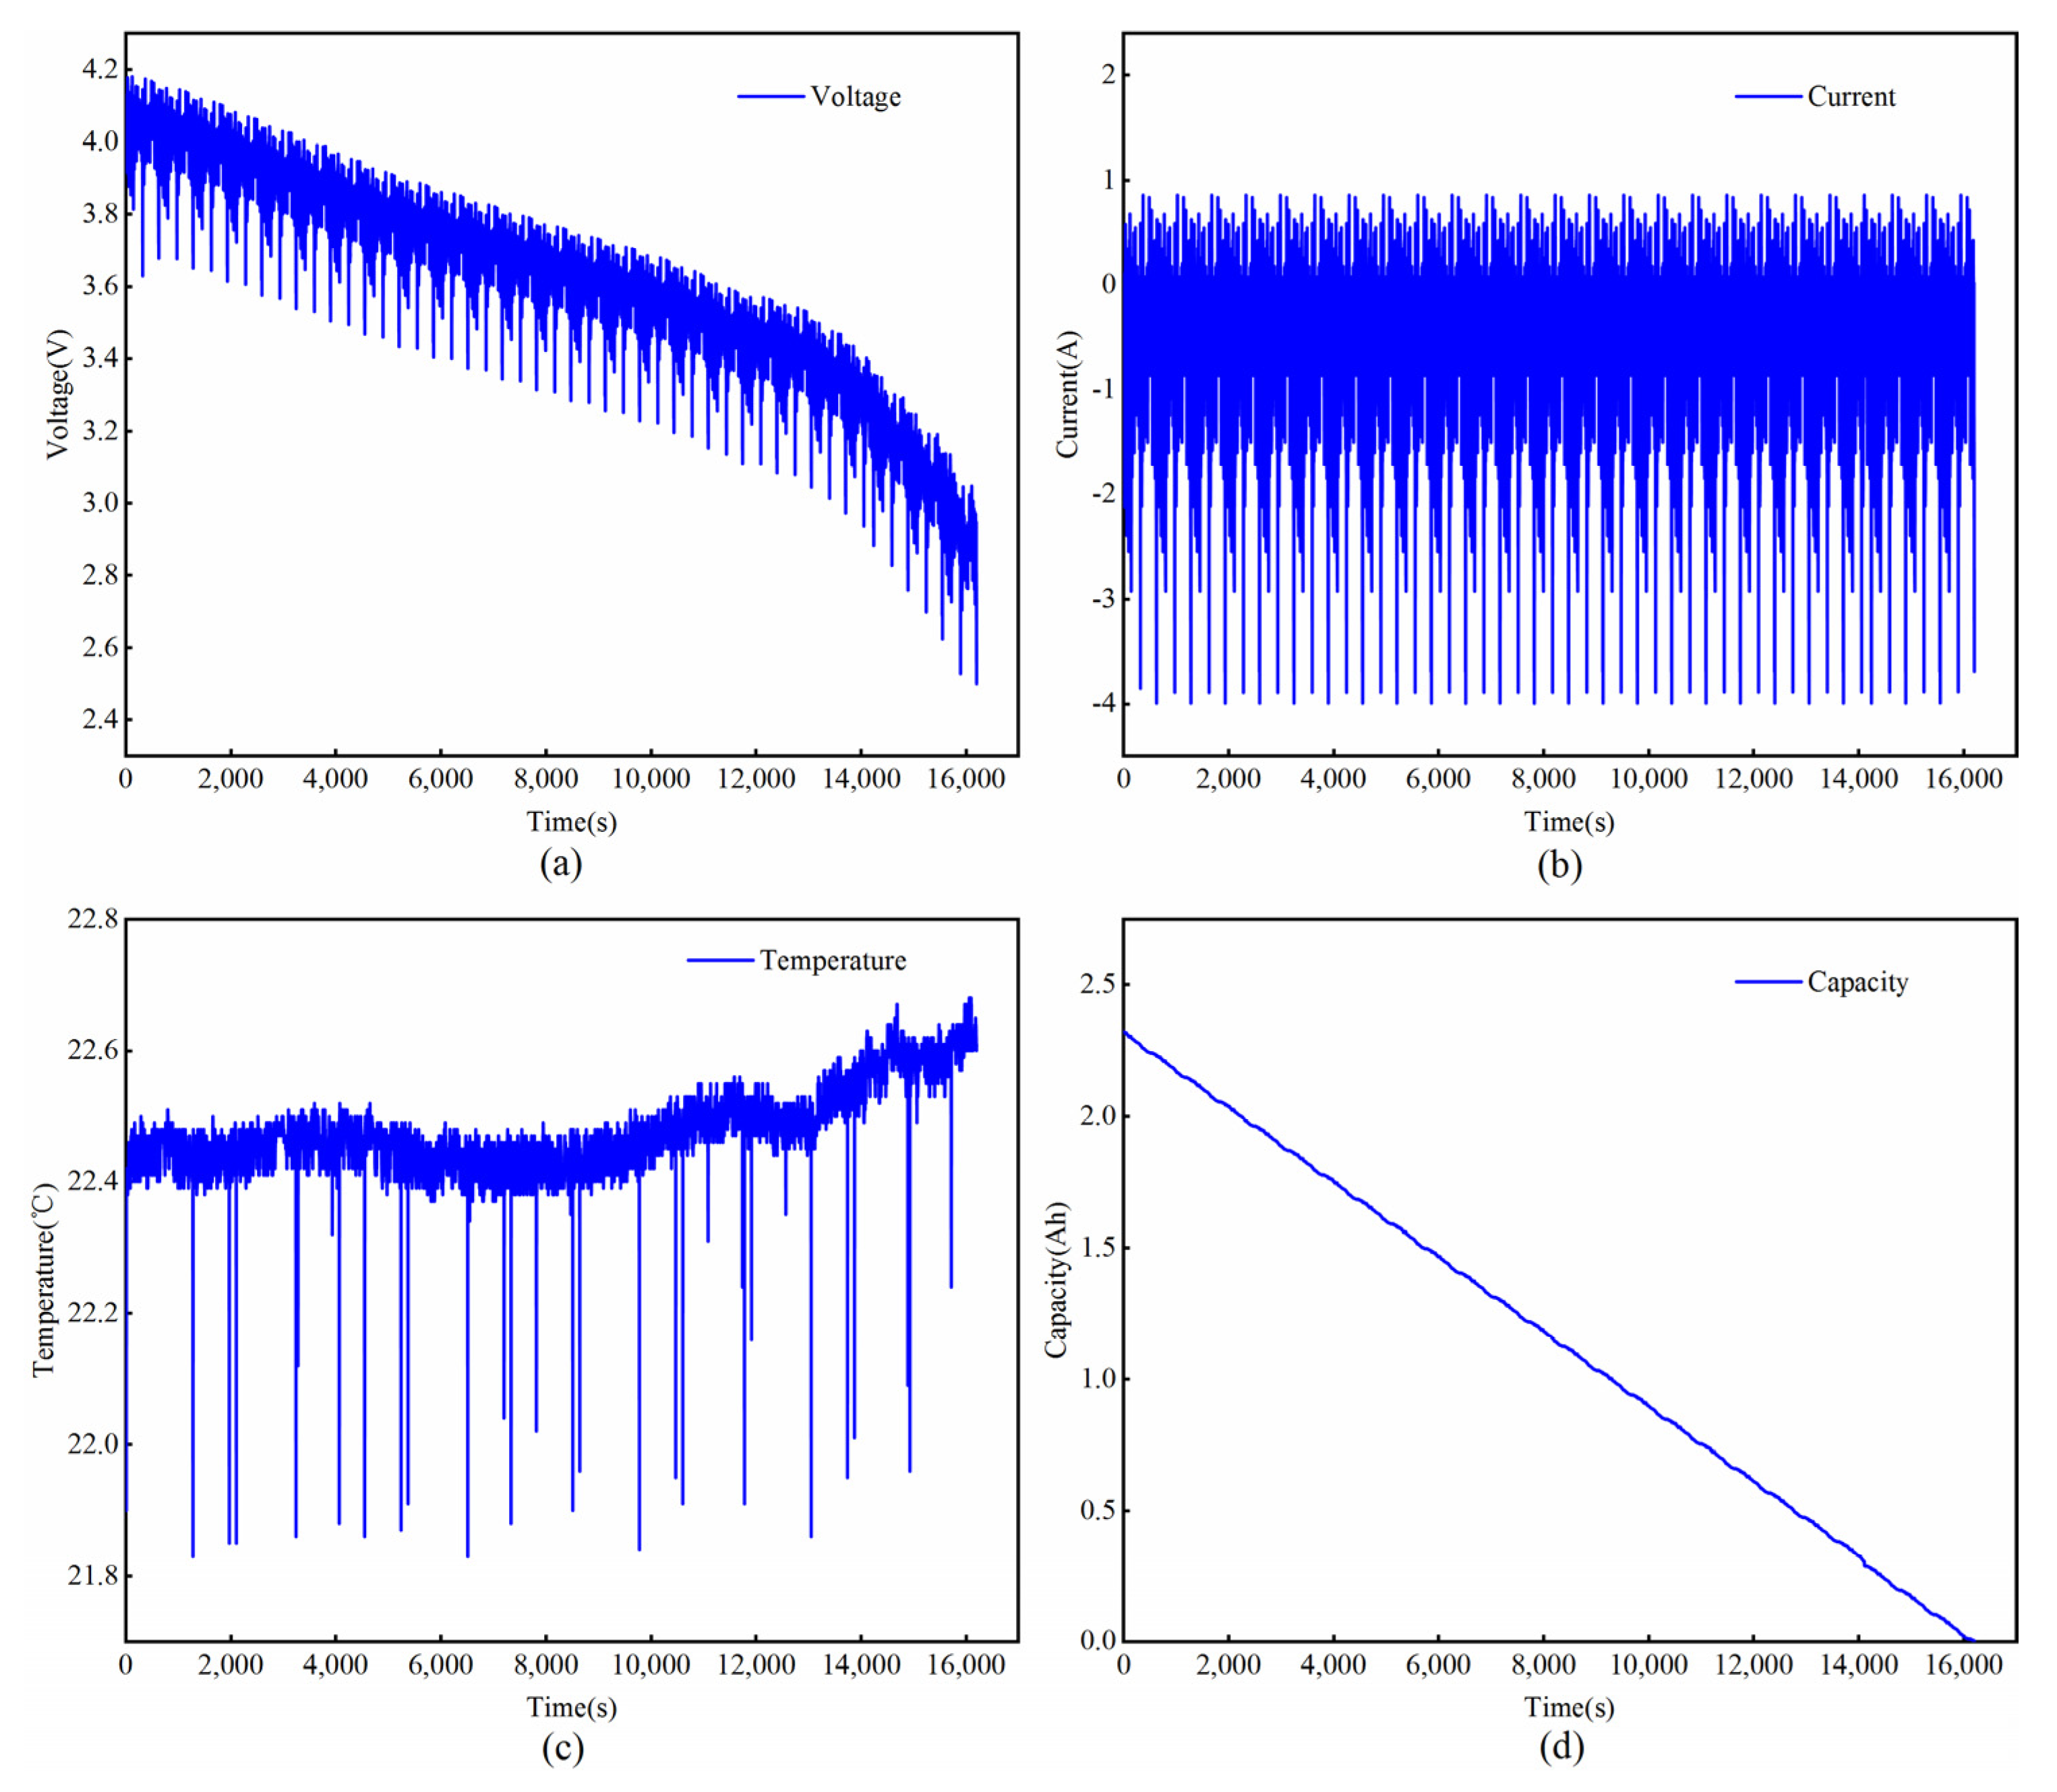
The test process of batteries includes the charging process and the discharging process. In order to fully charge batteries, we adopted the method of constant current charging (CC) and then constant voltage charging (CV). During the constant current charging phase, a current of 2.5 A was applied to the battery until the battery voltage reached 4.2 V. Then, when we entered the constant voltage charging phase, the battery maintains 4.2 V voltage and continues to charge until the battery current was less than 0.05 A. In order to simulate the driving conditions of electric vehicles as realistically as possible, we employed four dynamic driving cycles in the discharging process. At the same time, five temperatures (0 °C, 10 °C, 20 °C, 30 °C, and 45 °C) were used to simulate the low temperature, normal temperature, and high temperature in real life. These four dynamic driving cycles were the Beijing Dynamic Stress Test (BJDST), the Federal Urban Driving Schedule (FUDS), the Dynamic Stress Test (DST), and the US06 Highway Drive Schedule (US06) [29,30,31]. The durations of each condition for one cycle were 900 s, 1372 s, 360 s, and 596 s, respectively. In this paper, four identical batteries were used for testing. The test conditions for each of the four batteries were as follows: (1) the first battery was tested under BJDST at five different temperatures (0 °C, 10 °C, 20 °C, 30 °C, and 45 °C); (2) the second battery was tested under FUDS at five different temperatures (0 °C, 10 °C, 20 °C, 30 °C, and 45 °C); (3) the third battery was tested under DST at five different temperatures (0 °C, 10 °C, 20 °C, 30 °C, and 45 °C); (4) the fourth battery was tested under US06 at five different temperatures (0 °C, 10 °C, 20 °C, 30 °C, and 45 °C). The battery data collected under US06 at 20 °C is shown in Figure 5. Finally, a total of 20 data subsets and 180,000 samples were obtained through these experiments. The collected data included battery voltage, current, temperature, and capacity with a sampling interval of 2 s. Five data subsets selected from the 20 datasets were used as test sets, and the rest were used as training sets. The test data sets were absolutely different from the training datasets. The test datasets were DST at 0 °C, FUDS at 10 °C, BJDST at 20 °C, DST at 30 °C, and US06 at 45 °C.
3.2. Data Processing
Data processing is significant for model training, mainly with regard to data cleaning and data normalization. The purpose of data cleaning is to fill in missing values and remove duplicate values. In addition, data normalization is used to limit the raw data to a specific range, which can speed up model training and average the impact of different dimensional data on the results. The min–max normalization method is adopted to normalize the raw data to the interval [0,1]. The min-max normalization formula is as follows:
where is the raw data; and are the maximum and minimum values of the raw data, respectively; and is the normalized value.
4. Results and Discussion
In this paper, root mean square error (RMSE), mean absolute error (MAE), and maximum error (MAX Error) were used to quantitatively evaluate the performance of the proposed method. Their definitions are as follows:
The number of layers in RNN model was set to three layers—the first two layers were RNN layers, and the last layer was a fully connected layer. The number of neurons in the RNN model was set to 98, 156, and 50. The number of layers in the LSTM model was also set to three layers—the first two layers were LSTM layers, and the last layer was a fully connected layer. The number of neurons in the LSTM model was set to 86, 198, and 80. The parameters of GA-GRU is shown in Table 1. In addition, other parameters of RNN, LSTM, and GA-GRU were the same. For example, Adam was used as optimizer. The learning rate was equal to 0.0001. The epochs were set to 50. The batch size was set to 128. Mean square error (MSE) was used as a loss function.
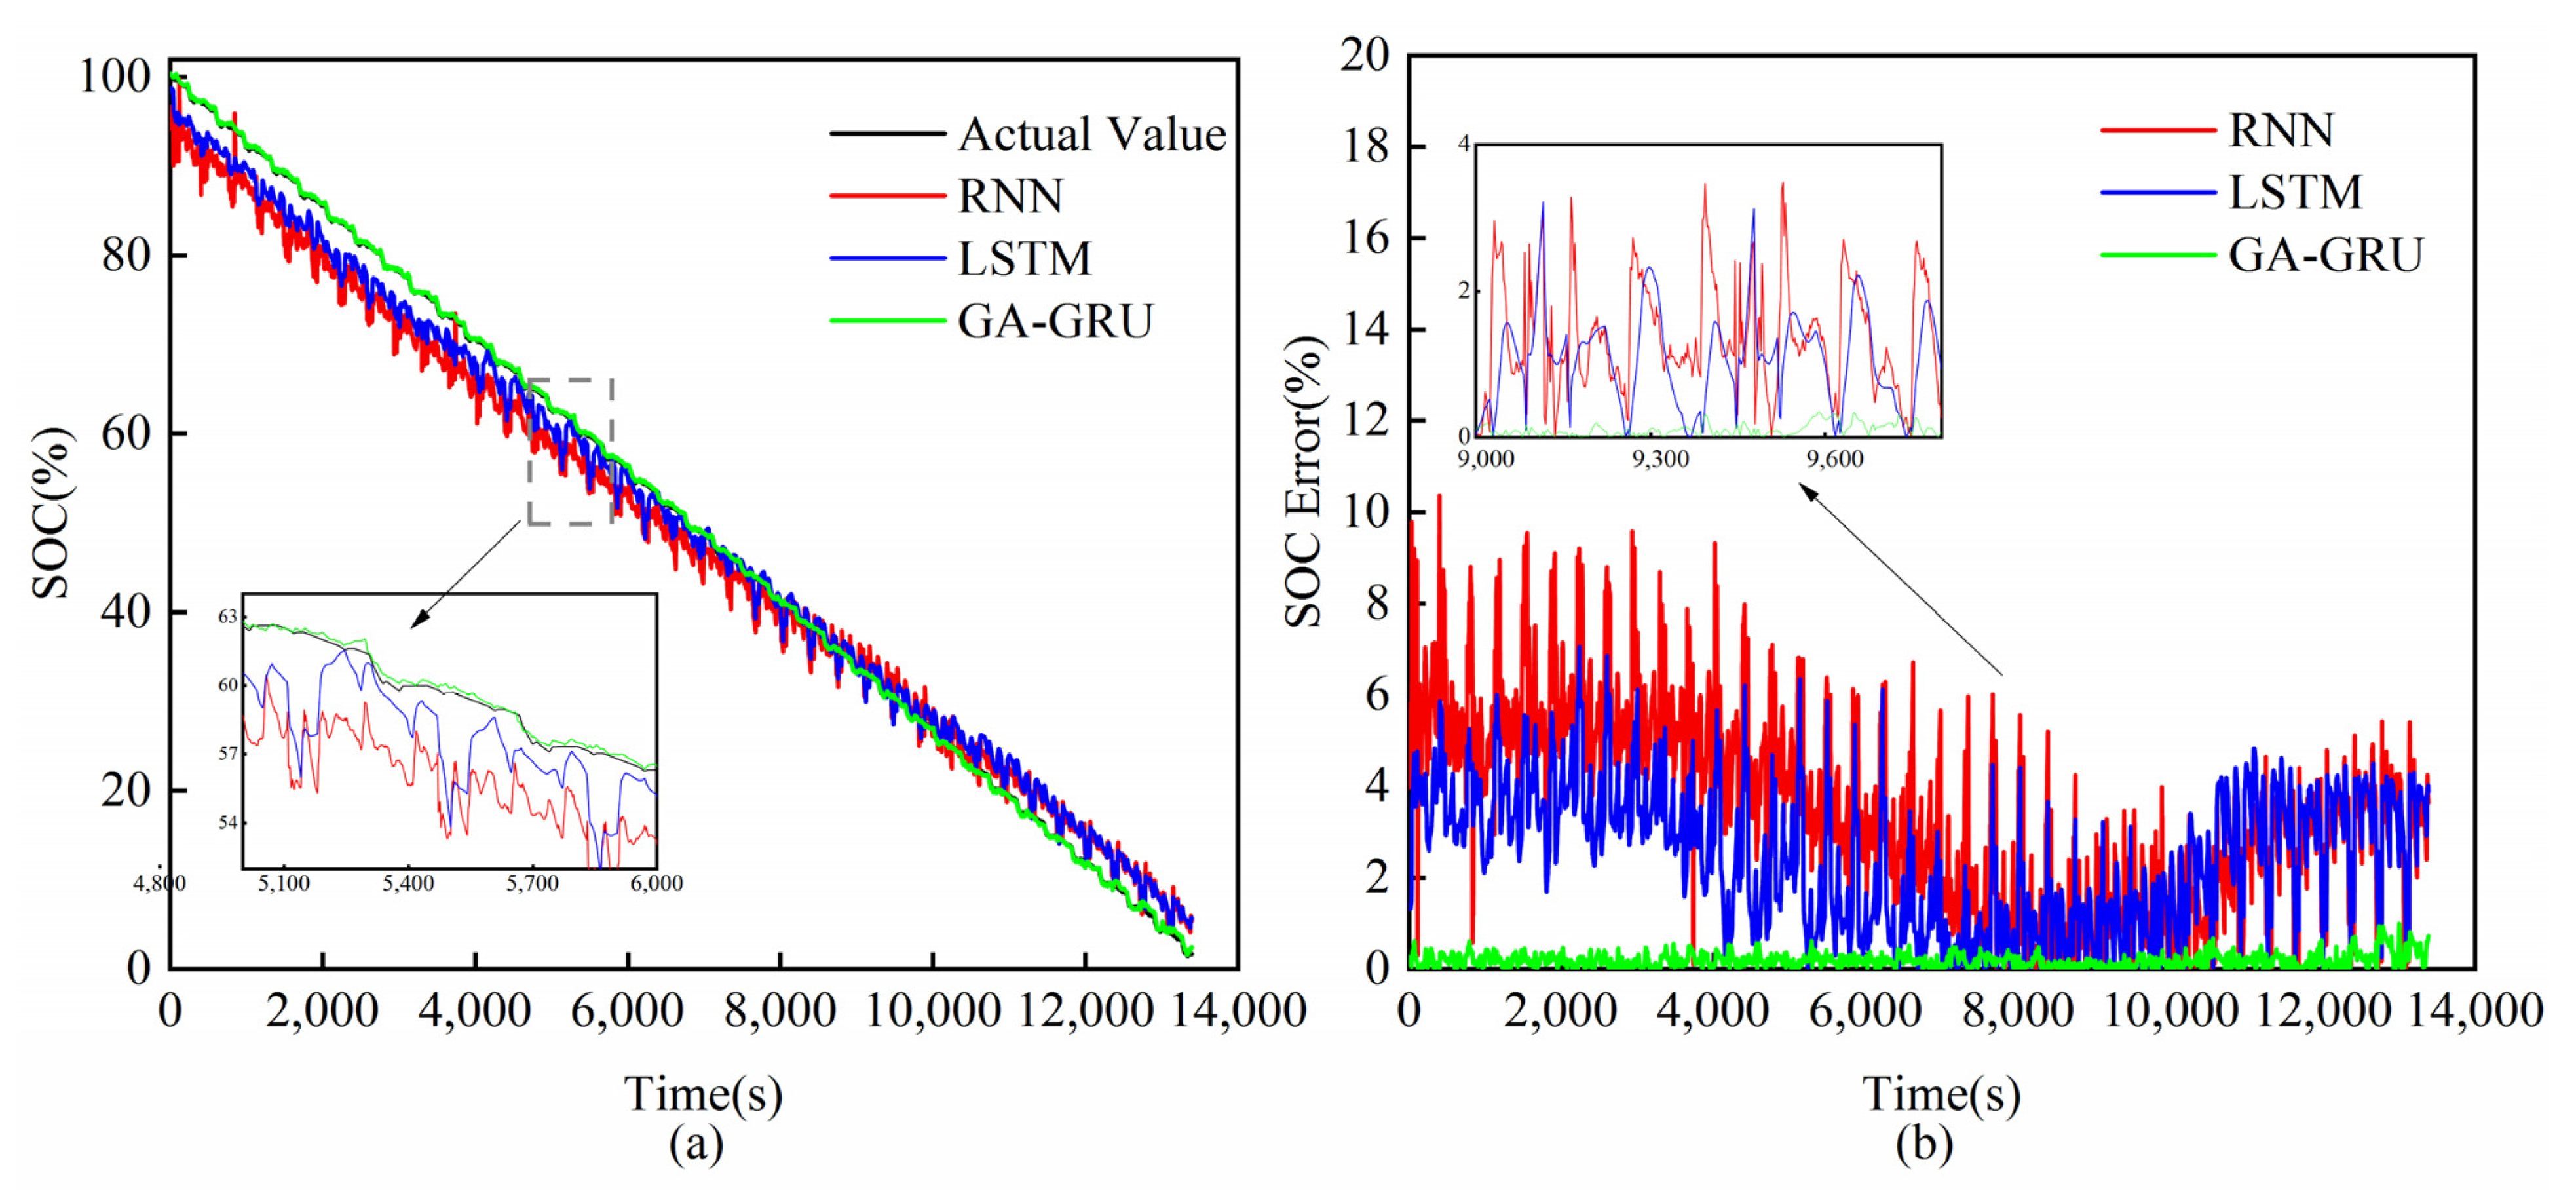
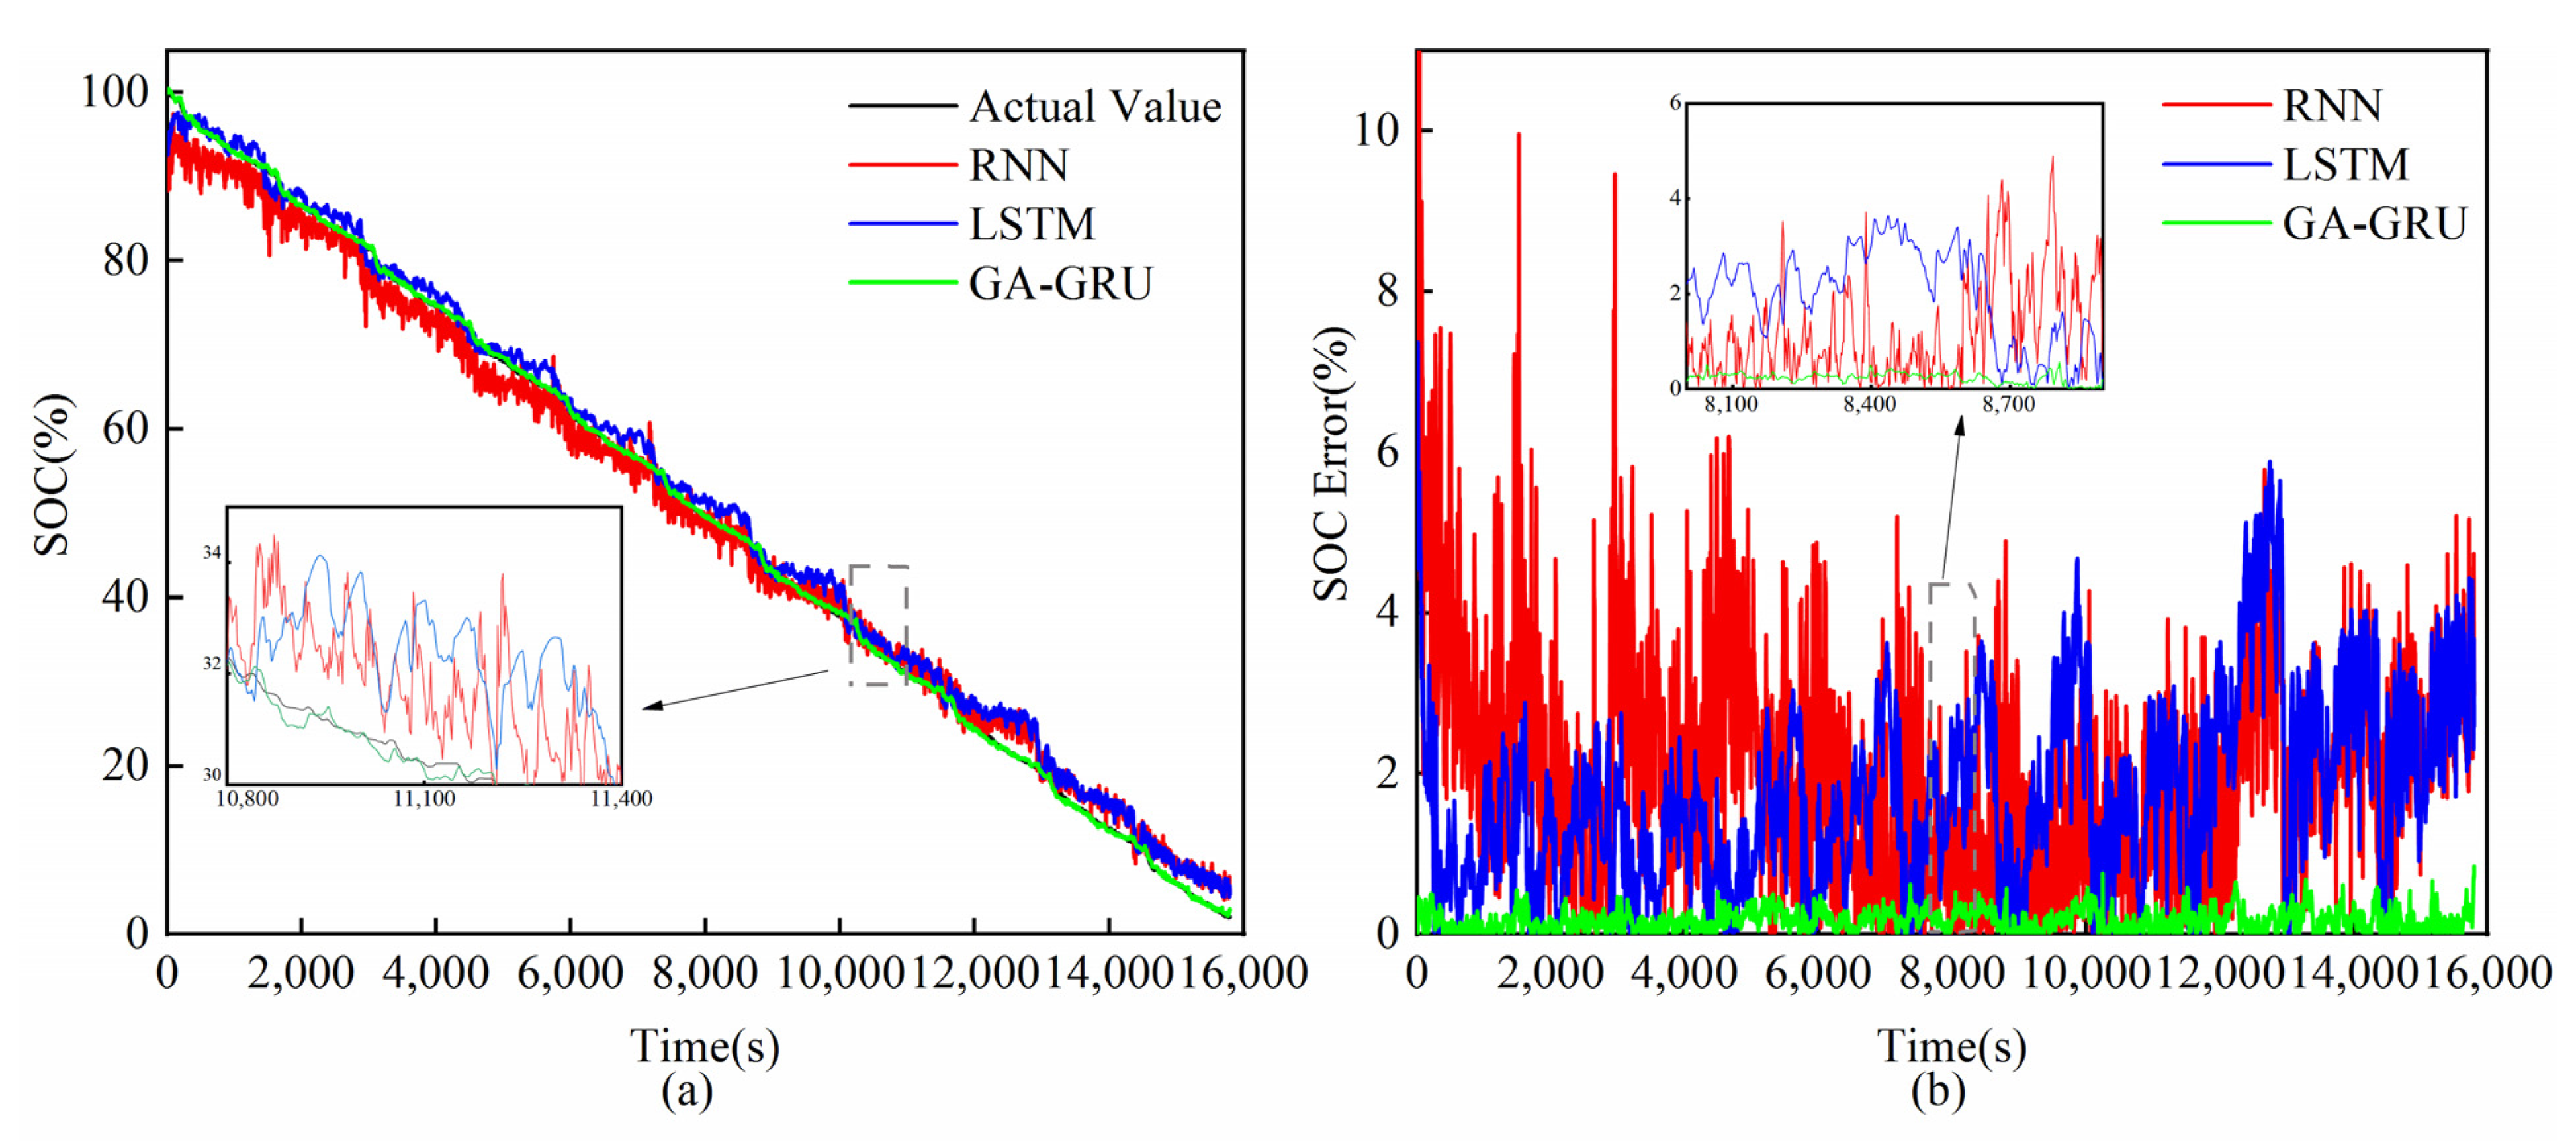
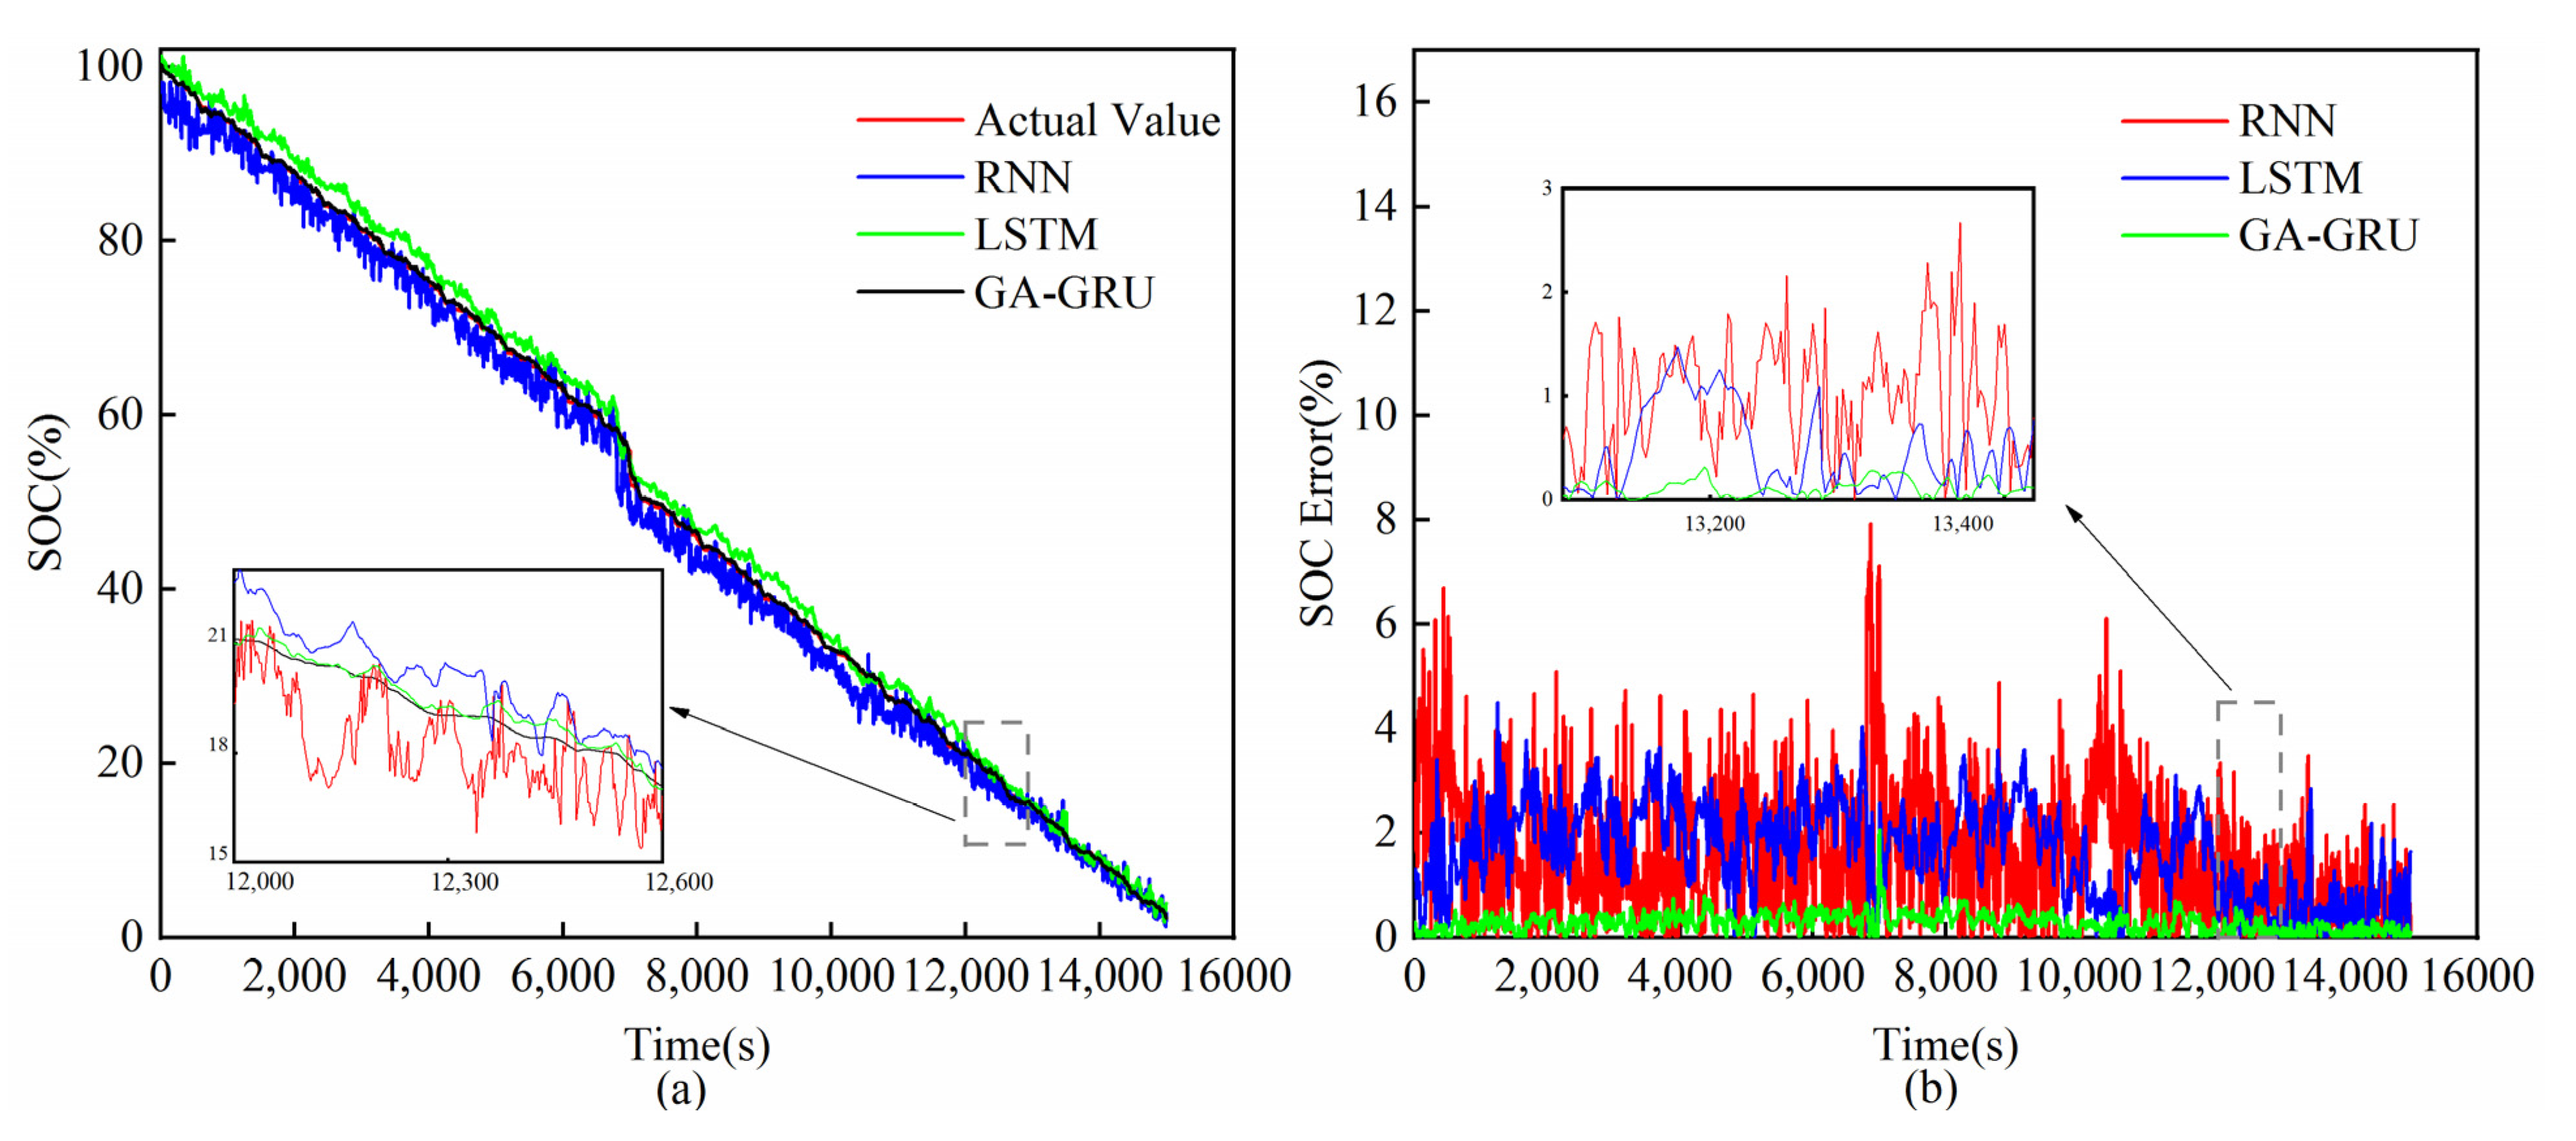
In order to make an assessment of the superiority of the proposed method, we compared the SOC estimation results of RNN, LSTM, and GA-GRU under different dynamic test conditions and different temperatures, namely, DST at 0 °C, FUDS at 10 °C, BJDST at 20 °C, DST at 30 °C, and US06 at 30 °C. The comparison results are shown in subfigure (a) of Figure 6, Figure 7, Figure 8, Figure 9 and Figure 10. Their SOC errors are compared in subfigure (b) of Figure 6, Figure 7, Figure 8, Figure 9 and Figure 10. The RMSE, MAE, and MAX error of RNN, LSTM, and GA-GRU are presented in Table 3.
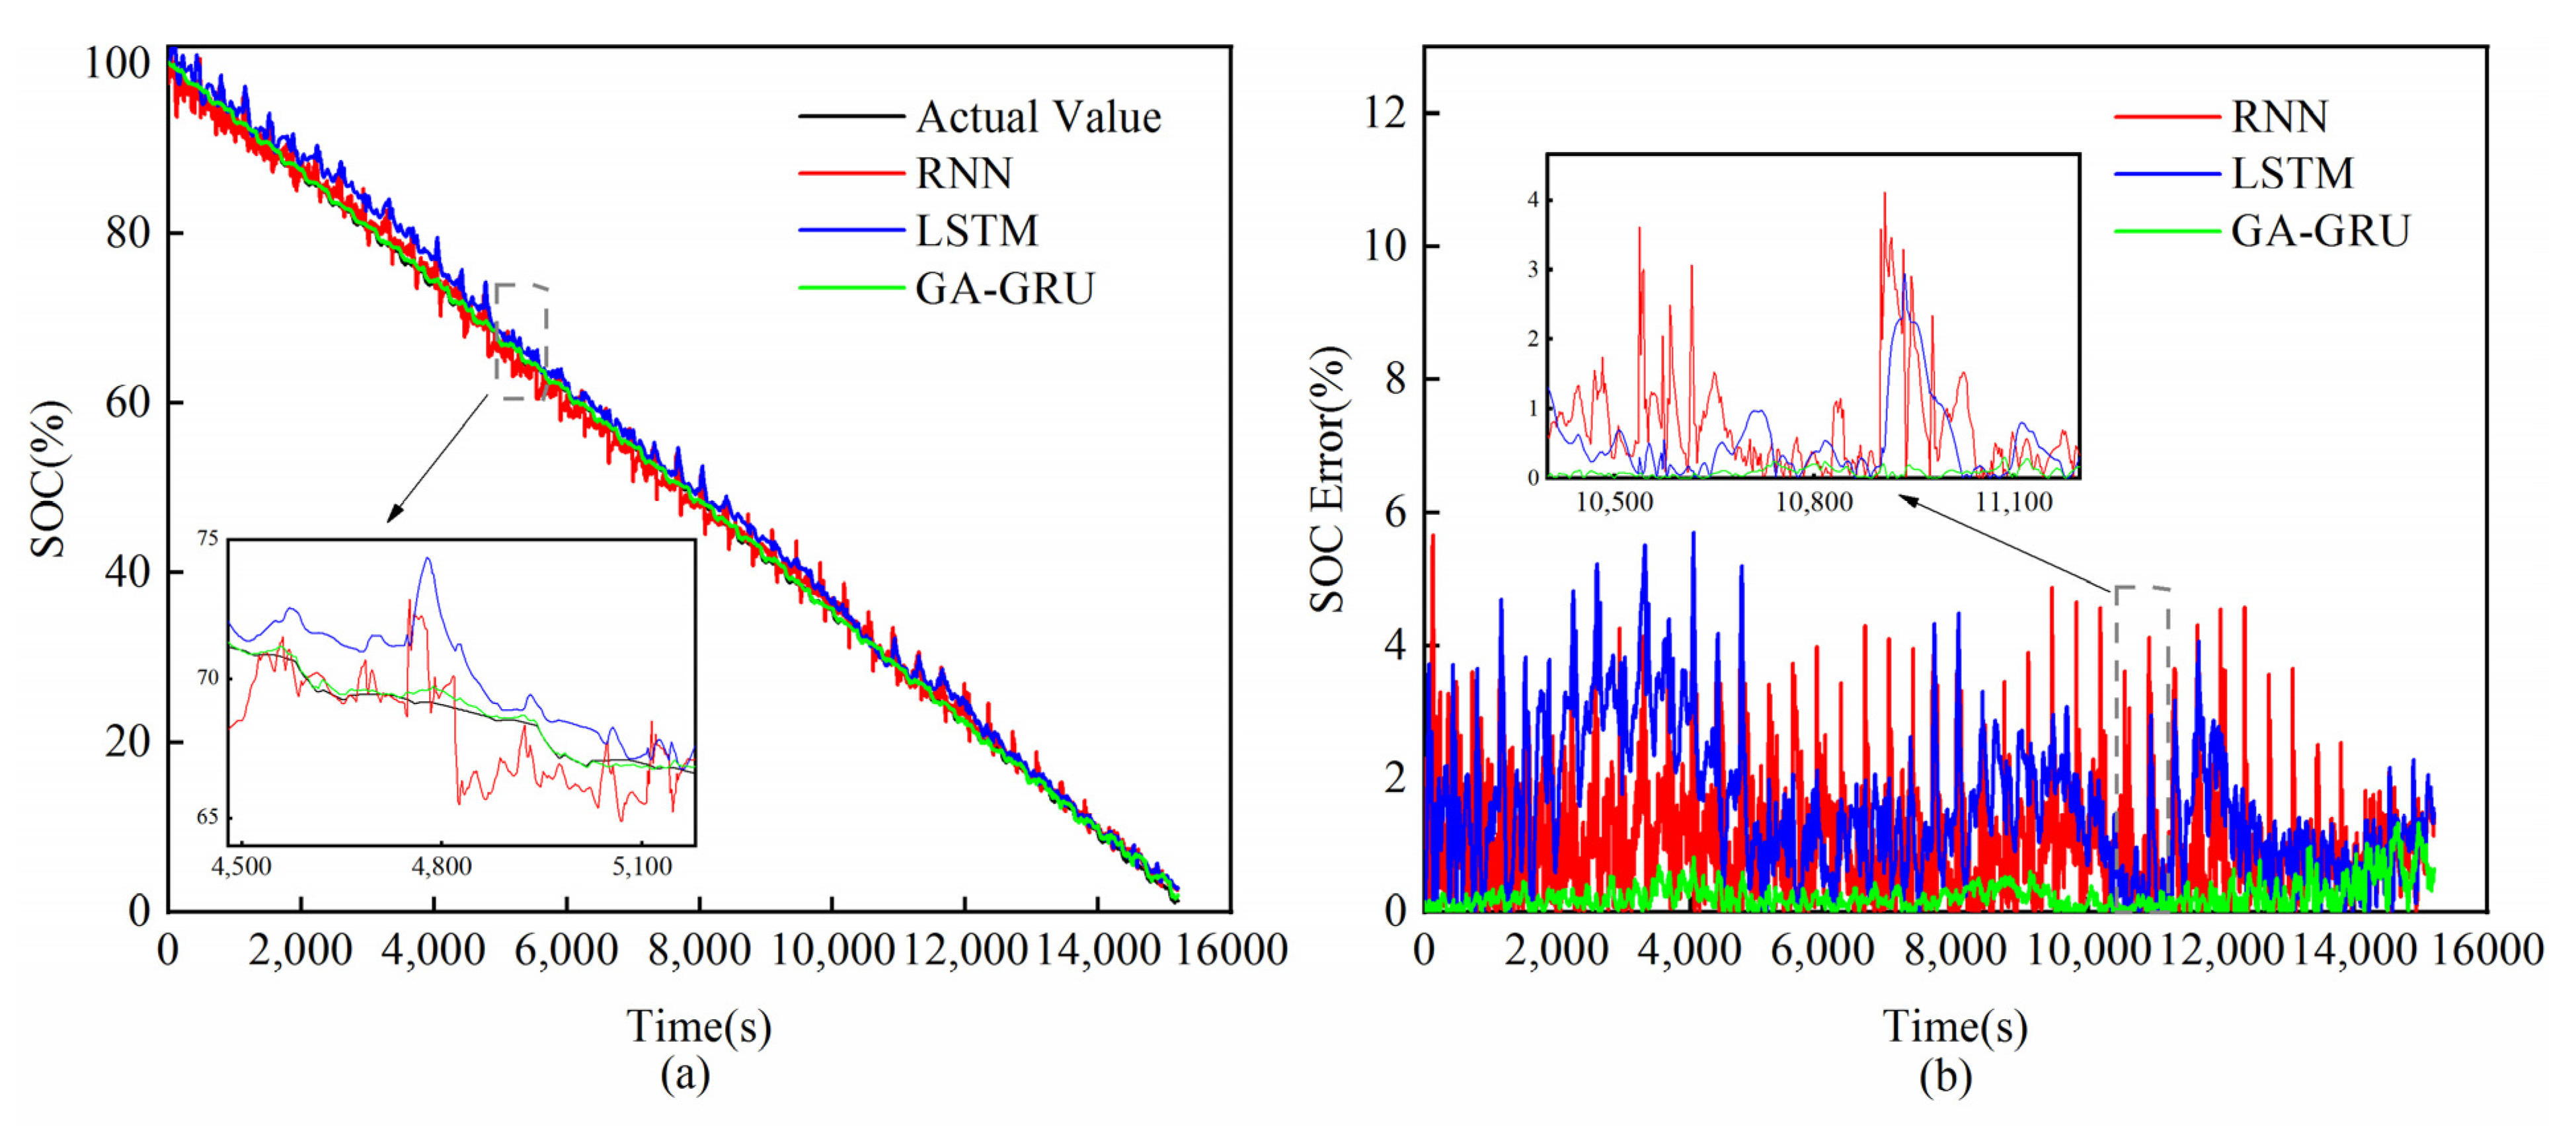
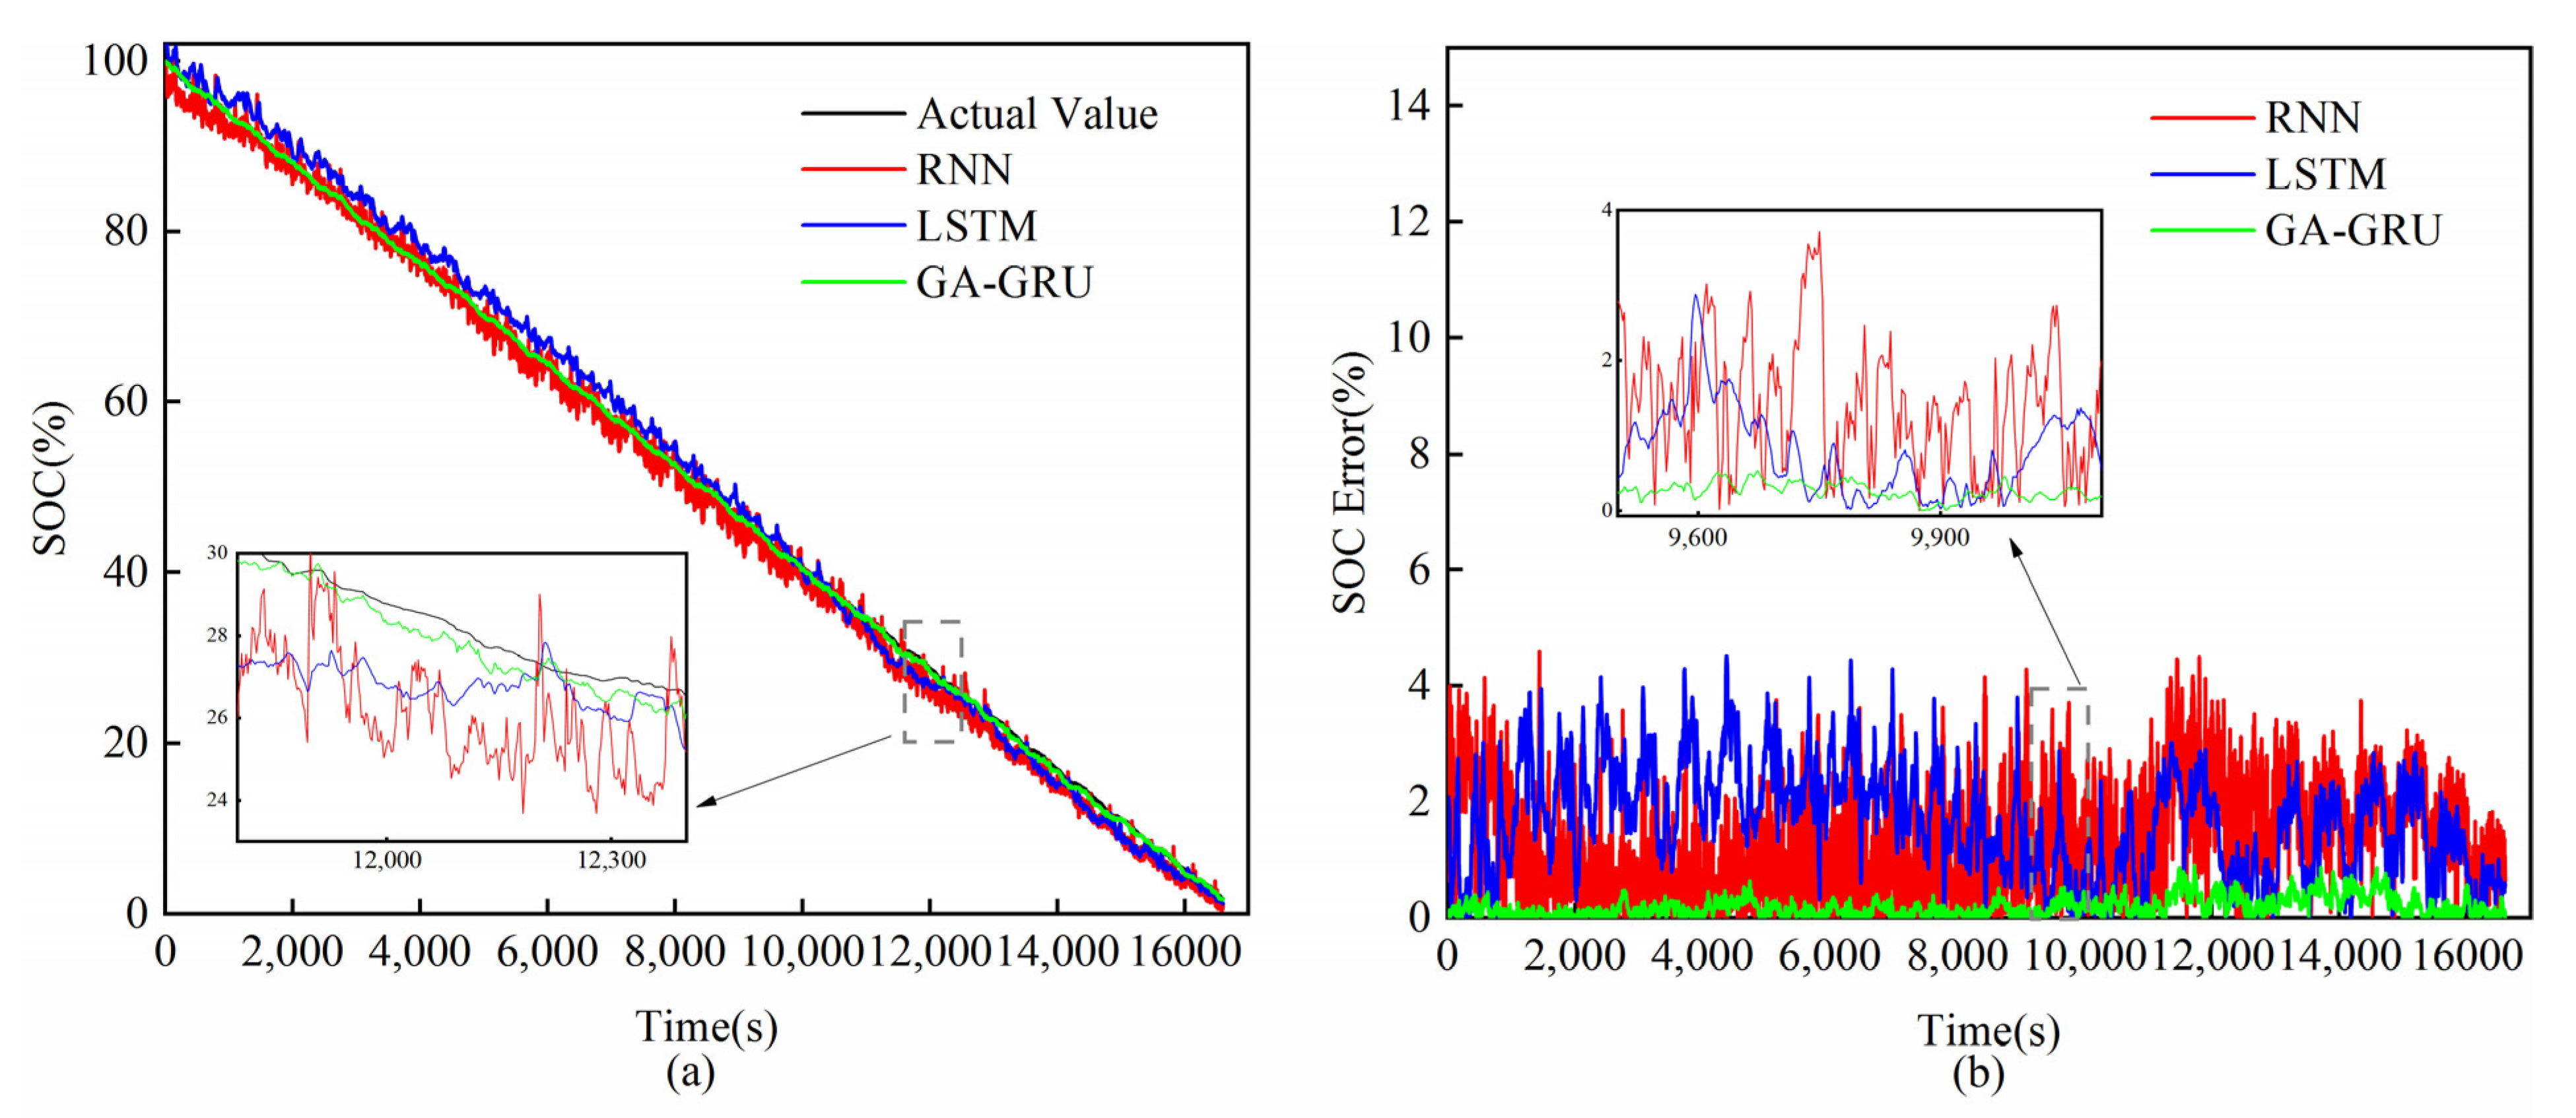
From the subfigure (a) of Figure 6, Figure 7, Figure 8, Figure 9 and Figure 10, we see that these three prediction curves all were able to follow the real SOC curve. However, the green curve was the closest to the real one, which means that the GA-GRU model achieved the best prediction performance compared to the other two methods. Similarly, the same result can be concluded from subfigure (b) of Figure 6, Figure 7, Figure 8, Figure 9 and Figure 10. For example, it can be found from the partial enlarged view of subfigure (a) in Figure 6 that the curve of GA-GRU and the curve of actual value were almost coincident, which means GA-GRU is able to estimate SOC well. However, the curves of LSTM and RNN were farther from the curve of actual value than the curve of GA-GRU. From subfigure (b) in Figure 6, we see that the SOC error values of GA-GRU were less than 1% and near to zero, and the SOC error values of LSTM and RNN were less than 10%. Therefore, compared with LSTM and RNN, GA-GRU performed better.
As shown in Table 3, the statistical estimation results based on RMSE, MAE, and MAX error were calculated. Due to the similarity of the results of the five test cases, we used the SOC estimation result under DST at 30 °C as an example for discussion and analysis. The RMSE, MAE, and MAX error of the GA-GRU model under DST at 30 °C were 0.2017%, 0.2383%, and 1.3366%, respectively. The RMSE, MAE, and MAX error of the LSTM model under DST at 30 °C were 1.5388%, 1.5786%, and 5.6996%, respectively. The RMSE, MAE, and MAX error of RNN model under DST at 30 °C were 0.2129%, 1.0532%, and 5.6613%, respectively. Compared with LSTM, the RMSE, MAE, and MAX error of GA-GRU were smaller, being reduced by 1.3371%, 1.3403%, and 4.363%, respectively. Compared with RNN, the RMSE, MAE, and MAX error of GA-GRU were reduced by 0.0112%, 0.8149%, and 4.3247%, respectively. The SOC estimation results indicate that GA-GRU had good accuracy and robustness.
5. Conclusions
In this paper, a GA-GRU model is proposed for accurate SOC estimation under dynamic driving conditions. The main contributions of this work are listed below: Firstly, the proposed network takes battery voltage, current, and temperature as inputs and SOC as output without considering the battery model, parameter identification, and complex control theory formulas. Then, the GRU module is applied to solve the problems of time long-term dependencies, and gradient disappearance or explosion. Compared with LSTM, it has a simpler structure and fewer parameters. Next, considering the importance of network parameters for deep learning methods, we used GA to optimize the number of GRU layers and fully connected layers, as well as the number of their neurons. Finally, the experiments were designed to verify the effectiveness and robustness of the proposed method. The SOC estimation results under different dynamic driving conditions and the comparison results with RNN and LSTM all showed that the proposed method can accurately and robustly predict SOC.
Author Contributions
Conceptualization, D.X.; methodology, J.C.; software, C.C.; validation, C.L.; formal analysis, H.C.; investigation, H.C.; resources, D.X.; data curation, J.C.; writing—original draft preparation, J.C.; writing—review and editing, J.C.; visualization, C.L.; supervision, D.X.; project administration, D.X.; funding acquisition, D.X. All authors have read and agreed to the published version of the manuscript.
Funding
This research was supported by the Major Science and Technology Projects of Wenzhou, China, grant number 2018ZG007.
Institutional Review Board Statement
Not applicable.
Informed Consent Statement
Not applicable.
Data Availability Statement
Not applicable.
Conflicts of Interest
The authors declare no conflict of interest.
References
- World Health Organization. Regional Office for Europe. Air Quality Guidelines: Global update 2005: Particulate Matter, Ozone, Nitrogen Dioxide, and Sulfur Dioxide. Indian J. Med. Res. 2007, 4, 492–493. [Google Scholar]
- Saw, L.H.; Ye, Y.; Tay, A.A.O. Integration issues of lithium-ion battery into electric vehicles battery pack. J. Clean. Prod. 2016, 113, 1032–1045. [Google Scholar] [CrossRef]
- Seo, M.; Song, Y.; Kim, J.; Paek, S.W.; Kim, G.-H.; Kim, S.W. Innovative lumped-battery model for state of charge estimation of lithium-ion batteries under various ambient temperatures. Energy 2021, 226, 120301. [Google Scholar] [CrossRef]
- Ren, X.; Liu, S.; Yu, X.; Dong, X. A method for state-of-charge estimation of lithium-ion batteries based on PSO-LSTM. Energy 2021, 234, 121236. [Google Scholar] [CrossRef]
- Xiao, B.; Liu, Y.; Xiao, B. Accurate state-of-charge estimation approach for lithium-ion batteries by gated recurrent unit with ensemble optimizer. IEEE Access 2019, 7, 54192–54202. [Google Scholar] [CrossRef]
- How, D.N.T.; Hannan, M.A.; Hossain Lipu, M.S.; Ker, P.J. State of charge estimation for lithium-ion batteries using model-based and data-driven methods: A review. IEEE Access 2019, 7, 136116–136136. [Google Scholar] [CrossRef]
- Cui, Z.; Wang, L.; Li, Q.; Wang, K. A comprehensive review on the state of charge estimation for lithium-ion battery based on neural network. Int. J. Energy Res. 2021. [Google Scholar] [CrossRef]
- Ali, M.U.; Zafar, A.; Nengroo, S.H.; Hussain, S.; Alvi, M.J.; Kim, H.-J. Towards a smarter battery management system for electric vehicle applications: A critical review of lithium-ion battery state of charge estimation. Energies 2019, 12, 446. [Google Scholar] [CrossRef] [Green Version]
- Ng, K.S.; Moo, C.-S.; Chen, Y.-P.; Hsieh, Y.-C. Enhanced coulomb counting method for estimating state-of-charge and state-of-health of lithium-ion batteries. Appl. Energy 2009, 86, 1506–1511. [Google Scholar] [CrossRef]
- Xing, Y.; He, W.; Pecht, M.; Tsui, K.L. State of charge estimation of lithium-ion batteries using the open-circuit voltage at various ambient temperatures. Appl. Energy 2014, 113, 106–115. [Google Scholar] [CrossRef]
- Hu, X.; Li, S.; Peng, H. A comparative study of equivalent circuit models for Li-ion batteries. J. Power Sources 2012, 198, 359–367. [Google Scholar] [CrossRef]
- Liu, L.; Zhu, J.; Zheng, L. An Effective Method for Estimating State of Charge of Lithium-Ion Batteries Based on an Electrochemical Model and Nernst Equation. IEEE Access 2020, 8, 211738–211749. [Google Scholar] [CrossRef]
- Zheng, Y.; Gao, W.; Ouyang, M.; Lu, L.; Zhou, L.; Han, X. State-of-charge inconsistency estimation of lithium-ion battery pack using mean-difference model and extended Kalman filter. J. Power Sources 2018, 383, 50–58. [Google Scholar] [CrossRef]
- Jiang, C.; Wang, S.; Wu, B.; Etse-Dabu, B. A Novel Adaptive Extended Kalman Filtering and Electrochemical-Circuit Combined Modeling Method for the Online Ternary Battery State-of-Charge Estimation. Int. J. Electrochem. Sci. 2020, 15, 9720–9733. [Google Scholar] [CrossRef]
- Wu, X.; Li, X.; Du, J. State of charge estimation of lithium-ion batteries over wide temperature range using unscented Kalman filter. IEEE Access 2018, 6, 41993–42003. [Google Scholar] [CrossRef]
- Ye, M.; Guo, H.; Cao, B. A model-based adaptive state of charge estimator for a lithium-ion battery using an improved adaptive particle filter. Appl. Energy 2017, 190, 740–748. [Google Scholar] [CrossRef]
- Zhong, F.; Li, H.; Zhong, S.; Zhong, Q.; Yin, C. An SOC estimation approach based on adaptive sliding mode observer and fractional order equivalent circuit model for lithium-ion batteries. Commun. Nonlinear Sci. Numer. Simul. 2015, 24, 127–144. [Google Scholar] [CrossRef]
- Huawei, W.U.; Yuanjin, Z.; Congjin, Y.E. Estimation of power battery SOC based on firefly BP neural network. Energy Storage Sci. Technol. 2019, 8, 575. [Google Scholar]
- Anton, J.C.A.; Nieto, P.J.G.; Viejo, C.J.B.; Vilan, J.A.V. Support vector machines used to estimate the battery state of charge. IEEE Trans. Power Electron. 2013, 28, 5919–5926. [Google Scholar] [CrossRef]
- Shen, S.; Sadoughi, M.; Chen, X.; Hong, M.; Hu, C. A deep learning method for online capacity estimation of lithium-ion batteries. J. Energy Storage 2019, 25, 100817. [Google Scholar] [CrossRef]
- Chemali, E.; Kollmeyer, P.J.; Preindl, M.; Ahmed, R.; Emadi, A. Long short-term memory networks for accurate state-of-charge estimation of Li-ion batteries. IEEE Trans. Ind. Electron. 2017, 65, 6730–6739. [Google Scholar] [CrossRef]
- Chen, J.; Feng, X.; Jiang, L.; Zhu, Q. State of charge estimation of lithium-ion battery using denoising autoencoder and gated recurrent unit recurrent neural network. Energy 2021, 227, 120451. [Google Scholar] [CrossRef]
- Huang, Z.; Yang, F.; Xu, F.; Song, X.; Tsui, K.-L. Convolutional gated recurrent unit–recurrent neural network for state-of-charge estimation of lithium-ion batteries. IEEE Access 2019, 7, 93139–93149. [Google Scholar] [CrossRef]
- Hochreiter, S.; Schmidhuber, J. Long short-term memory. Neural Comput. 1997, 9, 1735–1780. [Google Scholar] [CrossRef]
- Mikolov, T.; Karafiát, M.; Burget, L.; Cernocký, J.; Khudanpur, S. Recurrent neural network based language model. Interspeech 2010, 2, 1045–1048. [Google Scholar]
- Cho, K.; Van Merriënboer, B.; Bahdanau, D.; Bengio, Y. On the properties of neural machine translation: Encoder-decoder approaches. arXiv 2014, arXiv:1409.1259. [Google Scholar]
- Yang, F.; Li, W.; Li, C.; Miao, Q. State-of-charge estimation of lithium-ion batteries based on gated recurrent neural network. Energy 2019, 175, 66–75. [Google Scholar] [CrossRef]
- Wang, S.C. Genetic Algorithm. In Interdisciplinary Computing in Java Programming; Springer: Boston, MA, USA, 2003; pp. 101–116. [Google Scholar]
- A Simplified Version of the Federal Urban Driving Schedule for Electric Vehicle Battery Testing. 1988. Available online: https://www.osti.gov/biblio/6572201-simplified-version-federal-urban-driving-schedule-electric-vehicle-battery-testing (accessed on 13 January 2022).
- USABC Electric Vehicle Battery Test Procedures Manual; U.S. Adv. Battery Consortium: Southfield, MI, USA, 2006; Available online: https://digital.library.unt.edu/ark:/67531/metadc666152/ (accessed on 13 January 2022).
- EPA US06 or Supplemental Federal Test Procedure (SFTP). Available online: http://www.epa.gov/otaq/standards/light-duty/sc06-sftp.htm (accessed on 13 January 2022).
Figure 1.
Structure of gated recurrent unit.

Figure 2.
Flow chart of genetic algorithm.

Figure 3.
The implementation process of GA-GRU model.

Figure 4.
Battery testing platform.

Figure 5.
Measured battery data in the US06 driving condition at 20 °C. (a) Battery voltage data. (b) Battery current data. (c) Battery temperature data. (d) Battery capacity data.
Figure 5.
Measured battery data in the US06 driving condition at 20 °C. (a) Battery voltage data. (b) Battery current data. (c) Battery temperature data. (d) Battery capacity data.

Figure 6.
SOC estimation results and errors under DST at 0 °C. (a) Comparison of SOC estimation results under DST at 0 °C; (b) comparison of SOC estimation errors under DST at 0 °C.
Figure 6.
SOC estimation results and errors under DST at 0 °C. (a) Comparison of SOC estimation results under DST at 0 °C; (b) comparison of SOC estimation errors under DST at 0 °C.

Figure 7.
SOC estimation results and errors under FUDS at 10 °C. (a) Comparison of SOC estimation results under FUDS at 10 °C; (b) comparison of SOC estimation errors under FUDS at 10 °C.
Figure 7.
SOC estimation results and errors under FUDS at 10 °C. (a) Comparison of SOC estimation results under FUDS at 10 °C; (b) comparison of SOC estimation errors under FUDS at 10 °C.

Figure 8.
SOC estimation results and errors under BJDST at 20 °C. (a) Comparison of SOC estimation results under BJDST at 20 °C; (b) comparison of SOC estimation errors under BJDST at 20 °C.
Figure 8.
SOC estimation results and errors under BJDST at 20 °C. (a) Comparison of SOC estimation results under BJDST at 20 °C; (b) comparison of SOC estimation errors under BJDST at 20 °C.

Figure 9.
SOC estimation results and errors under DST at 30 °C. (a) Comparison of SOC estimation results under DST at 30 °C; (b) comparison of SOC estimation errors under DST at 30 °C.
Figure 9.
SOC estimation results and errors under DST at 30 °C. (a) Comparison of SOC estimation results under DST at 30 °C; (b) comparison of SOC estimation errors under DST at 30 °C.

Figure 10.
SOC estimation results and errors under US06 at 45 °C. (a) Comparison of SOC estimation results under US06 at 45 °C; (b) comparison of SOC estimation errors under US06 at 45 °C.
Figure 10.
SOC estimation results and errors under US06 at 45 °C. (a) Comparison of SOC estimation results under US06 at 45 °C; (b) comparison of SOC estimation errors under US06 at 45 °C.


Table 1.
Optimized of parameters of GA-GRU model.
| Layer | Each of Layer | Number of Neurons |
|---|---|---|
| GRU | GRU_1 | 200 |
| GRU_2 | 214 | |
| GRU_3 | 152 | |
| FCL | FCL | 106 |
Table 2.
The battery testing platform specification.
| Hardware | Specification | |
|---|---|---|
| TECHPOW battery test equipment | Voltage range | 0~5 V |
| Current range | −200 A~200 A | |
| Sampling precision | 0.001 | |
| DGBELL temperature chamber | Temperature range | −40 °C~+150 °C |
| Sampling precision | 0.1 °C |
Table 3.
Comparison of SOC estimation numerical results under different driving conditions.
| Method | Condition | RMSE (%) | MAE (%) | MAX Error (%) |
|---|---|---|---|---|
| RNN | DST 0 °C | 2.0163 | 3.4739 | 10.3584 |
| FUDS 10 °C | 0.3999 | 2.0255 | 11.6486 | |
| BJDST 20 °C | 1.3924 | 1.5474 | 7.9190 | |
| DST 30 °C | 0.2129 | 1.0532 | 5.6613 | |
| US06 45 °C | 1.1196 | 1.3768 | 4.6015 | |
| LSTM | DST 0 °C | 0.6813 | 2.4416 | 7.0484 |
| FUDS 10 °C | 1.5193 | 1.7937 | 7.3662 | |
| BJDST 20 °C | 1.5755 | 1.6566 | 4.4944 | |
| DST 30 °C | 1.5388 | 1.5786 | 5.6996 | |
| US06 45 °C | 0.6822 | 1.6672 | 4.5193 | |
| GA-GRU | DST 0 °C | 0.1052 | 0.1965 | 0.9892 |
| FUDS 10 °C | 0.0851 | 0.1750 | 0.8451 | |
| BJDST 20 °C | 0.2295 | 0.2754 | 2.0662 | |
| DST 30 °C | 0.2017 | 0.2383 | 1.3366 | |
| US06 45 °C | 0.0725 | 0.1960 | 0.9120 |
Publisher’s Note: MDPI stays neutral with regard to jurisdictional claims in published maps and institutional affiliations. |
© 2022 by the authors. Licensee MDPI, Basel, Switzerland. This article is an open access article distributed under the terms and conditions of the Creative Commons Attribution (CC BY) license (https://creativecommons.org/licenses/by/4.0/).
Share and Cite
MDPI and ACS Style
Chen, J.; Lu, C.; Chen, C.; Cheng, H.; Xuan, D. An Improved Gated Recurrent Unit Neural Network for State-of-Charge Estimation of Lithium-Ion Battery. Appl. Sci. 2022, 12, 2305. https://0-doi-org.brum.beds.ac.uk/10.3390/app12052305
AMA Style
Chen J, Lu C, Chen C, Cheng H, Xuan D. An Improved Gated Recurrent Unit Neural Network for State-of-Charge Estimation of Lithium-Ion Battery. Applied Sciences. 2022; 12(5):2305. https://0-doi-org.brum.beds.ac.uk/10.3390/app12052305
Chicago/Turabian StyleChen, Jianlong, Chenlei Lu, Cong Chen, Hangyu Cheng, and Dongji Xuan. 2022. "An Improved Gated Recurrent Unit Neural Network for State-of-Charge Estimation of Lithium-Ion Battery" Applied Sciences 12, no. 5: 2305. https://0-doi-org.brum.beds.ac.uk/10.3390/app12052305
Note that from the first issue of 2016, this journal uses article numbers instead of page numbers. See further details here.