Article

Study on the Dynamic Response Characteristics and p–y Curve of Straight and Inclined Pile Groups in Saturated Sands

1
Key Laboratory of Earthquake Engineering and Engineering Vibration, Institute of Engineering Mechanics, China Earthquake Administration, Harbin 150080, China
2
Key Laboratory of Earthquake Disaster Mitigation, Ministry of Emergency Management, Harbin 150080, China
3
College of Civil and Transportation Engineering, Hebei University of Technology, Tianjin 300401, China
*
Author to whom correspondence should be addressed.
Submission received: 23 December 2021 / Revised: 15 February 2022 / Accepted: 18 February 2022 / Published: 24 February 2022
(This article belongs to the Special Issue Recent Progress on Advanced Foundation Engineering)

Abstract

:
This paper is based on a shaking table test of 2 × 2 straight pile groups and 2 × 2 inclined pile groups in non-liquefied sand and saturated sand with different thicknesses. Under the sine wave with a certain peak acceleration and frequency, the lateral dynamic response characteristics, the distribution law of the maximum bending moment envelope diagram, and the p–y curve of the straight and inclined pile groups are studied. The results show that the bending moment of the straight pile group is 3~4 times that of the inclined pile group at the bottom section of the pile in the 300 mm saturated sand. When the thickness of the saturated sand increases to 380 mm, the maximum bending moment of the straight pile group is 6~7 times that of the inclined pile group at the bottom section of the pile. Through the comparison of indicators, it shows that the inclined pile group can have better bending resistance when subjected to the same lateral dynamic load.

1. Introduction

As a common form of foundation, the research on the fabrication, installation and vertical-bearing capacity of pile foundations is very rich [1,2]. However, pile foundations are often subjected to irregular horizontal dynamic loads, such as vibrational loads caused by ground motions and wind loads [3,4,5,6,7]. Therefore, the dynamic stability of these pile foundations needs to be solved when they are subjected to lateral loads, such as seismic forces. Different from the foundation in dry sand [8,9], the pile foundation is damaged due to the liquefaction and failure of the foundation soil. Ground displacement caused by large liquefaction causes serious damage to bridges’ structural infrastructure, lifeline facilities and other infrastructure [10,11,12]. This results in the destruction of a large number of superstructures, which is not uncommon during many earthquakes. Some examples include the Landers M7.3 earthquake [13], the Colima M7.8 earthquake [14], the Tohoku-Oki M9.0 earthquake [15], and the Wenchuan M8.0 earthquake [16,17].
According to the research findings, many studies have been conducted to determine the failure mechanism of pile foundations under the action of an earthquake. The research on geotechnical related problems through different methods is also more and more extensive [18]. Therefore, the shaking table test has become a tool for identifying and quantifying the failure mechanism of pile foundations under the action of earthquakes [19,20,21,22]. Motamed [23] supported that mitigating the sheet pile of the floating type or fixed-end type and anchoring the quay wall to a new pile row could provide an adequate seismic performance by conducting a series of shaking table model tests. Li [24] built a two-dimensional nonlinear dynamic finite element model through a large-scale shaking table test on the E-Defense vibration platform and studied the efficiency of a two-dimensional effective stress analysis pile and soil system in predicting the liquefaction-induced lateral spreading behavior. Ebeido [25] studied the influence of pile lateral expansion caused by liquefaction on pile response by four large vibration table tests of a laminated box. Wang [26] constructed a reinforced concrete bridge model composed of a single pier supported by a 2 × 2 pile group, studied the anti-seismic performance of pile-bearing bridges under different erosion conditions through a 1 g shaking table test, and revealed the failure mechanism of pile-bearing bridges under different erosion conditions. The above research mainly focuses on the bearing capacity and dynamic response of the straight pile and inclined pile, but there are few research studies on the failure mechanism of pile foundations caused by the dynamic interaction of liquefied-soil–pile-superstructure in the earthquake. In practical engineering, the inclined pile plays an important role in resisting the horizontal force caused by wind and wave loads and earth pressure. However, due to the complex dynamic bearing characteristics of the inclined piles, the research content is mainly the force-deformation characteristics, the bending moment distribution and the p–y curve of the inclined pile on the non-liquefied foundation [27,28,29]. There are few experimental studies on the dynamic response characteristics of the inclined piles, the relationship between the pile–soil interaction force, and the displacement in the liquefied soil layer. At present, the failure mechanism and dynamic behavior of inclined piles before and after soil liquefaction are not well explained. Moreover, the result of a comparative study on the lateral dynamic characteristics of the inclined pile and the straight pile in the liquefied soil under the action of an earthquake is less. The difference between the mechanical failure mechanism of the inclined pile and the straight pile in the liquefaction process of soil is also a key problem to be solved.
It is necessary to further explore the dynamic response characteristics of the straight and inclined pile groups and the distribution law of the bending moment of the pile body. The lateral dynamic response characteristics of the pile group–pile cap superstructure in non-liquefied sand and saturated liquefied sand are focused under the input of a sine wave. The research results analyze the advantages and disadvantages of the lateral bearing performance of the straight pile group and inclined pile group, caused by additional lateral deformation of liquefied soil under earthquake action, and reveal the dynamic interaction mechanism between liquefied soil and the pile group. In addition, this paper explores the influence of the thicknesses of saturated sand on the horizontal bearing capacity of the pile group in order to evaluate the horizontal bearing capacity of the pile group more reasonably and effectively, and provides a theoretical basis for the seismic design method of the pile group foundation with different thicknesses of the liquefied soil layer in the liquefaction site.

2. Test Introduction

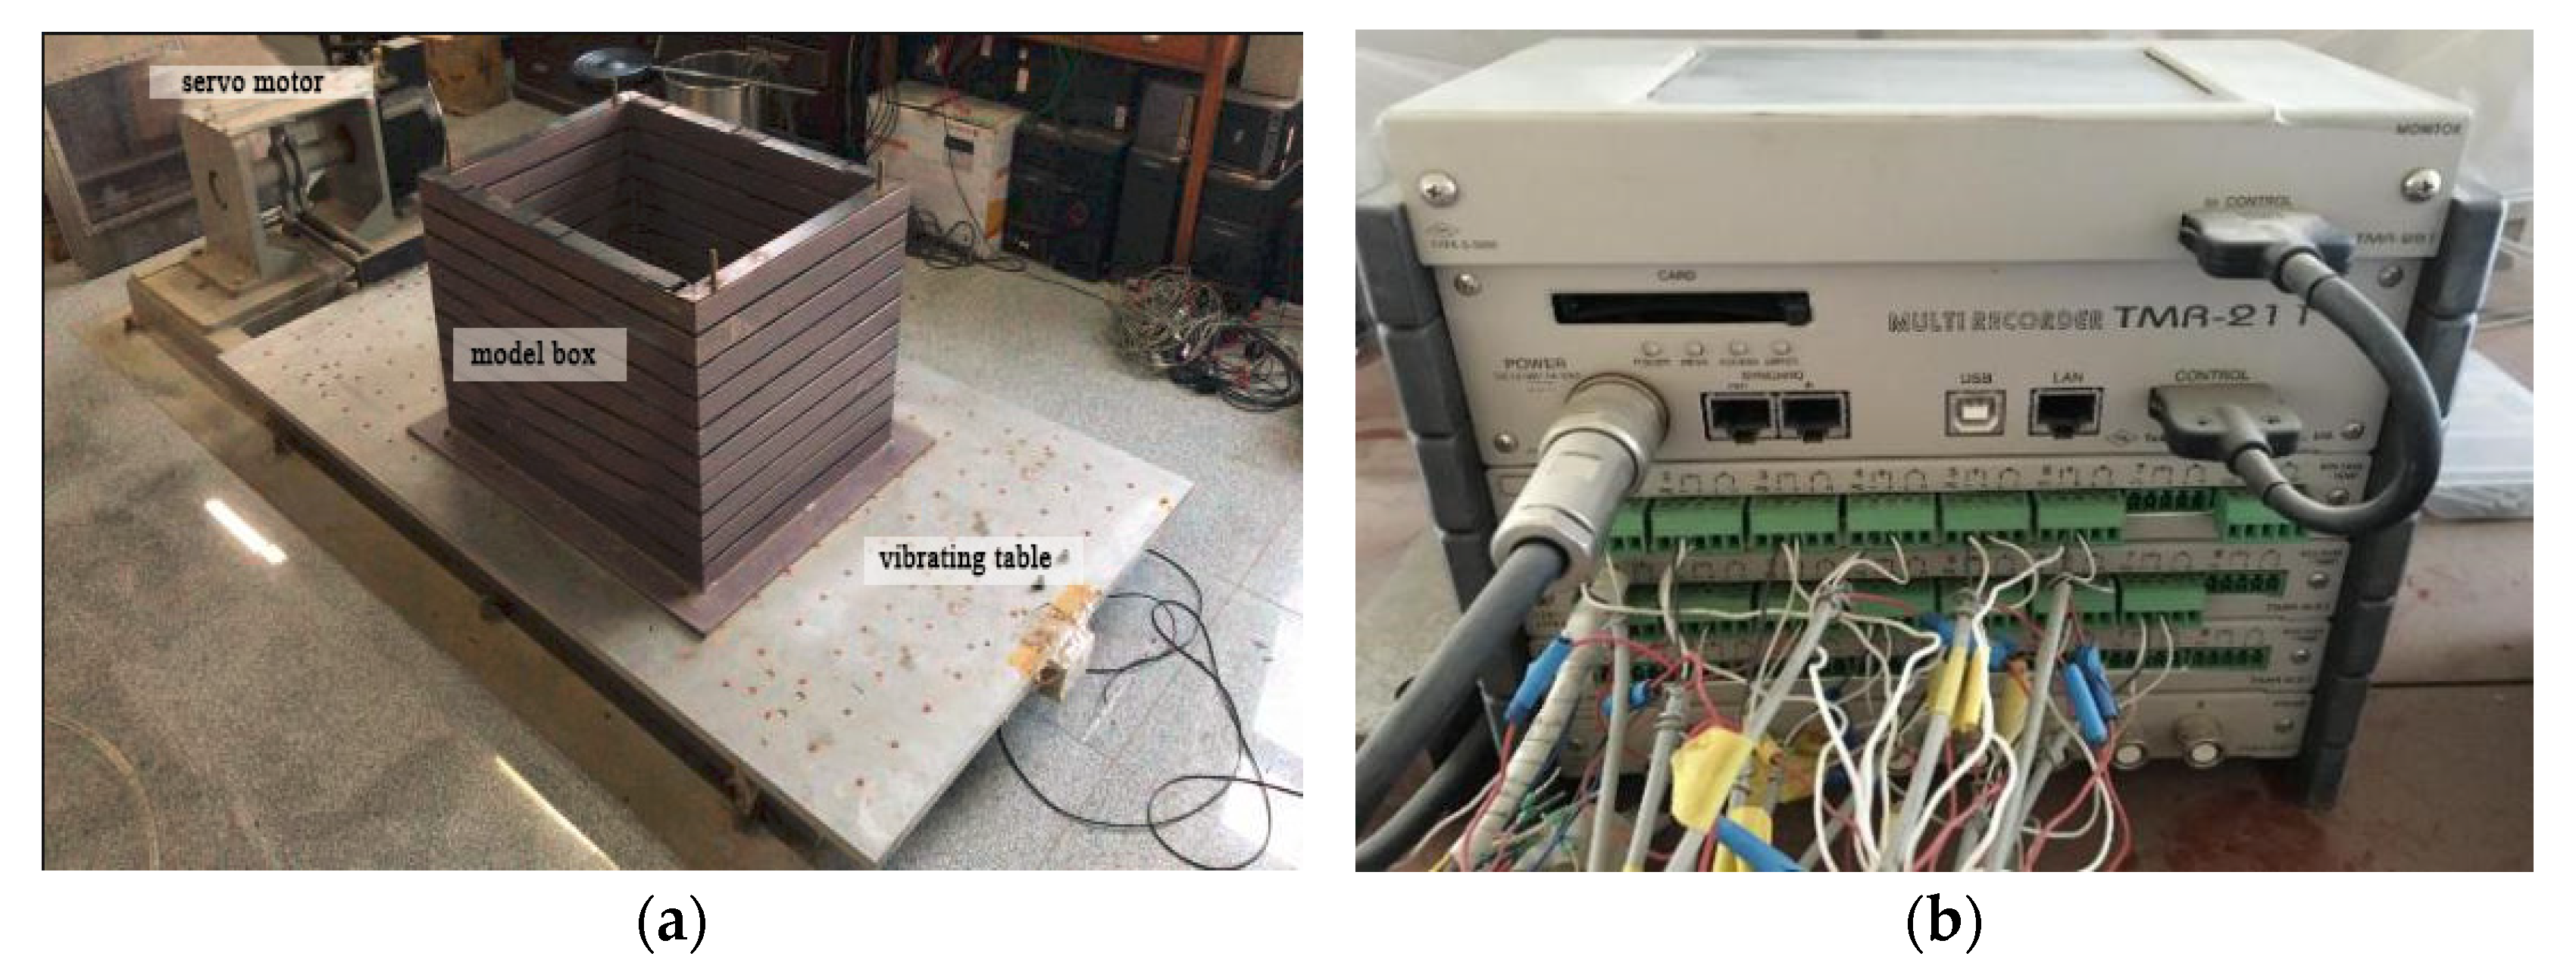
2.1. The Shaking Table and Model Box

In this test, the shaking table is a new, electromagnetically driven, all-digital control, one-dimensional shear vibration simulation table test system.
Figure 1 shows the main equipment of the shaking table and the TMR211 portable multifunction acquisition instrument. The size of the shear box is 800 mm × 600 mm × 500 mm. The small shear box selected in this test is made of steel, which is composed of 10 layers of stacked frames. Rubber blocks are set between the layers so that each layer can move relatively freely. In addition, a limit device is set outside the box, thus effectively reducing the influence of the lateral displacement and the boundary effect in the soil-dynamic seismic simulation test [30,31,32]. The rubber pad laid at the bottom of the model box is approximately 50 mm. Due to the small size of the pile and model box, the tips are inserted into the rubber pad to simulate the group bearing layer and play the role of fixing piles. A silty clay layer covers the surface of the saturated sand. It is approximately 50 mm thick so that the entire pile foundation is in the layered soil model. In addition, the sand and water will not overflow in the process of vibration because of the covering silty clay. The pore pressure will not decrease and will be closer to the actual situation.

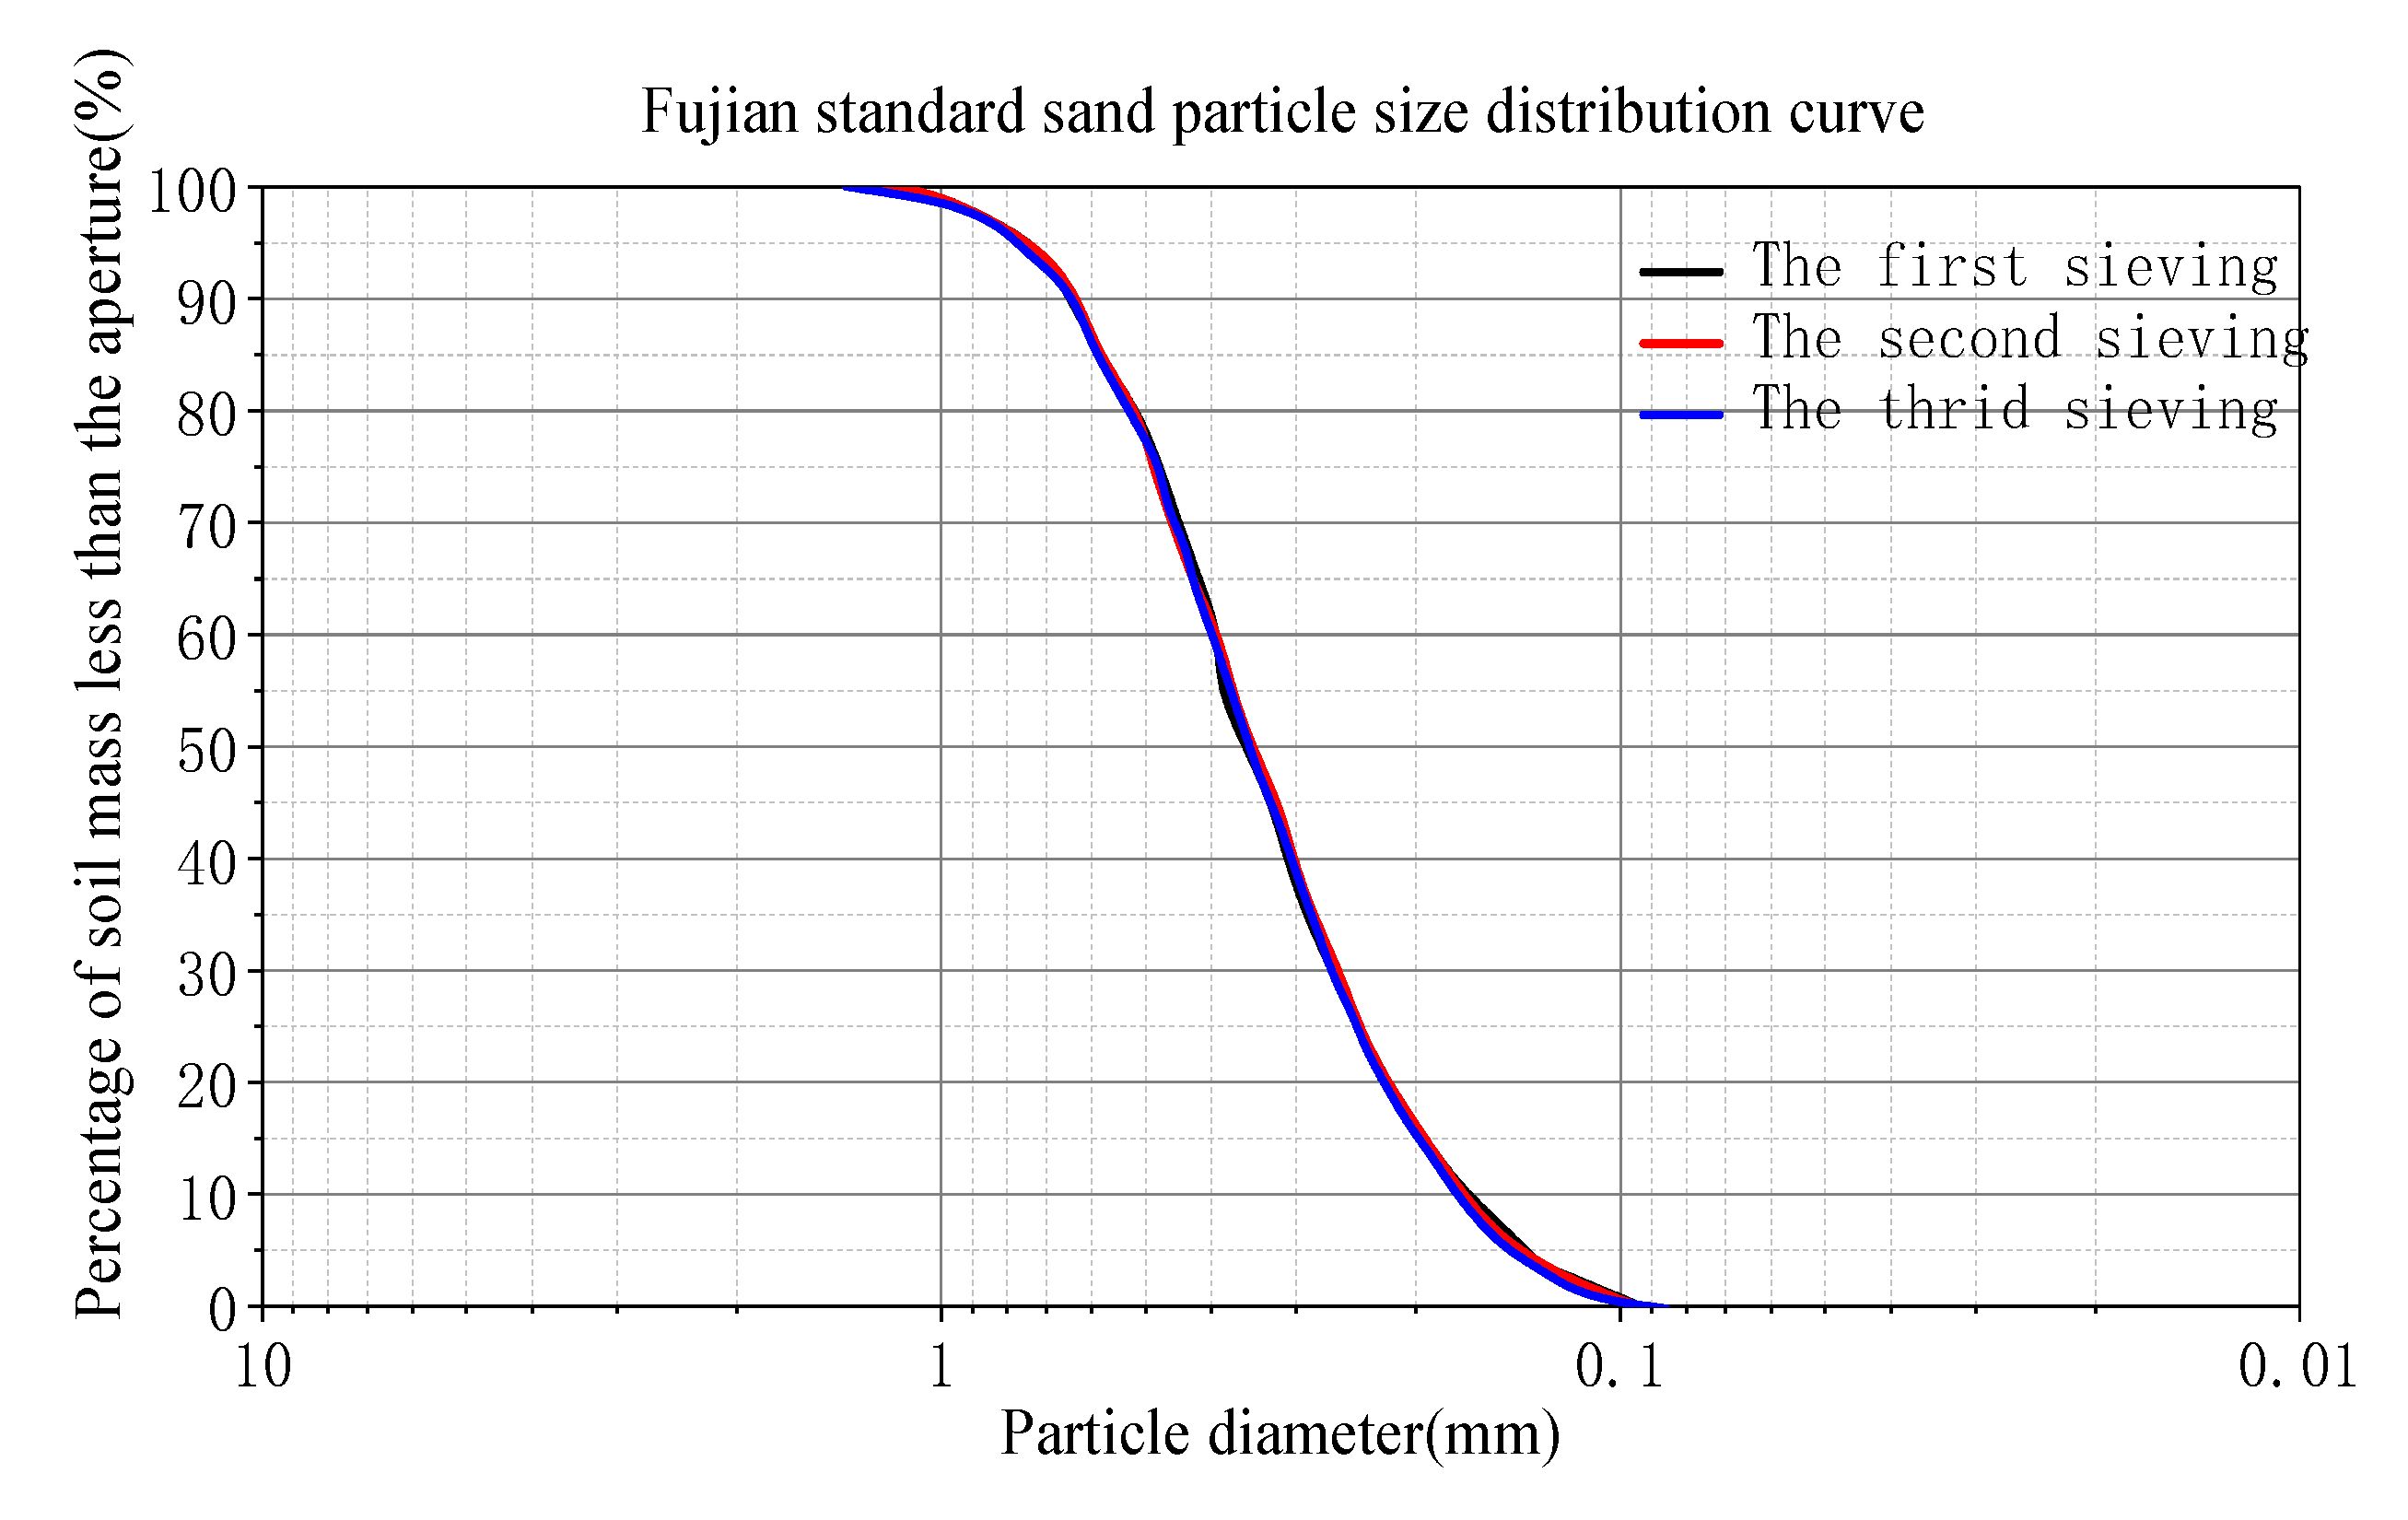
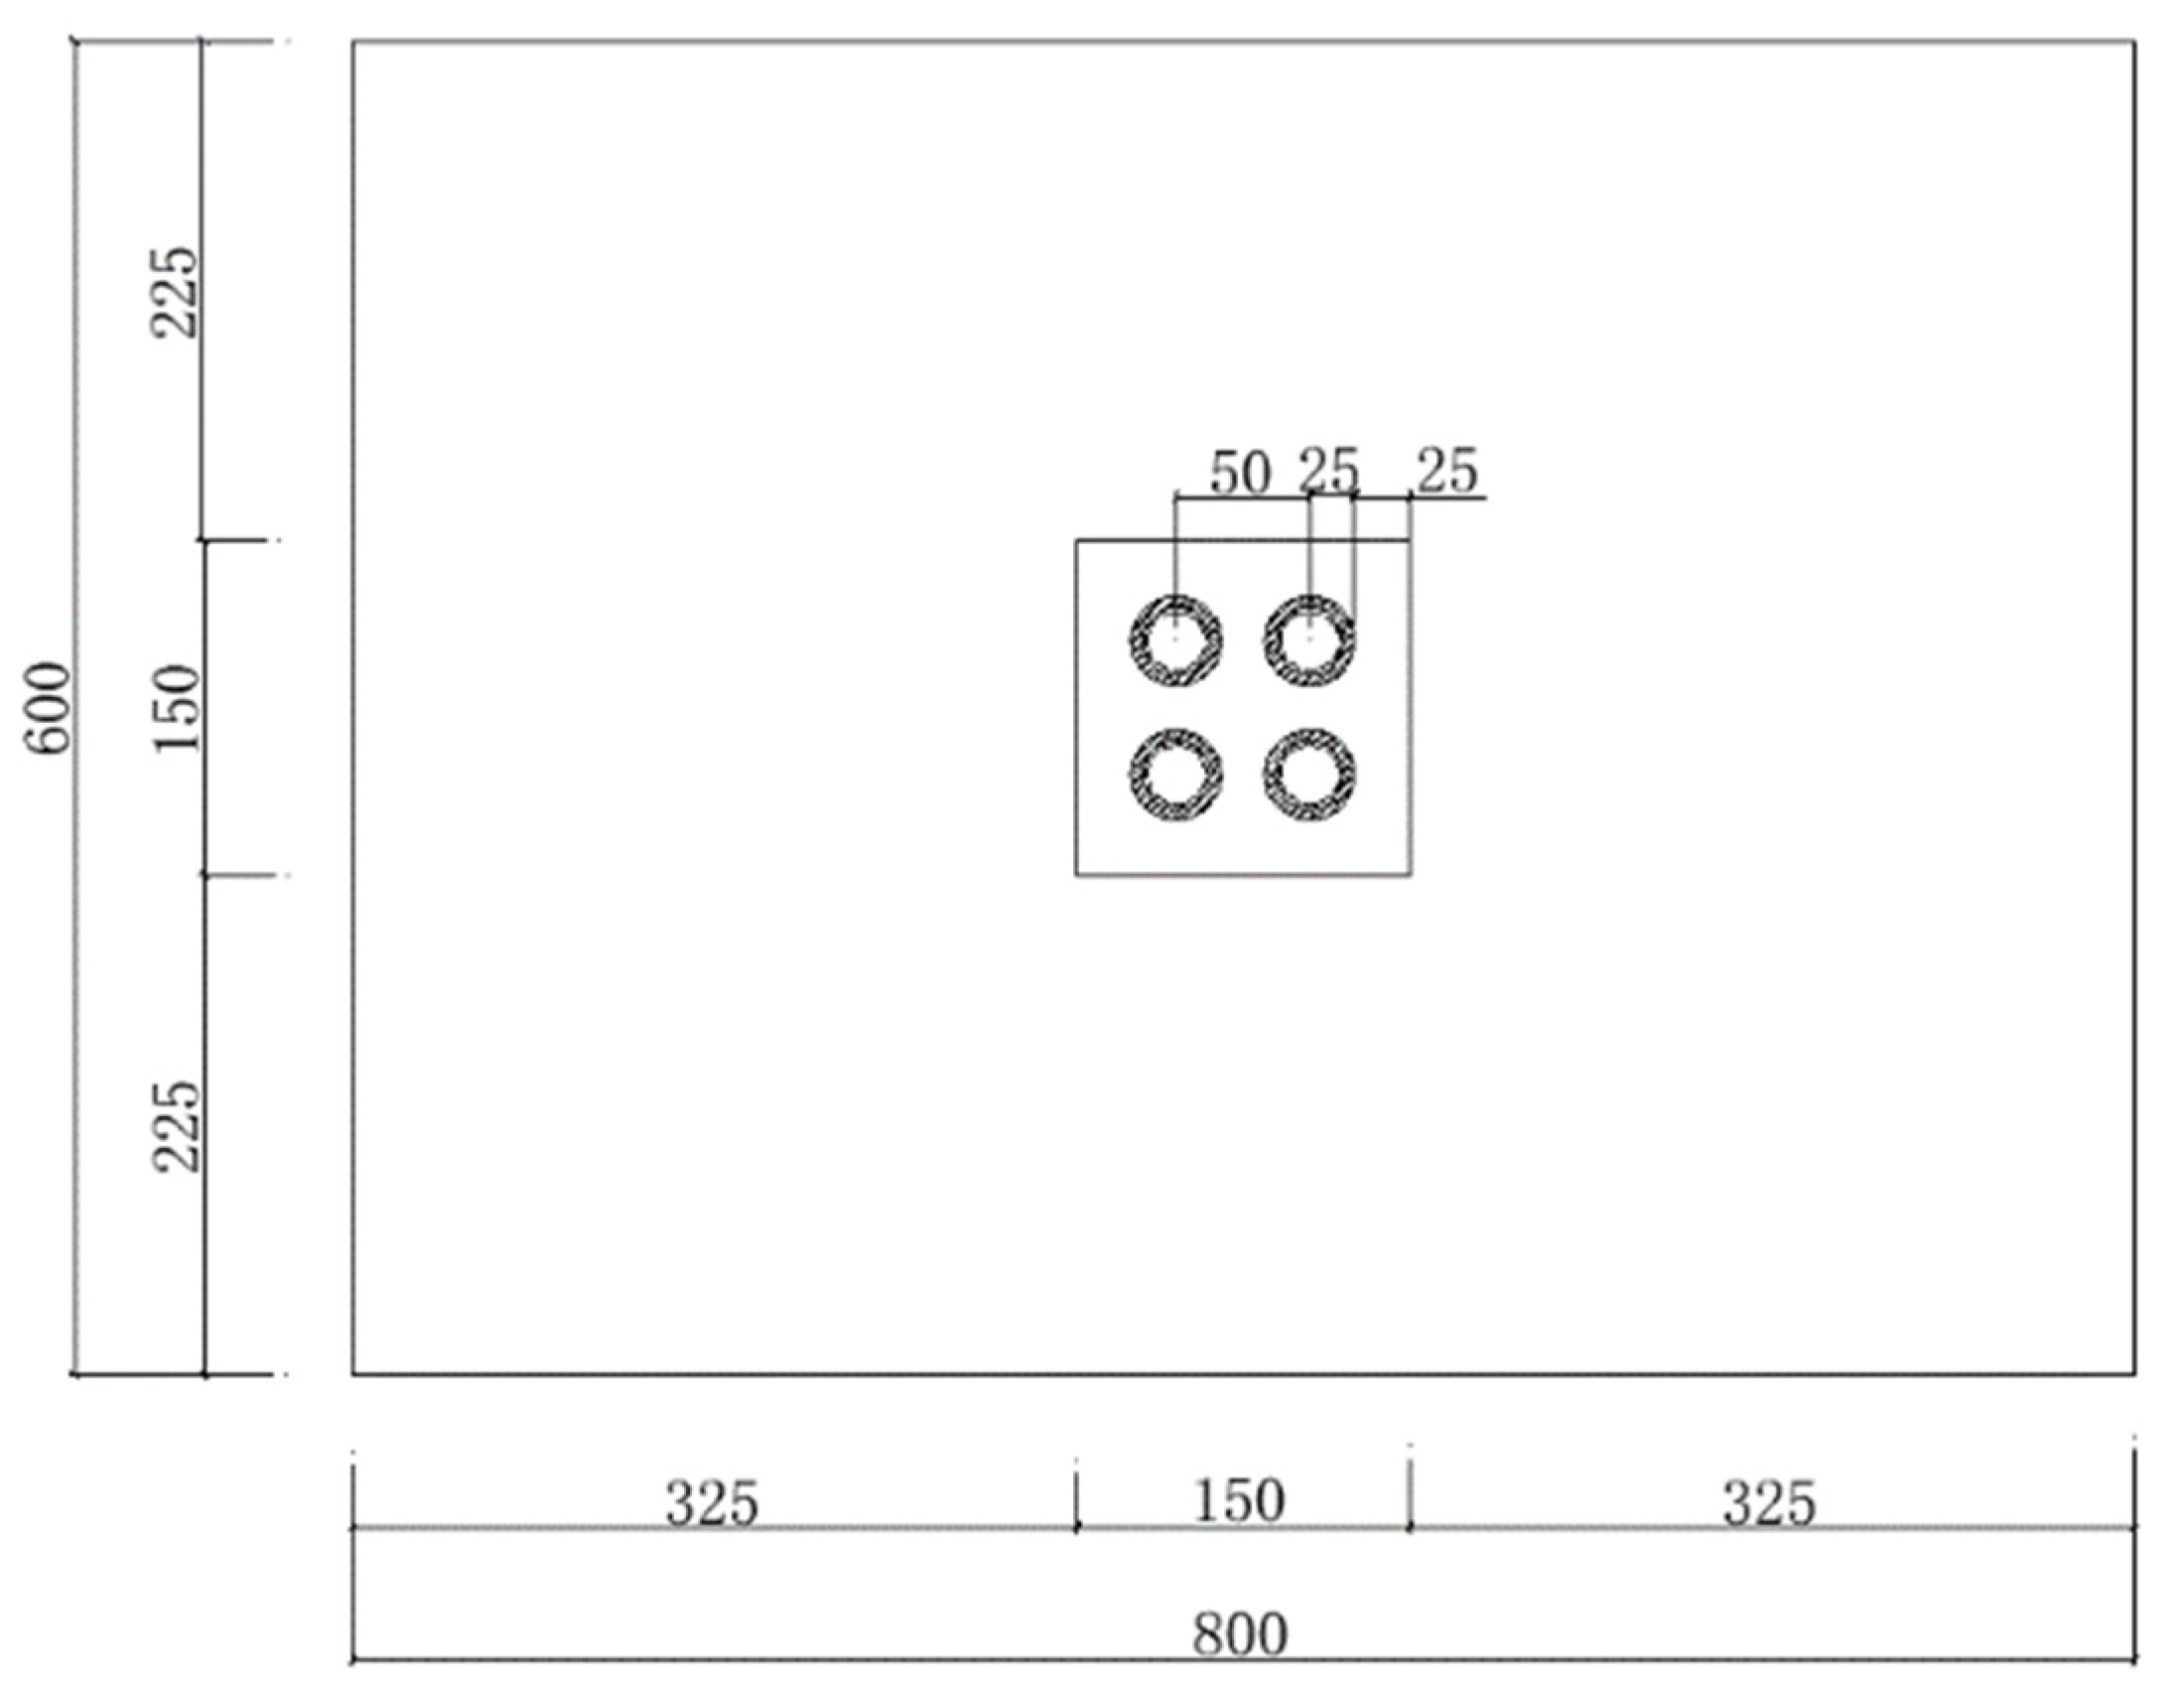
2.2. Model Soil, Model Pile, Cap and Superstructure Design

The soil sample was prepared by using Fujian standard sand with an obvious liquefaction condition and phenomenon. The basic properties of the sand are listed in Table 1. The basic properties of the overlaying clay layer are listed in Table 2. To reflect the state of the sand in the natural environment as realistically as possible, the experimental model is layered by the pluviation [33], which is divided into three layers. The thicknesses from the bottom to top are 120, 140, and 120 mm. The grain grading curve of the sandy soil is shown in Figure 2.
For the pile group system, the gravity distortion model is wholly considered by increasing the weight. The test model pile uses hollow polymethyl methacrylate (PMMA) to increase the weight by injecting fine iron sand into the hollow part. PMMA can simulate the characteristics of a prestressed concrete pipe pile to the maximum extent. It is more convenient to process, paste the grating and arrange the grating points. Considering the influence of soil on the pile response, the material selection of pile model is mainly based on the similarity of the bending stiffness. Therefore, PMMA is selected as the manufacturing material of the model pipe pile. Domestic and foreign scholars have conducted significant amounts of research on the optimal angle of inclined piles, combined with the construction difficulty of inclined piles in actual engineering [34], suggesting that the inclination angle of a pile foundation generally does not exceed 15°. At the same time, as the pile inclination increases, the resistance of inclined piles to the vertical and horizontal load has a tendency to decrease. Considering the research results of predecessors and the difficulty in making the test components, the angle of the inclined pile group is chosen as 12°. Hollow plexiglass pipe piles are used for the 2 × 2 straight pile group, the 2 × 2 inclined pile group, and the piles are arranged at equal intervals with a distance of 60 mm. The outer diameter is 30 mm, the inner diameter is 20 mm, the sleeve thickness is 5 mm, the pile length is 720 mm, and the Young’s modulus is 2.3 GPa. The side pile is 25 mm away from the edge of the pile cap, and the size of the cap made of iron is 150 mm × 150 mm × 40 mm.
The pile layout is shown in Figure 3. The circular sleeve structure connects the pile with the pile cap and welds it onto the pile cap. Therefore, the angle of the inclined pile will not change. The inner diameter is slightly smaller than the outer diameter of the plexiglass tube. The thickness of the round sleeve is 5 mm. During the test, the plexiglass tube is inserted into the circular sleeve and fixed with a top screw. The superstructure is in the form of a single column–mass block. The total mass of the cap, sleeve and superstructure is approximately 12 kg.

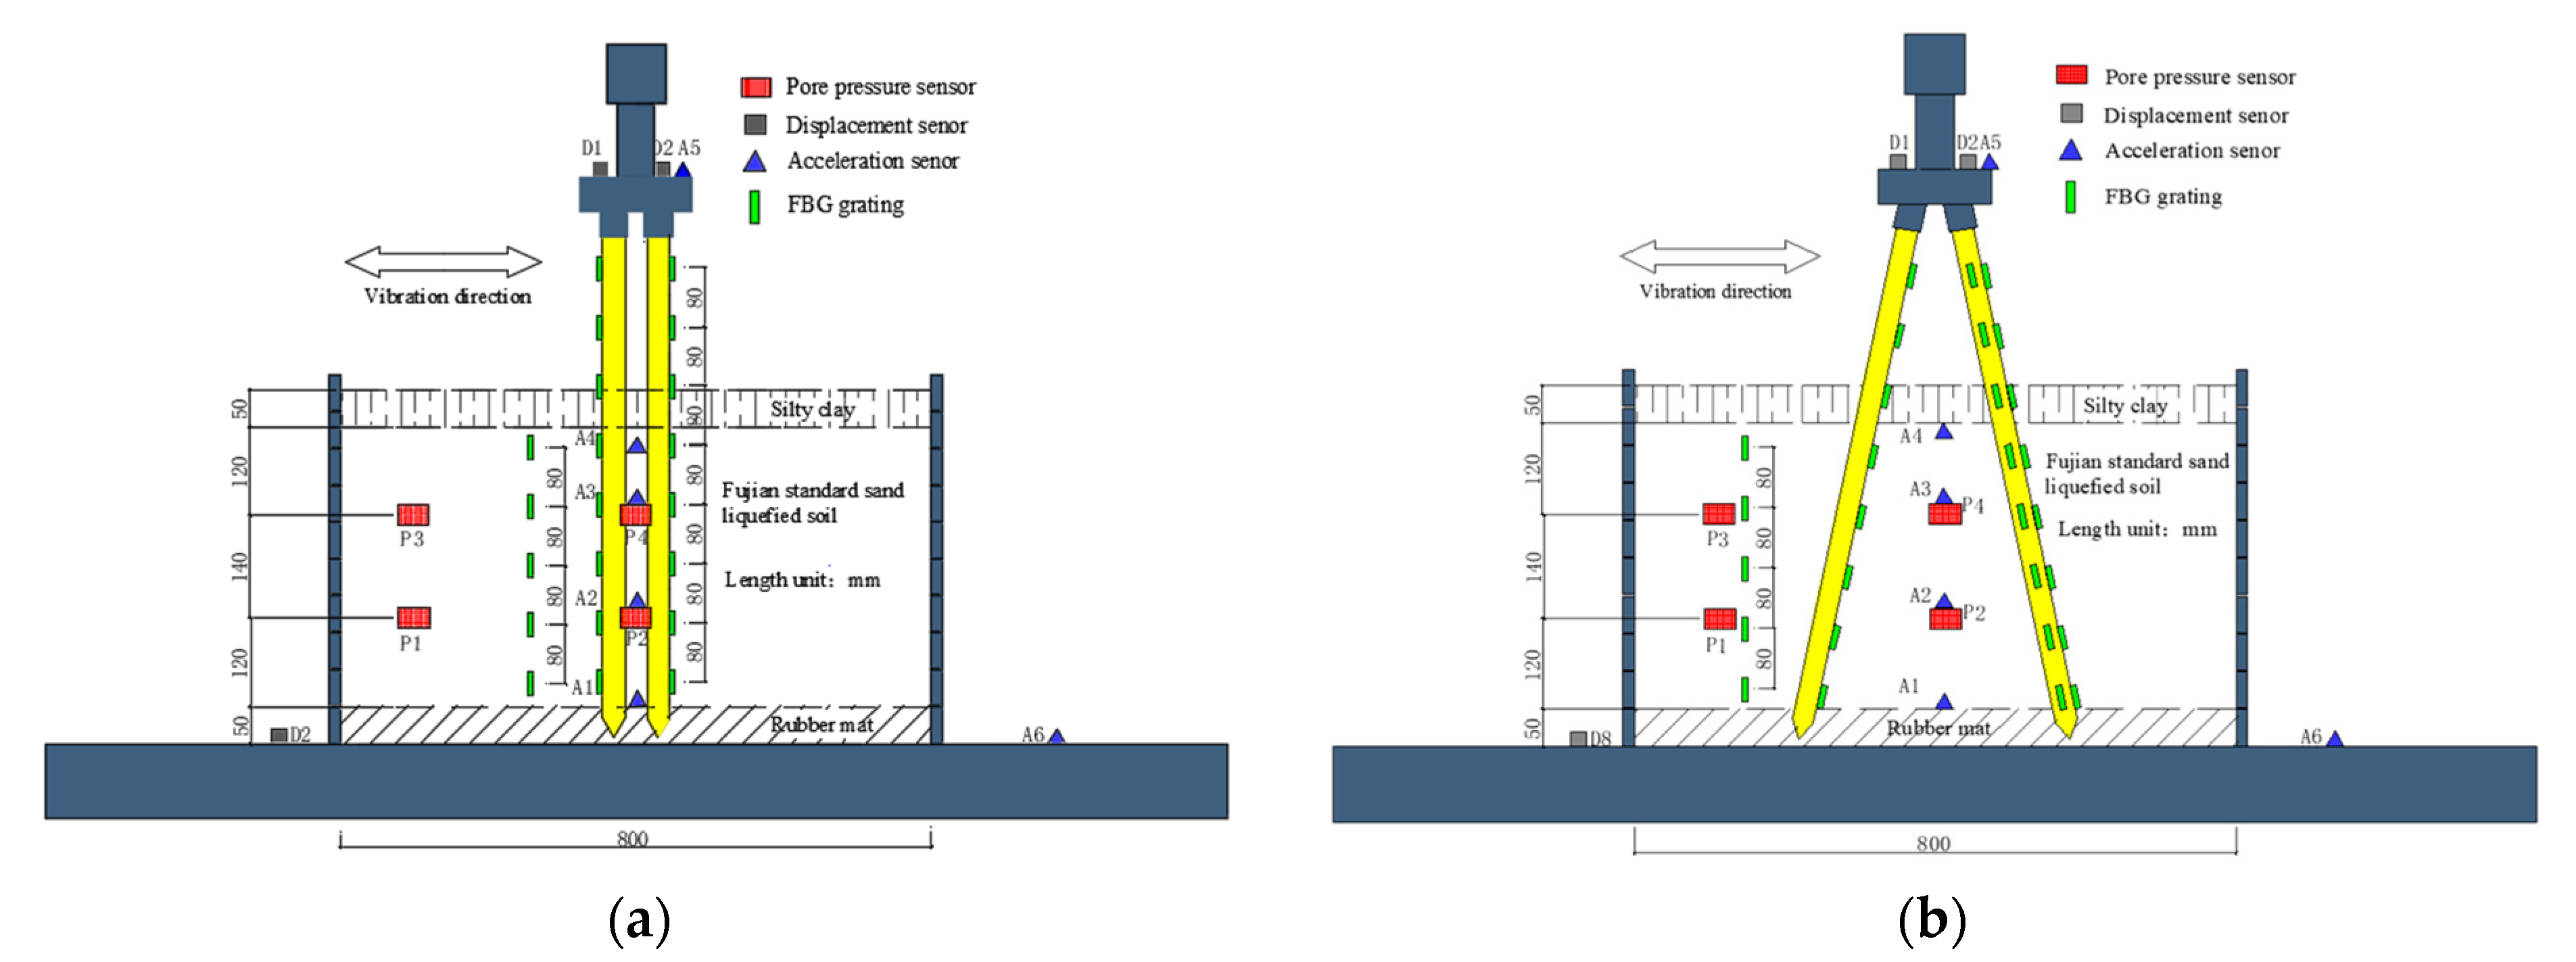
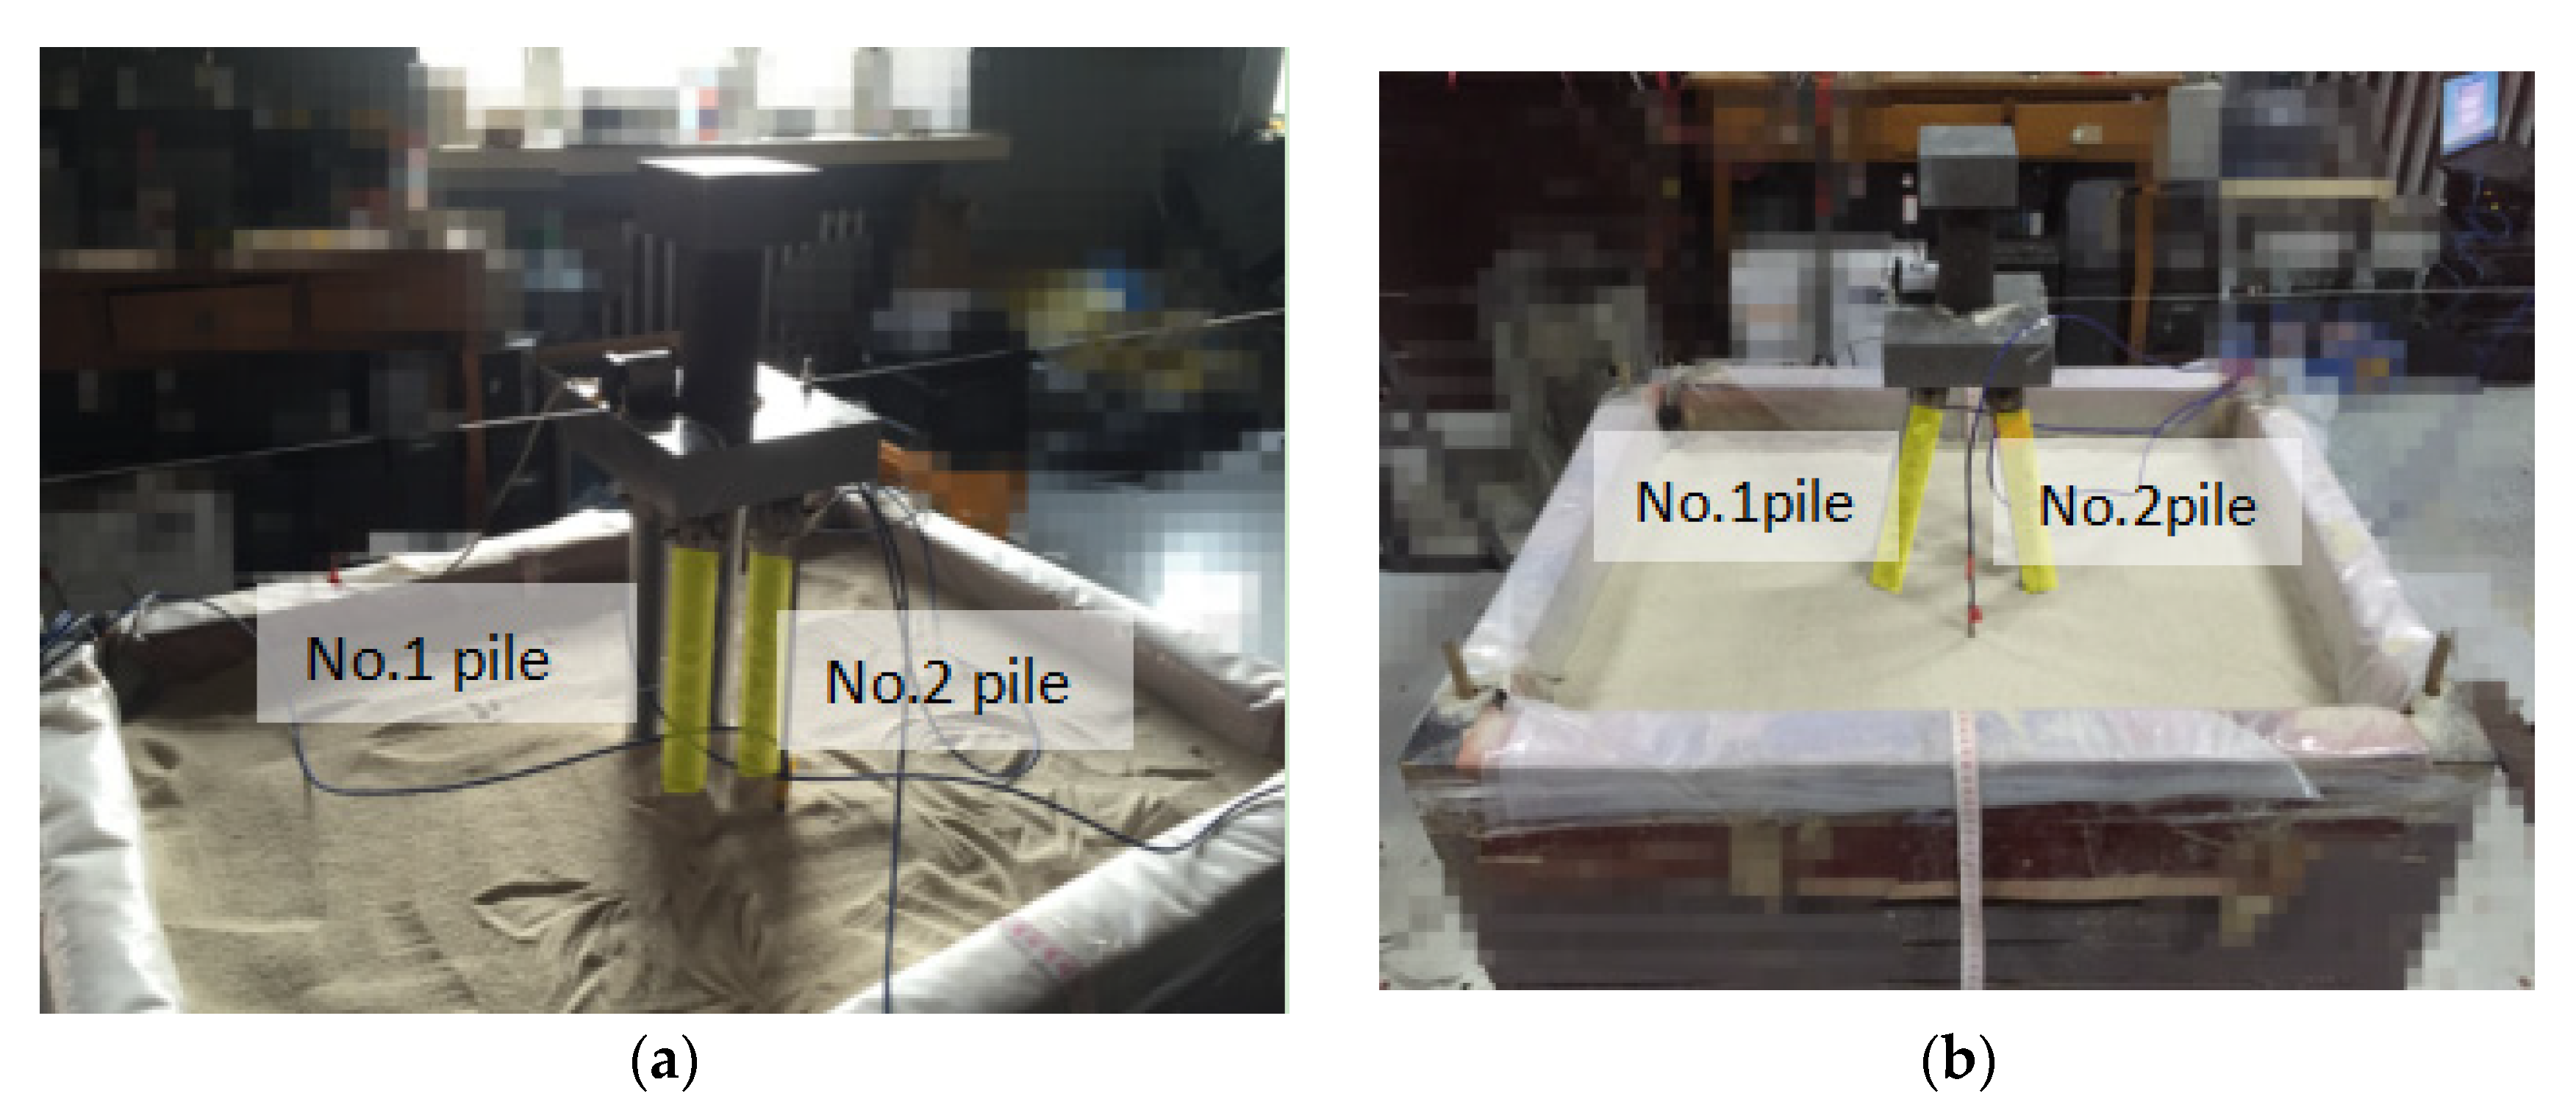
2.3. Sensor Monitoring and Placement

Many parameters need to be monitored during the test, such as the acceleration and displacement of the table and pile, the pore water pressure of the saturated sand, the deformation of the soil layer, the displacement of the pile body and other parameters. Therefore, the acceleration sensors, pore water pressure sensors, displacement sensors, fiber Bragg grating (FBG) sensing systems, etc., are arranged in the test. FBG is widely used as a sensor with stable performance [35]. Due to the symmetry of the pile group system, the FBG sensing system is used to simultaneously measure the dynamic strain of the piles of the left front pile and the right front pile, which ensures the accuracy and synchronization of the test data. The grating points are set at positions of 4.5, 12.5, 20.5, 28.5, 36.5, 44.5, and 52.5 cm from the bottom of the pile, respectively. Five grating points with the same spacing of 8 cm are arranged thereon for monitoring the soil displacement. The specific layout is shown in Figure 4.

2.4. Test Condition

This is a test of sinusoidal waves of straight and inclined piles in the 380 mm non-liquefied soil (dry sand) and saturated sands 300 and 380 mm thick. The sine wave input frequency is 3 Hz, and the peak acceleration is 0.15 g (g = 10 m/s2). The specific test conditions are shown in Table 3.

3. Comparative Analysis of the Lateral Dynamic Response of Pile Groups

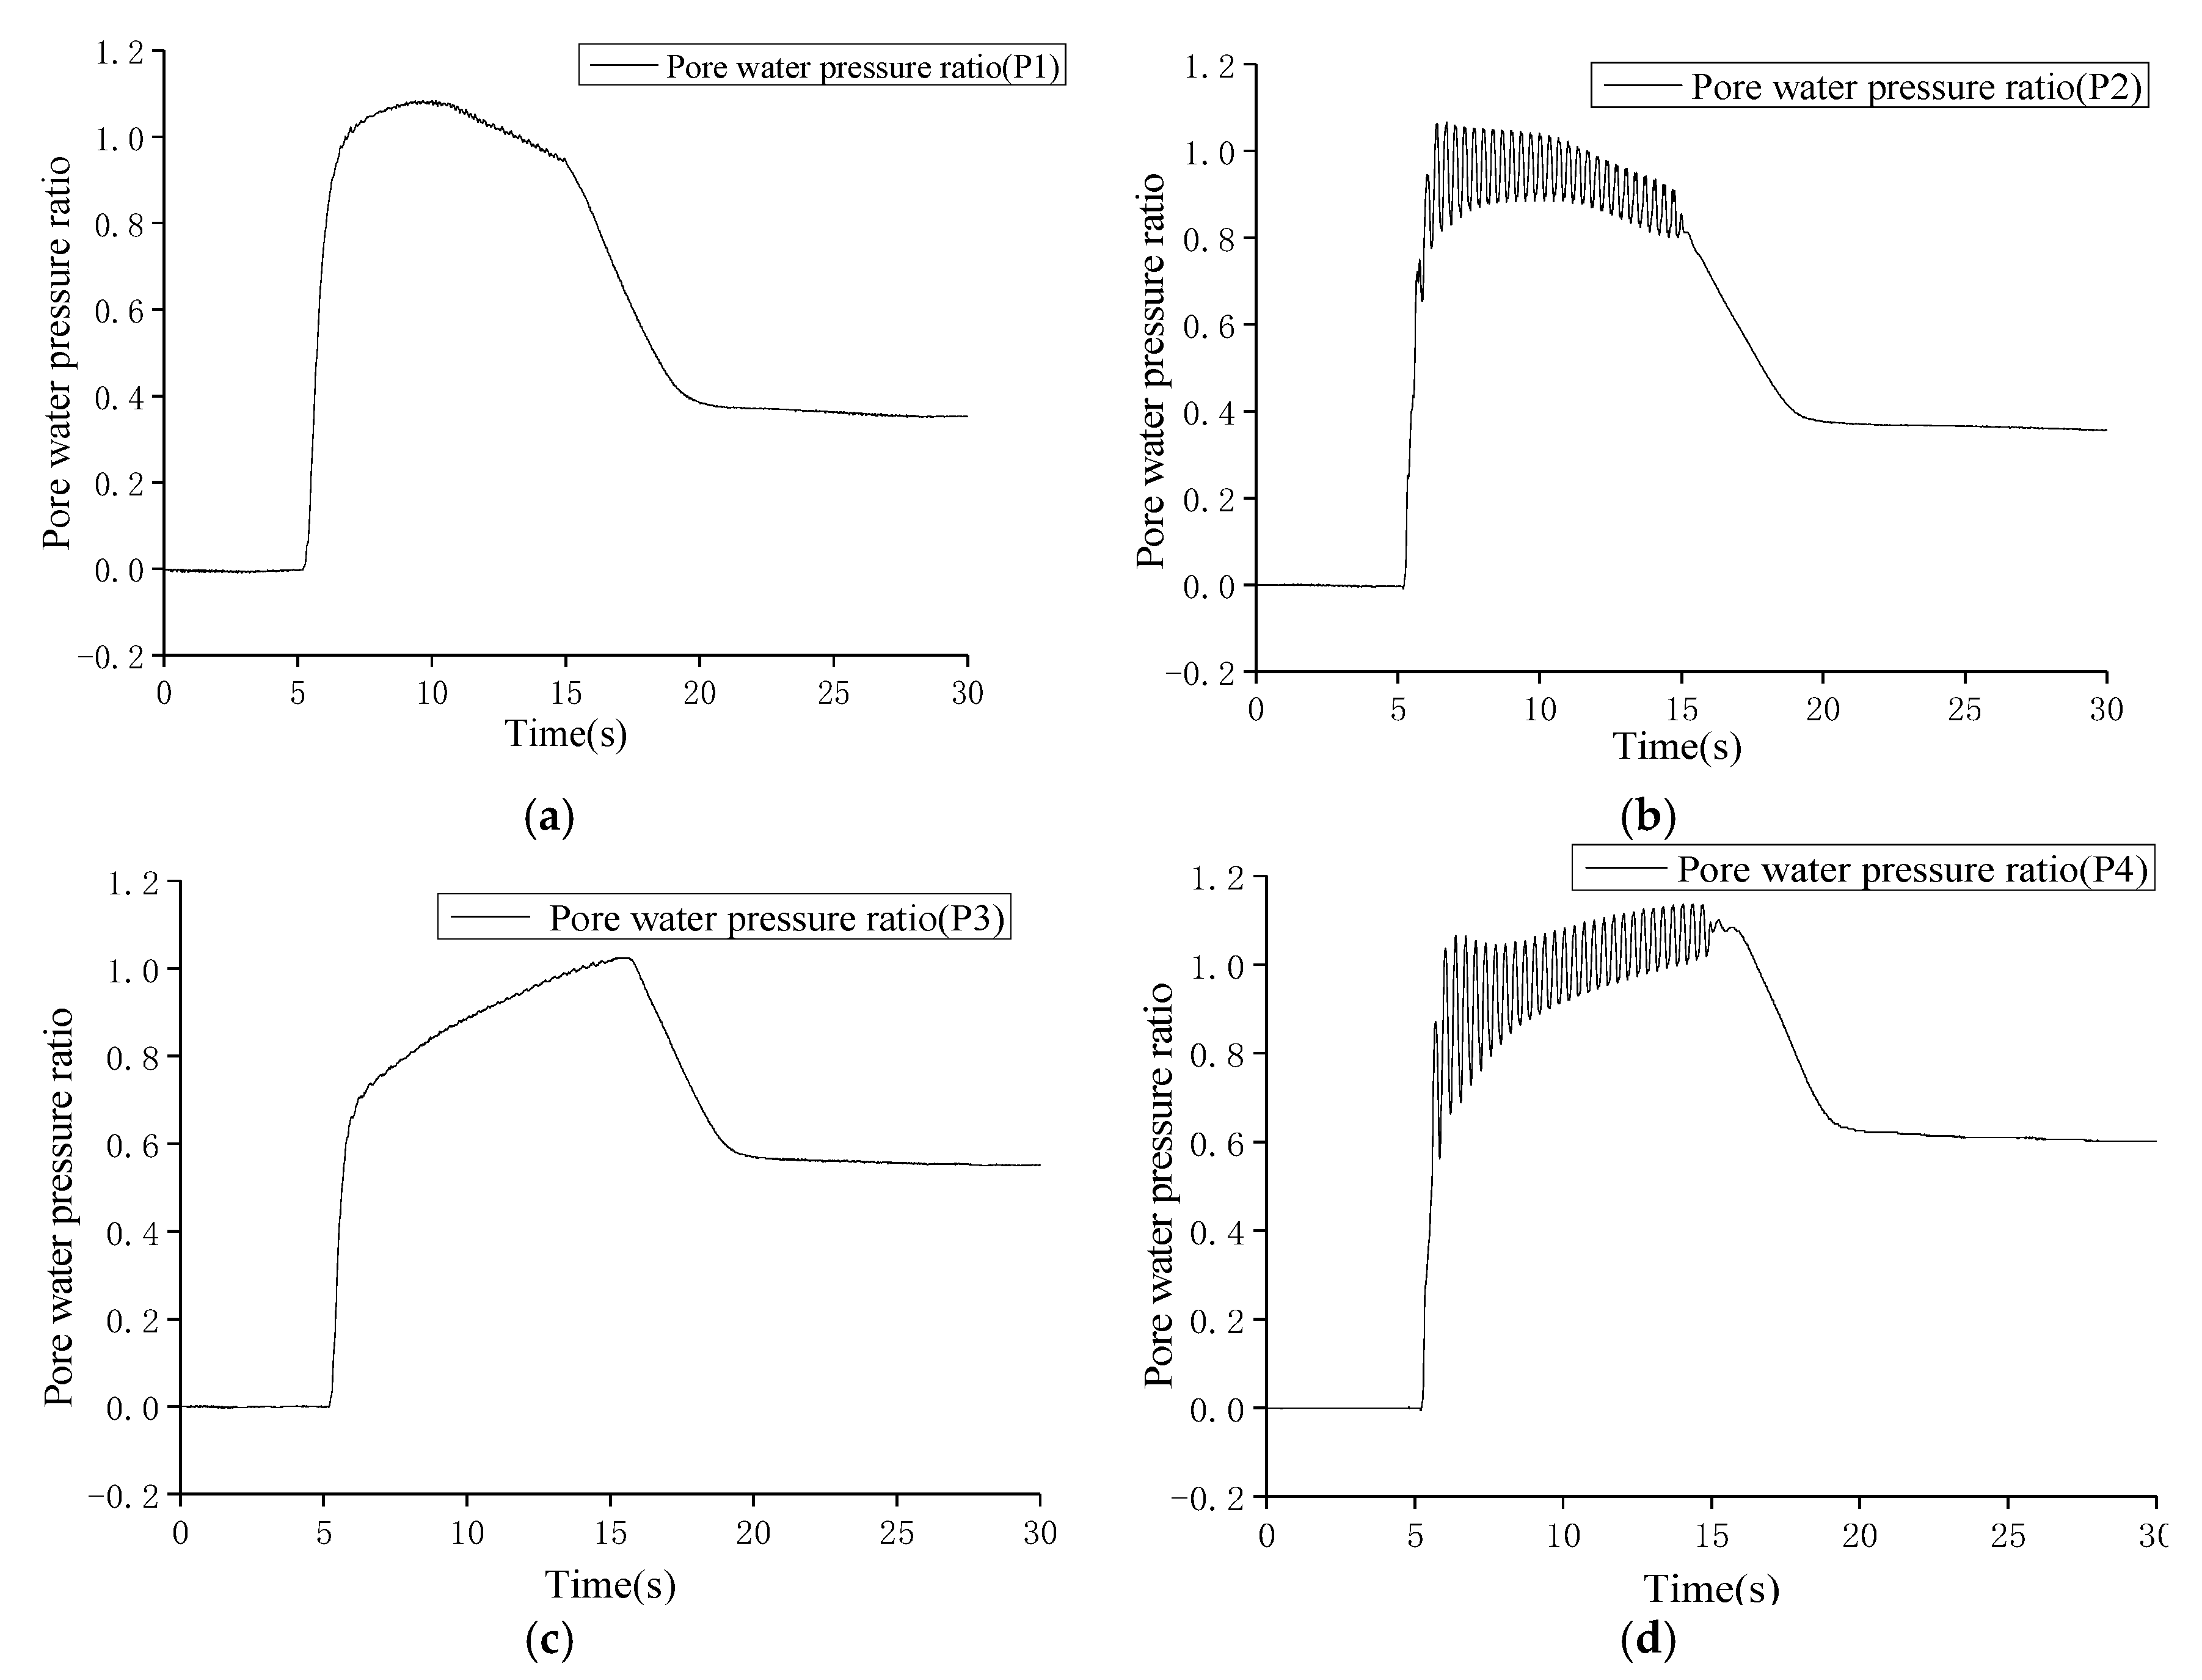
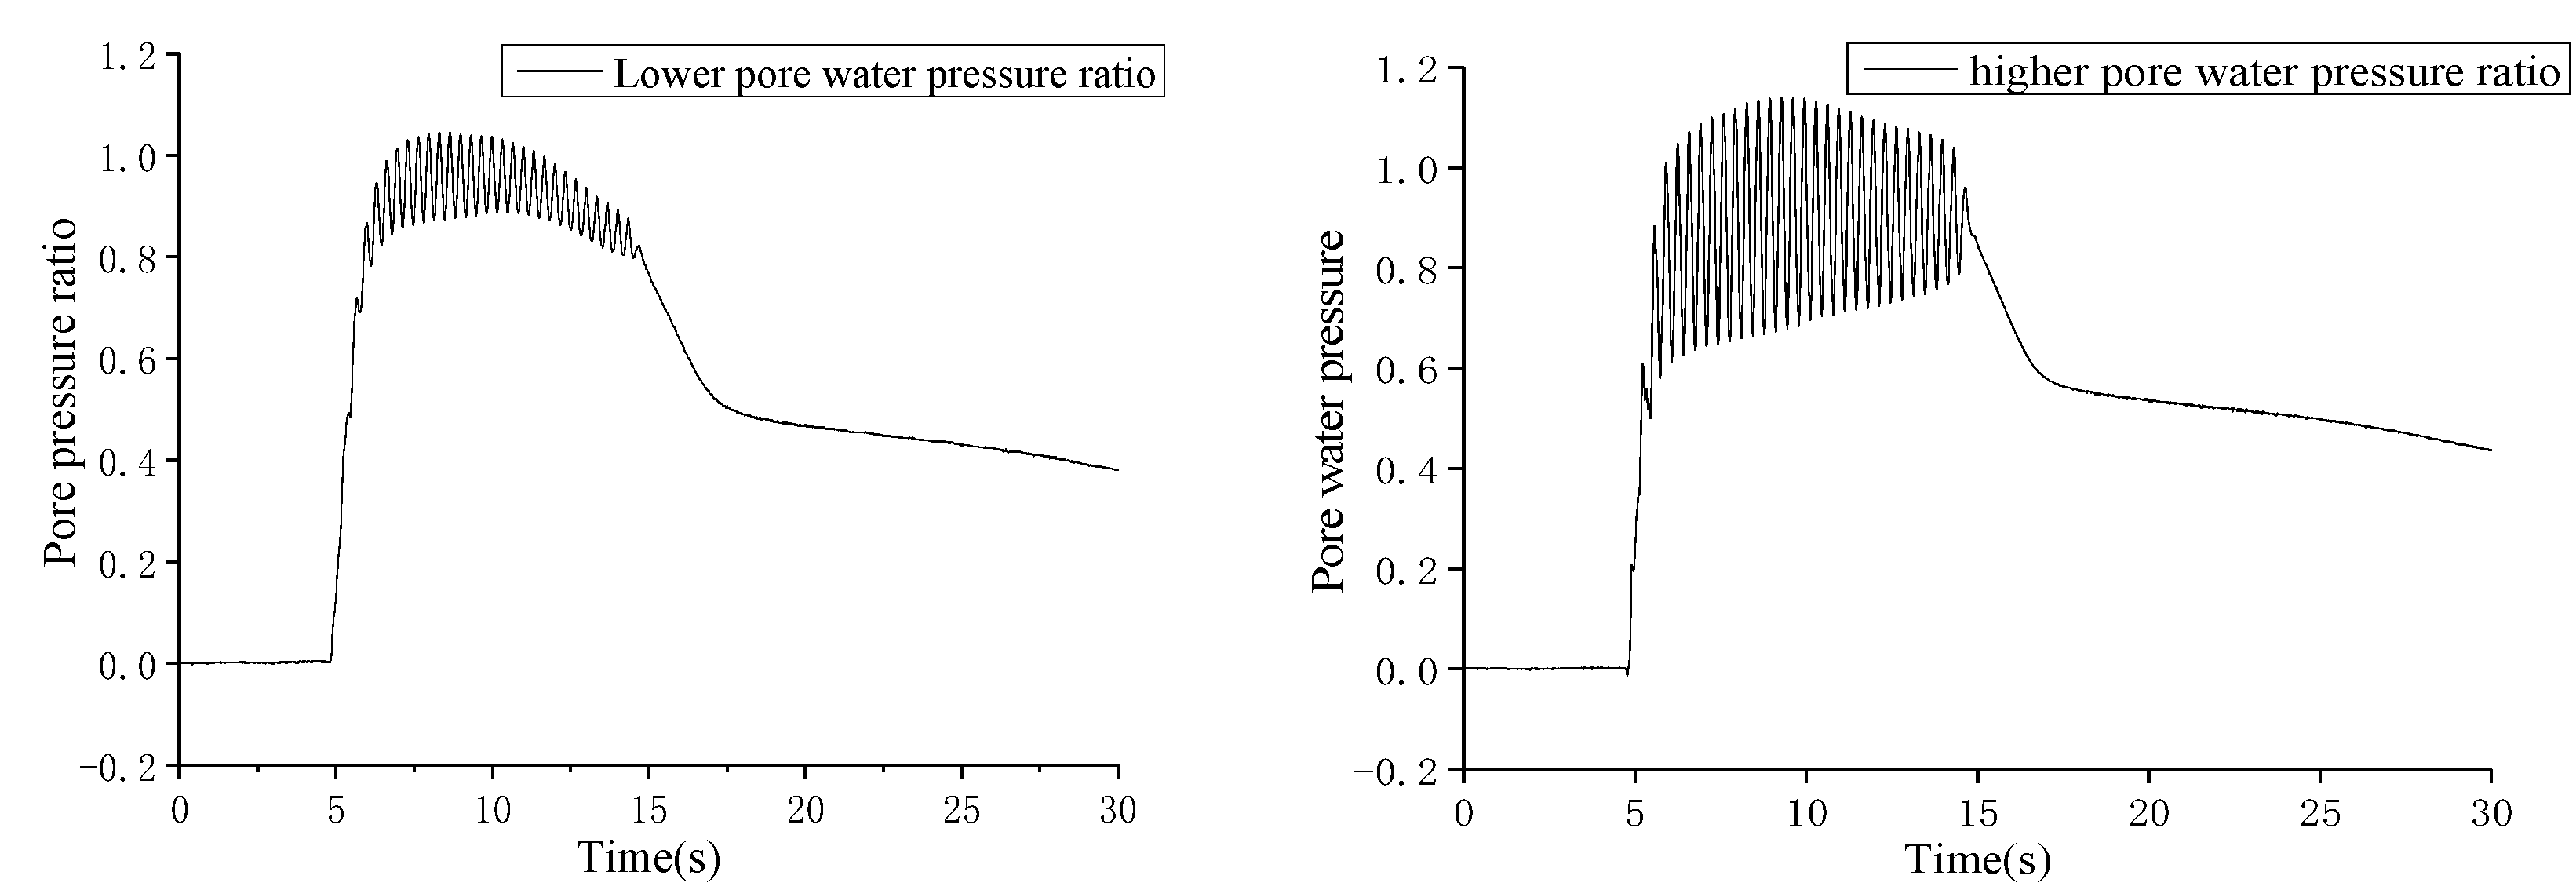
3.1. Pore Water Pressure and Experimental Phenomena in Saturated Sand

Figure 5 shows the time histories of the pore water pressure in the 300 mm saturated sand under a sine wave input. When the vibration begins, the pore water pressure rises significantly. It rises to the maximum rapidly, within 5 s after the vibration starts. At this moment, the soil has completely liquefied, accompanied by the rapid emission of gravel and the phenomenon of sand blasting and water gushing. The external pore pressure sensor of the pile is closer to the box, and the boundary effect caused by the vibration box has an impact on the pore pressure in the process of vibration. The fluctuation of the outer pore pressure ratio is more obvious. However, whether it is the outer or inner pore pressure ratio, the overall trend is the same. The pore pressure reference line is approximately 1.0.
The time histories for the acceleration in the 300 mm saturated sand are shown in Figure 6. The soil acceleration also declines sharply after a short amplification. As the pore pressure increases, the soil acceleration increases slightly and then decreases. The reason is that the interaction between the accelerometer and the soil is reduced when the soil is liquefied so that the accelerometer is suspended in the liquefied sand. The transmission effect of the soil acceleration is deteriorated. Through the above arguments, it can be proven that the soil has liquefied. The time histories for the acceleration in the 300 mm saturated sand are similar to those in the 380 mm saturated sand.

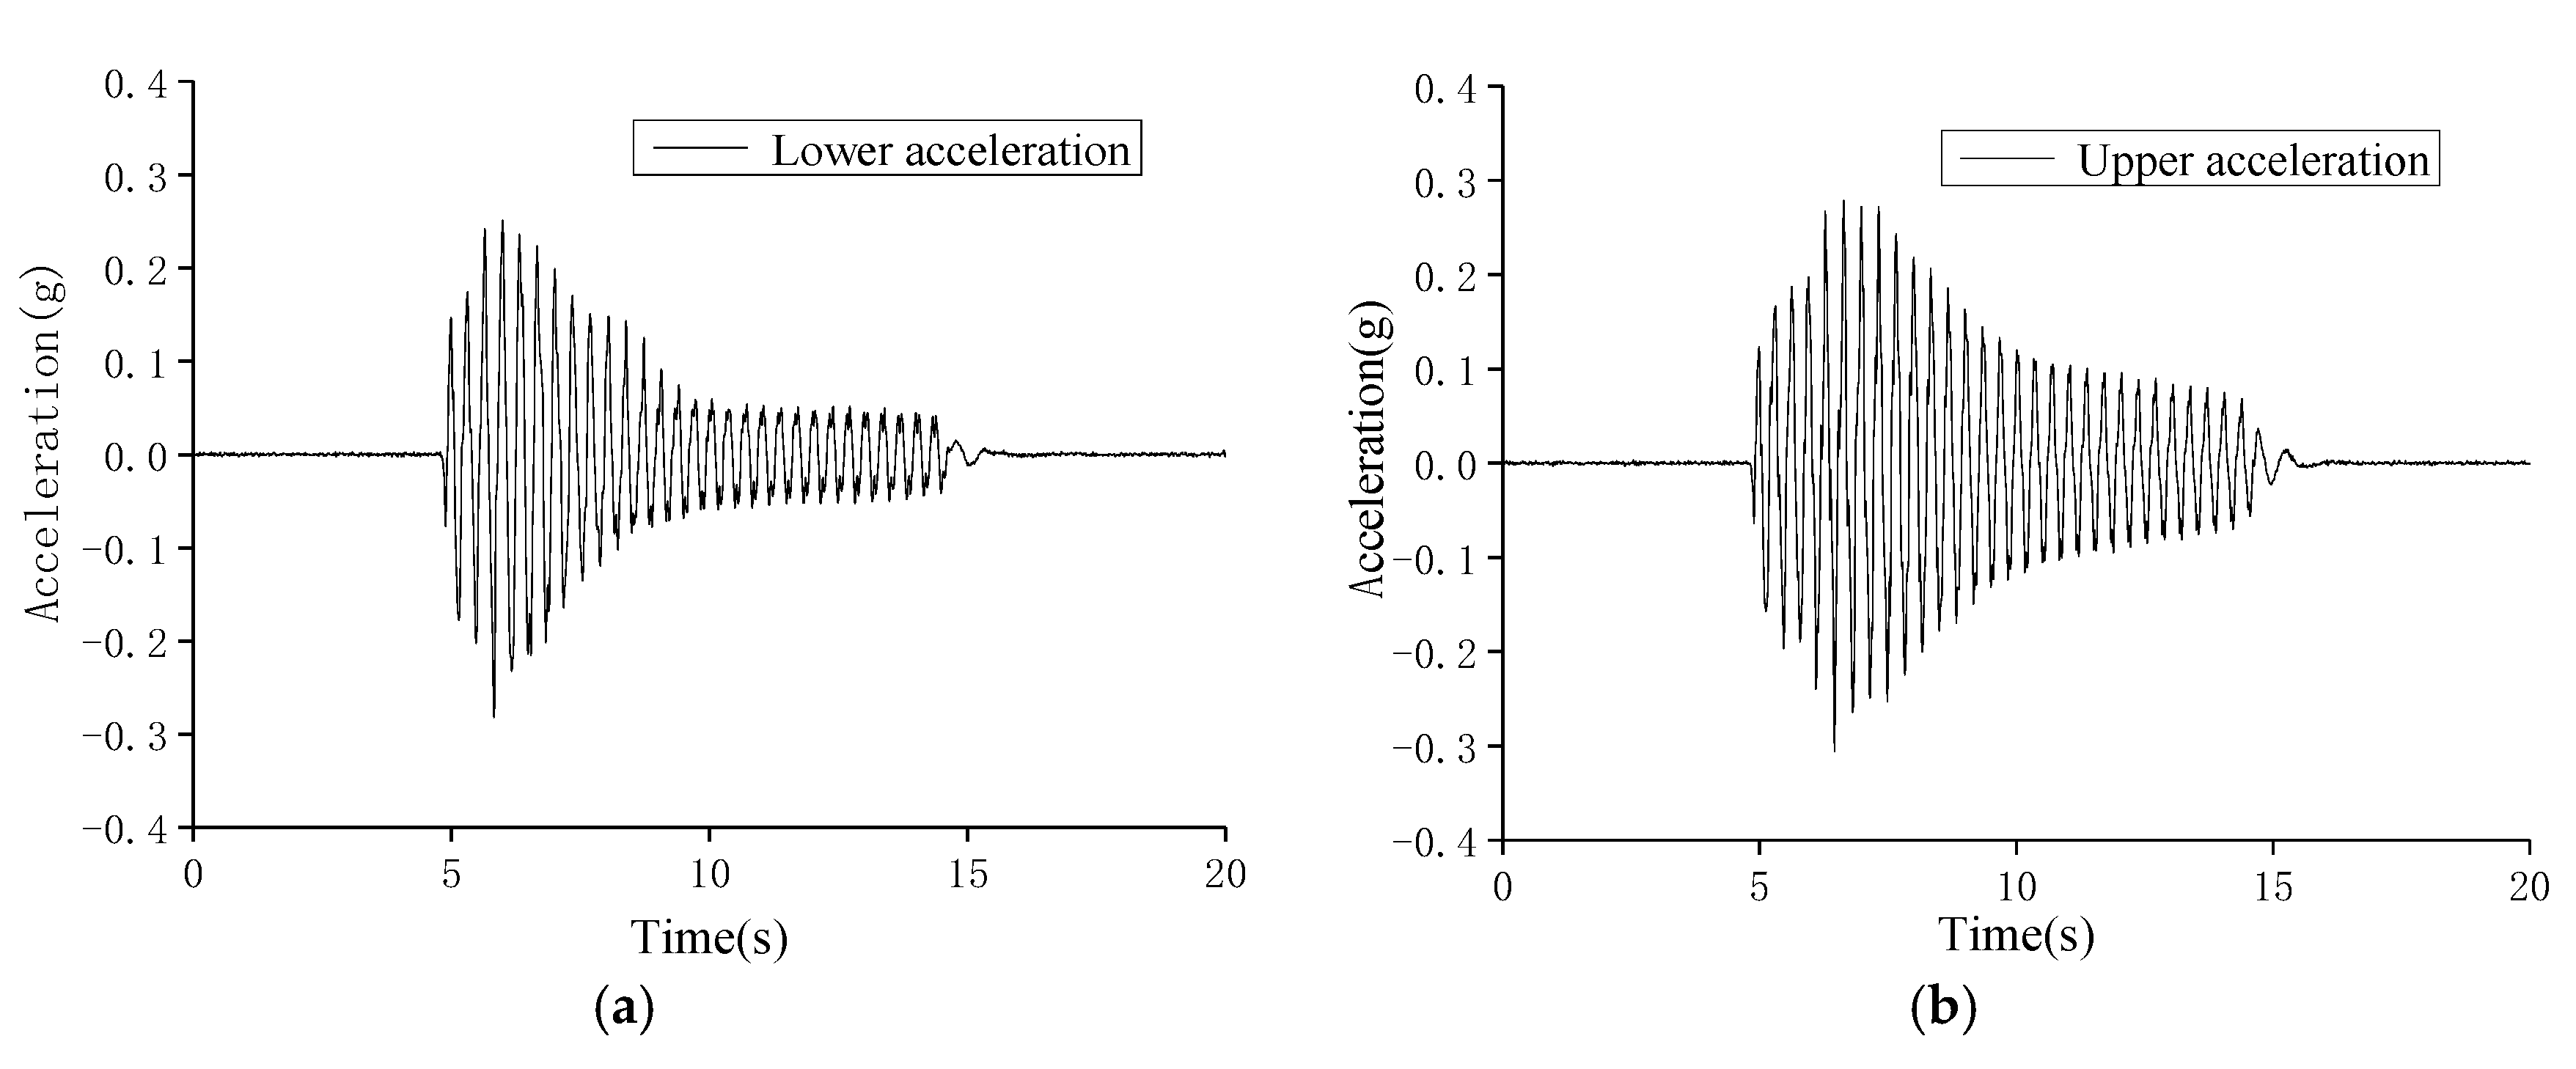
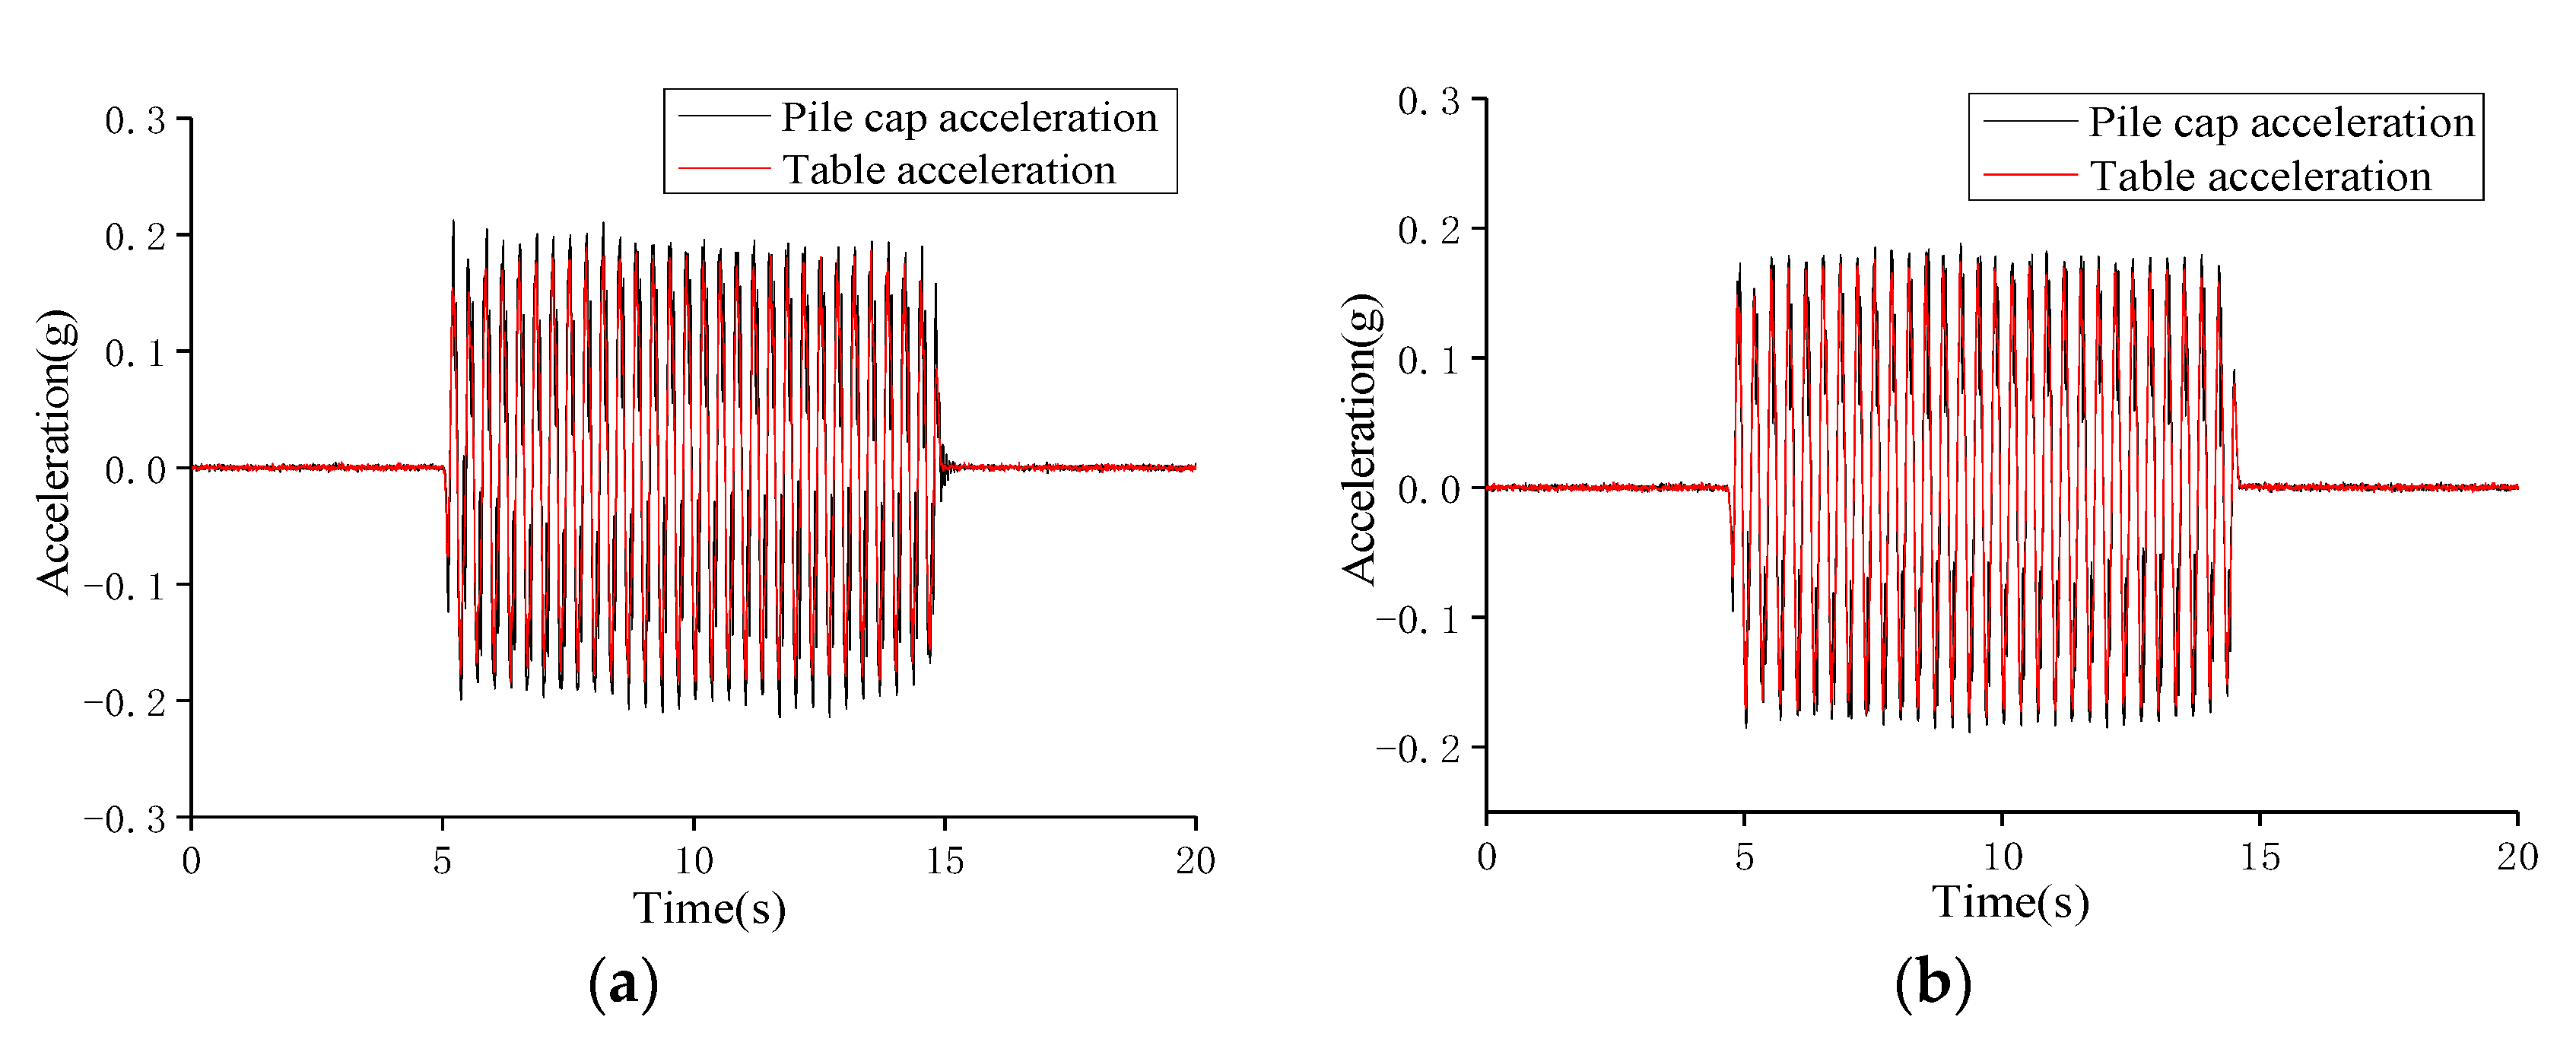
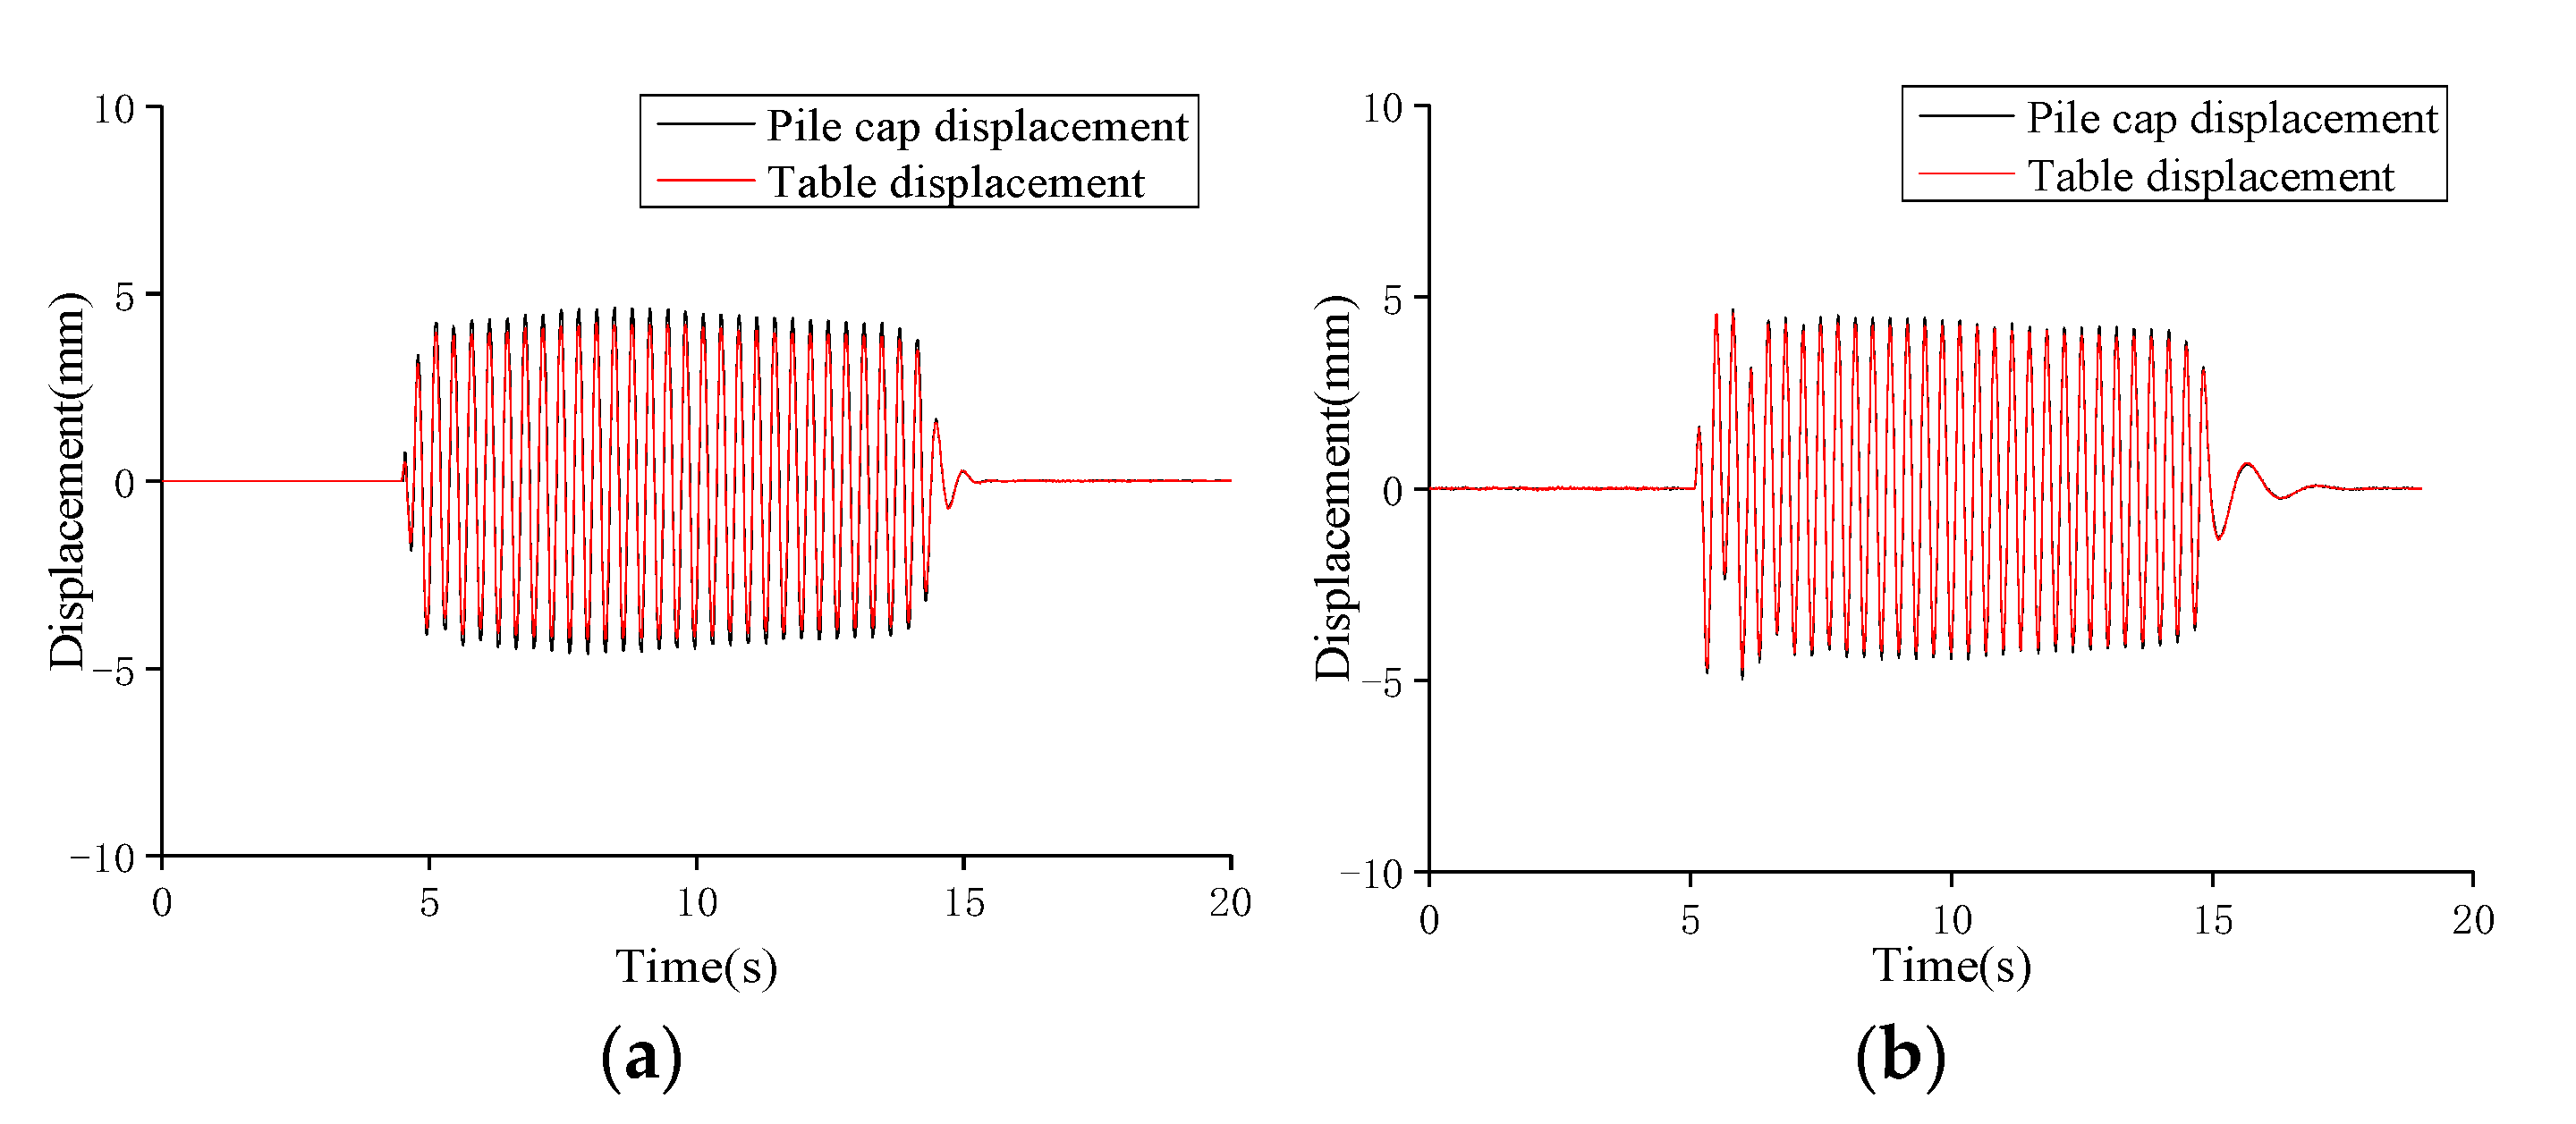
3.2. Comparison of the Lateral Dynamic Response between Straight Piles and Inclined Piles

This section concerns the lateral dynamic response characteristics of the straight group and the inclined pile group for non-liquefied soil layers and two saturated sand layers with different thicknesses, and the results of the comparison between the displacement of the pile caps and the input acceleration of the vibrating table of the straight and inclined pile group (shown in Figure 7, Figure 8, Figure 9, Figure 10, Figure 11 and Figure 12). From the figures, it can be seen that when the same sine wave is given as an input, the displacement and acceleration amplitudes of the straight and inclined pile groups are enlarged. However, the amplification of the inclined piles under the same conditions are smaller and more resistant to horizontal loads.
Table 4 shows that the acceleration and displacement amplification of the saturated sand pile is larger than that of the non-liquefaction sand pile due to the sand liquefaction. With the increase in the saturated sand thickness, the amplification of the saturated sand pile also increases, but the increase in the inclined pile is small. The horizontal seismic performance of the inclined pile is gradually revealed. Therefore, it is more advantageous to use the inclined pile to reduce the displacement of buildings in the liquefied soil layer, and the horizontal dynamic response of straight pile under the action of an earthquake is more sensitive to the sand liquefaction.

4. Comparative Analysis of the Bending Moment of the Pile Body

In practical engineering, it is of great guiding significance to determine the most unfavorable position of the bending moment of the pile under a seismic load [36]. By drawing the enveloping diagram of the bending moment distribution at different cross-section positions of piles under different working conditions, the most unfavorable position of the bending moment can be found. Then, the influence of the thickness of the saturated sand on the weak points and the seismic performance of the pile body can be discussed. In view of the symmetry of the vibration process of a 2 × 2 straight pile group and a 2 × 2 inclined pile group structure on the one-dimensional vibration table, the two piles located in the front are selected as the research objects. The pile near the proximal end of the servo motor is called the No. 1 pile, and the other pile is the No. 2 pile, as shown in Figure 13.

4.1. Principle of the Bending Moment Calculation

The key to solving the bending moment of the pile body lies in the pile body strain function under the pile foundation calculation theory. The optical and electrical signals obtained in the acquisition system are converted into actual pile strain data in the solving process.
σ = E ε = E y ρ M = A y σ d A     M = E ε I z y 1 ρ = M E I z }
where
  • σ = stress;
  • ε = strain;
  • M = bending moment on the cross section;
  • E I z = flexural rigidity of the pile;
  • y = lateral displacement of the pile.

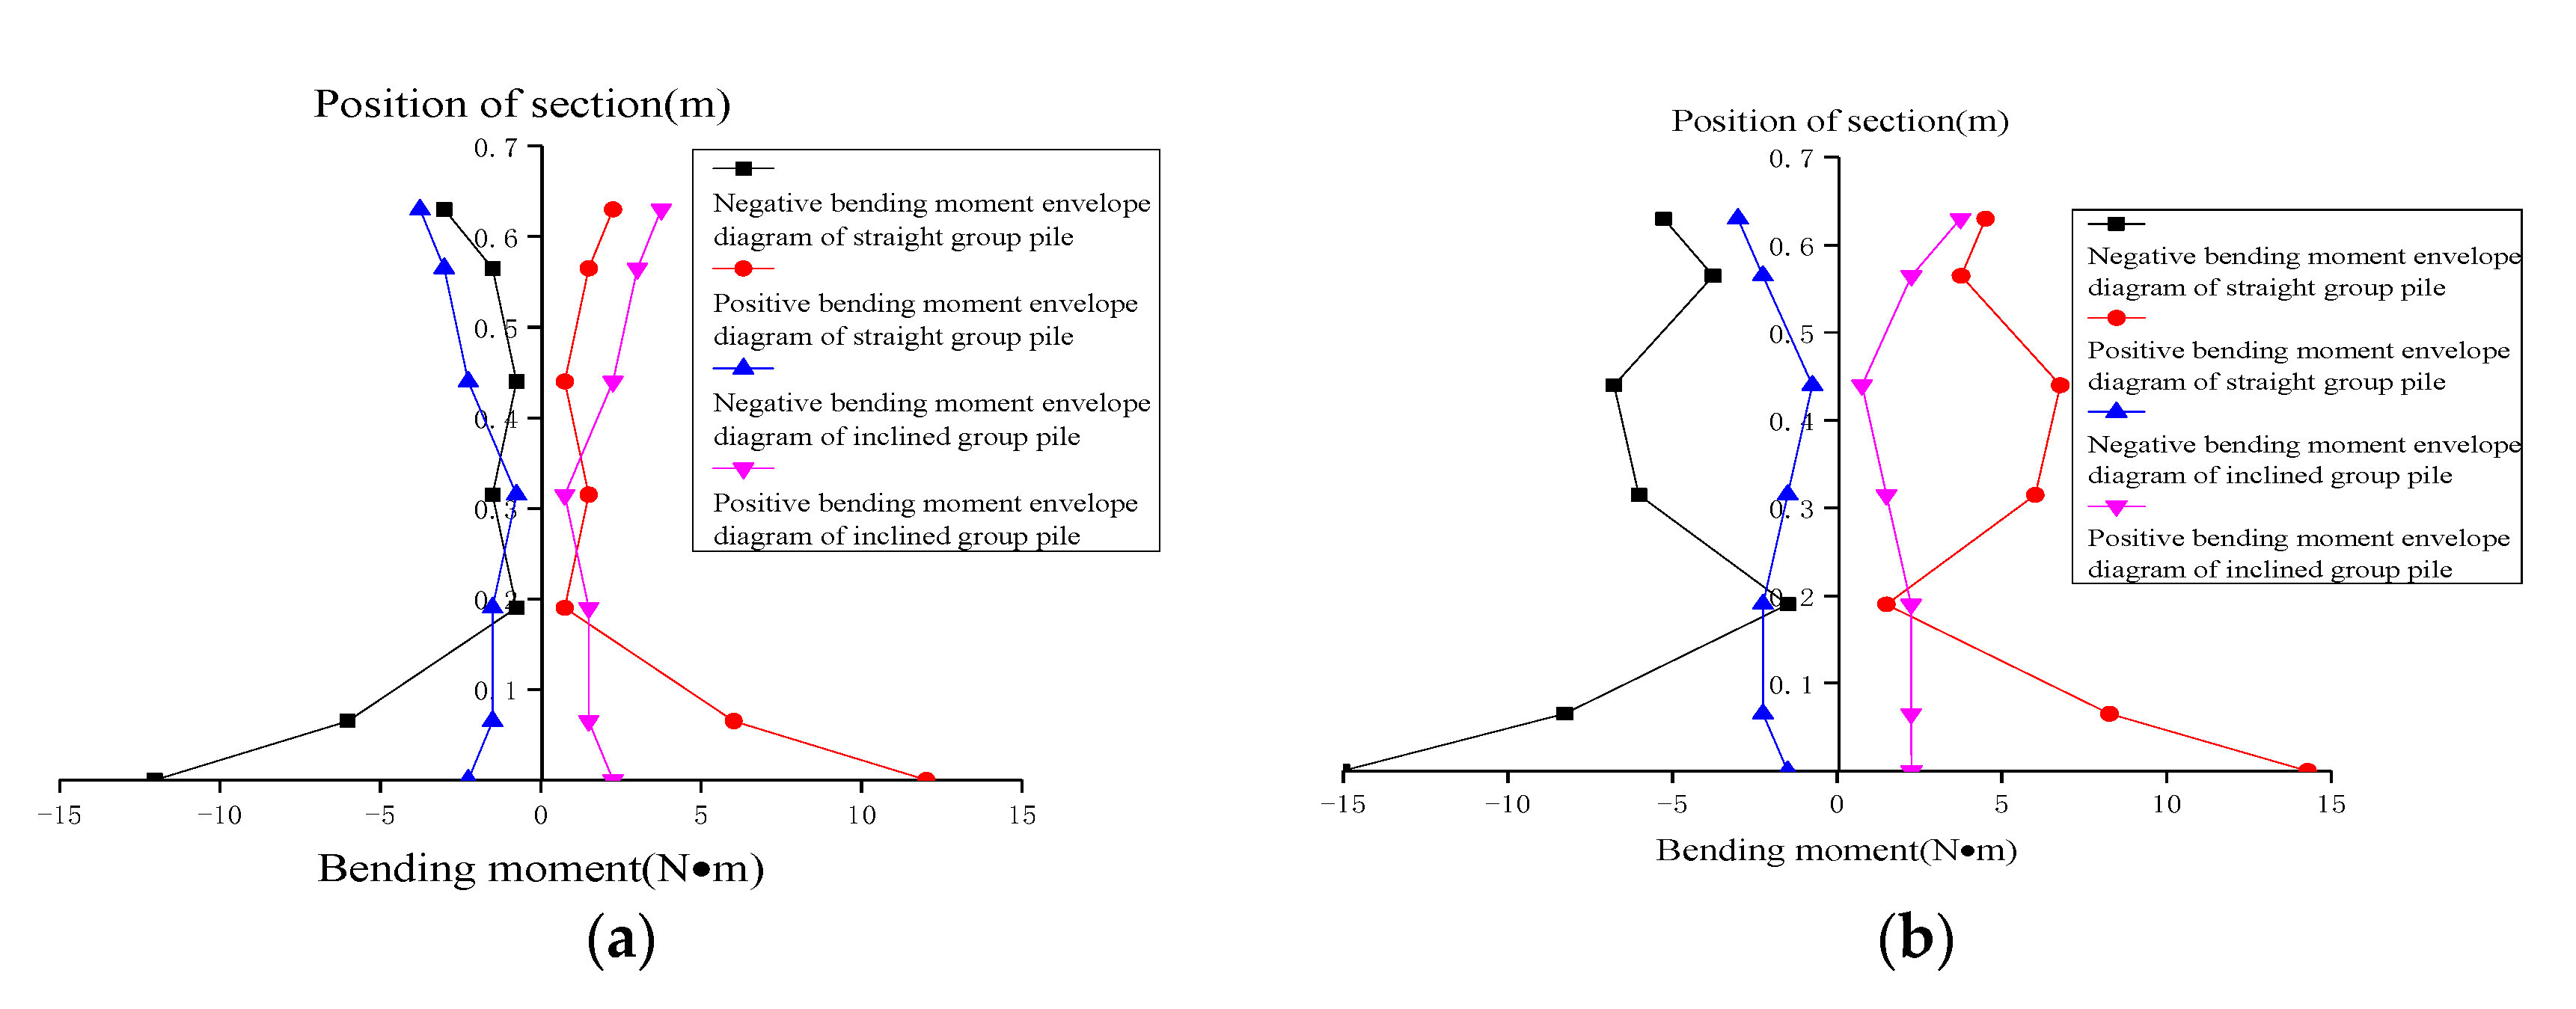
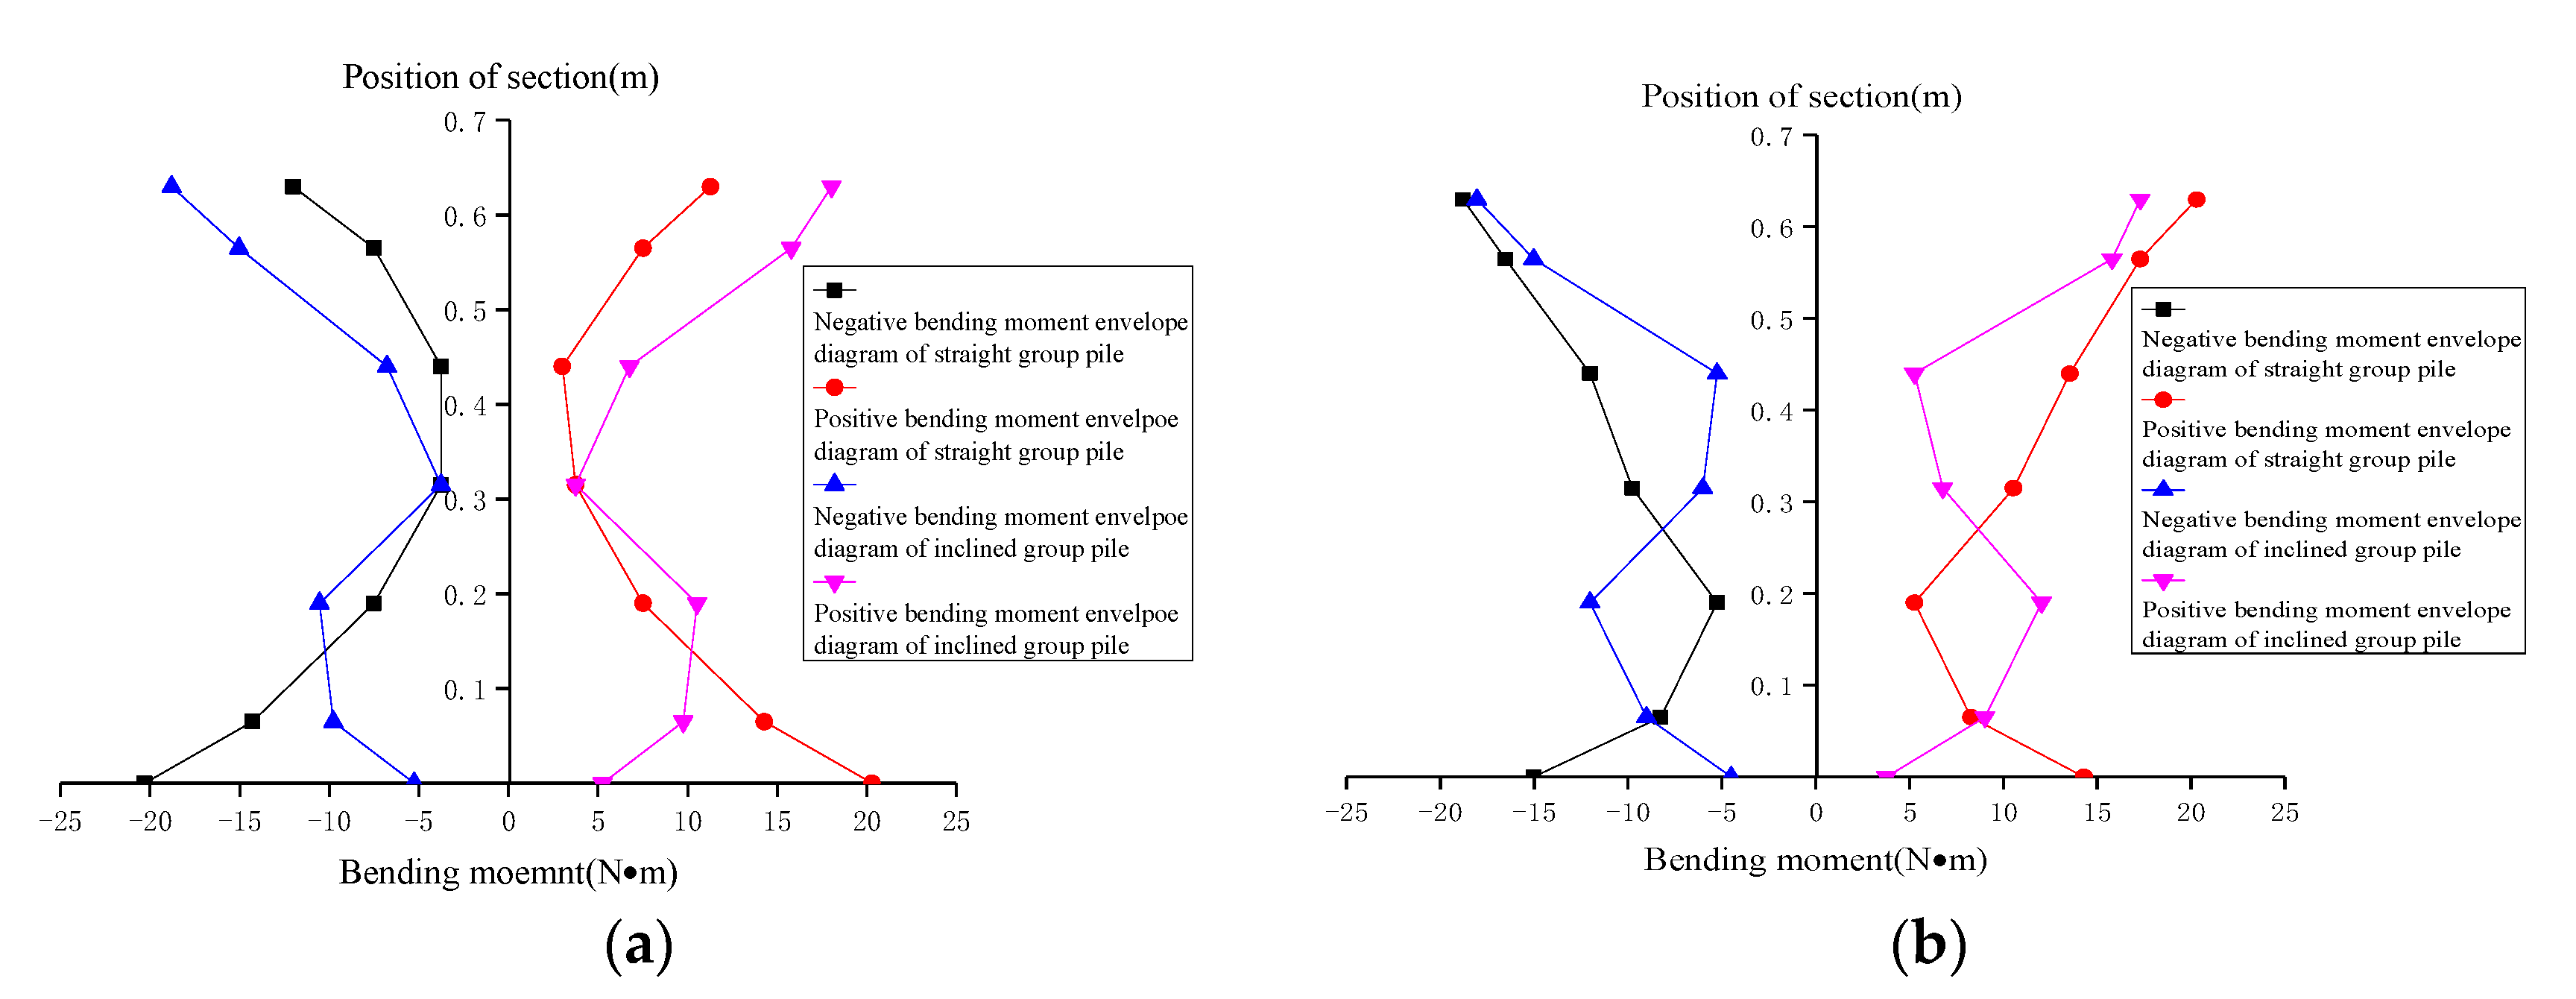
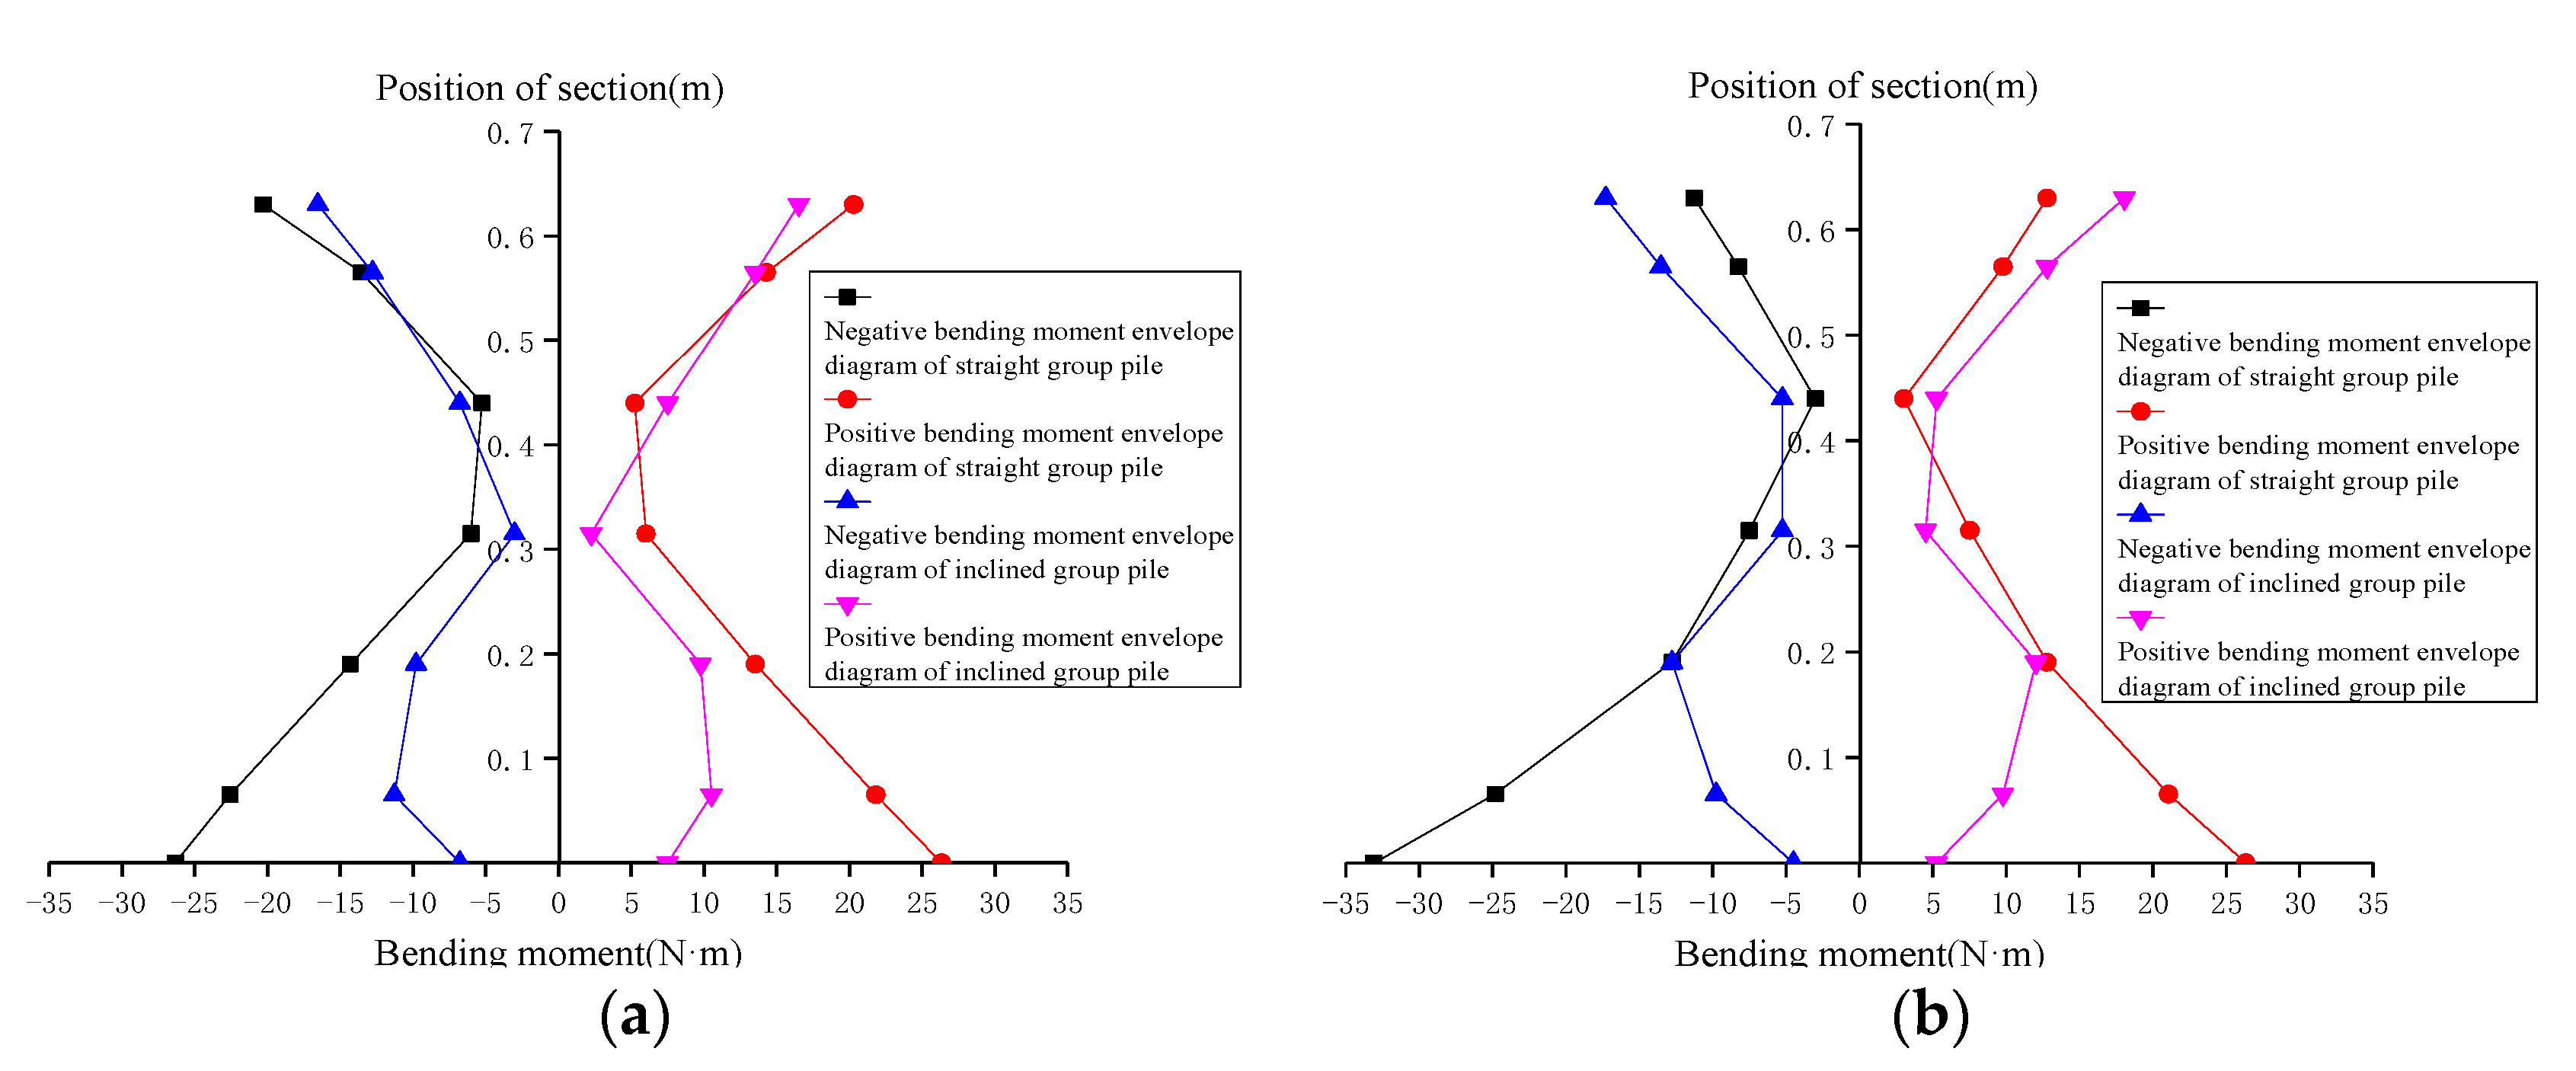
4.2. Comparison of the Bending Moment between the Straight and Inclined Pile Group

The moment envelope of the straight and inclined pile group in non-liquefied sand is analyzed, as shown in Figure 14. The bending moment of the middle part of the pile body is small, but the bottom and top of the straight and the inclined pile groups have a large bending moment; both of which have similar laws. However, according to the distribution law of the overall bending moment, the maximum positive and negative bending moments at each section of the inclined pile group are slightly different, while the bending moment distribution of the straight pile group is obviously different. The bending moments at the top of the straight and inclined pile groups are the same, but the bending moment of the straight pile group at the bottom of the pile is obviously greater than that of the inclined pile group. Therefore, the straight pile group may be more prone to damage under an external load in the non-liquefied sand.
Figure 15 shows the moment envelope of the straight and inclined pile groups in the 300 mm saturated sand. The bending moment of the middle part of the pile body is small, and the bottom and top of the straight and the inclined pile groups also have a large bending moment, both of which also have similar laws. However, in terms of the distribution law of the overall bending moment of the pile body, the bending moment envelope diagram of the straight pile group is “X-shaped”, and that of the inclined pile group is in the shape of a vase. Their bending moments are essentially similar in the middle part of the pile body. At the top of pile, the bending moment of the inclined pile group is slightly larger than that of the straight pile group, while that of the straight pile group bottom is obviously larger than that of the inclined pile group bottom. By a comprehensive comparison of the No. 1 pile and No. 2 pile, the bending moment of the straight pile group is 3~4 times of that of the inclined pile group at the bottom section of the pile.
Figure 16 shows the moment envelope of the straight and inclined pile groups in the 380 mm saturated sand. The upper half of the bending moment of the straight pile group is generally larger than that of the inclined pile group, but the difference is not particularly obvious. The change trend is essentially same, and the most obvious section is still located at the bottom of the pile. The No. 2 pile is the most obvious. At the bottom section of the No. 2 pile, the maximum bending moment of the straight pile group is 33.08 N·m, while the inclined pile group is only 5.26 N·m. This shows that the inclined pile group has a better bending resistance under the same lateral dynamic load.

5. Comparative Analysis of the Pile Foundation Dynamic p–y Curve

The lateral dynamic response of the pile foundation is greatly affected by the working condition of liquefied sand, and the p–y hysteretic curve plays a role in solving the problem of a liquefied foundation. Through the comparison and analysis of the p–y hysteretic curves of the pile–soil interaction, the bearing capacity characteristics of the straight and inclined pile groups are obtained. The critical position and force characteristics of the pile group during liquefaction are analyzed, which provides a theoretical basis for the seismic design of inclined piles in the future.

5.1. The Calculation Principle of the p–y Curve

Through the shaking table test, the advanced FBG data acquisition system is adopted to collect the data of each point of the pile body with an input waveform and the data of the flexible beam implantation under the condition of vibration. Through the analysis of the data collected by FBG (the fiber Bragg grating), the lateral force of the pile, the displacement of the pile body and soil is obtained.
The experimental dynamic p–y curves are derived from the bending moments along the depth of the pile according to simple beam theory.
p = d 2 M ( z ) d z 2
y p i l e = M ( z ) E I d z
where
  • p = lateral resistance of the soil;
  • y p i l e = lateral displacement of the pile;
  • M ( z ) = bending moment at depth z;
  • E I = flexural rigidity of the pile;
z = distance along the pile.
The p–y hysteretic curve is the most intuitive expression of the pile–soil interaction under the lateral dynamic loading of the pile body. The lateral forces and displacements of the inclined pile groups are perpendicular to the pile body. To compare the inclined pile groups with the straight pile groups, the lateral force is the horizontal force and the displacement. The force P and the displacement Y of the inclined pile are required to be vector decomposed to obtain the horizontal effect of the inclined pile for the p–y curve drawing [37].

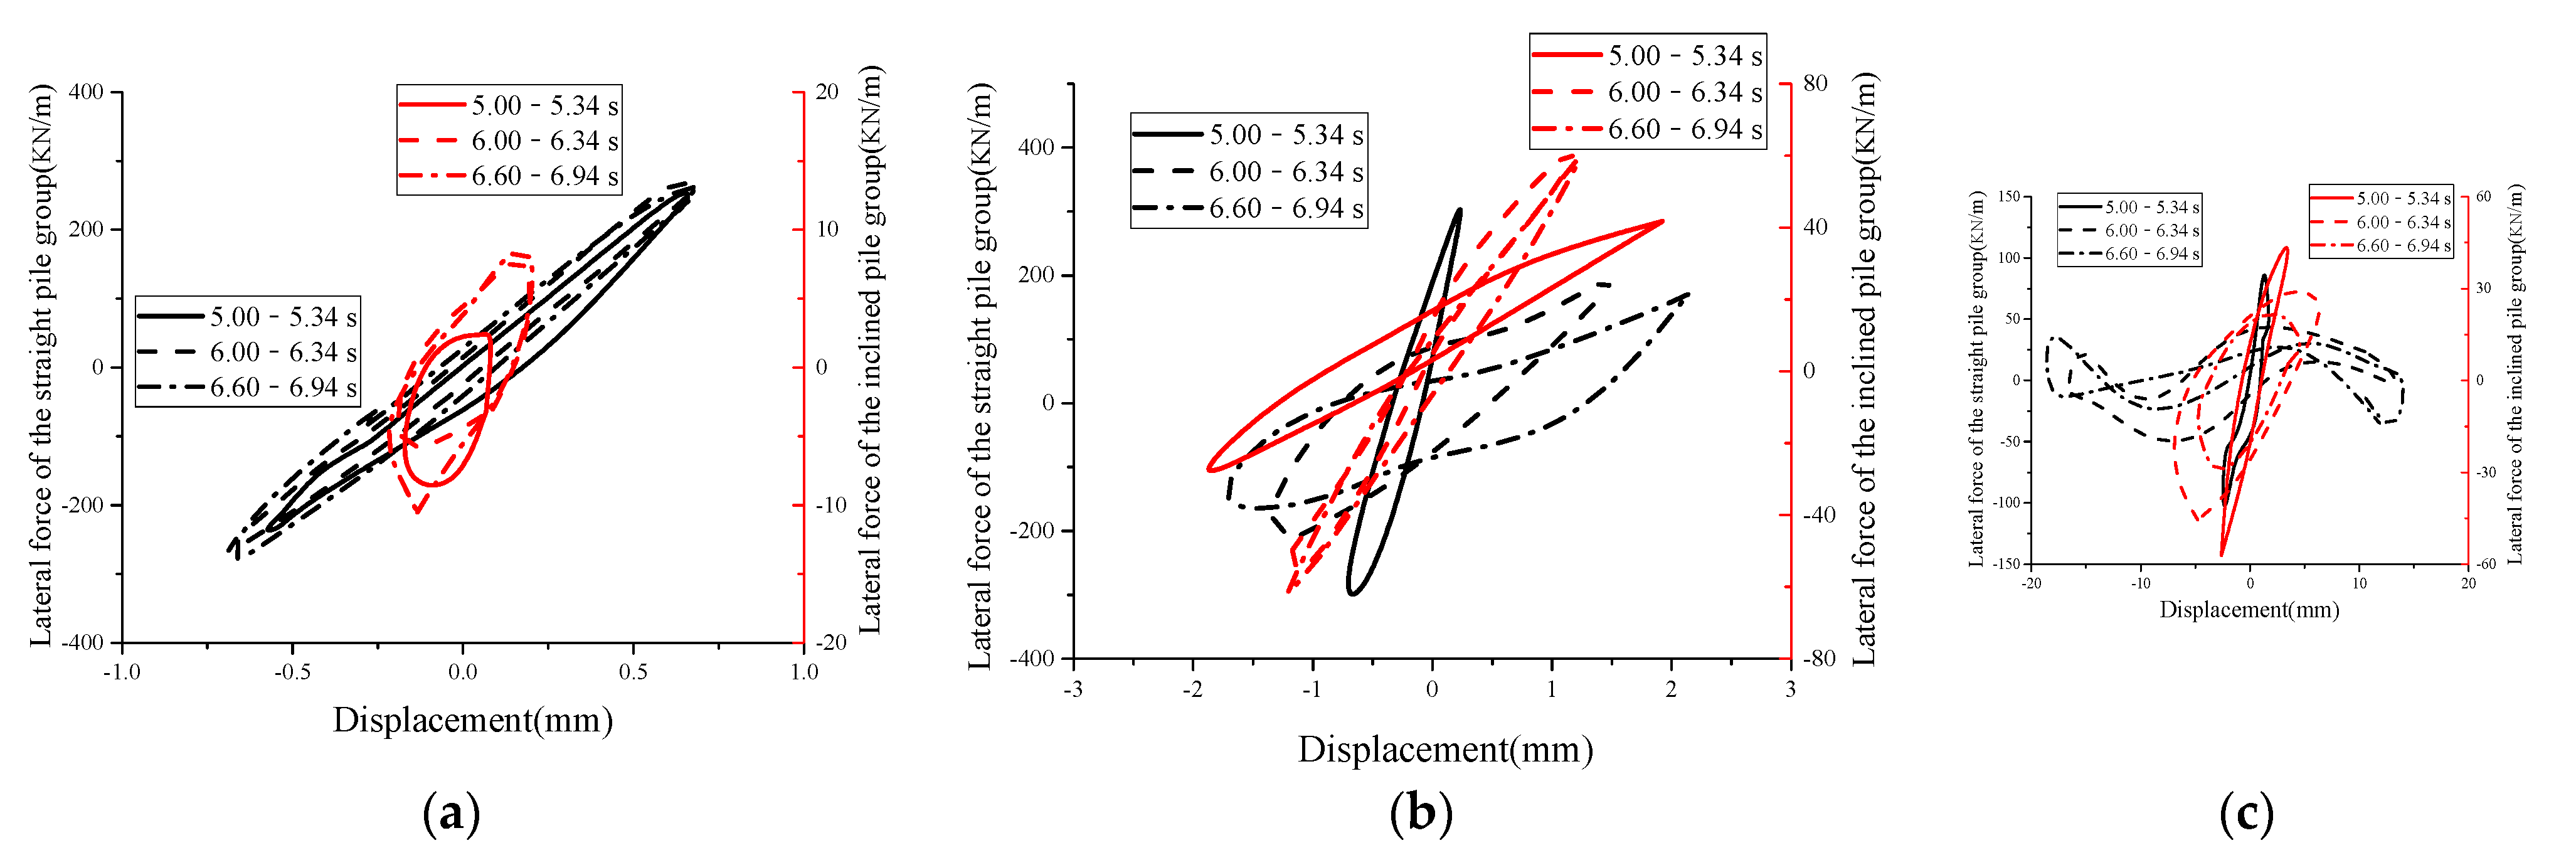
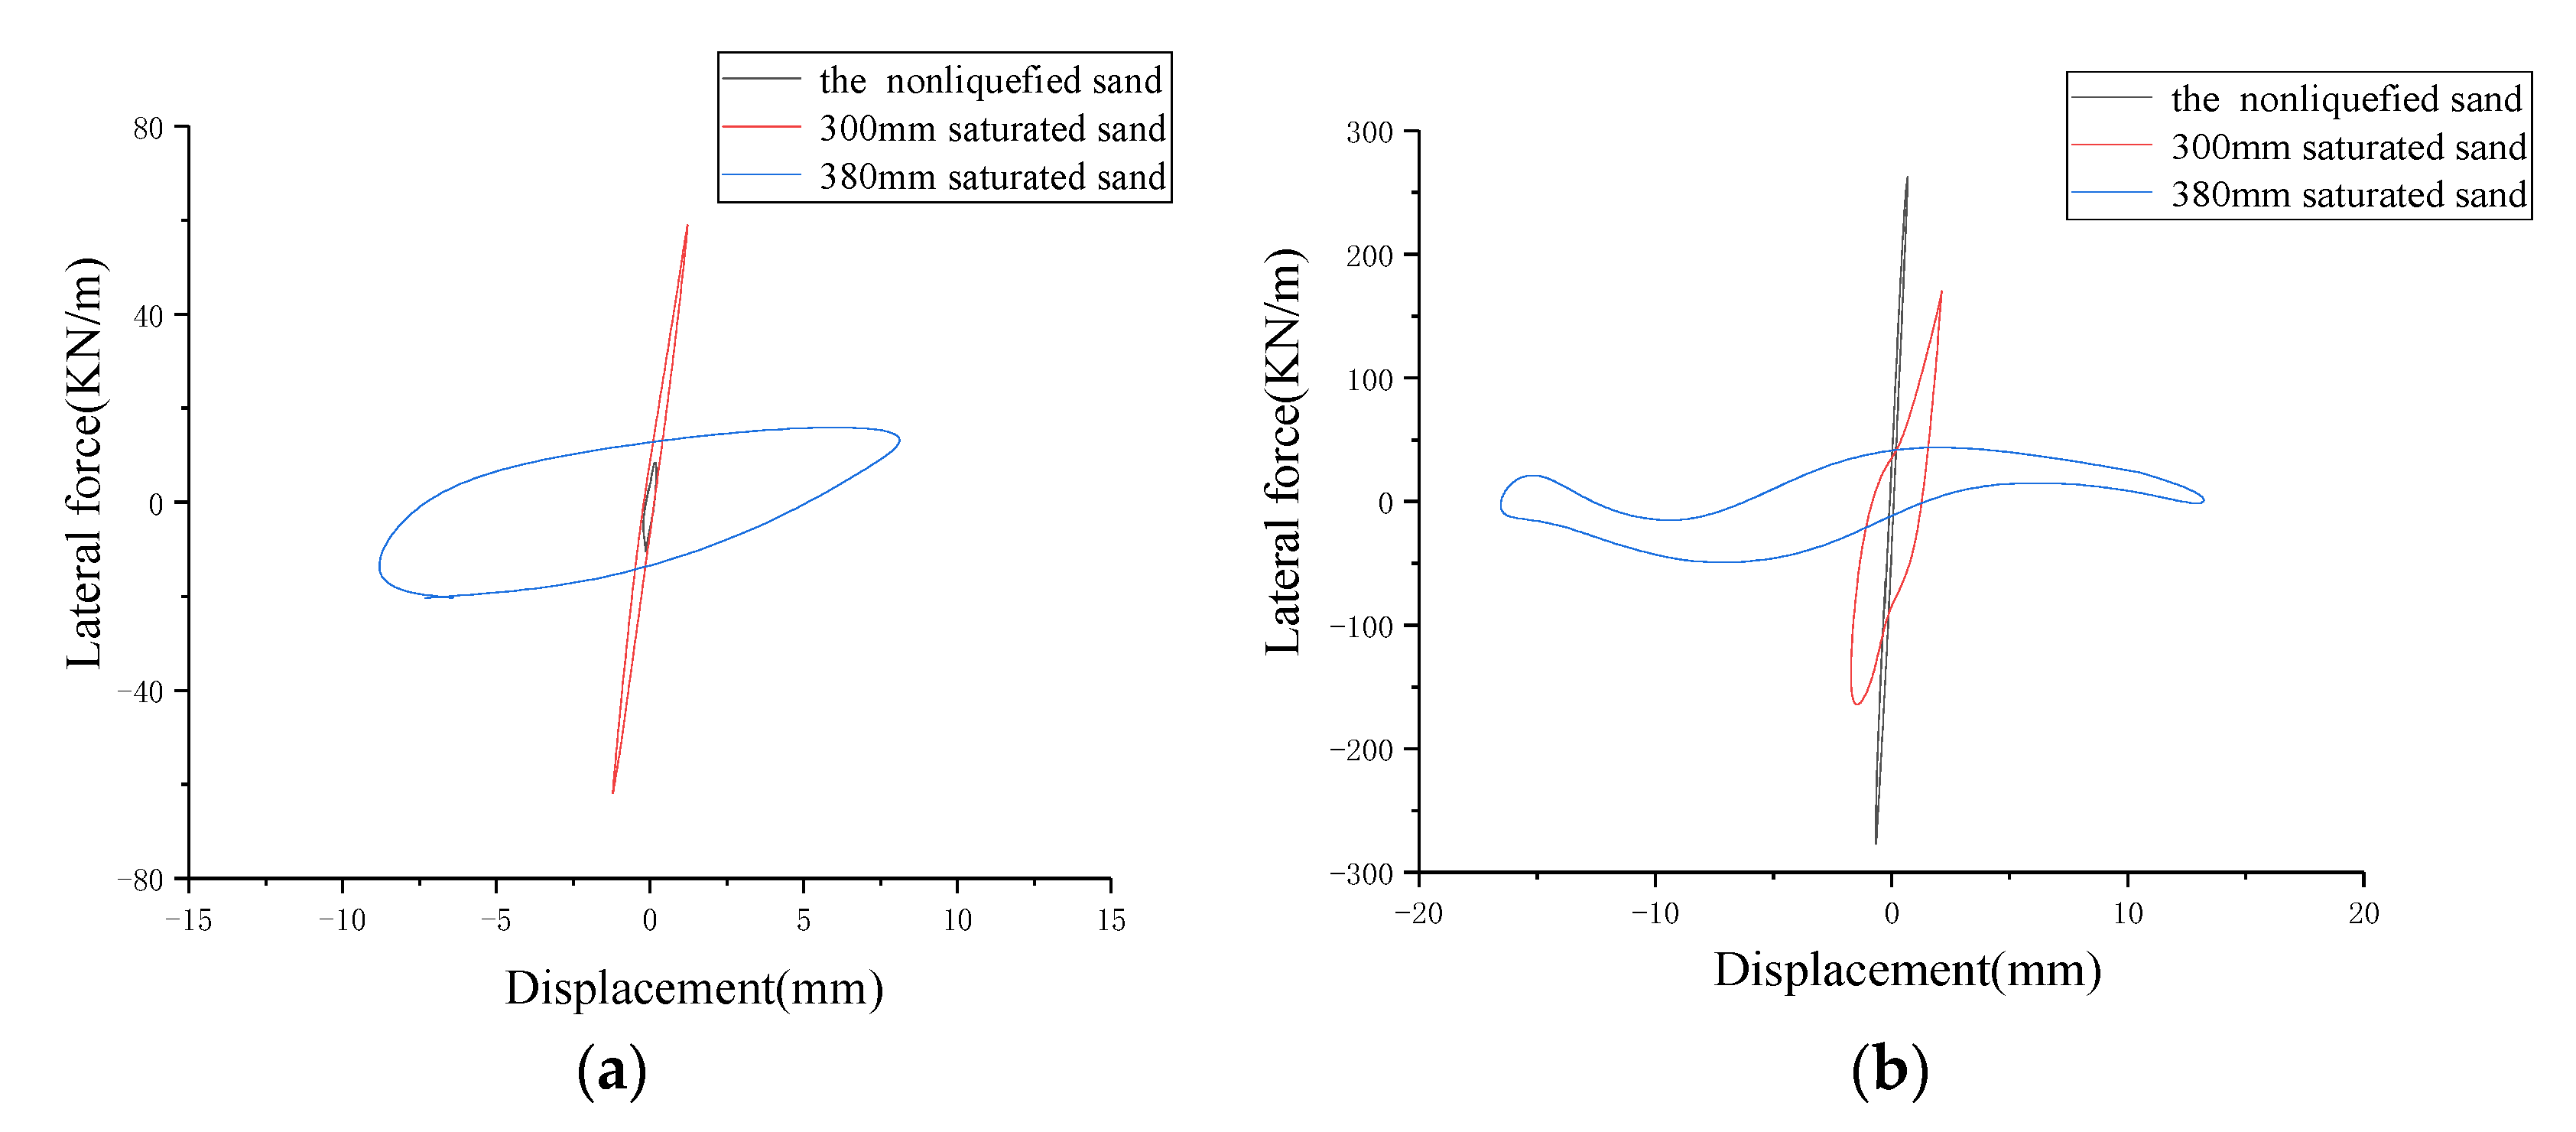
5.2. Comparison of p–y Curves between the Straight Pile Group and the Inclined Pile Group

This section mainly explores the p–y hysteretic curve rule of straight pile groups and inclined pile groups in three working conditions. The grating point 0.205 m away from the fixed end is selected for analysis. Figure 17 shows the pore pressure time–history diagram corresponding to the upper and lower sets of the straight pile group. The lower layer pressure gauge is 120 mm away from the bottom of the model box, and the upper layer pressure gauge is 260 mm away from the bottom of the model box.
Figure 18 shows that the p–y hysteresis curves have common features under the six operating conditions. Three typical periods are taken for the rise in the pore pressure in liquefied soil conditions. First, at the initial stage of vibration (5.00–5.34 s) the lateral force and displacement increase rapidly from small to large, and no hysteresis loop is formed. Second, when the vibration tends to be stable (6.00–6.34 s and 6.60–6.94 s) the p–y curve of the pile body has a similar stress and displacement hysteresis loop. At different moments when the vibration is stably input, the force and displacement of the pile are slightly reduced due to the compaction of the sand during the vibration process, but the p–y curves are substantially coincident. From the analysis of different thicknesses of saturated sand soil, regardless of whether it is the straight pile group or inclined pile group, an increase in the saturated sand thickness results in the lateral force decreasing in the stable stage, but the pile–soil relative displacement increases obviously. Additionally, the reduction of the lateral force is obviously smaller than the increase in the pile–soil relative displacement. From the analysis of the type of the pile foundation, the lateral force of the straight pile group is obviously larger than that of the inclined pile group under the same acceleration input, and the peak values of the pile–soil relative displacement of the straight pile group is also larger than that of the inclined pile group. The hysteretic loop formed by them is an eccentric ellipse, and the area enclosed by the straight pile group is larger than that of the inclined pile group.
In order to further compare and study the law of the p–y hysteretic curve of the straight inclined pile group, Figure 19 shows the p–y hysteretic curve at 6.60–6.94 s in the same coordinate system. The envelop area formed by the p–y hysteresis curve of the straight and inclined pile groups in saturated sand is larger than that of non-liquefied soil. It indicates that the energy consumption of the pile group in liquefied soil is higher than that of non-liquefied soil. This is because the saturated sand becomes liquefied under the input of the sine wave. The soil is suspended in water and then loses its bearing capacity. The lateral bearing capacity is mainly borne by the pile group. However, the lateral bearing capacity in non-liquefied soil is borne by the pile groups and sand, which results in a significant increase in the energy consumption of pile groups in liquefied soil compared with the non-liquefied soil. The envelop area formed by the p–y hysteresis curve of the pile group in 380 mm saturated sand is larger than that in 300 mm saturated sand. It shows that with the increase in saturated sand thickness, the lateral dynamic response of the pile group becomes more significant, and the energy consumption of the pile also increases. At the same time, the pile–soil relative displacement in 380 mm saturated sand is larger than that between pile and soil in 300 mm saturated sand. It shows that the interaction between the pile group and soil becomes more significant with the increase in saturated sand thickness. The connection between the two vertices of the long axis in the p–y curve is defined as the principal slope of the dynamic p–y curve, which can reflect the soil stiffness around pile. With the increase in saturated sand, the principal slope of the p–y curve increases, and the soil stiffness around the pile increases.

6. Conclusions

In this paper, the lateral dynamic response characteristics of 2 × 2 straight piles and 2 × 2 inclined piles in non-liquefied sand soil and saturated liquefied sand soil were studied using different thicknesses of 300 mm and 380 mm. According to the test results from the different working conditions, the test data were used as the basis, and the relevant theoretical calculation method of the pile foundation was adopted for analysis. The main conclusions are as follows:
(1)
The variation in the pore water pressure of the two saturated sands with different thicknesses is approximately the same after liquefaction. After the vibration begins, it rises rapidly to approximately 1.0. After the vibration ends, it slowly drops to the level before the vibration. The macroscopic phenomena are similar.
(2)
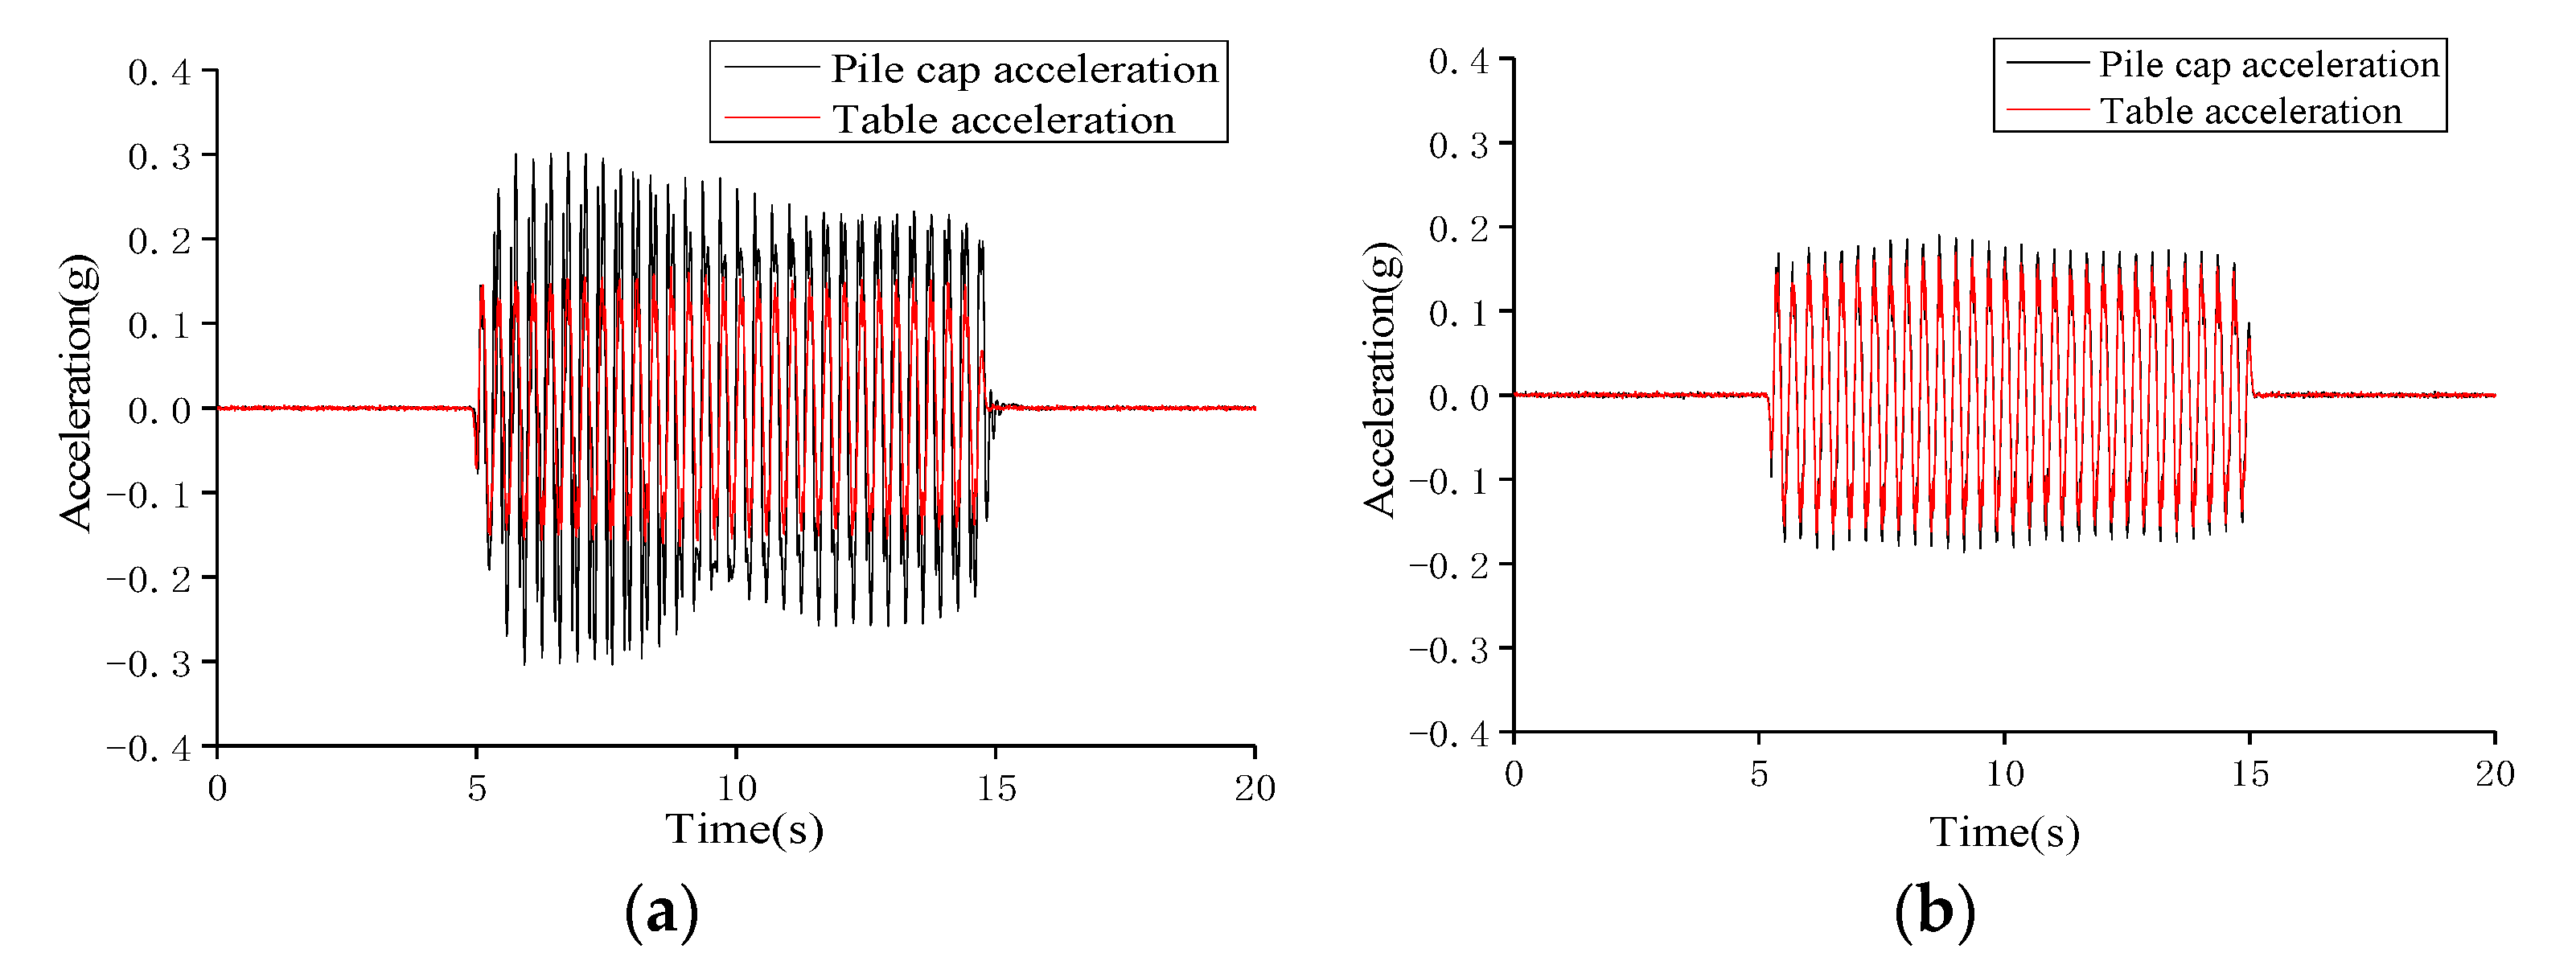
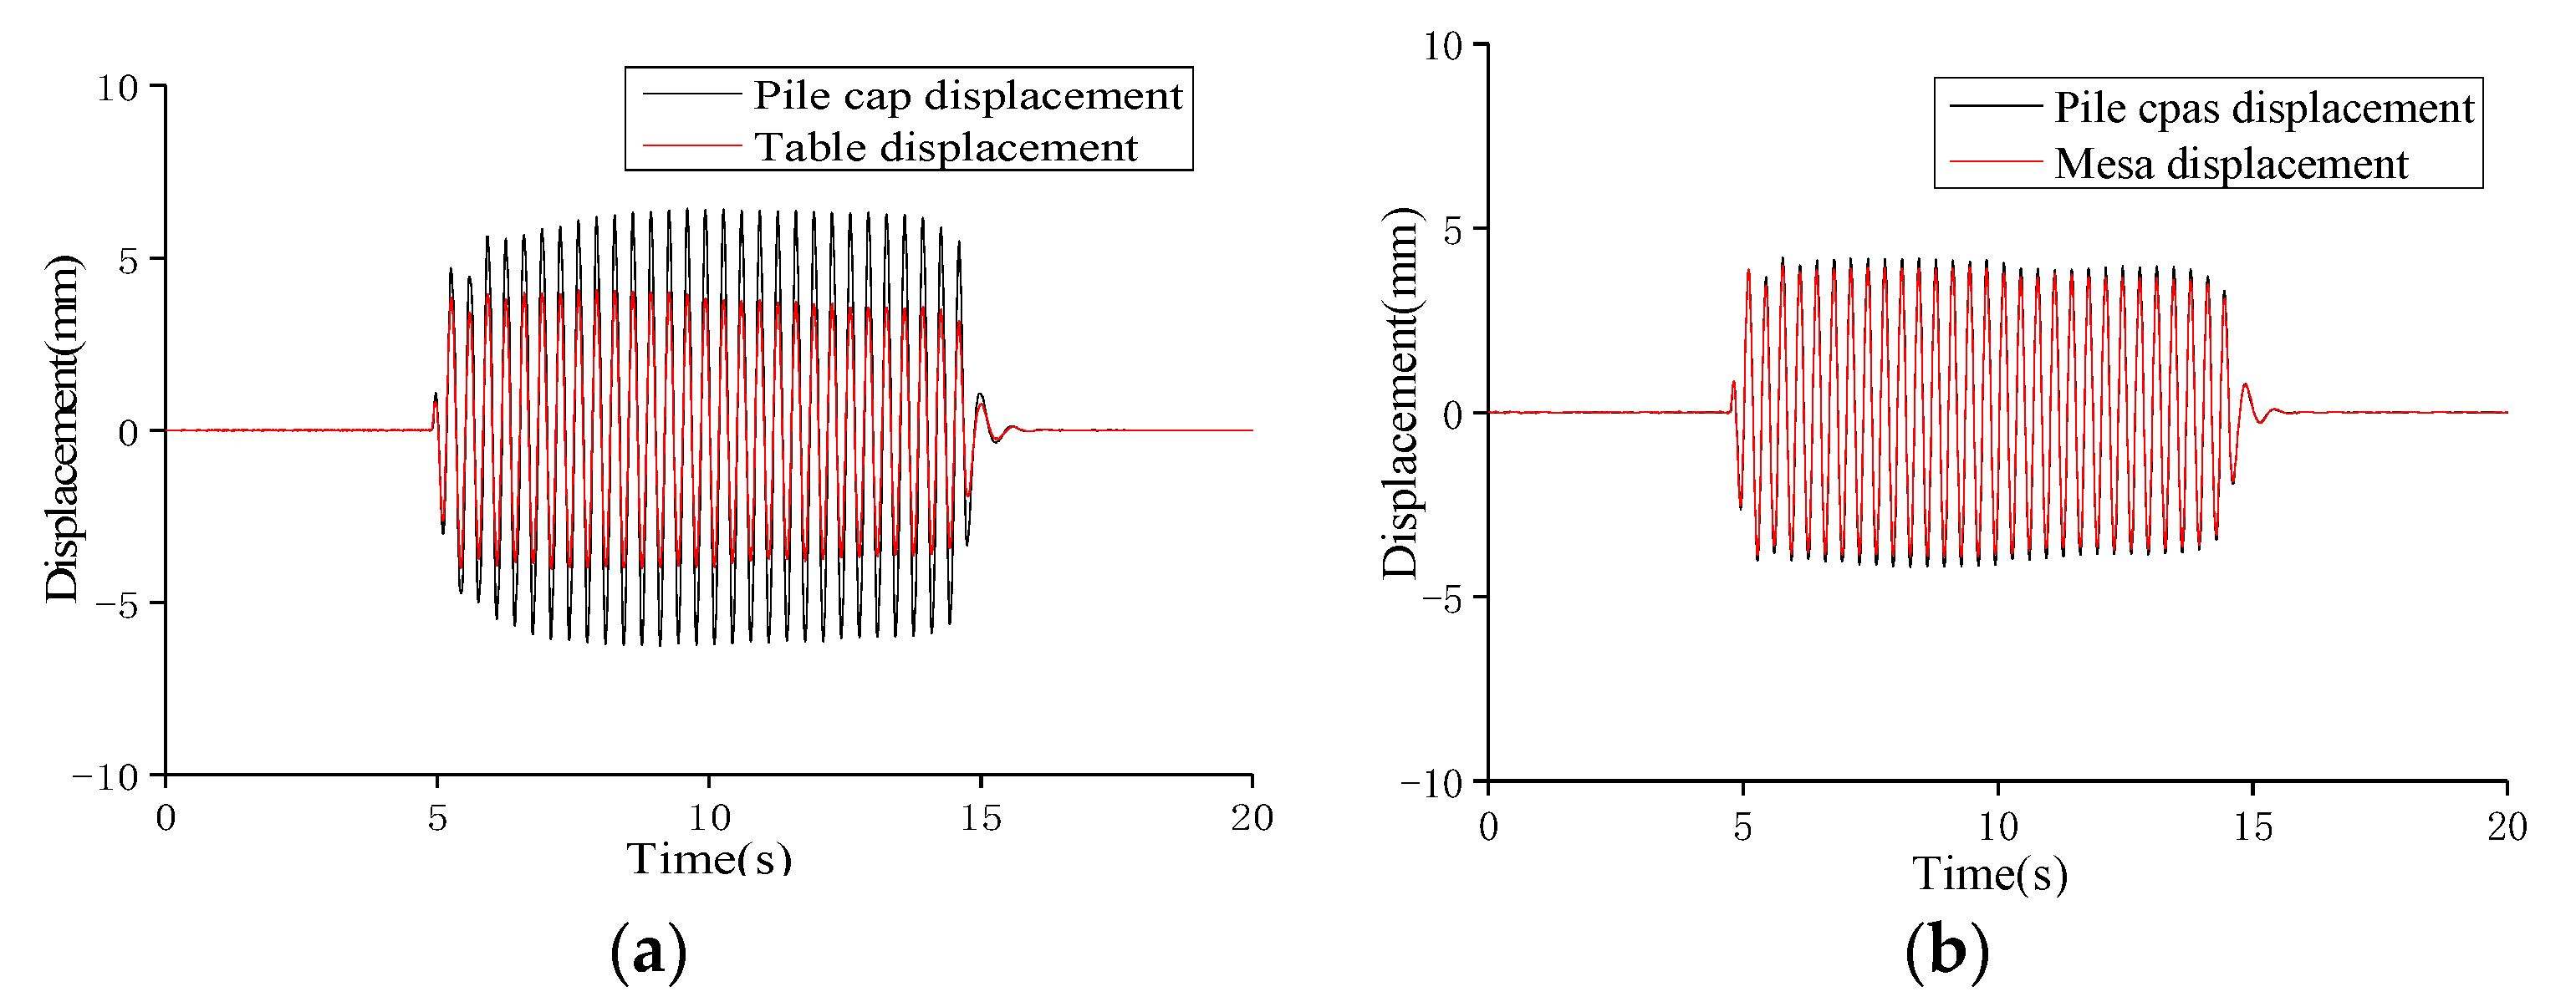
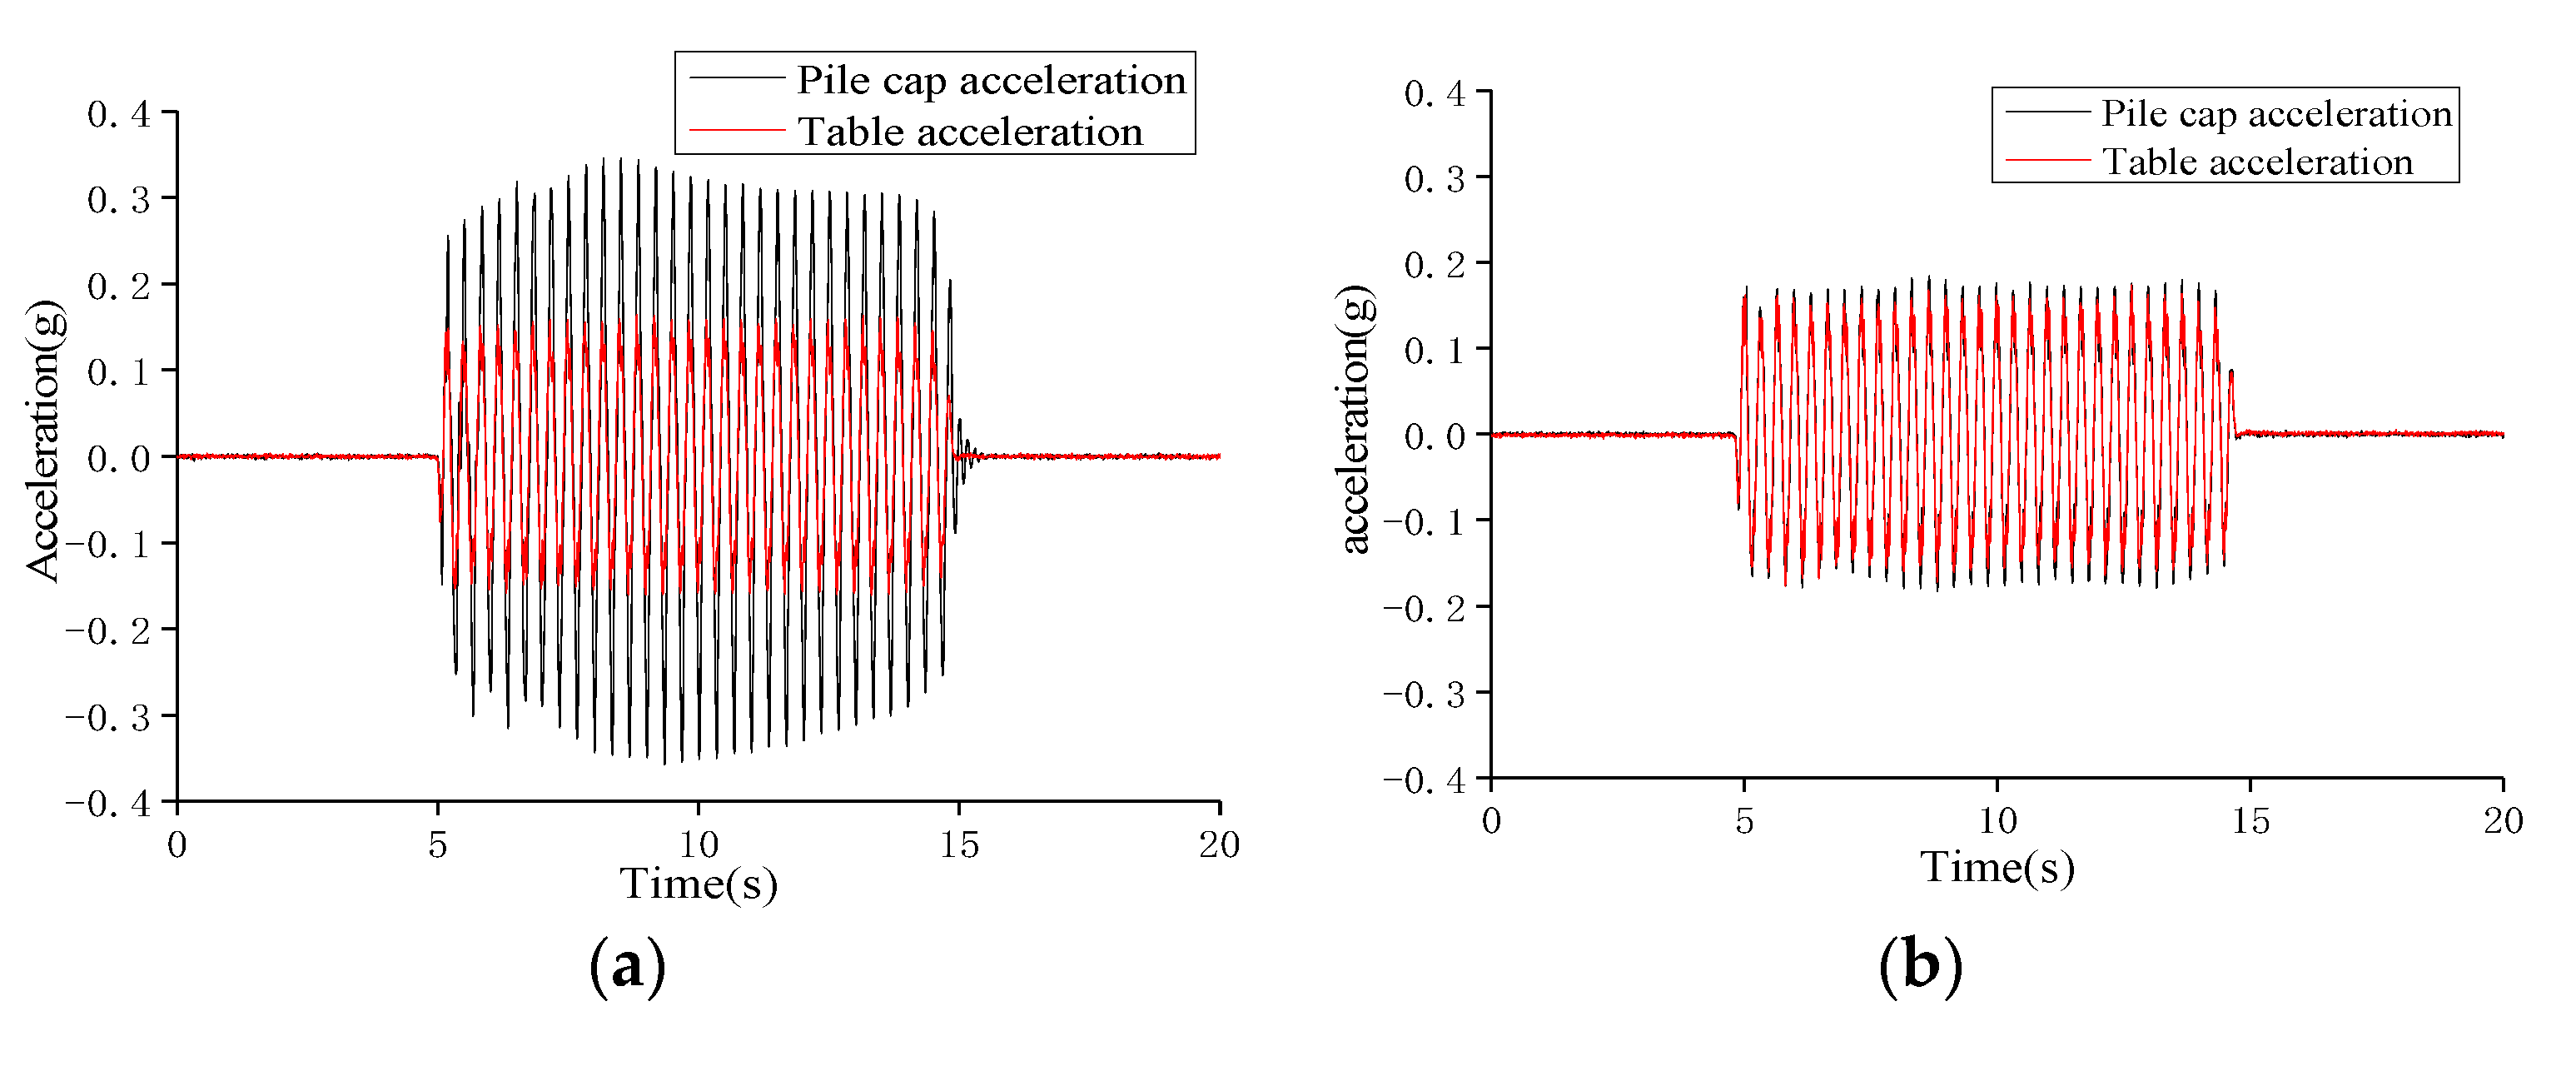
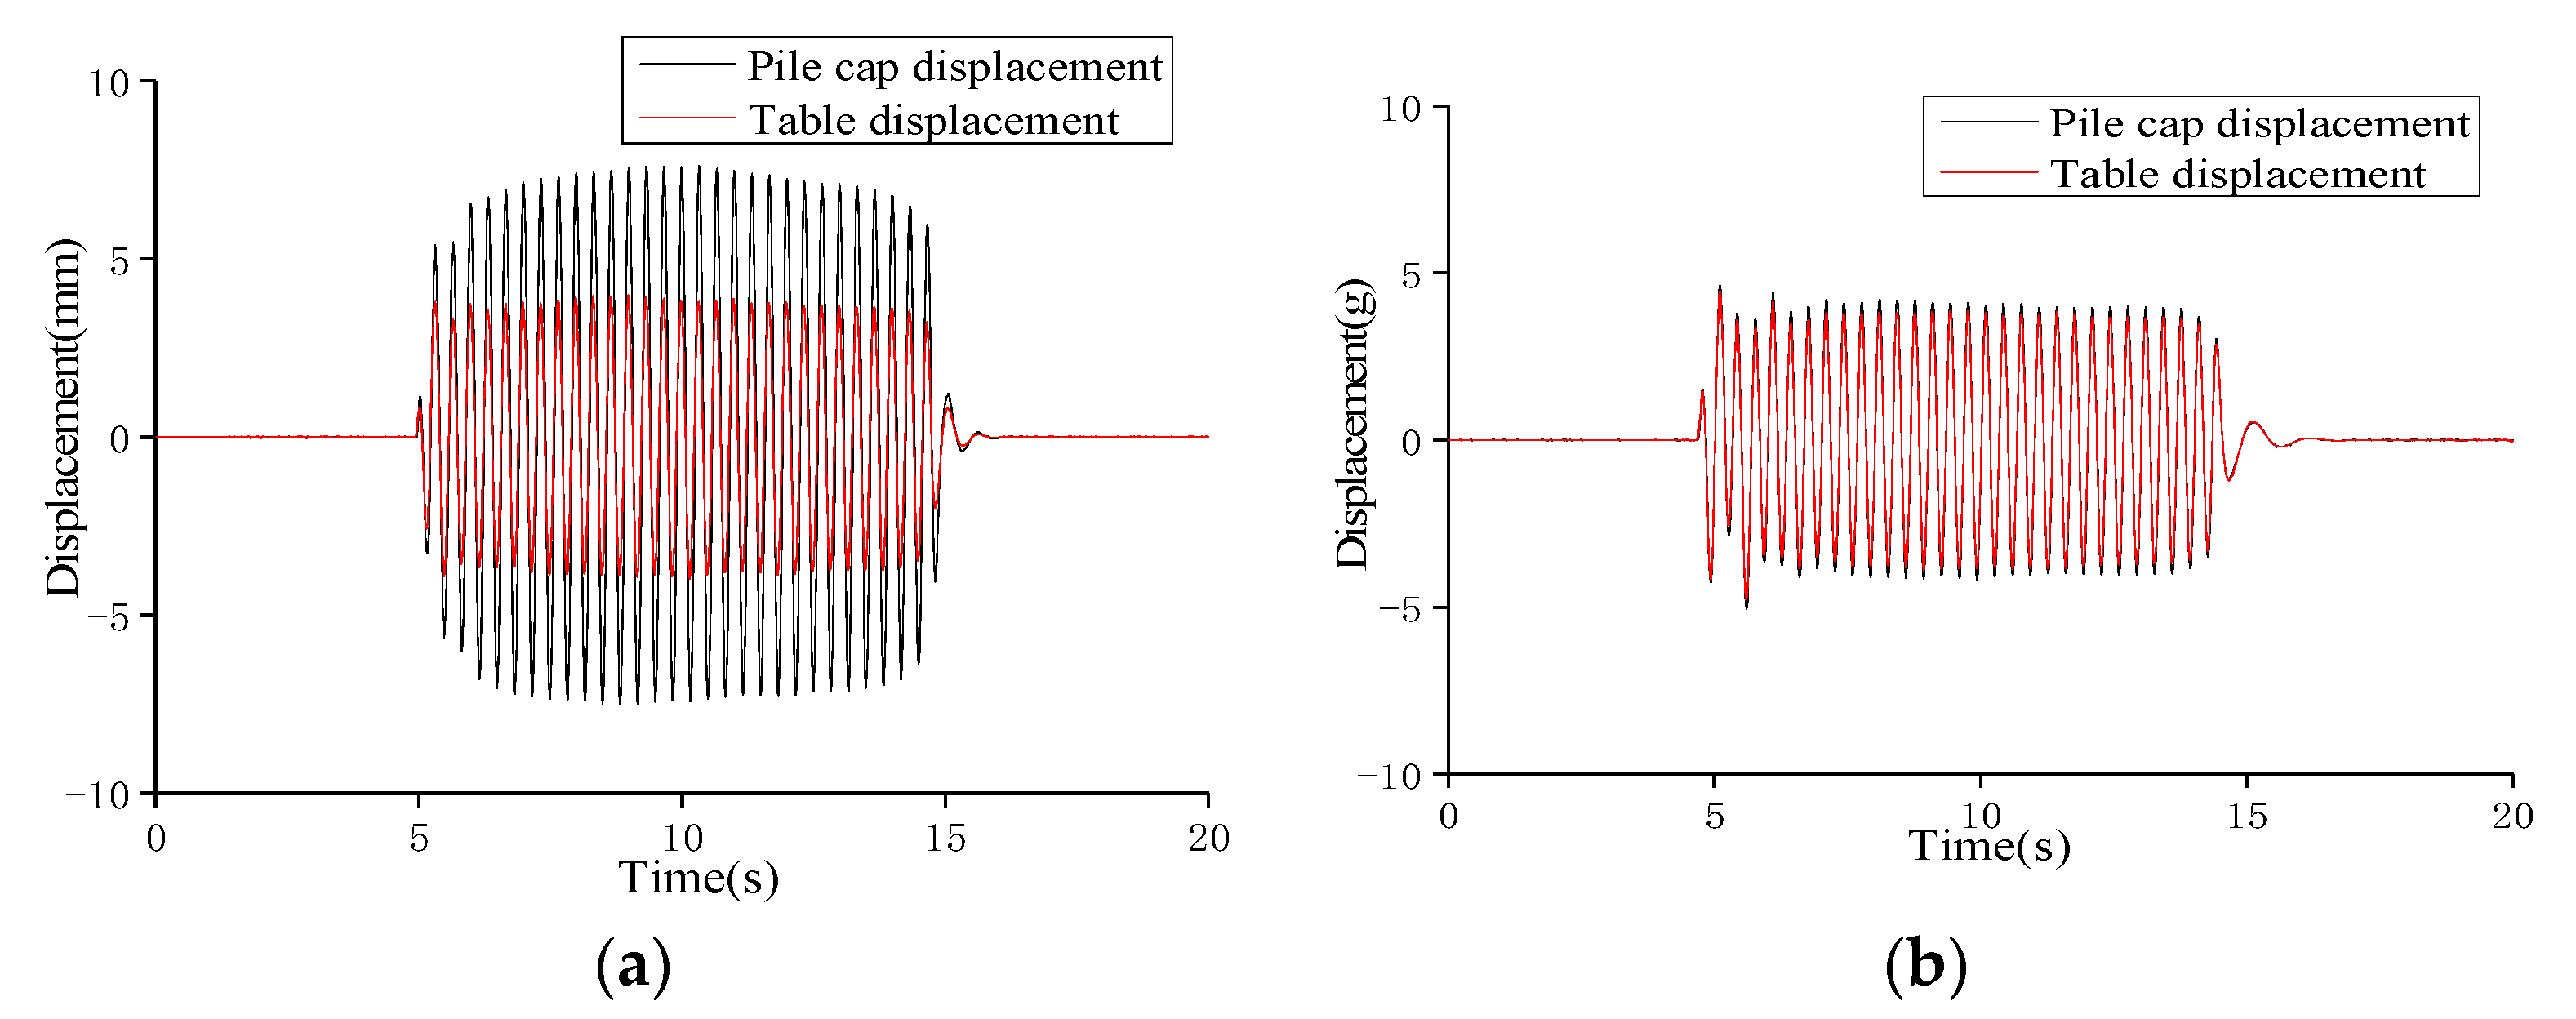
In non-liquefied sand, the difference between the multiplication of the acceleration and displacement is small, but the inclined pile is slightly dominant. However, after the liquefaction of saturated sand, the acceleration and displacement of the straight pile group head are significantly enlarged compared with the output of the vibrating table, obtaining values much larger than the amplification of the inclined pile group. Compared with the straight pile foundation, the inclined pile foundation can effectively reduce the amplification effect of acceleration and the lateral absolute displacement response of the pile cap.
(3)
Both the straight and inclined pile groups show that the bottom and top of the pile have a large bending moment, and the bending moment of the middle part of the pile body is small in the non-liquefied sand and liquefied sand, both of which have similar laws. However, in terms of the distribution law of the overall bending moment, there is no significant difference in the bending moment between the top and middle of the pile, but the maximum bending moment at the bottom section of the straight pile group is significantly larger than that of the inclined pile group. Therefore, the inclined pile group has a better bending resistance under the same lateral dynamic load.
(4)
During the rising period of the pore pressure, the lateral force and displacement of the straight–sloping piles with different thicknesses decrease as the time increases, but the p–y curve is close to coincidence. However, the straight pile group is larger than the p–y hysteresis loop of the oblique pile group at the same thickness. In this experiment, the inclined pile group has a significant reduction effect compared with the straight pile on the resisting horizontal force, and it is more resistant to the lateral force.
(5)
Through the comparative analysis of the bending moment and the p–y curve, this paper explores the transverse dynamic response, bending state, and the force and displacement of the straight and inclined pile groups under the sinusoidal wave input, providing a theoretical basis for the seismic design method of the pile foundation of the liquefied soil layer with different thicknesses in the liquefaction site.

Author Contributions

Conceptualization, Y.L. and J.Z.; methodology, Y.L.; validation, J.Z., D.Q. and H.C.; formal analysis, J.Z.; investigation, J.Z.; resources, Y.W.; data curation, Y.L.; writing—original draft preparation, Y.L.; writing—review and editing, J.Z.; visualization, J.Z.; supervision, Y.L.; project administration, Y.L.; funding acquisition, Y.W. All authors have read and agreed to the published version of the manuscript.

Funding

This research was funded by [Scientific Research Fund of Institute of Engineering Mechanics, China Earthquake Administration] grant number [2021D02], [the National Natural Science Foundation of China] grant number [51778207], and [the Natural Science Foundation of Hebei Province] grant number [E2018202107].

Acknowledgments

This work was supported by Scientific Research Fund of Institute of Engineering Mechanics, China Earthquake Administration (Grant No. 2021D02), the National Natural Science Foundation of China (Grant No. 51778207) and the Natural Science Foundation of Hebei Province (Grant No. E2018202107).

Conflicts of Interest

The authors declare no conflict of interest.

References

  1. Karlsson, M.; Yannie, J.; Dijkstra, J. Modeling Aging of Displacement Piles in Natural Soft Clay. J. Geotech. Geoenviron. Eng. 2019, 145, 04019070. [Google Scholar] [CrossRef] [Green Version]
  2. Hoffmann, M.; Żarkiewicz, K.; Zieliński, A.; Skibicki, S.; Marchewka, Ł. Foundation Piles—A New Feature for Concrete 3D Printers. Materials 2021, 14, 2545. [Google Scholar] [CrossRef] [PubMed]
  3. Sun, L.; Xie, W. Full-Model Shaking Table Tests of Seismic Behavior of a Super-Long-Span Cable-Stayed Bridge with Pile Foundations. J. Bridg. Eng. 2019, 24, 4019102. [Google Scholar] [CrossRef]
  4. Carswell, W.; Arwade, S.R.; DeGroot, D.J.; Lackner, M.A. Soil-structure reliability of offshore wind turbine monopile foundations. Wind Energy 2014, 18, 483–498. [Google Scholar] [CrossRef]
  5. Anusic, I.; Lehane, B.M.; Eiksund, G.R.; Liingaard, M.A. Influence of installation method on static lateral response of displacement piles in sand. Geotech. Lett. 2019, 9, 193–197. [Google Scholar] [CrossRef]
  6. Qu, L.; Ding, X.; Kouroussis, G.; Zheng, C. Dynamic interaction of soil and end-bearing piles in sloping ground: Numerical simulation and analytical solution. Comput. Geotech. 2021, 134, 103917. [Google Scholar] [CrossRef]
  7. Liang, F.Y.; Yuan, Z.C.; Liang, X.; Zhang, H. Seismic response of monopile-supported offshore wind turbines under combined wind, wave and hydrodynamic loads at scoured sites. Comput. Geotech. 2022, 144, 104640. [Google Scholar] [CrossRef]
  8. Lim, H.; Jeong, S. Simplified p–y curves under dynamic loading in dry sand. Soil Dyn. Earthq. Eng. 2018, 113, 101–111. [Google Scholar] [CrossRef]
  9. Cherian, A.C.; Kumar, J. Effect of Vibration Cycles Batches on Shear Modulus and Damping of Dry Sand. J. Geotech. Geoenviron. Eng. 2017, 143, 6017007. [Google Scholar] [CrossRef]
  10. Finn, W.; Fujita, N. Piles in liquefiable soils: Seismic analysis and design issues. Soil Dyn. Earthq. Eng. 2002, 22, 731–742. [Google Scholar] [CrossRef]
  11. Montassar, S.; de Buhan, P. Numerical prediction of liquefied ground characteristics from back-analysis of lateral spreading centrifuge experiments. Comput. Geotech. 2013, 52, 7–15. [Google Scholar] [CrossRef]
  12. Kong, D.; Deng, M.; Zhao, Z. Seismic Interaction Characteristics of an Inclined Straight Alternating Pile Group-Soil in Liquefied Ground. Adv. Civ. Eng. 2019, 2019, 3758286. [Google Scholar] [CrossRef] [Green Version]
  13. Hill, D.P.; Reasenberg, P.A.; Michael, A.; Arabaz, W.J.; Beroza, G.; Brumbaugh, D.; Brune, J.N.; Castro, R.; Davis, S.; dePolo, D.; et al. Seismicity remotely triggered by the magnitude 7.3 landers, california, earthquake. Science 1993, 260, 1617–1623. [Google Scholar] [CrossRef] [PubMed] [Green Version]
  14. Yagi, Y.; Mikurno, T.; Pacheco, J.; Reyes, G. Source rupture process of the Tecoman, Colima, Mexico earthquake of 22 January 2003, determined by joint inversion of teleseismic body-wave and near-source data. Bull. Seismol. Soc. Am. 2004, 94, 1795–1807. [Google Scholar] [CrossRef] [Green Version]
  15. Kato, A.; Obara, K.; Igarashi, T.; Tsuruoka, H.; Nakagawa, S.; Hirata, N. Propagation of Slow Slip Leading Up to the 2011 M-w 9.0 Tohoku-Oki Earthquake. Science 2012, 335, 705–708. [Google Scholar] [CrossRef] [PubMed] [Green Version]
  16. Chen, L.W.; Yuan, X.M.; Cao, Z.Z.; Hou, L.Q.; Sun, R.; Dong, L.; Wang, W.M.; Meng, F.C.; Chen, H.J. Liquefaction macro-phenomena in the great Wenchuan earthquake. Earthq. Eng. Eng. Vib. 2009, 8, 219–229. [Google Scholar] [CrossRef]
  17. Yuan, X.; Cao, Z. A fundamental procedure and calculation formula for evaluating gravel liquefaction. Earthq. Eng. Eng. Vib. 2011, 10, 339–347. [Google Scholar] [CrossRef]
  18. Azarafza, M.; Nanehkaran, Y.A.; Rajabion, L.; Akgün, H.; Rahnamarad, J.; Derakhshani, R.; Raoof, A. Application of the modified Q-slope classification system for sedimentary rock slope stability assessment in Iran. Eng. Geol. 2019, 264, 105349. [Google Scholar] [CrossRef]
  19. Jampole, E.; Deierlein, G.; Miranda, E.; Fell, B.; Swensen, S.; Acevedo, C. Full-Scale Dynamic Testing of a Sliding Seismically Isolated Unibody House. Earthq. Spectra 2016, 32, 2245–2270. [Google Scholar] [CrossRef]
  20. He, L.; Ramirez, J.; Lu, J.; Tang, L.; Elgamal, A.; Tokimatsu, K. Lateral spreading near deep foundations and influence of soil permeability. Can. Geotech. J. 2017, 54, 846–861. [Google Scholar] [CrossRef]
  21. Huang, S.; Peng, Y. Seismic Stability Analysis of Saturated and Unsaturated Soil Slopes Using Permanent Displacement. Adv. Civ. Eng. 2018, 2018, 1786392. [Google Scholar] [CrossRef] [Green Version]
  22. Guo, W.; Shao, P.; Li, H.-Y.; Long, Y.; Mao, J.-F. Accuracy Assessment of Shake Table Device on Strong Earthquake Output. Adv. Civ. Eng. 2019, 2019, 9372505. [Google Scholar] [CrossRef]
  23. Motamed, R.; Towhata, I. Mitigation measures for pile groups behind quay walls subjected to lateral flow ofliquefied soil: Shake table model tests. Soil Dyn. Earthq. Eng. 2010, 30, 1043–1060. [Google Scholar] [CrossRef]
  24. Li, G.; Motamed, R. Finite element modeling of soil-pile response subjected to liquefaction-induced lateral spreading in a large-scale shake table experiment. Soil Dyn. Earthq. Eng. 2017, 92, 573–584. [Google Scholar] [CrossRef]
  25. Ebeido, A.; Elgamal, A.; Tokimatsu, K.; Abe, A. Pile and Pile-Group Response to Liquefaction-Induced Lateral Spreading in Four Large-Scale Shake-Table Experiments. J. Geotech. Geoenviron. Eng. 2019, 145, 04019080. [Google Scholar] [CrossRef]
  26. Wang, X.W.; Ji, B.H.; Ye, A.J. Seismic Behavior of Pile-Group-Supported Bridges in Liquefiable Soils with Crusts Subjected to Potential Scour: Insights from Shake-Table Tests. J. Geotech. Geoenviron. Eng. 2020, 146, 04020030. [Google Scholar] [CrossRef]
  27. Giannakou, A.; Gerolymos, N.; Gazetas, G.; Tazoh, T.; Anastasopoulos, I. Seismic Behavior of Batter Piles: Elastic Response. J. Geotech. Geoenviron. Eng. 2010, 136, 1187–1199. [Google Scholar] [CrossRef] [Green Version]
  28. Dezi, F.; Carbonari, S.; Morici, M. A numerical model for the dynamic analysis of inclined pile groups. Earthq. Eng. Struct. Dyn. 2015, 45, 45–68. [Google Scholar] [CrossRef]
  29. Medina, C.; Padrón, L.A.; Aznárez, J.J.; Santana, A.; Maeso, O. Kinematic interaction factors of deep foundations with inclined piles. Earthq. Eng. Struct. Dyn. 2014, 43, 2035–2050. [Google Scholar] [CrossRef] [Green Version]
  30. Turan, A.; Hinchberger, S.D.; El Naggar, H. Design and commissioning of a laminar soil container for use on small shaking tables. Soil Dyn. Earthq. Eng. 2009, 29, 404–414. [Google Scholar] [CrossRef]
  31. Prasad, S.K.; Towhata, I.; Chandradhara, G.P.; Nanjundaswamy, P. Shaking table tests in earthquake geotechnical engineering. Curr. Sci. 2004, 87, 1398–1404. [Google Scholar]
  32. Liang, F.Y.; Chen, H.B.; Huang, M.S. Accuracy of three-dimensional seismic ground response analysis in time domain using nonlinear numerical simulations. Earthq. Eng. Eng. Vib. 2017, 16, 487–498. [Google Scholar] [CrossRef]
  33. Ma, X.F.; Kong, L.G.; Fang, W. Parallel tests on preparation of samples with sand pourer. Chin. J. Geotech. Eng. 2014, 36, 1791–1801. (In Chinese) [Google Scholar]
  34. Ghazavia, M.; Ravanshenas, P.; EI Naggar, M.H. Interaction between inclined pile groups subjected to harmonic vibrations. Soil Found. 2013, 53, 789–803. [Google Scholar] [CrossRef] [Green Version]
  35. Wu, H.; Zhu, H.-H.; Zhang, C.-C.; Zhou, G.-Y.; Zhu, B.; Zhang, W.; Azarafza, M. Strain integration-based soil shear displacement measurement using high-resolution strain sensing technology. Measurement 2020, 166, 108210. [Google Scholar] [CrossRef]
  36. Dezi, F.; Poulos, H. Kinematic Bending Moments in Square Pile Groups. Int. J. Géoméch. 2017, 17, 04016066. [Google Scholar] [CrossRef]
  37. Sinnreich, J.; Ayithi, A. Derivation of p–y Curves from Lateral Pile Load Test Instrument Data. Geotech. Test. J. 2014, 37, 20130127. [Google Scholar] [CrossRef]
Figure 1. Shaking table test and multifunctional collection: (a) main equipment of the shaking table. Description of what is contained in the first panel. (b) Multifunctional collection.
Applsci 12 02363 g001
Figure 2. Particle size distribution curve of the sand.
Applsci 12 02363 g002
Figure 3. Floor plan of pile cap.
Applsci 12 02363 g003
Figure 4. Testing sensors layout: (a) 2 × 2 straight pile group sensor layout; (b) 2 × 2 inclined pile group sensor layout.
Applsci 12 02363 g004
Figure 5. Time histories of the pore pressure in the 300 mm saturated sand: (a) lower inner pore pressure ratio; (b) lower outer pore pressure ratio; (c) upper inner pore pressure ratio; (d) upper outer pore pressure ratio.
Applsci 12 02363 g005
Figure 6. Site acceleration variation during liquefaction of the 300 mm saturated sand: (a) lower acceleration time history; (b) upper acceleration time history.
Applsci 12 02363 g006
Figure 7. Time–history comparison of the pile cap’s acceleration in non-liquefied sand: (a) straight pile group; (b) inclined pile group.
Applsci 12 02363 g007
Figure 8. Time–history comparison of the pile cap’s displacement in non-liquefied sand: (a) straight pile group; (b) inclined pile group.
Applsci 12 02363 g008
Figure 9. Time–history comparison of the pile cap’s acceleration in the 300 mm saturated sand: (a) straight pile group; (b) inclined pile group.
Applsci 12 02363 g009
Figure 10. Time–history comparison of pile cap’s displacement in the 300 mm saturated sand: (a) straight pile group; (b) inclined pile group.
Applsci 12 02363 g010
Figure 11. Time–history comparison of the pile cap’s acceleration in the 380 mm saturated sand: (a) straight pile group; (b) inclined pile group.
Applsci 12 02363 g011
Figure 12. Time–history comparison of the pile cap’s displacement in the 380 mm saturated sand: (a) straight pile group; (b) inclined pile group.
Applsci 12 02363 g012
Figure 13. Schematic diagram of the pile foundation number: (a) the 2 × 2 straight pile group; (b) the 2 × 2 inclined pile group.
Applsci 12 02363 g013
Figure 14. Comparison of the bending moment envelope diagrams of straight oblique pile groups in non-liquefied sand: (a) No. 1 pile; (b) No. 2 pile.
Applsci 12 02363 g014
Figure 15. Comparison of the bending moment envelope diagrams of straight oblique pile groups in the 300 mm saturated sand: (a) No. 1 pile; (b) No. 2 pile.
Applsci 12 02363 g015
Figure 16. Comparison of the bending moment envelope diagrams of the straight oblique pile groups in the 380 mm saturated sand: (a) No. 1 pile; (b) No. 2 pile.
Applsci 12 02363 g016
Figure 17. Pore pressure time–history diagram.
Applsci 12 02363 g017
Figure 18. The p–y hysteresis curve: (a) 380 mm non-liquefied sand; (b) 300 mm saturated sand; (c) 380 mm saturated sand.
Applsci 12 02363 g018
Figure 19. The p–y hysteresis curve at 6.60–6.94 s: (a) straight pile group; (b) inclined pile group.
Applsci 12 02363 g019
Table 1. Basic properties of the sand.
Specific
Gravity
G s
Maximum Dry
Density
ρ d m a x ( k g / m 3 )
Minimum Dry
Density
ρ d m i n ( k g / m 3 )
Saturated
Severity
γ s a t ( k N / m 3 )
Effective Unit
Weight
γ ( k N / m 3 )
2.644 1.72 × 10 3 1.44 × 10 3 24.21 14.41
Table 2. Basic properties of the clay layer.
Saturated Unit
Weight
γ s a t ( k N / m 3 )
Buoyant Unit Weight
γ ( k N / m 3 )
Uniformity Coefficient
G u
Curvature
Coefficient
G c
1661.9531.048
Table 3. Overview of the test conditions.
Pile TypeModel SoilSaturated Sand Layer Thickness (mm)WaveformFrequency (hz)Peak Acceleration (g)Vibration Direction
straight pile group
inclined pile group
non-liquefied soil0sine wave30.15North-south pointing
straight pile group
inclined pile group
saturated sands300sine wave30.15North-south pointing
straight pile group
inclined pile group
saturated sands380sine wave30.15North-south pointing
Table 4. Amplifications under input sinusoidal waves.
Test ConditionsStraight Pile GroupInclined Pile Group
AccelerationDisplacementAccelerationDisplacement
Non-liquefied soil1.131.091.051.04
300 mm saturated sand1.831.581.101.06
380 mm saturated sand2.181.911.141.08
Publisher’s Note: MDPI stays neutral with regard to jurisdictional claims in published maps and institutional affiliations.

