Article

Coffee Roasting and Extraction as a Factor in Cold Brew Coffee Quality

by
Damian Maksimowski
1,
Natalia Pachura
2,
Maciej Oziembłowski
1,*,
Agnieszka Nawirska-Olszańska
3 and
Antoni Szumny
2
1
Department of Functional Food Products Development, The Faculty of Biotechnology and Food Science, Wrocław University of Environmental and Life Sciences, Chełmońskiego 37, 51-630 Wroclaw, Poland
2
Department of Chemistry, Faculty of Biotechnology and Food Science, Wrocław University of Environmental and Life Sciences, ul. Norwida 25, 50-375 Wroclaw, Poland
3
Department of Fruit, Vegetable and Plant Nutraceutical Technology, Wrocław University of Environmental and Life Sciences, ul. Chełmońskiego 37, 51-630 Wroclaw, Poland
*
Author to whom correspondence should be addressed.
Submission received: 28 January 2022 / Revised: 18 February 2022 / Accepted: 21 February 2022 / Published: 2 March 2022

Abstract

:
Due to the dynamic growth of the cold brew coffee market, the aim of this study was to identify and characterize main bioactive and aromatic compounds that may be helpful for quality control during the production of popular beverages. Using headspace solid-phase microextraction and GC-MS and LC-MS analysis, prepared cold brew coffee extracts were investigated and compared with different green bean roasting profiles and varying extraction temperature and time parameters. In terms of quantitative composition, the study showed that cold brew coffees are an exceptional source of chlorogenic acid. Therefore, they may change consumers purchasing decisions on the beverage market and establish a new and natural substitute for controversial energy drinks. The analyses confirm the possibility of producing a beverage with increased chlorogenic acid content above 900 mg/L or at a similar level of 400–500 mg/L with caffeine, which may be important on an industrial scale due to the possibility of diversifying beverage production. Furthermore, aroma compounds were presented as markers responsible for fruity or caramel–roasted-almond notes and changes in their concentrations according to the recipe were also presented. The best option for cold brew coffee production appears to be beans roasted in the 210–220 °C temperature range.

1. Introduction

Coffee is one of the basic agricultural commodities sold in the world and one of the most consumed beverages—mainly due to its pleasant taste, aroma and stimulating properties—and, recently, also due to its antioxidant properties [1]. In order to meet the needs of health improvement and the active formation of pro-health values in the human diet, a high dynamic of new food products’ development has been observed. Due to the characteristic way of production, cold brew coffee is clearly a new commodity category in the segment of coffee. The popularity of this handcrafted and premium product opened up lucrative growth opportunities for the global market. The global cold brew coffee market size was valued at USD 339.7 million in 2018 and is expected to register a CAGR of 25.1% from 2019 to 2025.
Cold brew coffee should not be confused with iced coffee, which is brewed hot and served over ice. In actual cold brew production, the coffee is brewed using water at room temperature or lower, between 4 °C and 25 °C, over a period of 12 to 24 h. It is claimed that the slow brewing process brings out only the best flavor compounds and a relatively small amount of hydroxy carboxylic acids compared to phenolic acids, which belong to antioxidants [2].
A conscious supply of dietary antioxidants helps to control reactive oxygen species and reduces the production of free radicals that arise as a result of life processes or as a consequence of adverse effects of external factors (smoking, unbalanced diet). Coffee can be an important source of a compound belonging to this group—chlorogenic acid, an ester of caffeic and quinic acid, which, in addition to neutralizing radicals and counteracting oxidation reactions, can additionally activate other biosynthetic pathways of antioxidant compounds [3,4].
During roasting, new compounds are also formed that affect the aroma and flavor of coffee. For example, pyridine and pyrrole derivatives are formed from lipid degradation and amino acids. A lot of studies on coffee’s volatile compounds relate to hot brewed coffee [5]. Furthermore, cold brew coffee lacks a uniform, standardized production process in terms of parameters such as extraction time, extraction temperature, dosage or roasting [6], also in the context of the sensory quality of the beverage.
The aim of the research was to determine the effect of parameters (roasting green beans followed by the extraction of roasted coffee at different temperatures and times) on changes in the content of chlorogenic acid, caffeine and volatile compounds in types of coldbrew products.

2. Materials and Methods

The raw material for the study was pulpednatural Arabica coffee, which came from the largest producer of a given botanical variety in the world—Brazil [7]. The roasted coffee was delivered from the local coffee roaster Etno Cafe in Wroclaw. Details of the coffee species name and roasting profile remain under company secrets. Coffee roasting process was prepared by using a professional IKAWA sampler model PRO100 (IKAWA, London, Great Britain, UK). The coffees delivered for analyses contained experimentally relevant data on final roasting temperature and were 210 °C, 220 °C and 230 °C for samples A, B, C, respectively. In addition, pure compounds of caffeine and chlorogenic acid Sigma Aldrich (Steinheim, Germany) were roasted with green beans at the same time and this was the author’s experiment. A model with pure compounds also consisting of sand grains c.a. 1.5 mm in diameter was the internal model filler.
Ground coffee with an average particle size of c.a. 1.6 mm (coarse grind) was used for extraction at a ratio of 5 g per 100 mL of distilled water. In order to minimize differences in the effect of environmental conditions on extraction, all samples were made using the immersion method in 250 mL beakers. After pouring water over the coffee, each sample was rotated by hand upside down, to stir the mixture evenly. This was repeated ten times for all variants. The beakers were then set aside until filtration without stirring to reflect the home beverage production conditions. Each option of coffee used for extraction was modeled under the following reaction environment parameters, i.e., for time of 6, 12 and 24 h and temperatures of 5 °C, 15 °C and 25 °C, respectively.

2.1. Solid-Phase Microextraction (SPME) and GC-MS Analysis

HS-SPME analysis was performed on Varian CP-3800/Saturn 2000 apparatus (Varian, Walnut Creek, CA, USA) equipped with a Zebron ZB-5 MSI (30 m × 0.25 mm × 0.25 µm) column (Phenomenex, Shim-Pol, Warszawa, Poland). Analysis was performed using a 2 cm DVB/CAR/PDMS fiber (Supelco, Bellefonte, PA, USA), which was exposed over the sample for 20 min and then desorbed at 220 °C for 3 min. Approximately 150 µL of extract was transferred to a headspace vial and maintained in a laboratory water bath at 60 °C. To each sample, 10 µL of a homogeneous suspension of 2-undecanone in water at a concentration of 1 mg/mL was added as an internal standard.
The GC-MS analysis was performed according to the following settings: the GC oven was programmed from 40 °C for 3 min, to 110 °C at rate 5 °C/min and then to 270 °C at rate 20 °C/min. Scanning was performed from 40 to 550 m/z in electron impact (EI) mode at 70 eV. The carrier gas in the analysis was helium with a flow of 1.0 mL·min−1. Samples were injected at a 1:5 split ratio. All analyses were run in triplicate.
Identification of the analyzed compounds using HS-SPME was based on three methods:
(i)
retention indices calculated using the retention index calculator were compared to values in the NIST17 database,
(ii)
spectra were compared to the NIST17 database,
(iii)
retention times were compared to retention times of authentic standards.

2.2. LC-MS Analysis

Identification and quantification of caffeine and chlorogenic acid contained in coffee samples were analyzed by LC-MS/MS. The previously prepared extract was diluted before analysis. Volume of 1 µL was injected. The analysis was performed on a Shimadzu 8045 LC-MS instrument. The separation was achieved on a Kinetex column (2.6 µm C18 100A, 100 × 3 mm, Phenomenex, Aschaffenburg, Germany) at 35 °C., using phase A (water with 0.1% formic acid) and phase B (methanol with 0.1% formic acid). The flow rate was set at 0.3 mL/min, and the program was as follows: 0.01–1 min 20% B, then up to 90% B until 8 min, then 90% B until 10 min, then to 20% B until reaching 12 min, and finally 20% until 15 min. The analyses were performed in MRM mode in positive ionization, and the mass spectrometer was operated at the following parameters: nebulizing gas flow 3 L/min, heating gas flow 10 L/min, interface temperature 300 °C, desolvation temperature 526 °C, drying gas flow 10 L/min. MRM analysis parameters are presented in the table below (Table 1). Analyses were run in triplicate.
The quantitative results of changes in bioactive compounds were statistically processed using the Statistica 13.0 software. One-way analysis of variance was made where the means in the post-hoc test were compared using Duncan’s test (statistically significant differences were those at the level of p < 0.05).

3. Results and Discussion

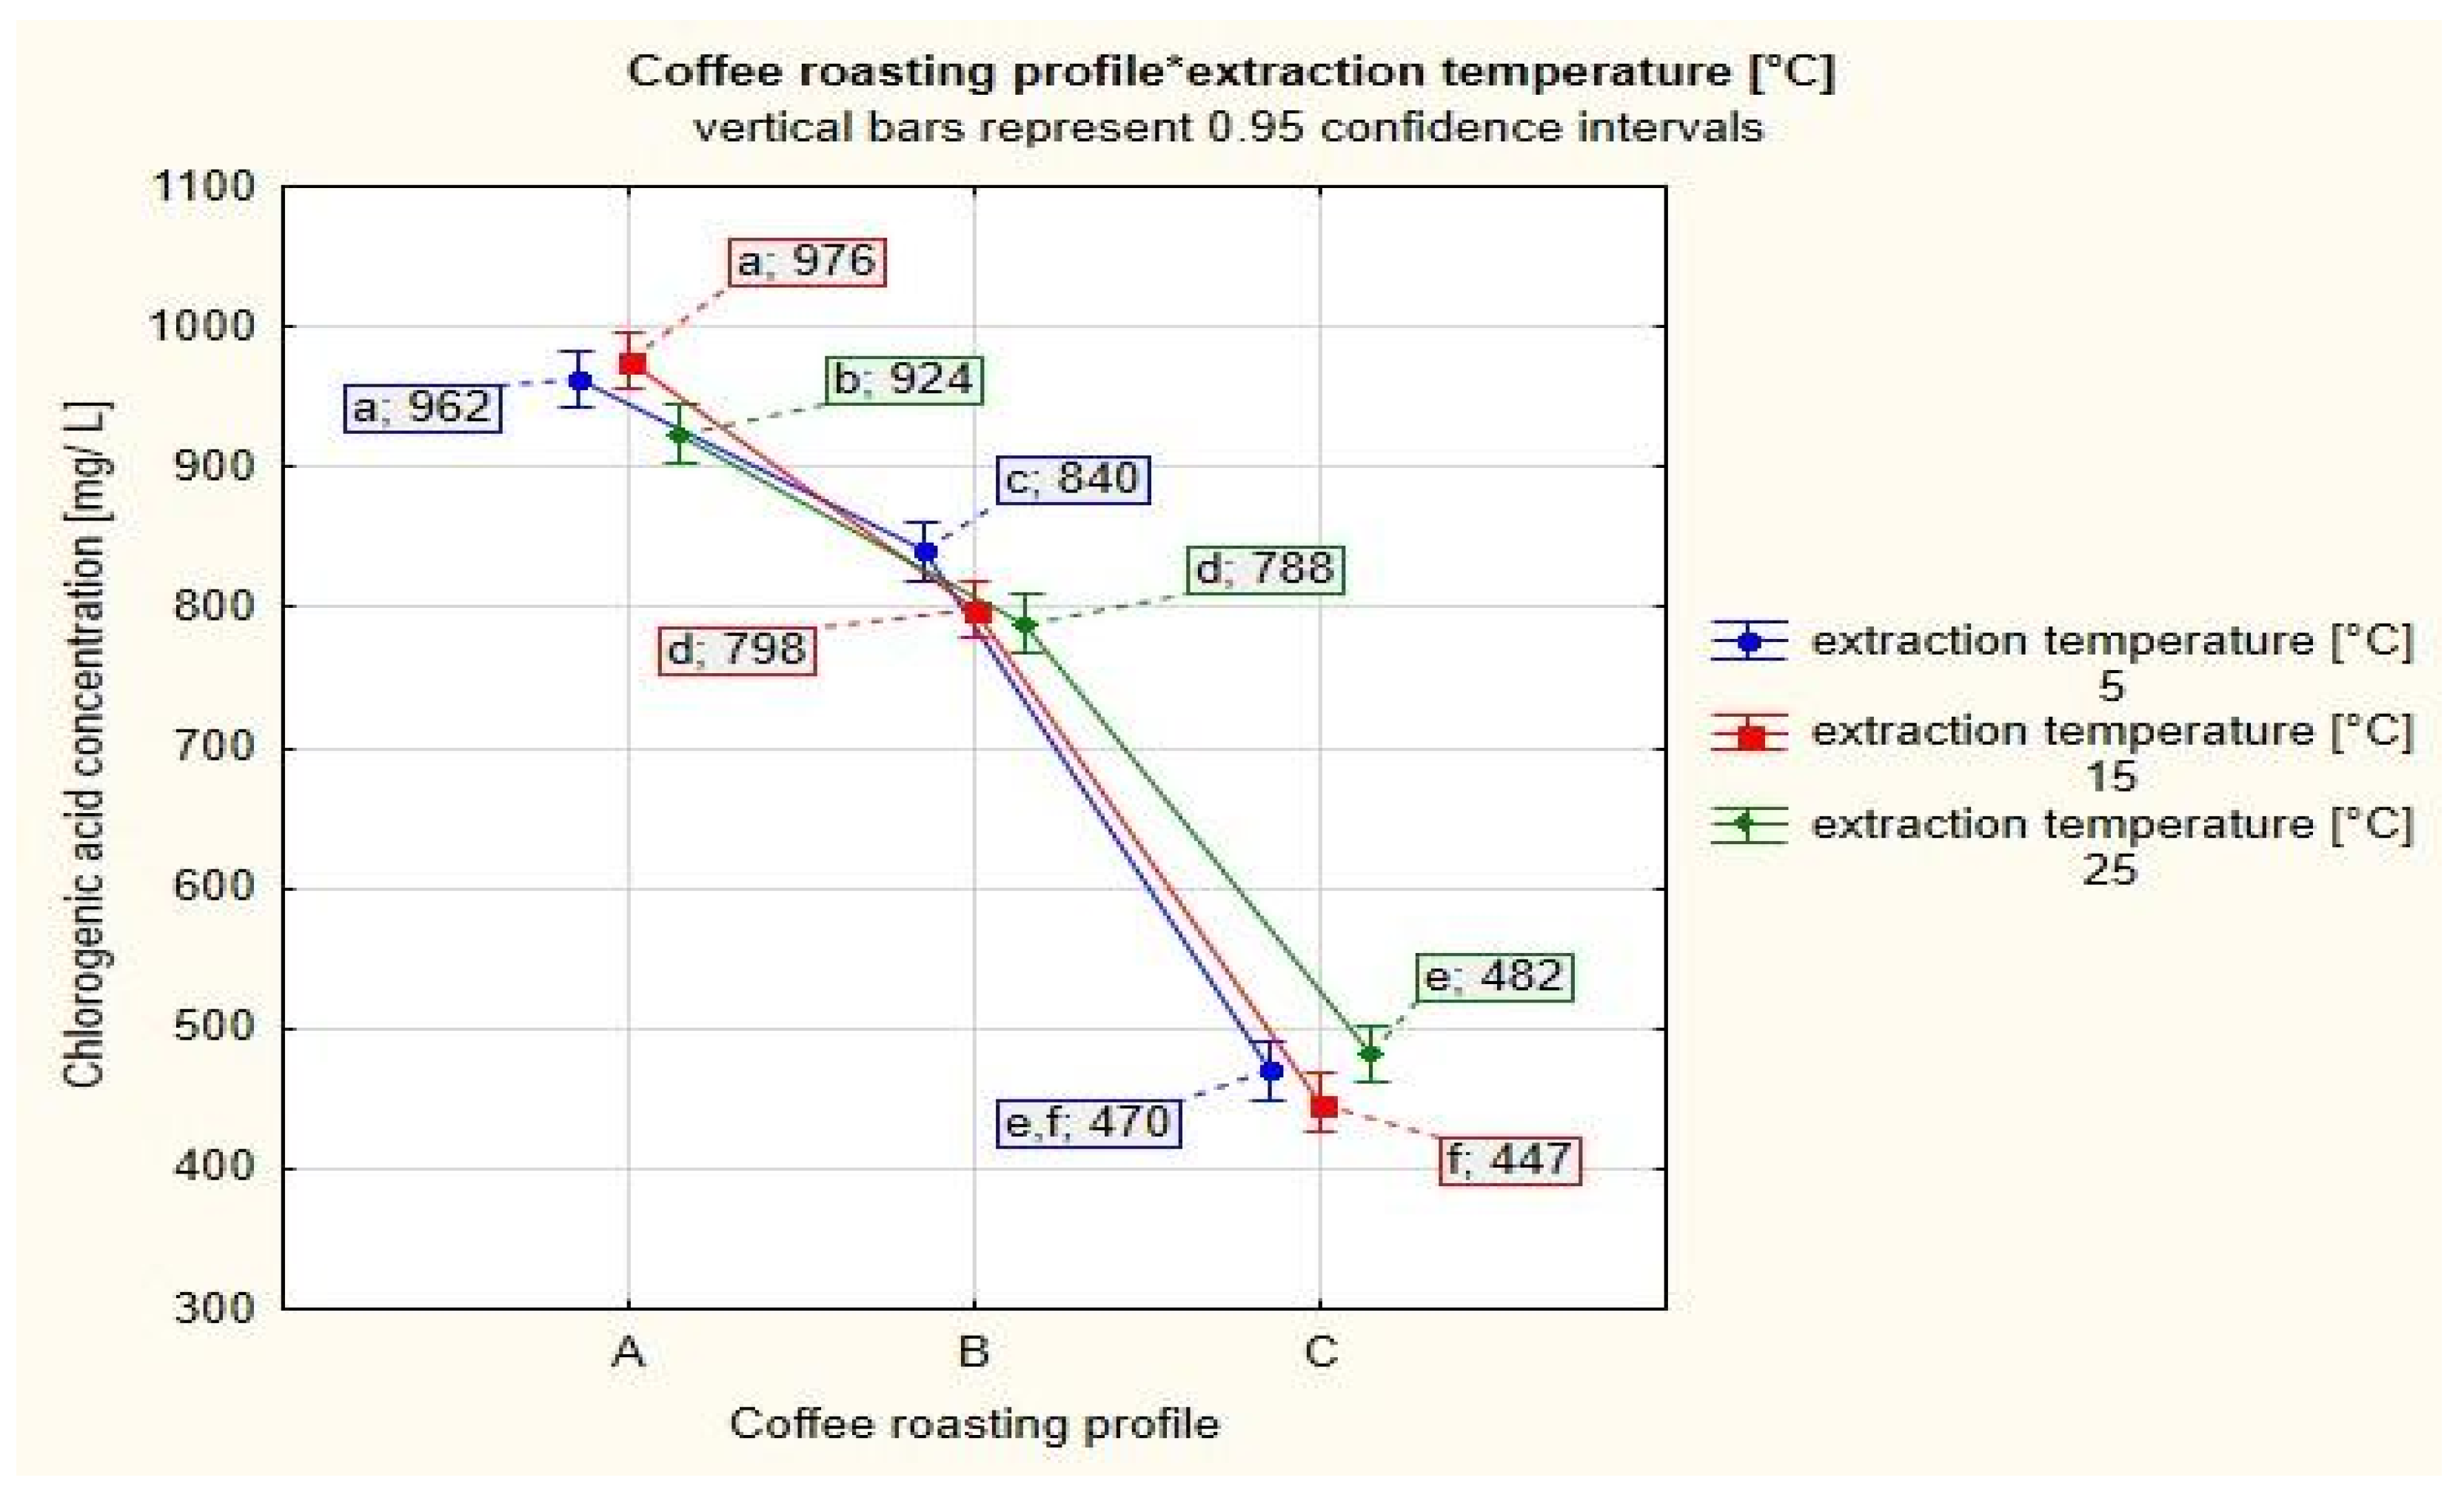
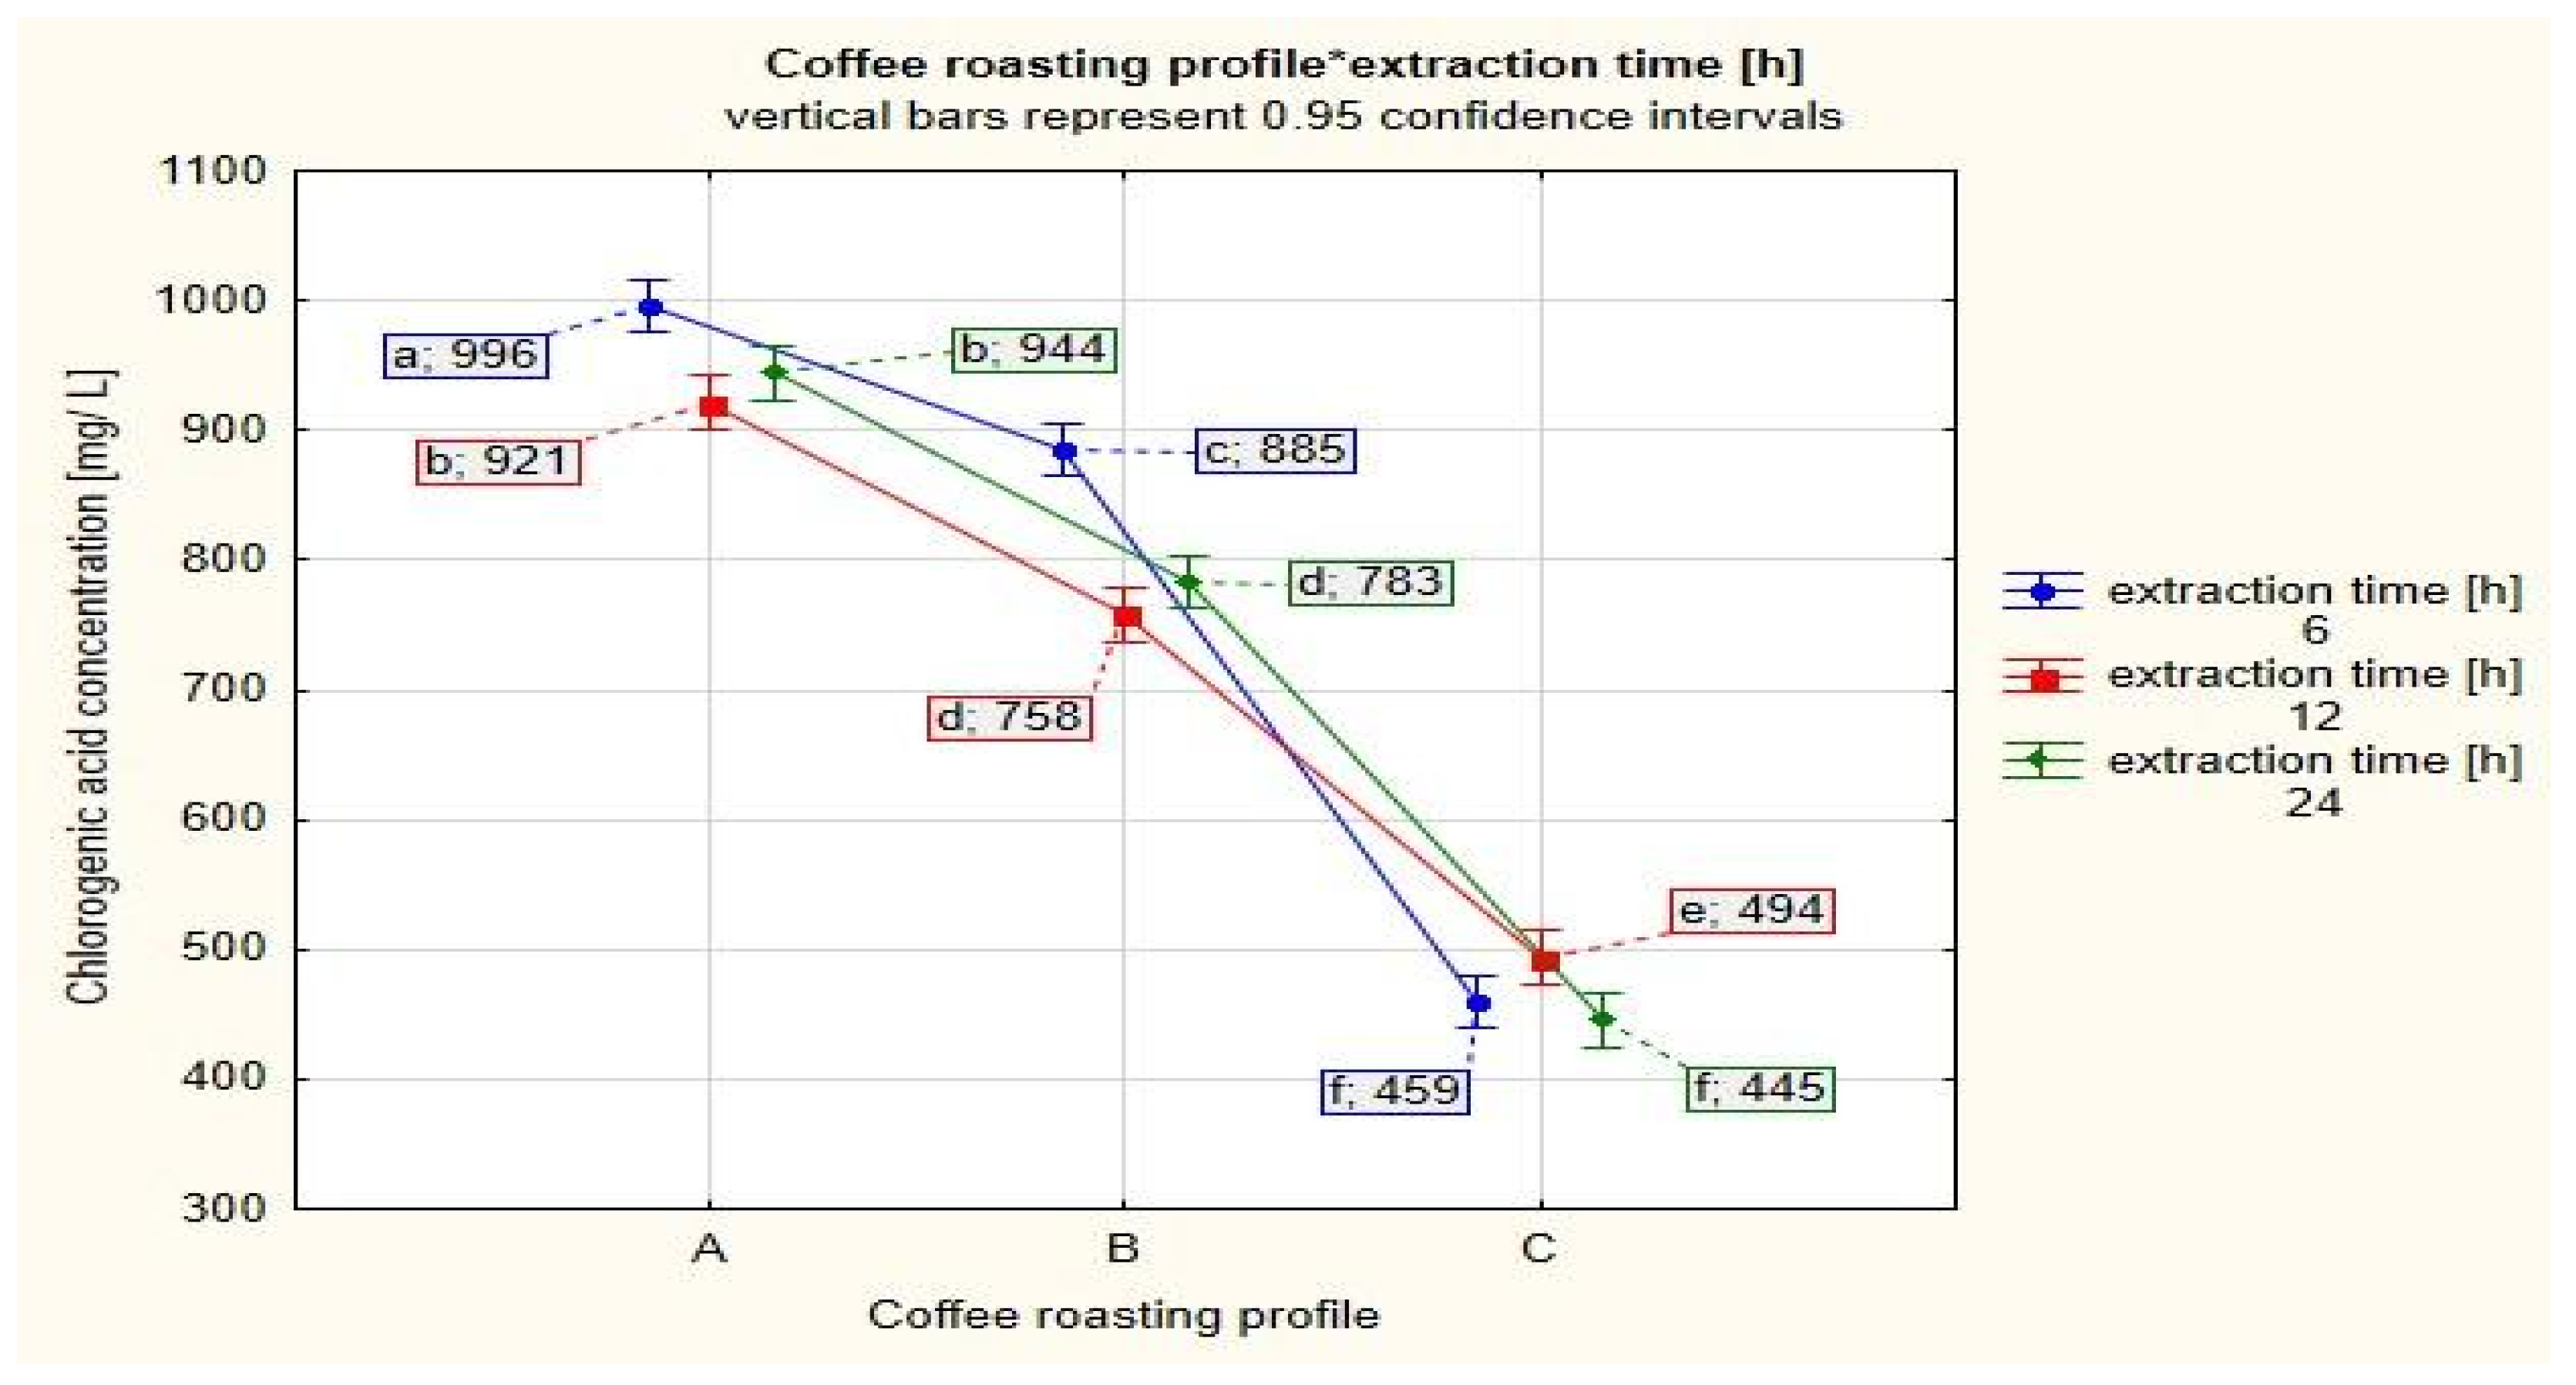
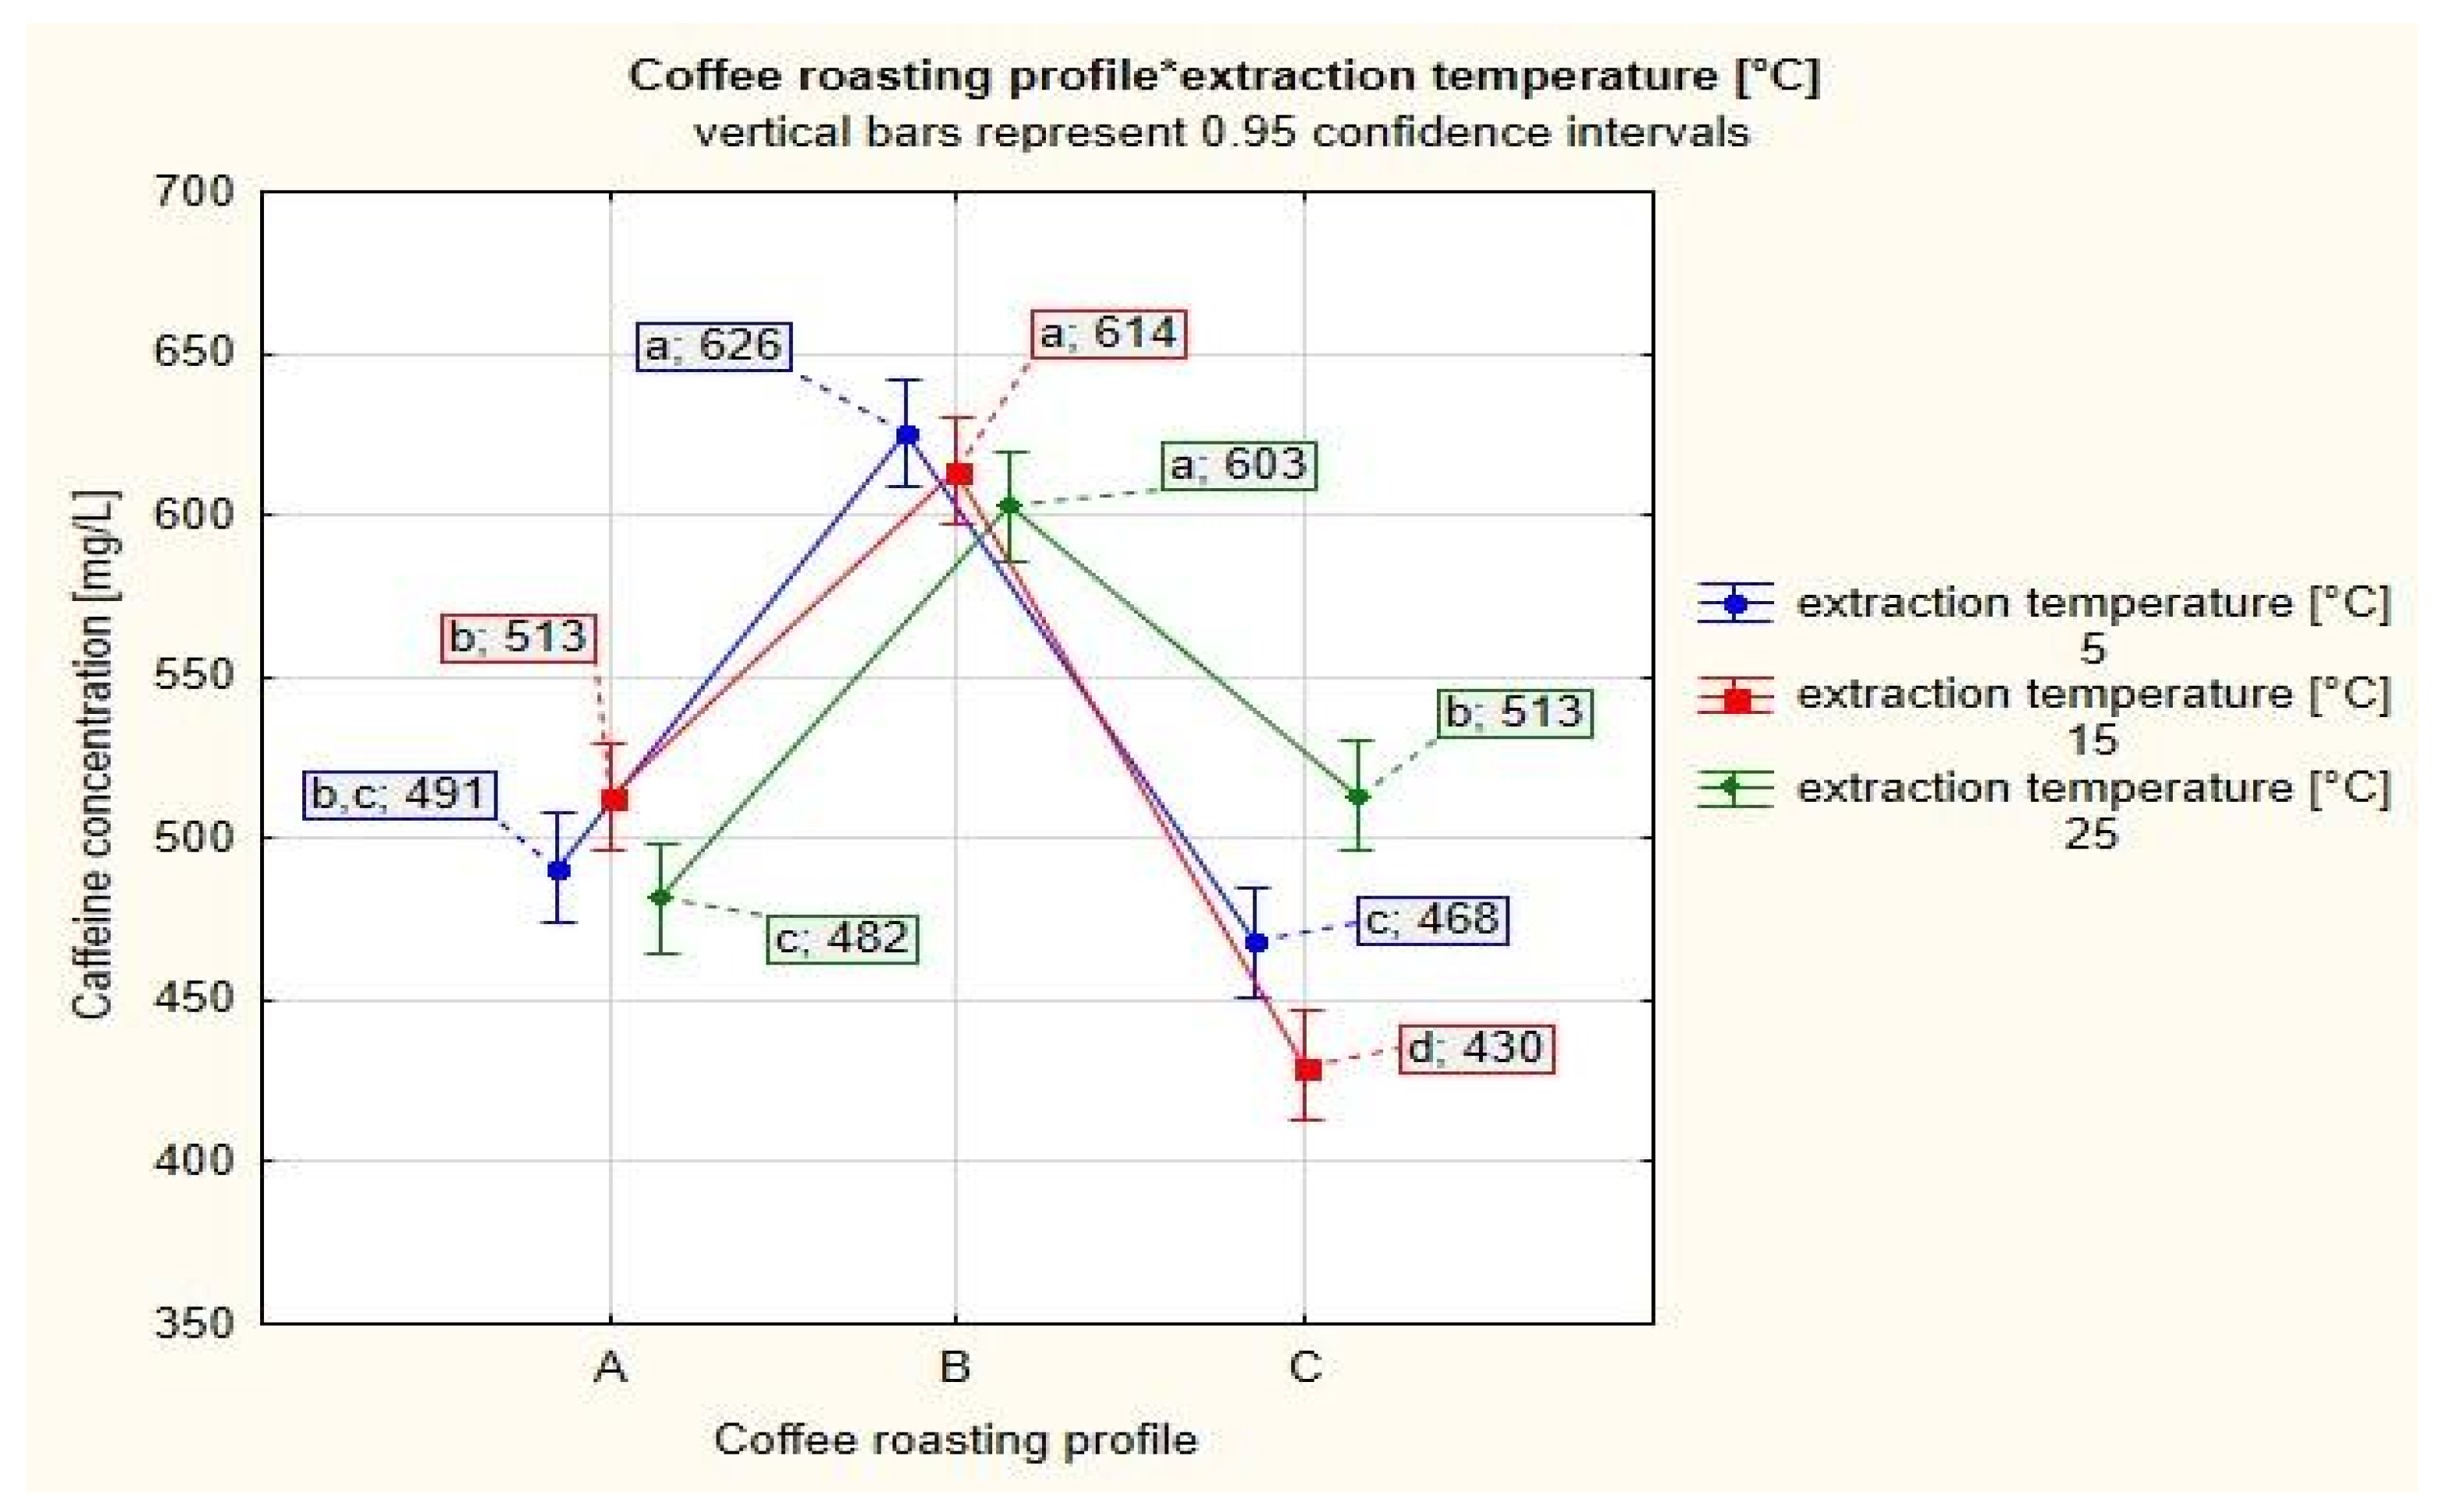
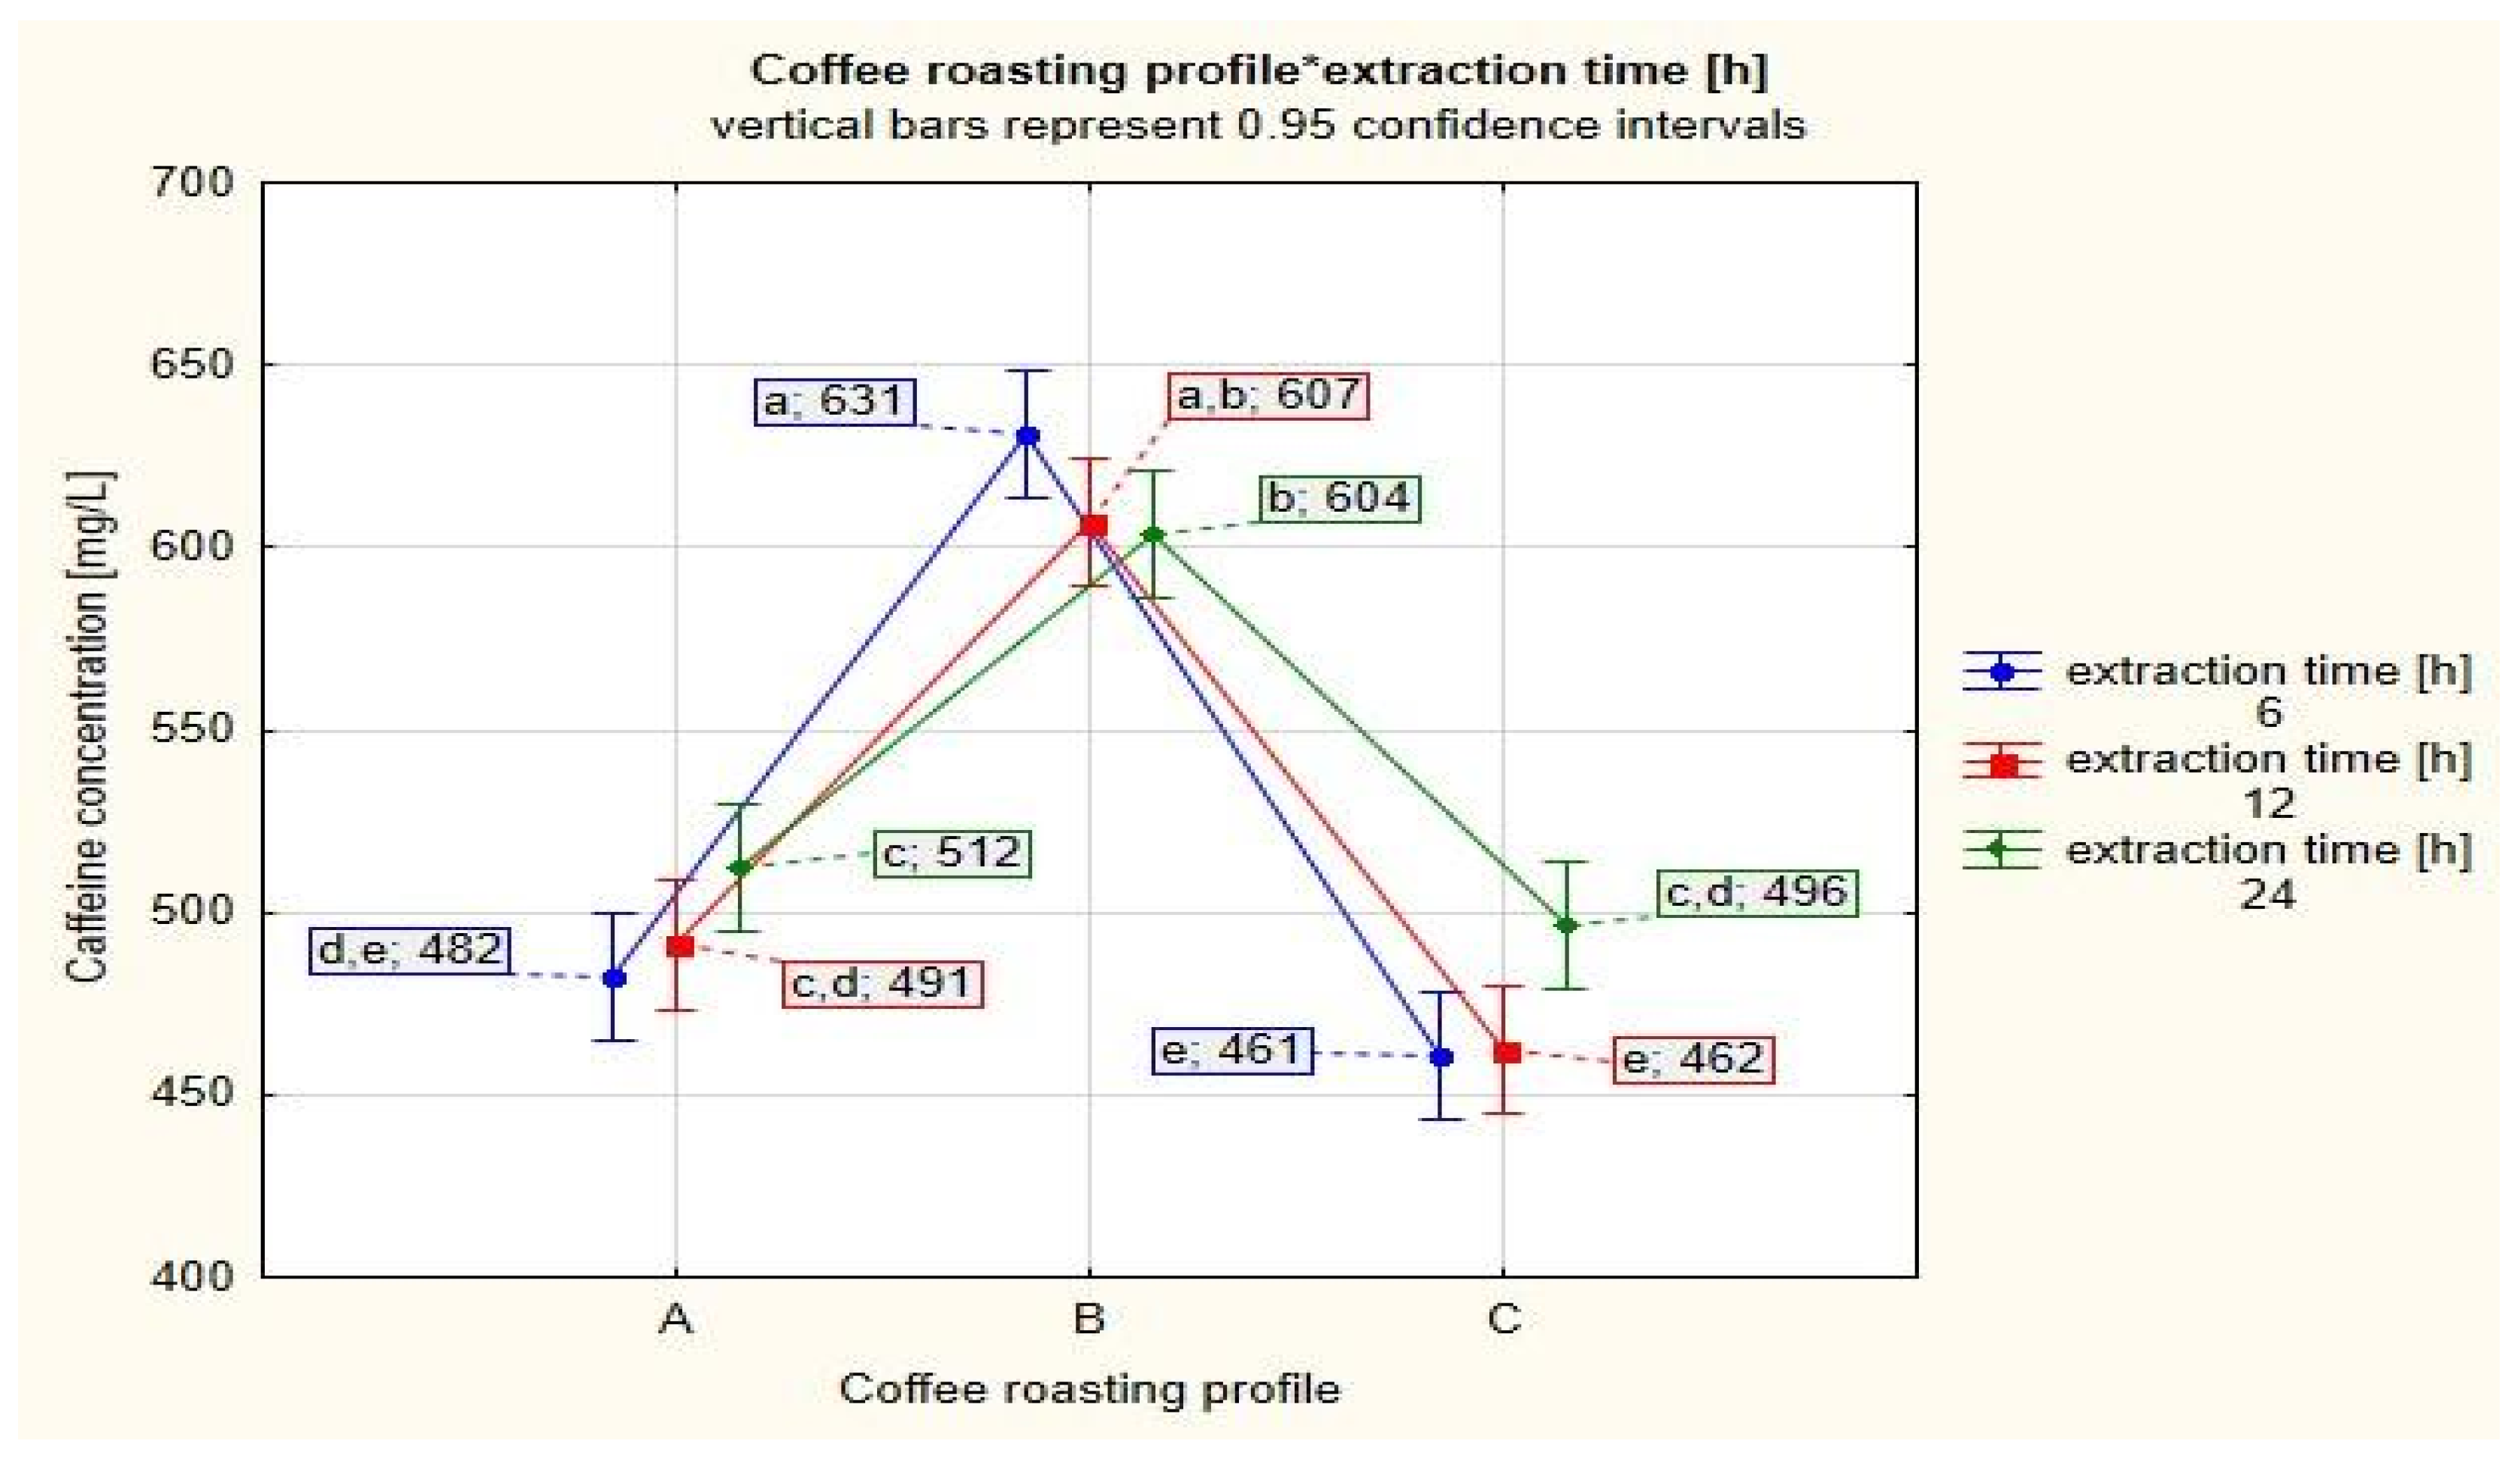
3.1. Caffeine and Chlorogenic Acid in Cold Brew Samples

This study demonstrated that caffeine and chlorogenic acid can be one of the basic analytical parameters in cold brew. Table 2 shows the results of bioactive coffee ingredients from 81 trials of popular beverages betweenthe coffee roasting coffee profile and extraction condition. Samples were formed in a matrix of three roast profiles × three extraction times × three extraction temperatures. Depending on the direction of technology development, the raw material rich in bioactive compounds may make the process less efficient and decrease coffee’s antioxidant capacity, stimulating properties or giving them the right quality.
Dybkowskaetal. [8] reported polyphenol levels depending on the origin and roasting conditions of the green bean. Researchers prepared hot (temp. 94 ± 2 °C, extraction time 5 min) drinks from 1 g of roasted coffee where the measured concentration of polyphenols was 21–43 mg. For calculations in the design experiment performed with cold brew beverages, only the content of chlorogenic acid—the main representative of coffee phenolic acids—was considered. The analysis suggests that, depending on the cold brew preparation method, the total content of polyphenols (along with chlorogenic acid isomers, phenolic acid derivatives and melanoid complexes with antioxidant properties) in the beverage may be higher than in hot brewed coffees.
As seen from Figure 1, a relatively high mean value content of chlorogenic acid was determined in the product made at 5 °C and 15 °C in the relationship between coffee roasting profile and extraction temperature. The difference between these results is not statistically important. It seems that an ambient temperature below 25 °C for cold extraction has a protective effect on changes in their composition due to, among other things, the inhibition of endogenous enzyme activity and preservation of biologically active components such as vitamins or polyphenols [8].
We highlight the lower than 25 °C temperature processing for cold brew beverages from light roasting coffee. On the other hand, the highest content of chlorogenic acid was determined for profile A in Figure 2—it reached 996 mg/L for 6 h against the variable of the extraction time, which is a much higher result than the extraction performed for 12 and 24 h. The smallest value in this relationship was 921 mg/L, marked as significantly lower, in the same way as the 944 mg/L value for 24 h extraction. As reported by Arnot [9], during the roasting process of green coffee beans, chlorogenic acid starts to decompose from 208 °C and the total polyphenolic content decreases with increasing temperature per kg of coffee. This information is confirmed by the graphs—there was a 10 °C difference between the roast profile of samples A and B, and a 20 °C difference between A and C.
It seems that extraction time in the first hours is more important than temperature and significantly affects the efficiency of chlorogenic acid diffusion into the solution. This is also indicated by the available literature data of Yen et al. [10]—the concentration of extracted bioactive compounds reaches an optimum value after a certain time, and prolongation of this time may even result in a decrease in the content of active components. The time of the 24 h trial, regardless of the conditions of the extraction environment, had a negative effect on the amount of the tested compound. The experiment carried out, reflecting different technological processes, shows that with increasing extraction time the content of chlorogenic acid decreases in all samples. Results for profile C are two times lower than profile A. According to Poltronieri and Rossi [11], high losses of chlorogenic acids are linked to their sensitivity to oxidation, mainly based on the activity of polyphenol oxidase (PPO) found in grains. In the presence of oxygen in the air, this enzyme catalyzes the transformation of phenolic compounds. During this process, quinones are formed and it cannot be ruled out that they play a role in the loss of coffee beverage quality [12].
Rao and Fuller [3] determined the content of caffeoylquinic acid along with its derivatives in six cold brew samples prepared from different types of coffee. One coffee from Brazil was also used in the study. The total amount of phenolic acid and its isomers was 2201 mg/L, and the concentration of the main compound 5-CQA (5-caffeoylquinic acid) was 1124 mg/L. The results presented here differ from those reported by Rao and Fuller, which may be due to the use of different analytical techniques and the amount of compounds tested. After calculating an average 5-CQA content of their six samples, the concentration of the compound is estimated to be 1012 mg/L. This indicates a significant approximation of the given value to the extracts prepared under the first variant of time and temperature, and the difference between the highest level of chlorogenic acid for the sample from profile A is 16 mg/L relative to an average 5-CQA. In another study, the authors Fuller and Rao [13] compared the chlorogenic acid content of coffee depending on the degree of roasting and grinding of coffee prepared for cold brew. They assigned the lowest determined value after 24 h of extraction to Dark–Coarse 360 mg/L coffee and the highest to Medium–Coarse 520 mg/L. After testing, all the results with the lowest chlorogenic acid concentration were found to be between 445 mg/L and 494 mg/L.
Figure 3 and Figure 4 below show that the caffeine content ranged from 430 to 631 mg/L. Another study analyzed the caffeine content of 20 different coffees bought in coffee shops in the United States. The amount of caffeine in the brews corresponded to 320 to 470 mg/L, and the caffeine content in coffee of the same type bought in the same shop six times in different portions corresponded to 540 to 1180 mg /L [14].
In the case of caffeine, the results indicate that the type of bean to obtain cold brew coffee with the highest concentration of this compound is coffee whose final roasting temperature reached 220 °C. For coffee B, the values were 603 to 631 in mg/L. It can be assumed that, under the influence of high temperature, part of the alkaloid was released from the cellular matrix structure of the bean under acid degradation, which favorably increased the concentration of this compound in the final extracts with respect to profile A. In contrast, a decrease in caffeine content was observed for profile C extracts. It seems that caffeine is easier to extract from dark roasted coffee, but in the raw material obtained close to its melting point [15], there is clearly a reduced strength of its extraction in the prepared solution.
The results of the experiment conducted by Dankowska and Misiak [16] show that the amount of caffeine depends on the brewing method. Higher water temperature causes faster diffusion of the alkaloid. Full extraction occurs only in water at 100 °C after 15 min. In the case of cold brew coffee, it has been noted that the full extraction of caffeine can also be achieved in water at room temperature—the time of contact between the coffee and the water is important. The degree of grinding can be an additional factor affecting the caffeine content of cold brew by accelerating its diffusion in the initial hours of extraction. It should be noted that in addition to the extraction method, the ratio of coffee to water is an important determining factor. Information on the caffeine content of cold brew beverages prepared with different ratios was presented by de Paula and Farah [14]. For a ratio of 7 g of coffee per 100 mL of water and an extraction time of 12 h and a temperature of 10 °C, the authors report an average caffeine content of 523 mg/L. These data are similar to the average caffeine content of our conducted study. Moreover, the average reported caffeine content of coffee infusions obtained from different blends and different methods of cold brew preparation was much higher—close to 860 mg/L [14].
Although many studies have been conducted on hot coffee extraction, research on cold brewing is more limited and known laboratory techniques are applied in some studies today in order to understand the difference between them. Kyroglou et al., because of low total solids yield and long extraction times in cold brew coffee production, studied the process of optimization and found that caffeine concentration and yield were significantly influenced by vacuum cycles (accelerating extraction and increasing the content of, compounds in the final beverage). A maximum concentration of 10.02 g caffeine (per kilogram) was achieved through a combination of vacuum cycles and the duration of each cycle [17]. On the other hand Ahmed et al. explored extraction with ultrasonication techniques to observe changes in the physicochemical properties of cold brewed coffee [18]. Their results led to significant increases in total soluble solids and most organic compounds. For example, caffeine reached a maximum level of 19.97 g and chlorogenic acid 2.1 g (per kilogram). The higher concentrations achieved by ultrasonication can be attributed to a better disruption of the cell walls, which also depends on the power and time of processing.
HPP treatment (High Pressure Processing) can also disrupt cell walls and other organelles in coffee, resulting in increased mass transfer rates of solutes during extraction. Zhang et al. [19] used HPP for medium, coarse and whole coffee beans and subjected them to 400 MPa for 10 min. They next allowed all samples to stand at 22 °C for 44 h for whole beans to achieve a comparable brew Total Dissolved Solids (TDS) as that from the ground coffee for 18 h extraction. Their results showed that infusions prepared from ground coffee beans had higher caffeine and chlorogenic acid concentration than those prepared from whole beans. This effect was demonstrated by the following levels: caffeine 0.48 g/L alone and 0.49 g/L with HPP, and chlorogenic acid 0.96 g/L alone and 1.01 g/L with HPP. We can state that exploiting HPP achieved comparable results to our research.
Despite different approaches for us, this study showed very important information from a scientific point of view, but it needs to be highlighted that not every cold brew coffee producer can buy often expensive equipment, i.e., vacuum technology. We conclude that the aforementioned processes are an alternative processing method.
We can find a similarity to the study of Wang and Lim [20] due to the idea of helping manufacturers of cold brew to design and control their production in traditional ways. They studied coffee extraction at different temperatures and grind size conditions to better understand the cold and hot brewing process. Overall, increasing the extraction temperature from 4 to 93 °C increased the TDS values at equilibrium by about 23, 24, 27 and 27% for espresso, which ultimately showed 2.13% of TDS. In water, coffee extraction proceeds through an initial fast extraction stage followed by a much slower extraction stage, corresponding to the extraction from the surface of broken cells and extraction from intact coffee cells, respectively. Thus, it can be concluded that it is not necessary to prolong the time of extraction over 12 h with respect to coarse grind and room temperature. Additionally “bitter” and “harsh” compounds are less water soluble in cold temperatures.

3.2. Caffeine and Chlorogenic Acid in Experimental Model Samples

Analyses of the effect of temperature on the content of pure compounds for the analysis of caffeine and chlorogenic acid in model samples with sand–filler matrices as protective layers, were an important part of the innovation of the study. With similar sample exposure times and final temperatures of the green beans’ roasting profile, important changes in the decomposition of the bioactive compounds were observed in experimental prepared samples, as shown in Table 3.
Figure 5 shows cell wall development in coffee fruit. The cell walls begin to thicken due to the deposition of complex cell wall polysaccharides (CWSPs). This period also corresponds to the storage phase, in which additionally to cell wall polysaccharides, the endosperm (coffee beans) begins to accumulate storage proteins, triacylglycerols, alkaloids (especially caffeine) and conspicuously high amounts of chlorogenic acids (CGAs). In green coffee beans, galactomannans are the most abundant polysaccharides, which make up 50% of the dry weight, followed by arabinogalactans (up to 15%) and cellulose, organized into microfibrils via inter and intramolecular strong hydrogen bonds and Van der Waals forces [21]. Therefore, the degree of degradation of the caffeine and chlorogenic acid components in coffee is somewhat different compared to what we found in our results between coffee and ingredients alone.
During the roasting process, the CWSPs undergo some structural changes. It can be considered that above a temperature of 220 °C, the chemical composition of the green coffee cell wall ceases to protect the bioactive compounds. CWSPs are degraded, with galactose and mannose being the two most heat-sensitive sugar components, which play protective roles for other ingredients. This makes it possible to assess under which roasting profile conditions health-promoting components can be retained and, thus, to optimize the processes of roasted coffee processing technology into functional foods.
We highlighted that 230 °C relative to 210 °C of roasting profile can decrease close to 50% of the chlorogenic acid in green beans. Another interesting value is 220 °C, at which if acid degradation reaches 20%, the caffeine value increases by about 20%. Thereafter, the caffeine concentration drops below the 210 °C profile value in the variant using the highest temperature during coffee roasting. In the context of caffeine, results were consistent with the model matrix samples experiment, where a given compound that is not a biochemically-contained component in the plant showed a similar decrease in concentration between 210 °C and 220 °C. Regardless of the final roasting temperature in the film, CQA was completely degraded. The results indicate significant binding of chlorogenic acid to caffeine in green coffee.

3.3. Volatile Compounds of Cold Brew Samples

Many operations and parameters affect the final product, changing the chemical composition of raw materials and intermediates before the end of the technological process. During roasting, the Maillard reaction, caramelization and other chemical reactions dramatically change the coffee beans’ composition, as well as the colors and volatiles of green coffee beans. As a result, desirable and potentially dangerous compounds are formed. For example, Hyong et al. [22] studiedα-dicarbonyl compounds and 4-methylimidazole in coffee made with various roasting and brewing conditions. In general, the espresso method, using smaller coffee bean particles, led to significantly higher concentrations of α-DC and 4-MI than cold brewing, and in the cold brew method, the highest concentrations of α-DC and 4-MI were found with the largest coffee bean particles. The average total α-DC concentration in their cold brew was 37.5 μg/mL and in 4-MI was 59.6 μg/mL. These contents were higher due to higher roasting temperatures (235 °C/13 min, 240 °C/15 min, 245 °C/17 min).
Regardless of coffee bean quality, Cordoba et al. [23] determined the sensory profile, physicochemical characteristics, and volatile and non-volatile compounds in two brewing methods: cold and hot. Their coffee beverages were more differentiated by brewing method than by the coffee bean quality used in the preparation. Cold brew coffees were mainly associated with volatile 2-methyl-butanal, 5-methyl furfural and dihydro-2-methyl-3 (2H)-furanone followed by relative percentage concentration, respectively: 3.4–42%, 14.49–14.68% and 1.1–1.13%. Hot brew coffee beverages were identified with some specific furans and 2-methoxy-4-vinylphenol. We didnot find 2-methoxy-4-vinylphenol in our research but did find some furans.
To date, many studies on volatiles have shown that furans and 5-hydroxymethylfurfural (5-HMF) were found, for example by Park et al. [24]. Authors ranged from levels of 5-HMF in coffee samples between 51 and 1143 mg/L. We agree with the presented research because the higher temperature of roasting coffee causes the increase in the mentioned compounds and others as a result of the Maillard reaction. It is worth noting that cold brew contains less of these compounds compared to hot coffee [25].
Figure 6 below shows an interesting proposition of the main volatile compounds’ (VOCs’) formation reactions in coffee based on other authors [18].
During production, many operations and parameters influence the final product, changing the chemical composition of raw materials and intermediates before the end of the technological process. The different extraction conditions used by independent producers of a coffee beverage can indicate a different composition of volatile compounds. The experiment was designed to highlight the importance of different extraction methods to detect and characterize particular compounds. Generally, a test for VOCs was performed in a similar matrix to caffeine and chlorogenic acid (three roast profiles × three extraction times × three extraction temperatures) and the results are shown in Table 4 below.
Selected compounds from all of the marked volatile compounds belong to the following groups.

3.3.1. Aromatic Alkyl Pyrazines

Hundreds of compounds have been identified as coffee flavor components where pyrazines in coffee are determined in predominant amounts in similar studies [26]. Pyrazines are monocyclic aromatic rings with two nitrides (in the para position). The formation of pyrazines is related to the process of heating food—amino acids react with sugars in Maillard reactions. A longer roasting profile also resulted in their increase. Many of these compounds are intense and exhibit very low odor thresholds—for example, 2,5-dimethylpyrazine has an odor threshold of 1 ppm in water [27]. Pyrazine compounds give a coffee, nutty, roasted, earthy aroma [28]. Its derivatives may contribute to reducing free radicals in the body [29].
In the case of pyrazine, the lowest value was determined for sample A 12h 5 °C—0.3 µg/g, whereas an average was achieved at 4.0 µg/g. Furthermore, 11 samples from 27 reached more than average. It has a pungent, sweet smell that becomes floral when diluted [30].
2-methylpyrazine was the most abundant compound among the pyrazines group in the experiment. This is in agreement with the results of Kremer et al. [31], who reported a range of concentration of the aromatic compound in coffee from 34.8 ppm to 91.6 ppm. The mean value in our study was 47.9 ppm, the overall range was between 1.0 and 121.5 ppm (µg/g). The knowledge gained from the effects for the example of time and temperature suggest that 2-methylpyrazine is made by asparagine and fructose rather than glucose [32]. It is defined as nutty, roasted, grassy and chocolaty in dilution [30]. It is noteworthy that its thresholds of odor detection in water, oil and air are as follows: 30–100, 27 ppm and >2000 µg/m3 [33].
Ethyl pyrazine—a derivative of methylpyrazine—is characterized by completely different odor properties, which is largely due to an additional methyl group in the side chain. Its aroma is described as nutty, sweet, buttery, rum-like with an odor detection in water of 4–21 ppm and oil 17 ppm [34]. In a study by Abdelwareth et al. [35], the authors reported the percentage range of ethyl pyrazine in macerated coffee, at a ratio of 1.0 g coffee ground per 5 mL water for 18 h with occasional stirring, to be in the range of 0.65–4.16%. After converting the concentration in our research from the mean value 25.6 µg/g to %, we obtained a higher average ethylpyrazine content in samples. This was 5.94%, summarized by samples A, B and C, respectively: 1.02%, 2.70% and 2.22%. This suggests that the concentration of pyrazine compounds and their derivatives increases with the degree of coffee roasting (more than 50% comparing 210 °C with 220 °C and 230 °C).
Pyrazine, 2,6-dimethyland Pyrazine, 2,5-dimethyl: The research carried out by Kłosowskiand Błajet-Kosick shows that especially when heat treatment is too intense, DMP is formed [34]. The results of Yu and Zhang [36] also showed that the reaction between L-ascorbic acid and L-threonine/L-serine leads mainly to the formation of pyrazines. Many of these are alkylpyrazines, such as 2-methylpyrazine, 2,5-dimethylpyrazine and 2-ethylpyrazine [36]. On the other side, Jinap et al. indicated a significant decrease in DMP with an increase in polyphenol concentration [37]. They are characterized by a nutty, sweet, toasted aroma [34].
The concentration values of dimethylpyrazine ranged from 3.70 to 145.4 µg/g in the analyzed extracts and we confirmed that concentration increases with the higher final temperature roasting of green coffee beans. In a similar study for cold brew, the concentration was calculated to range from 4 to 23 ng/mL of the extract by SPME-GC/MS method [5]. This range differs from the result presented in our experiment because the average concentration was 47.0 µg/g.
The concentration of this compound in roasted coffee ranges from 2.0–2.2 ppm [30].

3.3.2. Pyridine

Pyridine is formed during strong and long roasting processes and has previously been proposed to originate through the decomposition of trigonelline and by Maillard chemistry [38]. It has bitter, burnt, roasted and astringent properties and can impart a sharp, burnt taste at concentrations as low as those on the ppm scale. In the aspect of the study by Heo et al. [5], pyridine was determined for, among others, a Starbucks sample (1229 ng/mL), which suggests that beverages can have a burnt taste. Corresponding to these studies, an average result of pyridine contained in the extracts was 18.8 µg/g, the highest, 50.3 µg/g, was for coffee made from the highest temperature of roasting, and the highest temperature and time of extraction. Thus, the lower pyridine content in the beverage may indicate a mild and delicate taste.

3.3.3. Furans with Alcohol Function

α-furfuryl, included in this group, was not present in green coffee but formed during roasting. Coffee produces furfuryl alcohol in larger quantities, more than 400 µg/g, compared to other beans or seeds. Furfuryl alcohol production resembles that of other process contaminants (e.g., HMF, acrylamide) produced in coffee roasting, but to date do not reflect the total amounts produced during roasting because great amounts of furfuryl alcohol (up to 57%) evaporate and are released to the atmosphere during roasting. Hypotheses concerning the formation of furfuryl alcohol include a model of the glucose and alanine system from the intact C1–C5 or C2–C6 carbon skeleton of glucose and through an unknown mechanism, with glyceraldehyde as a potential intermediate [39,40].
Roasted coffee is correlated with the undesirable burnt and bitter fraction of coffee [30]. In brewed coffee, furfural is described as cooked pea and smoky [41]. As a result of the analyses, the highest concentration of this compound was 98.7 µg/g for sample B 6h 15 °C, noting that this value was much higher than an average value of 26.3 µg/g. Moreover, the highest concentration from sample A was 81.8 µg/g for A 24h 5 °C, from sample C was 61.7 µg/g for C 12h 15 °C. This compound during chemometrics-based GC-MS aroma profiling [35] was detected in only half of the samples analyzed, including cold macerated coffee. In wine, furfural may, chemically or microbiologically, convert to 2-furanmethanol. The concentration of 2-furanmethanol was assessed by other researchers and the lowest value was 4.11 mg/L and the highest was 8.12 mg/L in prepared coffee extracts [42].

3.3.4. Furans with Ketone Function

The prominent compound of this group was 3(2H)-Furanone. Furanone is prepared by the oxidation of furfural [43] or in lower yields from pyrrole reduction with glucose by heating [44,45]. The measured content ranged from 0.5 µg/g to 14.8 µg/g. Based on the available literature, it was found that the concentration of this constituent significantly depends on the extraction method performed and the assay methodology and can reach a threshold value of 1.20–1.80 ppm, an average content of 9.7 ppm or can be absent in coffee at all [30]. This pleasant-smelling furan derivative is a volatile component of the aromatic complex of roasted coffee and has a pleasant, sweet caramel character with a nutty note [46]. The compounds are also important in the flavor of strawberry, raspberry, pineapple and tomato but the route of biosynthesis is unknown [47].

3.3.5. Alkylthiazole

4-Methylthiazole was the only distinguished compound in cold brew extracts. It is made not only by Maillard browning reactions and fatty acid oxidation but also by inter and intramolecular cyclizations of sulfur-containing compounds. One of the most quoted explanations for their formation in heated foods would be the thermal interaction of reactive sulfur-containing compounds such as amino acids with other reactive compounds such as carbohydrates or carbonyls, for example L-cystine with glucose at various temperatures [48].
The maximum value of the component was 4.0 µg/g for coffee profile A. It should be noted that the mean in the analyses was much lower, reaching 0.9 µg/g. Nevertheless, the assigned concentration 4.0 µg/g would indicate a tomato, green fruit aroma. Comparing the studies of two authors, the 4-methylthiazole content in grains was estimated at 0.4–1.5 ppm [30].

3.3.6. Furans with Aldehyde Function
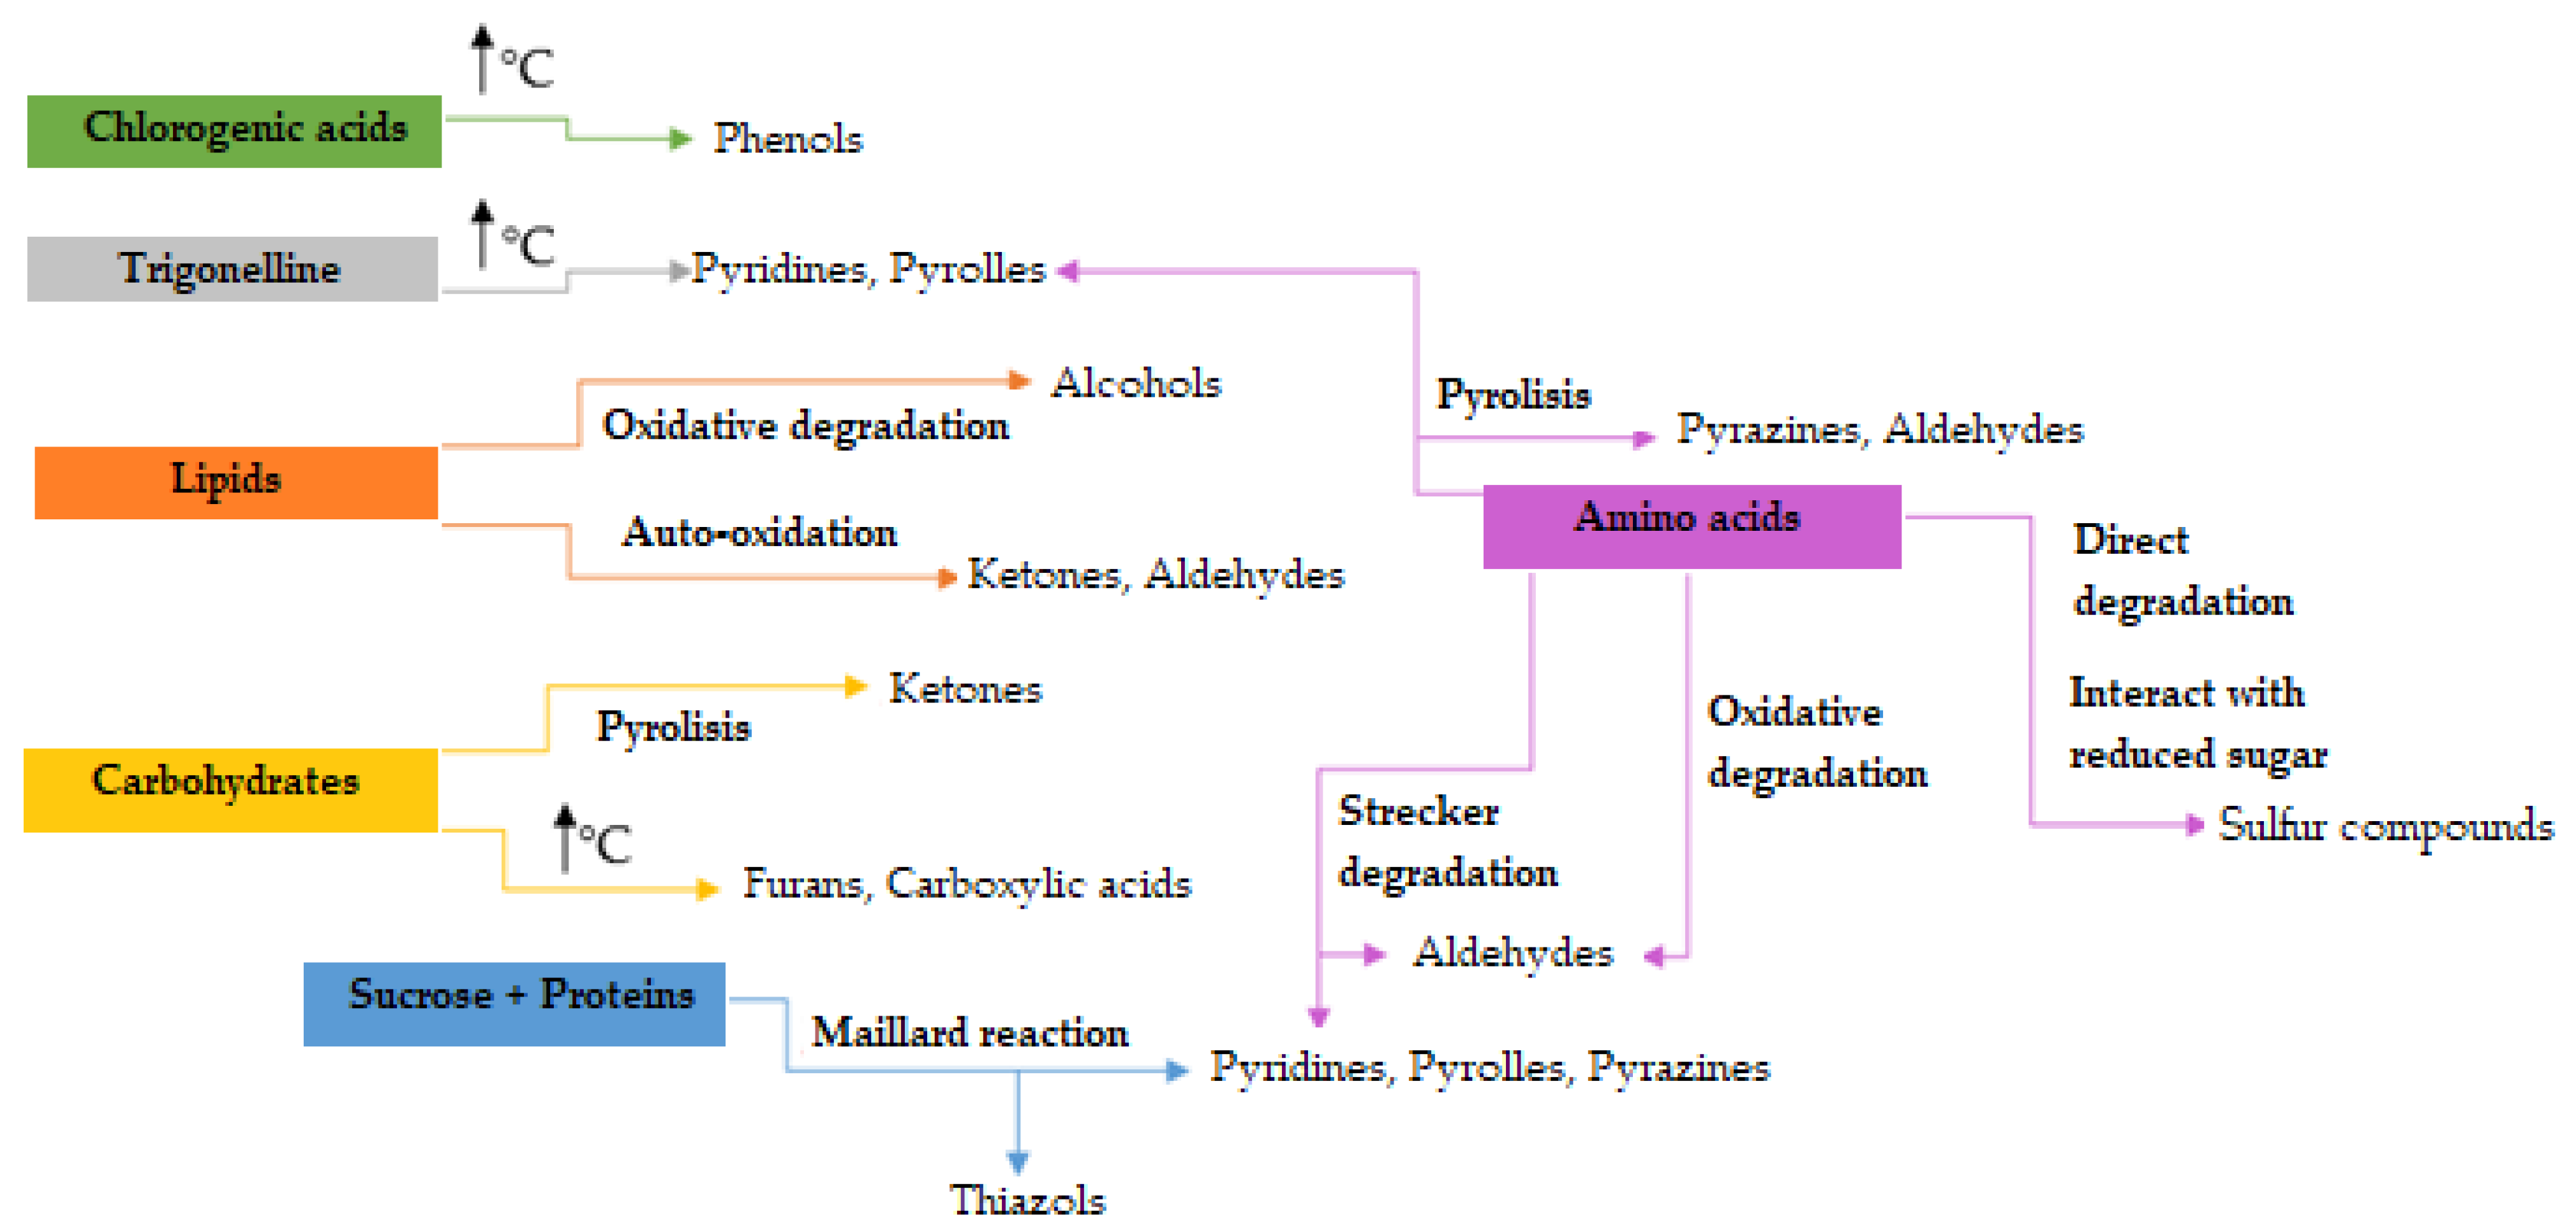
In this study, furfural and 2-Furancarboxaldehyde, 5-methyl were determined.
Furfurals have been detected in sugar rich foods such as juice and honey as well as coffee. It is an organic compound in the decomposition of xylose and can be produced under thermal conditions. Three pathways were found to coexist for the formation of furfural:
(i)
the Maillard reaction induced by saccharides and nitrogenous compounds,
(ii)
the direct cleavage of pentose,
(iii)
indirect conversion from pentosan, which only made a minor contribution [49].
The analysis of total xylose in a wide selection of green coffee and the assessment of its fate during processing allowed the derivation of a maximum total xylose limit of 0.40% [50].
2-Furancarboxaldehyde, 5-methyl (HMF) is formed either by acid catalyzed degradation of reducing sugars or via the Maillard reaction. Fructose was found to be twice as reactive as glucose in the formation of HMF and brown pigments. The reaction consists of a structural change of hexoses into an intermediate 1,2-enediolic form (containing a double bond and containing 2 hydroxyl groups), which rapidly eliminates water. The presence of HMF depends on temperature, pH, sugar concentration and the water activity, which plays an important role in the degradation of sugars. HMF formation increases proportionally with the decrease in water activity, pH and higher temperature of the system [51,52]. In any case, the heating processes and HMF content can affect the quality of such products.
The effect of brewing methods on furfural levels was investigated by Chaichi et al. [53]. Furfural concentrations were reduced after hot coffee brewing, with a slight increase after espresso brewing. Hot coffee preparation contributed to a higher loss of furan compounds (about 87%) compared to espresso brewing (about 47%). This can be explained by additional furan formation during brewing due to high pressure (3.5 bar) and temperature. In a similar research to Chaichi et al. the furfural content averaged 71 μg/mLin espresso [54]. Compared to cold brew coffee, an average result reached 86.8 μg/g for furfural and 47.4 μg/g for 2-Furancarboxaldehyde, 5-methyl. Only in one sample from profile A (24h 15 °C) was the concentration higher than average in relation to furfural. This means that lower coffee roasting temperature decreases the content of this compound in cold brew coffee. The aroma of furfural was described as pungent but sweet, similar to bread, caramel and cinnamon [30]. In the context of HMF, no one sample from profile A was higher than average:very close to an average value with a result of 45.8 μg/g was A 24h 15 °C.

3.3.7. Terpenes

Terpenes are a group of natural substances, mainly of plant origin [55], whose main skeleton was formed by combining five-carbon isoprene units [56].
The labeled terpenes contained in the samples analyzed are: α-pinene, β-pinene, eucalyptol, fenchone, α-thujone, β-thujanone, camphor, sabinone and carvone. The compounds with the largest concentration range were found to be eucalyptol—75.3 μg/g and β-pinene—50.1 μg/g. An average content among all compounds ranged from 1.02 μg/g for carvone to 10.8 μg/g for eucalyptol. There is a need for further research towards the chemical profiling of cold brew coffee terpenes because they are not characteristic of volatile coffee compounds. We hypothesize that terpenes are consistent with a high quality of coffee. However, as the roasting temperature of coffee increases, the terpene compounds in the bean are degraded, which results in their reduced extractability during the maceration of cold brew coffee.

3.3.8. Aromatic Aldehyde

Benzaldehydeis the simplest aromatic aldehyde present in coffee, biosynthetically derived from the degradation of phenylalanine via phenylacetic acid [57]. It is formed during roasting and our research confirms that; however, no direct correlation has been found so far to define the temperature of the process and the rate of its formation, also during cold brew extraction. It is assumed that increasing the amount of benzaldehyde affects the positive sensory properties of the product [58]. The highest value was reached in coffees from profile B and, generally, the maximum was 6.4 μg/g for B 6h 15 °C. It has a characteristic almond and apricot smell; also, their similarity in taste and aroma is remarkable [30]. In contrast to raw coffee, benzaldehyde in a beverage made with roasted coffee is not associated with the presence of defects [59]. Gancarz et al. [60] differentiated the volatile compound profile of Brazilian arabica coffee, in which they proved that aldehydes accounted for 17.5% of VOCs (volatile organic compounds). Other researchers showed that aldehydes in macerated coffee represented only 1.43%, with benzaldehyde reaching 0.3% of the total VOCs fraction [35]. In the cold brew experiment conducted, benzaldehyde was detected in amounts ranging from 0.1 μg/g to 6.4 μg/g of coffee, representing on average 0.55% of the total aroma compounds in the extracts made.

3.3.9. Unsaturated Aliphatic Alcohols

Linalool is an important flavor and strong aroma compound, which is derived from α-pinene [61]. This reaction consists of α-pinene hydrogenation to pinane, pinaneoxidation to hydroperoxide by molecular oxygen and hydroperoxide hydrogenation to pinanol, followed by its thermal isomerization to linalool. Briefly, it can also be described by the opening of the cyclic monoterpene to an unsaturated aliphatic alcohol.
In the conducted experiment, linalool achieved an average 3.0 μg/g higher content compared to 1-octen-3-ol, and the difference in the highest concentrations was 11.7 μg/g against the two compounds with respect to the B 6h 5 °C sample. In the context of 1-octen-3-ol, it is worth noting that the average value from all samples was 0.2 μg/g.
In the study of Abdelwareth et al. [35], linalool was detected and represented the second highest result among the given group of alcohols in macerated coffee extracts. The detection threshold of this aromatic reaches the order of ppb for GC olfactometry determinations [30]. It contributes to the characteristic aroma of many natural products such as fruits and spices, as well as tea and chocolate and is one of the key aroma compounds in green and roasted coffee [62].

3.3.10. Saturated and Unsaturated Aliphatic Ketones

5-hepten-2-one, 6-methyl- is an unsaturated methylated ketone product of the oxidative degradation of lycopene [63]. Its description is characterized by a fruity, floral aroma with an odor threshold in water of 0.05 mg/L [64]. It exists in a low concentration in brewed arabica coffee [30] for which we can suppose its influence on the characteristic tomato aroma. It has been tested in trace amounts in ripe coffee berries [65]. In the experiment, an average content of this compound was 0.6 μg/g, and the highest content of 3.5 μg/g was attributed to the variant B 6h 5 °C.
The detected 2-octanone in coffee may come from fatty acid oxidation [66]. This occurs mainly in concentrations in the extracts from profile B. An average concentration was 0.9 μg/g and the highest 2.0 μg/g for variant B 6h 5 °C and 1.9 μg/g for C 24h 25 °C. It is characterized by a pleasant, floral, mildly unripe apple and herbal aroma [30]. There is little evidence from a literature review in the context of the concentration of 2-octanone in cold brew coffee but it seems to increase the quality in the final product [67].

3.3.11. Furfuryl Ester

The main compound identified in this group is 2-Furanmethanol acetate—known as furfuryl acetate. This compound is considered a food contaminant in other foods such as cocoa, roasted almonds, bread and honey. Most probably it has been formed from quinic or caffeic acid and is therefore commonly found in coffee beans, as confirmed by numerous chemical compositional analyses [39,68]. The lower roasting temperature of coffee does not significantly affect the degradation of chlorogenic acid [9], which is also a factor in forming the acetate compound during the roasting of the green bean. Onthe other hand, it can be supposed that in some percent, there is synthesis between furfuryl alcohol and vinyl acetate during heating [69]. Caporaso et al. [68] proved the highest concentration of furfuryl acetate was for coffee roasted at 210 °C 96.5 mg/kg, and the highest concentration for coffee roasted around 230 °C was found to be 177.7 mg/kg. We marked the highest concentration of 56.6 μg/g for B 24h 5 °C—this was at 220 °C for green coffee beans during roasting.
An average content of the analyzed compound in coffee extracts prepared by different methods (which corresponded to different production technologies) was 15.3 μg/g. Generally, the presented results prove that the lowest concentration of furfuryl acetate belongs to coffees from profile A, which is consistent with Caporaso et al.

3.3.12. Aromatic Hydrocarbons

Hydrocarbons are a p-cymene component of the essential oils and occur as major components of the volatile oil of several plant species. For example, thyme (Thymus vulgaris L.) is made by the conversion of γ-terpinene, which involves the cleavage of the OH group from an aromatic ring in which two unsaturated bonds are formed [70]. In high concentration, this compound has a typical paraffin odor, but in coffee it contributes to restoring the aroma of citrus peel oils [30]. In cold brew extracts, an average content of this compound was 6.3 μg/g. The highest concentration of 35.0 μg/g belonged to sample B 6h 5 °C. There is a need for further research to determine the concentration of this compound depending on how cold brew coffee drinks are made.

3.3.13. Pyrrole with Ketone Function

The aroma of 2-acetyl-1-methylpyrrole has been identified among the volatile pyrrole products produced by the nonenzymatic browning reactions between oxidized lipids and amino acids [71] and is described as nutty, floral, fruity and even smoky [30]. Other researchers have also suggested its synthesis from glucose with amino acids by heating [72,73].
High concentrations of this compound were observed in extracts prepared from coffees profile B and C. An average content was found to be 3.6 μg/g, while the smallest average value between profiles was 1.96 μg/g for cold brew made from coffees A. Heo et al. determined the content of 2-acetyl-1-methylpyrrole in five purchased beverage samples ranging from 1 ng/mL to 39 ng/mL, and in four samples prepared by a cold brew method ranging from 15 ng/mL to 24 ng/mL [5]. Not in all similar studies is this compound detected [35].

3.3.14. Alkylpyrazines

Two compounds were detected in this group: 2-methyl-3-trans-propenyl pyrazine and 2,3,5-trimethyl-6-ethylpyrazine. They are important contributors to the flavor of fermented foods [74], which we can associate with the nature of coffee processing on farms. They are characterized by chocolate flavor notes in the studied beverage [30]. It can be assumed that one pathway for their formation mechanism is the Maillard reaction. At a high temperature (usually above 100 °C), free amino acids and the reductones (α-dicarbonyls) that are derived either from the Maillard reaction or the caramelization of carbohydrates, can be converted to α-amino carbonyls via Strecker degradation. Then α-aminocarbonyls can be condensed to form alkylpyrazines. On the other hand, they can arise from 2,5-dimethylpyrazine, which is a transformation product of threonine [75].
Average contents were noted, respectively, as 1.2 μg/g and 3.2 μg/g. Unfortunately, there are still no scientific reports on alkyl pyrazines in cold brew coffee. In a similar study, derivatives of the group were detected, and the highest determined concentrations were 2,5-dimethylpyrazine and 3-ethyl-2,5-dimethylpyrazine [35].

3.3.15. Alicyclic Ketone (Terpenes Derivatives)

The main compound identified is isomenthone, a derivative of menthol belonging to the terpenoids, an oxidized diastereoisomer that accompanies mint oils. It exhibits a characteristic refreshing aroma [76]. In an experiment conducted on the complexity of coffee flavor, there are no reports on the content of menthol and its derivatives in Arabica coffee. The major terpenes and its derivatives were linalool, limonene and geraniol [77]. Menthol, in a study by Abdelwareth et al., was detected in small amounts and not in all samples [35].
Observations after chemical analysis showed that 63% of the cold brew coffee samples contained less than theaverage value—they reached below 1.3 μg/g. The highest value, 5.1 μg/g, wasmarked for B 6h 5 °C. More research needs to be conducted to see if this compound is commonly found in cold brew coffee and if it significantly correlates with the refreshing properties of the beverage.

3.3.16. Cyclic aromatic Alcohols (Terpenes Derivative)

According to Del Terra et al. [78], linalool is one of the predominant monoterpenes in C. arabica flowers. The authors also indicated that volatile monoterpenes such as limonene, linalool, a-terpineol and geraniol have been found in freshly brewed coffee.
There are several reports of it and terpineol formation from mevalonic acid, or of the incorporation of radioactivity from linalyl derivatives into cyclic monoterpenes [79]. However, the chemical hydrolysis ofthe phosphoric ester of geraniol also leads to the biosynthesis of linalool [80]. Floral, sweet and musky ataromas are positively related to the concentration of linalool [81]. The characteristic feature of terpineol is an intense floral and lilac aroma [30].
The analysis of the mentioned compounds showed that the average concentrations in coffee extract were: linalool 3.2 μg/g, terpinen-4-ol 1.3 μg/g and α-terpineol 0.8 μg/g. Different analyses have shown that terpineol is the dominant alcohol in cold extracts among all alcohols [35]. It is difficult to compare the present result to other analyses as many of them only indicate the percentage of the respective compounds in the grain [78,82].

3.3.17. Pyrrole

Yang et al. [38], in their study, reported that important compounds modified and formed during the dark roast defect, include indole, which is made from the wax surrounding coffee. The highest final roasting temperature should show the highest concentration of indole in the extracts. It is an unpleasant smelling animalic, cheesy compound that can also be formed during the roasting of serotonin and which behaves in the same way as the related tryptophan [30]. The mean indole content in cold brew coffee samples was 4.1 μg/g. The analyses carried out in the present cold brew experiment showed that almost all concentrations of this compound were from coffees B and were 85.1%, generally. The highest measured concentration was 33.5 μg/g. Due to the elevated abundance in the light roast defect samples, indole is also proposed as a chemical marker for the light roast defect [38]. There is no other similar research on cold brew coffee analysisto compare with. Otherwise, indole concentration in the unprocessed cocoa was below the odor threshold value of 51 μg/kg. In the processed samples, the amounts increased continuously with increasing roasting temperature. It was the most odor active among the four off-flavor compounds at 140 °C [83]. Moreover, indole low concentration is normally observed in commercial wines (1 mg/L to 10 mg/L, approximate mean 5 mg/L) [84].
Additional parameters from the chromatography analysis for all volatile compounds are given in Table 5.

4. Conclusions

Our results provide the first quantitative comparison of the bioactive compounds of cold brew coffee with the artificial matrix beans of roasted coffee. It should be stated that the technological process differently affects the content of caffeine and phenolic compounds in cold brew coffee. Their content depends on many other factors, but on the basis of the conducted research, it is possible to choose the desired method of beverage production, especially in the context of the increased extraction of bioactive compounds. This research needs to be further developed in the context of total polyphenol content and antioxidant capacity. Moreover, this study investigated the comprehensive sensory attributes derived from cold brew coffee. Chemical analyses showed important information about aroma descriptors and closely investigated their pathways of biosynthesis in the final recipes. Further research is needed for evaluating sensory descriptors with repeatability and significant correlation in production.

Author Contributions

Conceptualization, A.S. and M.O.; methodology, D.M.; formal analysis, D.M., N.P.; supervision, A.N.-O.; writing, D.M.; review and editing, A.N.-O. All authors have read and agreed to the published version of the manuscript.

Funding

This research received no external funding.

Institutional Review Board Statement

Not applicable.

Informed Consent Statement

Not applicable.

Data Availability Statement

The datasets generated for this study are available on request to the corresponding author. The study did not report any data.

Conflicts of Interest

The authors declare no conflict of interest.

References

  1. Angeloni, G.; Guerrini, L.; Masella, P.; Innocenti, M.; Bellumori, M.; Parenti, A. Characterization and comparison of cold brew and cold drip coffee extraction methods. J. Sci. Food Agric. 2019, 99, 391–399. [Google Scholar] [CrossRef] [PubMed]
  2. Rivera, J. Unlocking the mystery of cold brew a deeper look into the chemistry. RoastMagazine, September 2018; 41–52. [Google Scholar]
  3. Rao, N.Z.; Fuller, M. Acidity and Antioxidant Activity of Cold Brew Coffee. Sci. Rep. 2018, 8, 16030. [Google Scholar] [CrossRef] [PubMed] [Green Version]
  4. Pandey, K.B.; Rizvi, S.I. Plant polyphenols as dietary antioxidants in human health and disease. Oxid. Med. Cell Longev. 2009, 2, 270–278. [Google Scholar] [CrossRef] [Green Version]
  5. Heo, J.; Adhikari, K.; Choi, K.S.; Lee, J. Analysis of Caffeine, Chlorogenic Acid, Trigonelline, and Volatile Compounds in Cold Brew Coffee Using High-Performance Liquid Chromatography and Solid-Phase Microextraction—Gas Chromatography-Mass Spectrometry. Foods 2020, 9, 1746. [Google Scholar] [CrossRef] [PubMed]
  6. Claassen, L.; Rinderknecht, M.; Porth, T.; Röhnisch, J.; Seren, H.Y.; Scharinger, A.; Gottstein, V.; Noack, D.; Schwarz, S.; Winkler, G. Cold Brew Coffee—Pilot Studies on Definition, Extraction, Consumer Preference, Chemical Characterization and Microbiological Hazards. Foods 2021, 10, 865. [Google Scholar] [CrossRef] [PubMed]
  7. Martinez, C.L.M.; Rocha, E.P.A.; Carneiro, A.d.C.O.; Gomes, F.J.B.; Batalha, L.A.R.; Vakkilainen, E.; Cardoso, M. Characterization of residual biomasses from the coffee production chain and assessment the potential for energy purposes. Biomass Bioenergy 2019, 120, 68–76. [Google Scholar] [CrossRef]
  8. Michalczyk, M.; Kuczewski, D. Zmiany zawartości składników o charakterze prozdrowotnym w przechowywanych sorbetach z owoców jagodowych. Żywność Nauka Technol. Jakość 2012, 19, 4. [Google Scholar]
  9. Arnot, B. The Coffee Lover’s Diet: Change Your Coffee, Change Your Life; HarperCollins Publishers Inc: New York, NY, USA, 2017. [Google Scholar]
  10. Yen, G.-C.; Chen, H.-Y.; Peng, H.-H. Antioxidant and pro-oxidant effects of various tea extracts. J. Agric. Food Chem. 1997, 45, 30–34. [Google Scholar] [CrossRef]
  11. Poltronieri, P.; Rossi, F. Challenges in specialty coffee processing and quality assurance. Challenges 2016, 7, 19. [Google Scholar] [CrossRef]
  12. Mazzafera, P.; Robinson, S.P. Characterization of polyphenol oxidase in coffee. Phytochemistry 2000, 55, 285–296. [Google Scholar] [CrossRef]
  13. Fuller, M.; Rao, N.Z. The Effect of Time, Roasting Temperature, and Grind Size on Caffeine and Chlorogenic Acid Concentrations in Cold Brew Coffee. Sci. Rep. 2017, 7, 17979. [Google Scholar] [CrossRef] [Green Version]
  14. dePaula, J.; Farah, A. Caffeine consumption through coffee: Content in the beverage, metabolism, health benefits and risks. Beverages 2019, 5, 37. [Google Scholar] [CrossRef] [Green Version]
  15. Nonthakaew, A.; Matan, N.; Aewsiri, T. Caffeine in foods and its antimicrobial activity. Int. Food Res. J. 2015, 22, 9–14. [Google Scholar]
  16. Dankowska, A.; Misiak, P. Oznaczanie zawartości kofeiny w naparach z herbat przy wykorzystywaniu spektroskopii UV oraz NIR. In SkładnikiBioaktywneSurowców i ProduktówRoślinnych; Polskie Towarzystwo Technologów Żywności: Kraków, Porland, 2014. [Google Scholar]
  17. Kyroglou, S.; Thanasouli, K.; Vareltzis, P. Process characterization and optimization of cold brew coffee: Effect of pressure, temperature, time and solvent volume on yield, caffeine and phenol content. J. Sci. Food Agric. 2021, 101, 4789–4798. [Google Scholar] [CrossRef] [PubMed]
  18. Ahmed, M.; Jiang, G.-H.; Park, J.S.; Lee, K.-C.; Seok, Y.Y.; Eun, J.B. Effects of ultrasonication, agitation and stirring extraction techniques on the physicochemical properties, health-promoting phytochemicals and structure of cold-brewed coffee. J. Sci. Food Agric. 2019, 99, 290–301. [Google Scholar] [CrossRef] [PubMed] [Green Version]
  19. Zhang, L.; Wang, X.; Manickavasagan, A.; Lim, L.-T. Extraction and physicochemical characteristics of high pressure-assisted cold brew coffee. Future Foods 2022, 5, 100113. [Google Scholar] [CrossRef]
  20. Wang, X.; Lim, L.-T. Modeling study of coffee extraction at different temperature and grind size conditions to better understand the cold and hot brewing process. J. Food Process. Eng. 2021, 44, e13748. [Google Scholar] [CrossRef]
  21. Zheng, L.; Chuntang, Z.; Yuan, Z.; Wei, Z.; Igor, C. Coffee cell walls—Composition, influence on cup quality and opportunities for coffee improvements. Food Qual. Saf. 2021, 5, fyab012. [Google Scholar]
  22. Hyong, S.; Chu, M.; Park, H.; Park, J.; Lee, K.-G. Analysis of α-dicarbonyl compounds and 4-methylimidazole in coffee made with various roasting and brewing conditions. LWT 2021, 151, 112231. [Google Scholar] [CrossRef]
  23. Córdoba, N.; Moreno, F.L.; Osorio, C.; Velásquez, S.; Fernandez-Alduenda, M.; Ruiz-Pardo, Y. Specialty and regular coffee bean quality for cold and hot brewing: Evaluation of sensory profile and physicochemical characteristics. LWT 2021, 145, 111363. [Google Scholar] [CrossRef]
  24. Park, S.-H.; Jo, A.; Lee, K.-G. Effect of various roasting, extraction and drinking conditions on furan and 5-hydroxymethylfurfural levels in coffee. Food Chem. 2021, 358, 129806. [Google Scholar] [CrossRef] [PubMed]
  25. Han, J.-W.; Boo, H.; Chung, M.-S. Effects of extraction conditions on acrylamide/furan content, antioxidant activity, and sensory properties of cold brew coffee. Food Sci. Biotechnol. 2020, 29, 1071–1080. [Google Scholar] [CrossRef]
  26. Yao, T. Brew Methods Effect on Coffee Flavor and Aroma. A Thesis, Texas A&M University, College Station, TX, USA, 2017. [Google Scholar]
  27. Müller, R.; Rappert, S. Pyrazines: Occurrence, formation and biodegradation. Appl. Microbiol. Biotechnol. 2010, 85, 1315–1320. [Google Scholar] [CrossRef] [PubMed]
  28. Dwiranti, N.S.; Ardiansyah, A.; Asiah, N. Sensory attributes of cold brew coffee products at various resting time after roasting process. Pelita Perkeb. 2019, 35, 42–50. [Google Scholar]
  29. Zhang, Z.; Wei, T.; Hou, J.; Li, G.; Yu, S.; Xin, W. Tetramethylpyrazine scavenges superoxide anion and decreases nitric oxide production in human polymorphonuclear leukocytes. Life Sci. 2003, 72, 2465–2472. [Google Scholar] [CrossRef]
  30. Flament, I. Coffee Flavor Chemistry; John Wiley & Sons: Hoboken, NJ, USA, 2001. [Google Scholar]
  31. Kremer, J.I.; Pickard, S.; Stadlmair, L.F.; Glaß-Theis, A.; Buckel, L.; Bakuradze, T.; Eisenbrand, G.; Richling, E. Alkylpyrazines from coffee are extensively metabolized to pyrazine carboxylic acids in the human body. Mol. Nutr. Food Res. 2019, 63, 1801341. [Google Scholar] [CrossRef] [Green Version]
  32. Koehler, P.E.; Odell, G.V. Factors affecting the formation of pyrazine compounds in sugar-amine reactions. J. Agric. Food Chem. 1970, 18, 895–898. [Google Scholar] [CrossRef]
  33. Adams, A.; De Kimpe, N. Formation of pyrazines from ascorbic acid and amino acids under dry-roasting conditions. Food Chem. 2009, 115, 1417–1423. [Google Scholar] [CrossRef]
  34. Kłosowski, G.; Błajet-Kosicka, A. Mechanisms of pyrazine compounds formation and validation of raw material thermal processing during technological process based on the presence of pyrazine in raw spirits. Biotechnologia 2010, 1, 147–160. [Google Scholar]
  35. Abdelwareth, A.; Zayed, A.; Farag, M.A. Chemometrics-based aroma profiling for revealing origin, roasting indices, and brewing method in coffee seeds and its commercial blends in the Middle East. Food Chem. 2021, 349, 129162. [Google Scholar] [CrossRef]
  36. Yu, A.-N.; Zhang, A.-D. The effect of pH on the formation of aroma compounds produced by heating a model system containing l-ascorbic acid with l-threonine/l-serine. Food Chem. 2010, 119, 214–219. [Google Scholar] [CrossRef]
  37. Jinap, M.S.; Jamilah, B.; Nazamid, S. Effect of polyphenol concentration on pyrazine formation during cocoa liquor roasting. Food Chem. 2004, 85, 73–80. [Google Scholar] [CrossRef]
  38. Yang, N.; Liu, C.; Liu, X.; Degn, T.K.; Munchow, M.; Fisk, I. Determination of volatile marker compounds of common coffee roast defects. Food Chem. 2016, 211, 206–214. [Google Scholar] [CrossRef]
  39. Lachenmeier, D.W.; Teipel, J.; Scharinger, A.; Kuballa, T.; Walch, S.G.; Grosch, F.; Bunzel, M.; Okaru, A.O.; Schwarz, S. Fully automated identification of coffee species and simultaneous quantification of furfuryl alcohol using NMR spectroscopy. J. AOAC Int. 2020, 103, 306–314. [Google Scholar] [CrossRef] [PubMed]
  40. Albouchi, A.; Murkovic, M. Formation kinetics of furfuryl alcohol in a coffee model system. Food Chem. 2018, 243, 91–95. [Google Scholar] [CrossRef]
  41. Naudé, Y.; Rohwer, E.R. Investigating the coffee flavour in South African Pinotage wine using novel offline olfactometry and comprehensive gas chromatography with time of flight mass spectrometry. J. Chromatogr. A 2013, 1271, 176–180. [Google Scholar] [CrossRef] [PubMed] [Green Version]
  42. Haile, M.; Bae, H.M.; Kang, W.H. Comparison of the antioxidant activities and volatile compounds of coffee beans obtained using digestive bio-processing (elephant dung coffee) and commonly known processing methods. Antioxidants 2020, 9, 408. [Google Scholar] [CrossRef]
  43. Näsman, J.H. 3-Methyl-2(5H)-furanone. Org. Synth. 1993, 8, 396. [Google Scholar]
  44. Tressl, R.; Rewicki, D.; Helak, B.; Kamperschroer, H. Formation of pyrrolidines and piperidines on heating L-proline with reducing sugars. J. Agric. Food Chem. 1985, 33, 924–928. [Google Scholar] [CrossRef]
  45. Cherry, J.P. Electrophoretic observation on protein changes and variability during development of the peanut. J. Agric. FoodChem. 1974, 22, 723–724. [Google Scholar] [CrossRef]
  46. Gianturco, M.; Giammarino, A.; Friedel, P.; Flanagan, V. The volatile constituents of coffee—IV: Furanic and pyrrolic compounds. Tetrahedron 1964, 20, 2951–2961. [Google Scholar] [CrossRef]
  47. Slaughter, J.C. The naturally occurring furanones: Formation and function from pheromone to food. Biol. Rev. 1999, 74, 259–276. [Google Scholar] [CrossRef] [PubMed]
  48. Maga, J.A.; Katz, I. The role of sulfur compounds in food flavor part I: Thiazoles. CRCCrit. Rev. Food Sci. Nutr. 1975, 6, 153–176. [Google Scholar] [CrossRef]
  49. Gong, M.; Zhou, Z.; Liu, S.; Zhu, S.; Li, G.; Zhong, F.; Mao, J. Formation pathways and precursors of furfural during Zhenjiang aromatic vinegar production. Food Chem. 2021, 354, 129503. [Google Scholar] [CrossRef]
  50. Prodolliet, J.; Bruelhart, M.; Blanc, M.B.; Leloup, V.; Cherk, G.; Donnelly, C.M.; Viani, R. Adulteration of Soluble Coffee with Coffee Husks and Parchments. J. AOAC Int. 2020, 78, 761–767. [Google Scholar] [CrossRef]
  51. Muratore, G.; Licciardello, F.; Restuccia, C.; Puglisi, M.L.; Giudici, P. Role of Different Factors Affecting the Formation of 5-Hydroxymethyl-2-furancarboxaldehyde in Heated Grape Must. J. Agric. Food Chem. 2006, 54, 860–863. [Google Scholar] [CrossRef]
  52. Murkovic, M.; Pichler, N. Analysis of 5-hydroxymethylfurfual in coffee, dried fruits and urine. Mol. Nutr. Food Res. 2006, 50, 842–846. [Google Scholar] [CrossRef]
  53. Chaichi, M.; Ghasemzadeh-Mohammadi, V.; Hashemi, M.; Mohammadi, A. Furanic compounds and furfural in different coffee products by headspace liquid-phase micro-extraction followed by gas chromatography–mass spectrometry: Survey and effect of brewing procedures. Food Addit. Contam. Part B 2015, 8, 73–80. [Google Scholar] [CrossRef]
  54. Petisca, C.; Pérez-Palacios, T.; Pinho, O.; Ferreira, I.M. Optimization and application of a HS-SPME-GC-MS methodology for quantification of furanic compounds in espresso coffee. Food Anal. Methods 2014, 7, 81–88. [Google Scholar] [CrossRef]
  55. Najda, A. Roślinnesubstancjelotne–olejkieteryczne. Episteme 2015, 2, 65–77. [Google Scholar]
  56. Breitmaier, E. Terpenes: Flavors, Fragrances, Pharmaca, Pheromones; John Wiley & Sons: Hoboken, NJ, USA, 2006. [Google Scholar]
  57. Hidalgo, F.J.; Zamora, R. Formation of phenylacetic acid and benzaldehyde by degradation of phenylalanine in the presence of lipid hydroperoxides: New routes in the amino acid degradation pathways initiated by lipid oxidation products. Food Chem. X 2019, 2, 100037. [Google Scholar] [CrossRef] [PubMed]
  58. Hameed, A.; Hussain, S.A.; Ijaz, M.U.; Ullah, S.; Pasha, I.; Suleria, H.A.R. Farm to consumer: Factors affecting the organoleptic characteristics of coffee. II: Postharvest processing factors. Compr. Rev. Food Sci. Food Saf. 2018, 17, 1184–1237. [Google Scholar] [CrossRef] [PubMed] [Green Version]
  59. Toci, A.T.; Farah, A. Volatile compounds as potential defective coffee beans’ markers. Food Chem. 2008, 108, 1133–1141. [Google Scholar] [CrossRef] [PubMed]
  60. Gancarz, M.; Dobrzański, B.; Oniszczuk, T.; Combrzyński, M.; Ćwikła, D.; Rusinek, R. Detection and differentiation of volatile compound profiles in roasted coffee arabica beans from different countries using an electronic nose and GC-MS. Sensors 2020, 20, 2124. [Google Scholar]
  61. Semikolenov, V.A.; Ilyna, I.I.; Simakova, I.L. Linalool synthesis from α-pinene: Kinetic peculiarities of catalytic steps. Appl. Catal. A Gen. 2001, 211, 91–107. [Google Scholar] [CrossRef]
  62. Bonnländer, B.; Cappuccio, R.; Liverani, F.S.; Winterhalter, P. Analysis of enantiomeric linalool ratio in green and roasted coffee. Flavour Fragr. J. 2006, 21, 637–641. [Google Scholar] [CrossRef]
  63. Kobori, C.; Wagner, R.; Padula, M.; Rodriguez-Amaya, D. Formation of volatile compounds from lycopene by autoxidation in a model system simulating dehydrated foods. Food Res. Int. 2014, 63, 49–54. [Google Scholar] [CrossRef]
  64. Wang, L.; Baldwin, E.; Luo, W.; Zhao, W.; Brecht, J.; Bai, J. Key tomato volatile compounds during postharvest ripening in response to chilling and pre-chilling heat treatments. Postharvest Biol. Technol. 2019, 154, 11–20. [Google Scholar] [CrossRef]
  65. Jaramillo, J.; Torto, B.; Mwenda, D.; Troeger, A.; Borgemeister, C.; Poehling, H.M.; Francke, W. Coffee berry borer joins bark beetles in coffee klatch. PLoS ONE 2013, 8, e74277. [Google Scholar] [CrossRef] [Green Version]
  66. Soares, M.; Christen, P.; Pandey, A.; Soccol, C.R. Fruity flavour production by Ceratocystisfimbriata grown on coffee husk in solid-state fermentation. Process. Biochem. 2000, 35, 857–861. [Google Scholar] [CrossRef]
  67. Pereira, G.V.d.M.; de Carvalho Neto, D.P.; Medeiros, A.B.P.; Soccol, V.T.; Neto, E.; Woiciechowski, A.L.; Soccol, C.R. Potential of lactic acid bacteria to improve the fermentation and quality of coffee during on-farm processing. Int. J. Food Sci. Technol. 2016, 51, 1689–1695. [Google Scholar] [CrossRef]
  68. Caporaso, N.; Whitworth, M.B.; Cui, C.; Fisk, I.D. Variability of single bean coffee volatile compounds of Arabica and robusta roasted coffees analysed by SPME-GC-MS. Food Res. Int. 2018, 108, 628–640. [Google Scholar] [CrossRef]
  69. Mathpati, A.C.; Badgujar, K.C.; Bhanage, B.M. Kinetic modeling and docking study of immobilized lipase catalyzed synthesis of furfuryl acetate. Enzyme Microb. Technol. 2016, 84, 1–10. [Google Scholar] [CrossRef] [PubMed]
  70. Poulose, A.J.; Croteau, R. Biosynthesis of aromatic monoterpenes: Conversion of γ-terpinene to p-cymene and thymol in Thymus vulgaris L. Arch. Biochem. Biophys. 1978, 187, 307–314. [Google Scholar] [CrossRef]
  71. Alaiz, M.; Zamora, R.; Hidalgo, F.J. Antioxidative Activity of Pyrrole, Imidazole, Dihydropyridine, and Pyridinium Salt Derivatives Produced in Oxidized Lipid/Amino Acid Browning Reactions. J. Agric. Food Chem. 1996, 44, 686–691. [Google Scholar] [CrossRef]
  72. Shen, S.-C.; Tseng, K.-C.; Wu, J.S.-B. An analysis of Maillard reaction products in ethanolic glucose–glycine solution. Food Chem. 2007, 102, 281–287. [Google Scholar] [CrossRef]
  73. Yanagimoto, K.; Lee, K.-G.; Ochi, H.; Shibamoto, T. Antioxidative activity of heterocyclic compounds found in coffee volatiles produced by Maillard reaction. J. Agric. Food Chem. 2002, 50, 5480–5484. [Google Scholar] [CrossRef]
  74. Hao, Y.; Wang, Z.; Zou, Y.; He, R.; Ju, X.; Yuan, J. Effect of static-state fermentation on volatile composition in rapeseed meal. J. Sci. Food Agric. 2020, 100, 2145–2152. [Google Scholar] [CrossRef]
  75. Zhang, L.; Cao, Y.; Tong, J.; Xu, Y. An Alkylpyrazine Synthesis Mechanism Involving L-Threonine-3-Dehydrogenase Describes the Production of 2,5-Dimethylpyrazine and 2,3,5-Trimethylpyrazine by Bacillus subtilis. Appl. Environ. Microbiol. 2019, 85, e01807-19. [Google Scholar] [CrossRef]
  76. Kamatou, G.P.; Vermaak, I.; Viljoen, A.M.; Lawrence, B.M. Menthol: A simple monoterpene with remarkable biological properties. Phytochemistry 2013, 96, 15–25. [Google Scholar] [CrossRef]
  77. Sunarharum, W.B.; Williams, D.J.; Smyth, H.E. Complexity of coffee flavor: A compositional and sensory perspective. Food Res. Int. 2014, 62, 315–325. [Google Scholar] [CrossRef]
  78. Del Terra, L.; Lonzarich, V.; Asquini, E.; Navarini, L.; Graziosi, G.; Liverani, F.S.; Pallavicini, A. Functional characterization of three Coffea arabica L. monoterpene synthases: Insights into the enzymatic machinery of coffee aroma. Phytochemistry 2013, 89, 6–14. [Google Scholar] [CrossRef] [PubMed]
  79. Osvaldo Cori, M. Enzymic aspects of the biosynthesis monoterpenes in plants. Phytochemistry 1983, 22, 331–341. [Google Scholar] [CrossRef]
  80. Machado, A.; García-Peregrín, E.; Mayor, F. Synthesis of linalool and 4-terpineol from [14C]mevalonic acid in Pinuspinaster. Plant Sci. Lett. 1974, 2, 83–87. [Google Scholar] [CrossRef]
  81. Campo, E.; Ferreira, V.; Escudero, A.; Cacho, J. Prediction of the Wine Sensory Properties Related to Grape Variety from Dynamic-Headspace Gas Chromatography−Olfactometry Data. J. Agric. Food Chem. 2005, 53, 5682–5690. [Google Scholar] [CrossRef]
  82. Tsegay, G.; Redi-Abshiro, M.; Chandravanshi, B.S.; Ele, E.; Mohammed, A.M.; Mamo, H. Volatile profile of green coffee beans from Coffeaarabica L. plants grown at different altitudes in Ethiopia. Bull. Chem. Soc. Ethiop. 2019, 33, 401–413. [Google Scholar] [CrossRef]
  83. Füllemann, D.; Neiens, S.D.; Steinhaus, M. Impact of processing on important cocoa off-flavour compounds. Eur. Food Res. Technol. 2022, 248, 197–205. [Google Scholar] [CrossRef]
  84. Arevalo-Villena, M.; Bartowsky, E.J.; Capone, D.; Sefton, M.A. Production of indole by wine-associated microorganisms under oenological conditions. Food Microbiol. 2010, 27, 685–690. [Google Scholar] [CrossRef]
Figure 1. Cold brew coffee means values of chlorogenic acid concentration in the coffee roasting profile × extraction temperature matrix. Homogeneous groups (p < 0.05) are marked with the same letters. Final roasting temperatures: A 210 °C, B 220 °C and C 230 °C were roasting profiles.
Applsci 12 02582 g001
Figure 2. Cold brew coffee means values of chlorogenic acid concentration in the coffee roasting profile × extraction time matrix. Homogeneous groups (p < 0.05) are marked with the same letters. Final roasting temperatures: A 210 °C, B 220 °C and C 230 °C were roasting profiles.
Applsci 12 02582 g002
Figure 3. Cold brew coffee mean values of caffeine concentration in the coffee roasting profile × extraction temperature matrix. Homogeneous groups (p < 0.05) are marked with the same letters. Final roasting temperatures: A 210 °C, B 220 °C and C 230 °C were roasting profiles.
Applsci 12 02582 g003
Figure 4. Cold brew coffee means values of caffeine concentration in the coffee roasting profile × extraction time matrix. Homogeneous groups (p < 0.05) are marked with the same letters. Final roasting temperatures: A 210 °C, B 220 °C and C 230 °C were roasting profiles.
Applsci 12 02582 g004
Figure 5. Dynamic changes in cell wall composition during coffee fruit development [21].
Applsci 12 02582 g005
Figure 6. Main volatile formation reactions during the coffee roasting process. Precursors are formed in rectangles.
Applsci 12 02582 g006
Table 1. MRM analysis parameters for caffeine and chlorogenic acid.
CompoundMRM Transition m/z (Q1-> Q3)Q1 (V)CE (V)Q3 (V)
Caffeine195.2→ 138.10−10.0−22−22.0
195.2→ 42.15−10.0−36−15.0
Chlorogenic acid355.2→ 163.05−19.0−15−27.0
355.2→ 89.10−11.0−55−30.0
Table 2. Mean values caffeine and chlorogenic acid in cold brew samples.
Cold Brew SamplesTimeTemperatureCaffeine Concentration (mg/L)Chlorogenic Acid Concentration
(mg/ L)
A6 h5 °C460.2 ± 8.1 11036.2 ± 22.5 1
15 °C516.1 ± 11.71034.5 ± 23.2
25 °C471.2 ± 9.4919.4 ± 4.7
12 h5 °C474.6 ± 10.6902.5 ± 12.5
15 °C526. ± 26.2930.5 ± 29.4
25 °C473.5 ± 6.5931.9 ± 6.9
24 h5 °C540.4 ± 24.3949.2 ± 16.3
15 °C497.4 ± 10.8964.0 ± 11.6
25 °C500.9 ± 9.9921.4 ± 29.4
B6 h5 °C631.8 ± 20.4970.7 ± 17.8
15 °C655.5 ± 23.1845.4 ± 25.2
25 °C608.4 ± 32.7839.5 ± 43.1
12 h5 °C603.6 ± 35.0739.3 ± 57.6
15 °C608.3 ± 19.3780.2 ± 39.0
25 °C611.4 ± 8.5755.9 ± 45.6
24 h5 °C643.1 ± 22.0811.8 ± 43.2
15 °C579.9 ± 22.4769.8 ± 61.1
25 °C590.4 ± 28.6770.1 ± 21.7
C6 h5 °C431.0 ± 54.9429.5 ± 25.3
15 °C441.6 ± 22.2442.7 ± 16.5
25 °C510.2 ± 29.1506.8 ± 29.3
12 h5 °C447.7 ± 31.3525.5 ± 29.8
15 °C417.5 ± 33.4458.9 ± 32.6
25 °C522.1 ± 48.9498.1 ± 33.5
24 h5 °C526.3 ± 8.3455.4 ± 38.5
15 °C431.2 ± 34.7441.2 ± 18.2
25 °C508.8 ± 6.7440.7 ± 23.1
1 Values are mean ± SEM.
Table 3. Caffeine and chlorogenic acid concentration in experimental model samples.
Trial NumberCaffeine Mass (mg)Chlorogenic Acid Mass
(mg)
Final Temperature Roasting (°C)Caffeine Measured Value (µg/mL)Caffeine Mass Loss (%)Mean Caffeine Mass Loss (%)Chlorogenic Acid Measured Value (µg/mL)Chlorogenic Acid Mass Loss (%)
111.822.42100.8825.424.90100
211.522.00.8724.30100
311.624.02200.8625.926.40100
411.924.10.8726.90100
512.120.72300.6843.846.30100
612.321.60.6348.80100
Table 4. List of aromatic compounds depending on the cold brew coffee prepared variant.
VOC Content in Cold Brew Sample[µg/g]
ABC
Time6 h12 h24 h6 h12 h24 h6 h12 h24 h
Temp. [°C]
Compound
515255152551525515255152551525515255152551525
Pyrazine3.63.53.30.30.84.12.54.13.53.710.74.44.33.63.53.74.45.25.00.93.03.34.86.95.63.96.7
Pyridine29.114.418.68.49.49.15.614.315.924.530.911.024.324.815.716.821.313.910.316.56.917.320.239.323.715.850.3
3(2H)-Furanone, dihydro-2-methyl-4.54.55.93.84.72.70.54.75.04.514.85.54.45.45.16.36.34.37.35.72.16.36.010.78.96.010.7
4-Methylthiazole0.70.30.30.70.70.44.00.60.71.00.71.40.71.00.70.80.50.80.60.70.70.80.51.21.90.71.8
2-Methylpyrazine53.030.353.325.936.831.31.059.243.753.9121.544.455.346.046.752.354.051.632.330.222.159.257.664.963.132.171.4
Furfural11.453.010.310.672.00.249.412tr69.7103.0331.4126.224.9113.391.8120.270.682.876.134.971.4107.5115.1144.6120.478.4135.8
α-Furfurylalcohol24.51.523.97.00.42.381.816.225.740.198.737.126.836.38.89.663.58.81.81.619.720.961.73.819.035.633.4
Pyrazine, 2,6-dimethyl- and Pyrazine, 2,5-dimethyl-20.327.85.216.222.86.23.754.044.162.1145.449.365.160.555.161.859.357.15.18.447.968.169.974.269.331.679.1
Pyrazine, ethyl-4.918.55.66.06.47.910.831.927.030.967.328.932.528.327.334.033.332.110.35.928.637.033.841.936.817.247.1
Pyrazine, 2,3-dimethyl-1.45.70.61.90.71.29.011.89.611.88.37.612.65.010.410.610.26.60.41.37.811.211.212.512.62.814.6
α-Pinene0.76.01.50.10.1tr 12.00.52.32.11.72.81.92.00.20.2tr0.40.30.52.5tr 10.20.30.62.05.2
Benzaldehyde1.82.90.61.22.20.70.12.73.42.66.42.71.52.72.12.21.93.21.00.70.80.73.35.12.84.43.9
2-Furancarboxaldehyde, 5-methyl-5.421.40.14.613.30.62.645.837.363.5173.456.320.666.254.768.260.448.338.832.716.965.979.992.374.343.192.5
β-Pinene2.27.11.20.1tr0.150.10.20.81.90.53.70.62.00.30.30.10.2tr0.10.90.30.60.6tr0.63.8
1-Octen-3-ol0.10.40.10.10.1tr0.10.30.51.00.1tr0.70.30.10.1tr0.1trtrtr0.1trtr0.20.10.9
5-Hepten-2-one, 6-methyl-2.20.10.51.10.80.30.10.50.73.50.70.42.20.40.30.40.10.10.10.10.10.10.10.30.30.21.3
2-Octanone1.11.91.10.2tr0.20.21.31.32.01.80.50.71.20.80.91.20.90.70.80.40.80.31.00.80.71.9
2-Furanmethanol, acetate16.517.46.82.47.08.91.23.72.315.338.319.13.311.86.856.621.816.628.911.323.735.22.523.227.30.73.9
Pyrazine, 2-ethyl-6-methyl-3.32.23.34.32.53.514.46.05.88.633.68.48.022.64.716.314.720.114.32.413.713.98.5tr2.03.45.4
Pyrazine, 2-ethyl-3-methyl-2.51.02.50.51.60.417.29.27.16.422.86.47.215.36.910.58.911.64.12.84.76.410.310.16.42.89.9
Pyrazine, 2-ethyl-5-methyl-2.90.61.00.30.70.75.814.915.11.214.51.12.05.06.217.67.211.90.41.80.50.915.919.813.91.25.8
p-Cymene15.325.54.62.21.40.51.02.94.135.01.510.823.29.50.70.40.50.50.40.64.10.90.40.80.25.718.4
Eucalyptol36.534.59.44.10.30.20.81.415.975.39.07.841.113.71.44.30.85.00.61.37.12.41.00.50.35.010.7
2-Acetyl-1-methylpyrrole0.71.40.40.40.30.30.113.30.84.911.15.16.24.75.04.75.30.70.90.91.87.56.77.35.80.61.3
Pyrazine, 3-ethyl-2,5-dimethyl-14.28.79.413.810.314.50.64.013.118.338.515.519.916.916.316.618.216.011.14.06.819.319.421.217.47.418.1
Pyrazine, 2-ethyl-3,5-dimethyl-0.50.30.20.20.31.813.018.60.61.32.92.90.60.91tr0.93.30.10.30.20.72.13.94.01.00.40.5
Fenchone7.55.02.22.30.32.80.83.43.216.55.78.814.710.33.40.74.90.10.30.81.13.511.612.51.61.83.2
Linalool5.75.21.61.10.90.80.710.24.212.72.74.66.43.92.72.02.30.70.90.90.31.72.24.12.22.14.0
α-Thujone9.47.71.90.20.20.10.33.13.022.92.52.811.23.40.41.20.10.10.20.10.90.32.01.30.51.55.0
β-Thujone4.23.60.90.30.30.20.21.31.510.61.01.05.62.01.21.01.00.10.10.20.20.30.40.60.20.82.2
2-Methyl-3-trans-propenylpyrazine4.50.8tr1.70.30.40.50.80.70.62.40.78.81.11.01.20.40.40.40.20.20.71.50.70.10.20.8
Camphor5.73.80.80.30.20.10.22.43.011.21.91.111.43.20.80.60.10.10.10.41.10.1trtr0.71.23.1
Isomenthone0.60.21.14.1tr4.71.10.1tr5.13.01.12.51.90.31.60.30.20.20.10.21.40.21.41.8tr0.3
2,3,5-Trimethyl-6-ethylpyrazine1.20.51.30.80.90.24.50.92.75.910.64.56.06.92.67.91.81.61.41.10.64.80.56.67.30.31.7
Sabinone1.70.50.20.80.60.82.12.01.67.84.02.61.24.51.93.21.71.00.10.90.60.60.83.43.00.60.7
Terpinen-4-ol2.71.90.10.30.20.20.31.41.57.52.93.14.52.90.10.40.30.50.80.80.40.10.10.10.30.80.3
α-Terpineol1.20.80.30.60.20.30.20.40.73.80.41.22.50.90.70.20.10.30.40.60.30.60.30.12.20.70.9
Carvone3.60.50.30.10.10.90.32.21.91.80.62.80.53.62.00.31.00.62.20.20.40.10.20.30.31.62.7
Indoletr0.10.31.11.20.94.70.80.930.933.523.90.61.70.90.40.80.70.21.71.20.92.00.20.4trtr
1 tr. < 0.1.
Table 5. List of aromatic compounds based on retention time and analyzed methods.
NrtR (min)CompoundRI Exp. 1RI Lit. 2Identification 3
14.17Pyrazine739736RI, MS, IS
24.42Pyridine744746RI, MS, IS
35.973(2H)-Furanone, dihydro-2-methyl-799809RI, MS
46.244-Methylthiazole817823RI, MS
56.422-Methylpyrazine835831RI, MS
66.74Furfural835833RI, MS, IS
77.87α-Furfurylalcohol872860RI, MS, IS
89.17Pyrazine, 2,6-dimethyl- and Pyrazine, 2,5-dimethyl-909917RI, MS, IS
99.27Pyrazine, ethyl-926921RI, MS
109.39Pyrazine, 2,3-dimethyl-926926RI, MS
119.90α-Pinene939937RI, MS, IS
1210.77Benzaldehyde970962RI, MS, IS
1310.872-Furancarboxaldehyde, 5-methyl-970965RI, MS
1411.29β-Pinene980979RI, MS, IS
1511.431-Octen-3-ol985980RI, MS, IS
1611.665-Hepten-2-one, 6-methyl-991986RI, MS, IS
1711.782-Octanone994990RI, MS, IS
1811.912-Furanmethanol, acetate997995RI, MS
1911.97Pyrazine, 2-ethyl-6-methyl-10011003RI, MS
2012.05Pyrazine, 2-ethyl-3-methyl-10031004RI, MS
2112.11Pyrazine, 2-ethyl-5-methyl-10041005RI, MS, IS
2212.84p-Cymene10301025RI, MS, IS
2313.05Eucalyptol10351032RI, MS, IS
2414.442-Acetyl-1-methylpyrrole10831096RI, MS
2514.55Pyrazine, 3-ethyl-2,5-dimethyl-10831082RI, MS
2614.74Pyrazine, 2-ethyl-3,5-dimethyl-10881084RI, MS, IS
2714.85Fenchone10911096RI, MS, IS
2815.22Linalool10991099RI, MS, IS
2915.39α-Thujone11081103RI, MS, IS
3015.74β-Thujone11231119RI, MS
3116.452-Methyl-3-trans-propenylpyrazine11471146RI, MS
3216.58Camphor11501142RI, MS, IS
3316.88Isomenthone11651164RI, MS, IS
3416.962,3,5-Trimethyl-6-ethylpyrazine11681164RI, MS
3517.18Sabinone11771163RI, MS
3617.49Terpinen-4-ol11871177RI, MS, IS
3717.80α-Terpineol11961190RI, MS, IS
3818.75Carvone12561242RI, MS, IS
3919.46Indole12991295RI, MS, IS
1 Relativeretention index calculatedagainstn-alkanes. 2 Retention index according to NIST20 database; 3 RI—retention index; MS—mass spectrum; IS—authentical standard of compound.
Publisher’s Note: MDPI stays neutral with regard to jurisdictional claims in published maps and institutional affiliations.

