Article

Central vs. Peripheral Vision during a Singe-Leg Drop Jump: Implications of Dynamics and Patellofemoral Joint Stress

1
Athletic Training Laboratory, Division of Sports Medicine & Science, Kyung Hee University, Yongin 17104, Korea
2
Department of Athletic Training and Clinical Nutrition, Sports Medicine Research Institute, University of Kentucky, Lexington, KY 40506, USA
3
Department of Sports Medicine, Soonchunhyang University, Asan 31538, Korea
4
Department of Physical Education, Yonsei Institute of Sports Science and Exercise Medicine, Yonsei University, Seoul 03722, Korea
5
Athletic Training Laboratory, Department of Sports Medicine, Kyung Hee University, Yongin 17104, Korea
*
Author to whom correspondence should be addressed.
Submission received: 20 January 2022 / Revised: 9 February 2022 / Accepted: 11 February 2022 / Published: 2 March 2022
(This article belongs to the Special Issue Biomechanical and Biomedical Factors of Knee Osteoarthritis)

Abstract

:
Landing on a single-leg without receiving direct visual information (e.g., not looking at the ground) may increase the risk of injury. We examined whether visual focus contributed to the changing lower-extremity dynamics and patellofemoral joint stress during a single-leg drop jump task. Twenty healthy volunteers visited the laboratory for three separate sessions. During each session, participants randomly performed either of two types of a single-leg drop jump task from a 30 cm high wooden box. Subsequently, participants looked at the landing spot (central vision condition) or kept their heads up (peripheral vision condition) when performing the task. Sagittal and frontal plane lower-extremity joint angles and joint moments (in the ankle, knee, and hip), including the vertical ground reaction force, and patellofemoral joint stress during the first landing phase (from initial contact to peak knee flexion) were compared. Greater ankle inversion and hip adduction were observed when landing with the peripheral vision condition. However, the magnitudes were negligeable (Cohen’s d effect size <0.35). No statistical difference was observed in other comparisons. Landing on a single-leg from a 30 cm height without receiving full visual attention (peripheral vision condition) does not increase the risk of lower-extremity traumatic and overuse injuries.

1. Introduction

Landing on a single-leg is a common cause of lower-extremity injuries [1,2]. Therefore, kinematic and kinetic variables during a single-leg-landing task are proposed to increase the risk of traumatic [2,3,4,5] and overuse (e.g., repetitive trauma) [6,7] injuries. For example, the anterior cruciate ligament (ACL) injuries are associated with decreased knee flexion angles (stiff landing) [4], increased tibial internal rotations [2], greater knee valgus with increased knee abduction moments [5], and increased vertical ground reaction forces (GRF) [3]. Additionally, increased ankle inversion, knee adduction angle, and hip abduction angle [8], including plantar flexion moments [9] at landing relate to ankle sprains. Furthermore, impact forces to the knee joint from repeated landings acutely alter the patellofemoral cartilage morphology as well [10] or lead to an overuse injury, such as patellofemoral pain [7] and patella tendinopathy [6].
Control of dynamic joint stability during a single-leg landing is therefore initiated through afferent information acquisition [11]. Interpretations of sensory input from the visual, vestibular, and proprioceptive systems also help us perceive body positioning and joint movements in space [12], maintain spatial orientation and equilibrium to control posture and balance [13,14], provide feedback for executing motor responses [15], and acquire movement patterns for improving performance [16]. Hence, as the largest contributor to feedback control [17], the visual system gives us important information for processing images (e.g., spatial awareness, depth, and motion perception, light, and color), especially on multi-joint movements involving impact forces such as a single-leg landing. Moreover, unlike the vestibular and proprioceptive systems (e.g., autonomic nervous system), one can voluntarily control the number of visual inputs. For example, a deficit of direct visual information during landings (e.g., not looking at the landing spot by blocking vision or looking ahead) can alter their normal movement patterns in the lower-extremity [18]. Furthermore, these neuromechanical alterations, due to limited visual input, can be associated with factors that are proposed to increase the risk of injury [19].
Based on previous studies concerning visual blocking (e.g., being blindfolded) during double-leg landings, some researchers [19,20] reported movement alterations while others [21,22] did not. A study executing single-leg landing [23] also reported no difference in sagittal and frontal lower-extremity joint kinematics between landing conditions while receiving full (e.g., looking at the ground) and less (e.g., looking ahead) visual information. Therefore, while the relationship between injury risks and the level of visual input is inconclusive, the results of previous studies [18,19,20,21,22,23] have revealed several practical limitations. First, a complete absence of visual information using a blindfold [19,20,21,22] is extremely rare in real athletic situations. Hence, landing with peripheral vision (not looking at the ground with eyes-open) is more common due to the tendency to focus on other things, such as the ball or other individuals. Second, previous studies examining visual input observed double-leg landings [18,19,20,21,22], although single-leg landing was associated with a higher risk of injury than double-leg landing [24,25,26]. A study [23] also exists that reported single-leg landing; however, this study reported joint kinematics at time points of 100 ms before landing and at initial contact. Thus, the results of this study [23] have limitations because injuries occurred after landing [27,28,29]. Third, increased patellofemoral joint stress (PFJS) during functional activities was related to patellofemoral pain [30,31], which accounted for approximately 7% of all musculoskeletal conditions [32]. However, the relationship between the level of visual input and the risk of injury overuse has never been examined in single-leg landing.
Therefore, understanding the differences in lower-extremity dynamics and PFJS between two landing conditions (central vs. peripheral vision) during a single-leg drop jump task would address the aforementioned limitations. The central vision condition is defined as directing visual attention to the landing spot while the peripheral vision condition is defined as looking up (e.g., 30° of cervical extension), and thus not having the lower-extremity and the landing spot in view. The results of our study would be beneficial in identifying the risk of lower-extremity traumas and overuse injuries, including the possibility of developing injury prevention strategies, especially for those who frequently perform jumping or landing tasks. Hence, this study compared the lower-extremity movement of two landing conditions (central vs. peripheral vision) during the landing phase while performing a single-leg drop landing task. Specifically, we examined whether observed lower-extremity kinematics and kinetics were known traumatic injury-related movements, such as increased vertical GRF [20], decreased knee flexion angle [19], or increased plantar flexion moment [9]. Furthermore, we determined the risk of overuse injury, and the amount of PFJS in both landing conditions was compared. Specifically, lower-extremity dynamics (joint angles, joint moments, and vertical GRF) and PFJS were examined as well to estimate the risk of traumatic and overuse injuries using statistical parametric mapping (SPM). Based on previous data [21,22,23], we hypothesized similar movements in the sagittal and frontal plane lower-extremity joint kinematics, kinetics, vertical GRF, and PFJS, regardless of looking at the landing spot.

2. Methods

2.1. Design

We used a laboratory-based crossover repeated measures design where participants randomly performed two types of a single-leg drop jump at each session for three separate sessions. This study design was intended to washout the order effect and obtain data for two conditions measured on different days. Additionally, the independent variable was set at that examined during the landing condition (central vs. peripheral vision) while the drop jump task was being conducted. However, the dependent variables were the sagittal and frontal planes, lower-extremity (ankle, knee, and hip) joint angles, and joint moments, as well as the vertical GRF and PFJS.

2.2. Participants

Twenty healthy adults (10 females: 22 ± 2 years, 162 ± 4 cm, 57 ± 6 kg; 10 males: 25 ± 4 years, 176 ± 6 cm, 74 ± 11 kg, body mass index: 23.9 kg/m2) volunteered to participate in the study. Participants who had no history of lower-back or lower-extremity injuries for the last six months and who have never undergone any orthopedic surgery in their lifetime were included, whereas participants who had a history of musculoskeletal, perceptual, neurological, or balance disorders were excluded. The study protocol complied with the principles of the Declaration of Helsinki. Before participation in this study, all participants provided informed consent. Moreover, the University’s Institutional Review Board approved the testing procedures and informed consent form used in this study.

2.3. Procedures

Participants completed the three separate data collection sessions 48 h apart. Upon arrival to the laboratory for each session, participants changed into standardized spandex shorts, shirts, shoes, and socks. Participants were then instructed on how to perform the single-leg drop jump, after which they were given ample practice trials of the tasks for consistent movements within and between sessions. Subsequently, participants stood on a 30 cm high wooden box (positioned 3 cm away from the force platform) on the left leg while the right hip and knee joint were flexed at 90°. Next, participants were asked to drop down (neither stepping nor jumping down) with their right foot onto the force platform and perform an immediate vertical jump as high as they could and land back on the same force platform [33]. The tasks were repeated if their right foot did not completely land on the force platform or if their left foot touched the ground [34]. Once participants were familiar with the task, two types of a single-leg drop jump were then introduced. For the central vision condition, participants performed the single-leg drop jump on the force platform while looking at the landing spot (force platform). However, for the peripheral vision condition, participants were asked to keep their heads up (cervical extension at 30° reference to the anatomical position) during the drop jump tasks. The angle (30°) for this landing condition was determined by a pilot work which determined that it was the angle where participants were unable to see their lower-extremity and the ground contact.

2.4. Data Collection and Reduction

Three-dimensional motion and GRF data were recorded using eight near-infrared cameras (200 Hz; Vicon, Santa Rosa, CA, USA) and a floor-embedded force platform (2000 Hz; AMTI, Watertown, MA, USA), respectively. Spatial trajectories from the reflective markers were digitized as well using the Plug in Gait module of the Vicon Nexus software (Vicon, Centennial, CO, USA). Afterward, these trajectories and vertical GRF data were filtered using a fourth-order Butterworth low-pass filter with zero lag at a cut off frequency of 12 Hz, determined by residual analysis [35]. Then, smoothed marker coordinates were used to define segment axes and joint centers through the Plug in Gait model. Data from the initial contact (vertical GRF: >10 N) to the peak knee flexion during the first landing phase were also analyzed [36]. Subsequently, for the time to peak knee flexion, the number of frames from initial contact to peak knee flexion was converted into milliseconds (ms). Joint angles were then calculated using a Cardan sequence (flexion/extension, adduction/abduction, and internal/external rotation). Next, joint moments (internal) were calculated by an inverse dynamic approach using anthropometric, kinematic (joint angle), and force (GRF) data. Finally, MATLAB (version 2020a, Math Works, Natick, MA, USA) software was used to reduce and extract the necessary data in the outcomes from Vicon Nexus.
PFJS was calculated using a previously described mathematical model [30]. Then, the effective lever arm for quadriceps muscles was estimated at each time point based on the given knee joint angles (Equation (1) in Table 1). Subsequently, quadriceps muscle forces were also estimated by dividing the knee joint moment by the effective lever arm for the quadriceps (Equation (2)). The patellofemoral joint reaction force was estimated by multiplying the quadriceps muscle force with constant k (Equation (3)) [37], which represents the relationship between quadriceps muscle force and patellofemoral joint’s compression force (Equation (4)). The patellofemoral joint contact area was estimated using a previously described equation [38] (Equation (5)). Then, the PFJS was determined by dividing the patellofemoral joint reaction force by the patellofemoral joint contact area (Equation (6)).

2.5. Statistical Analysis
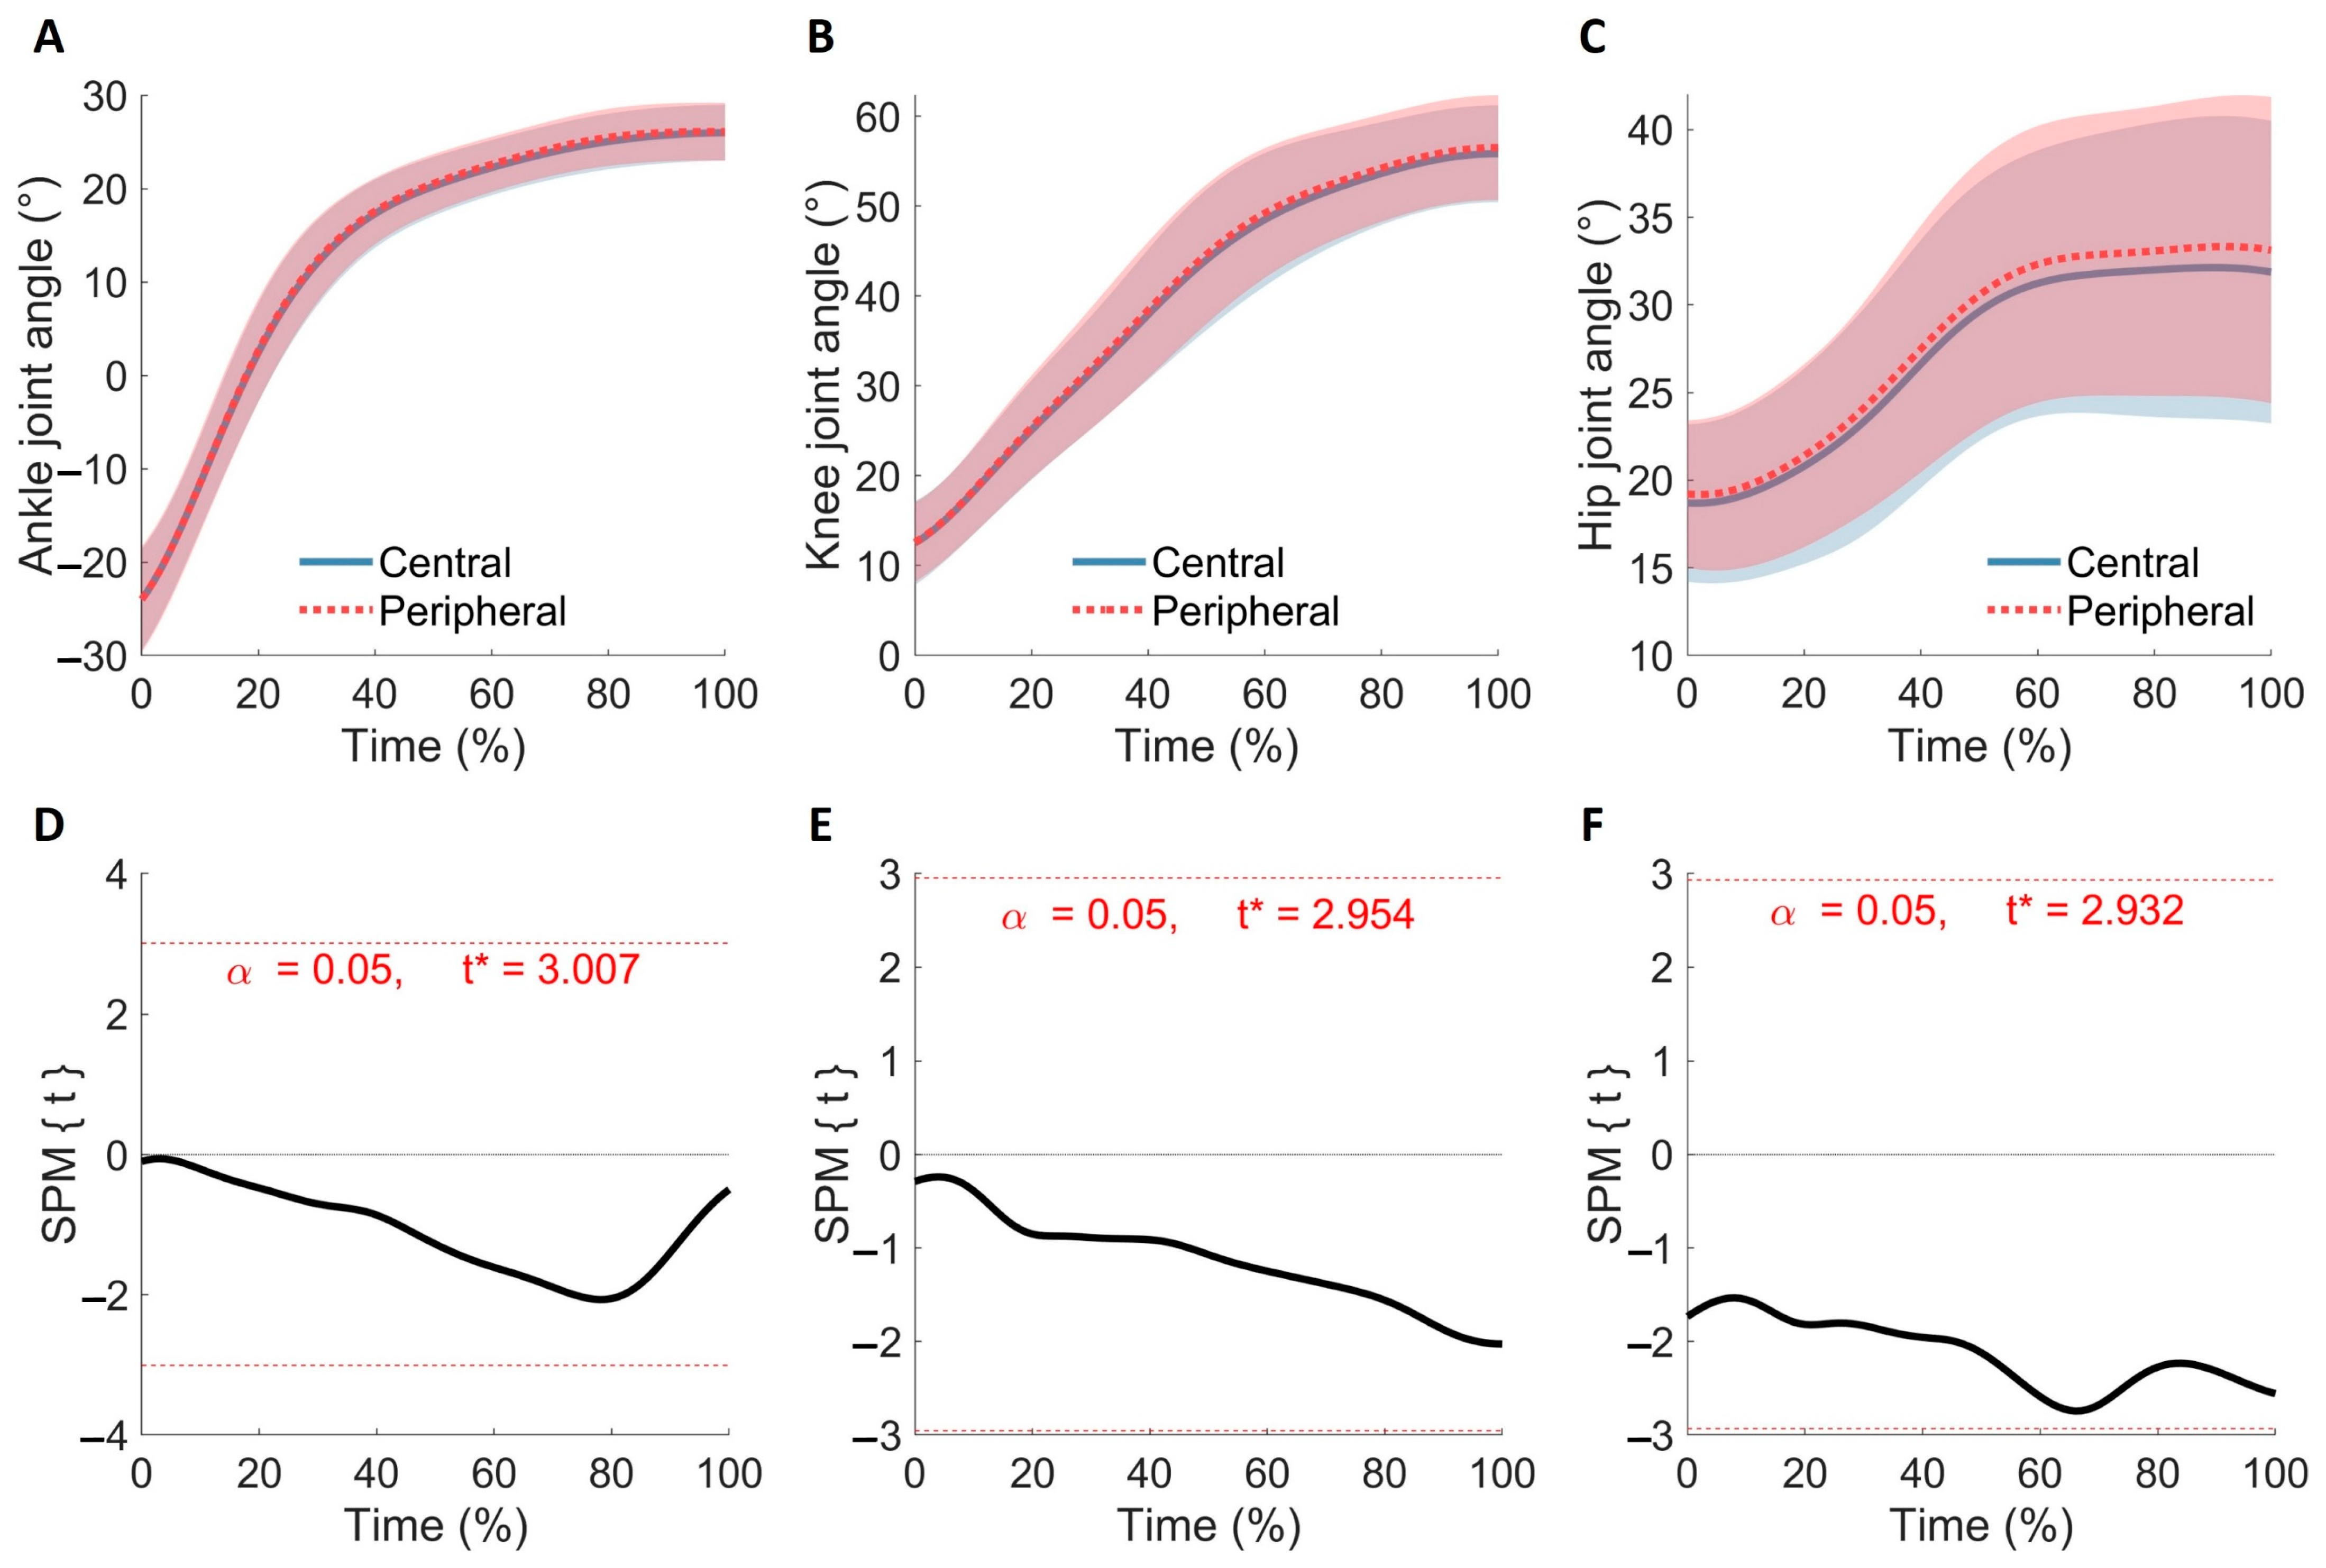
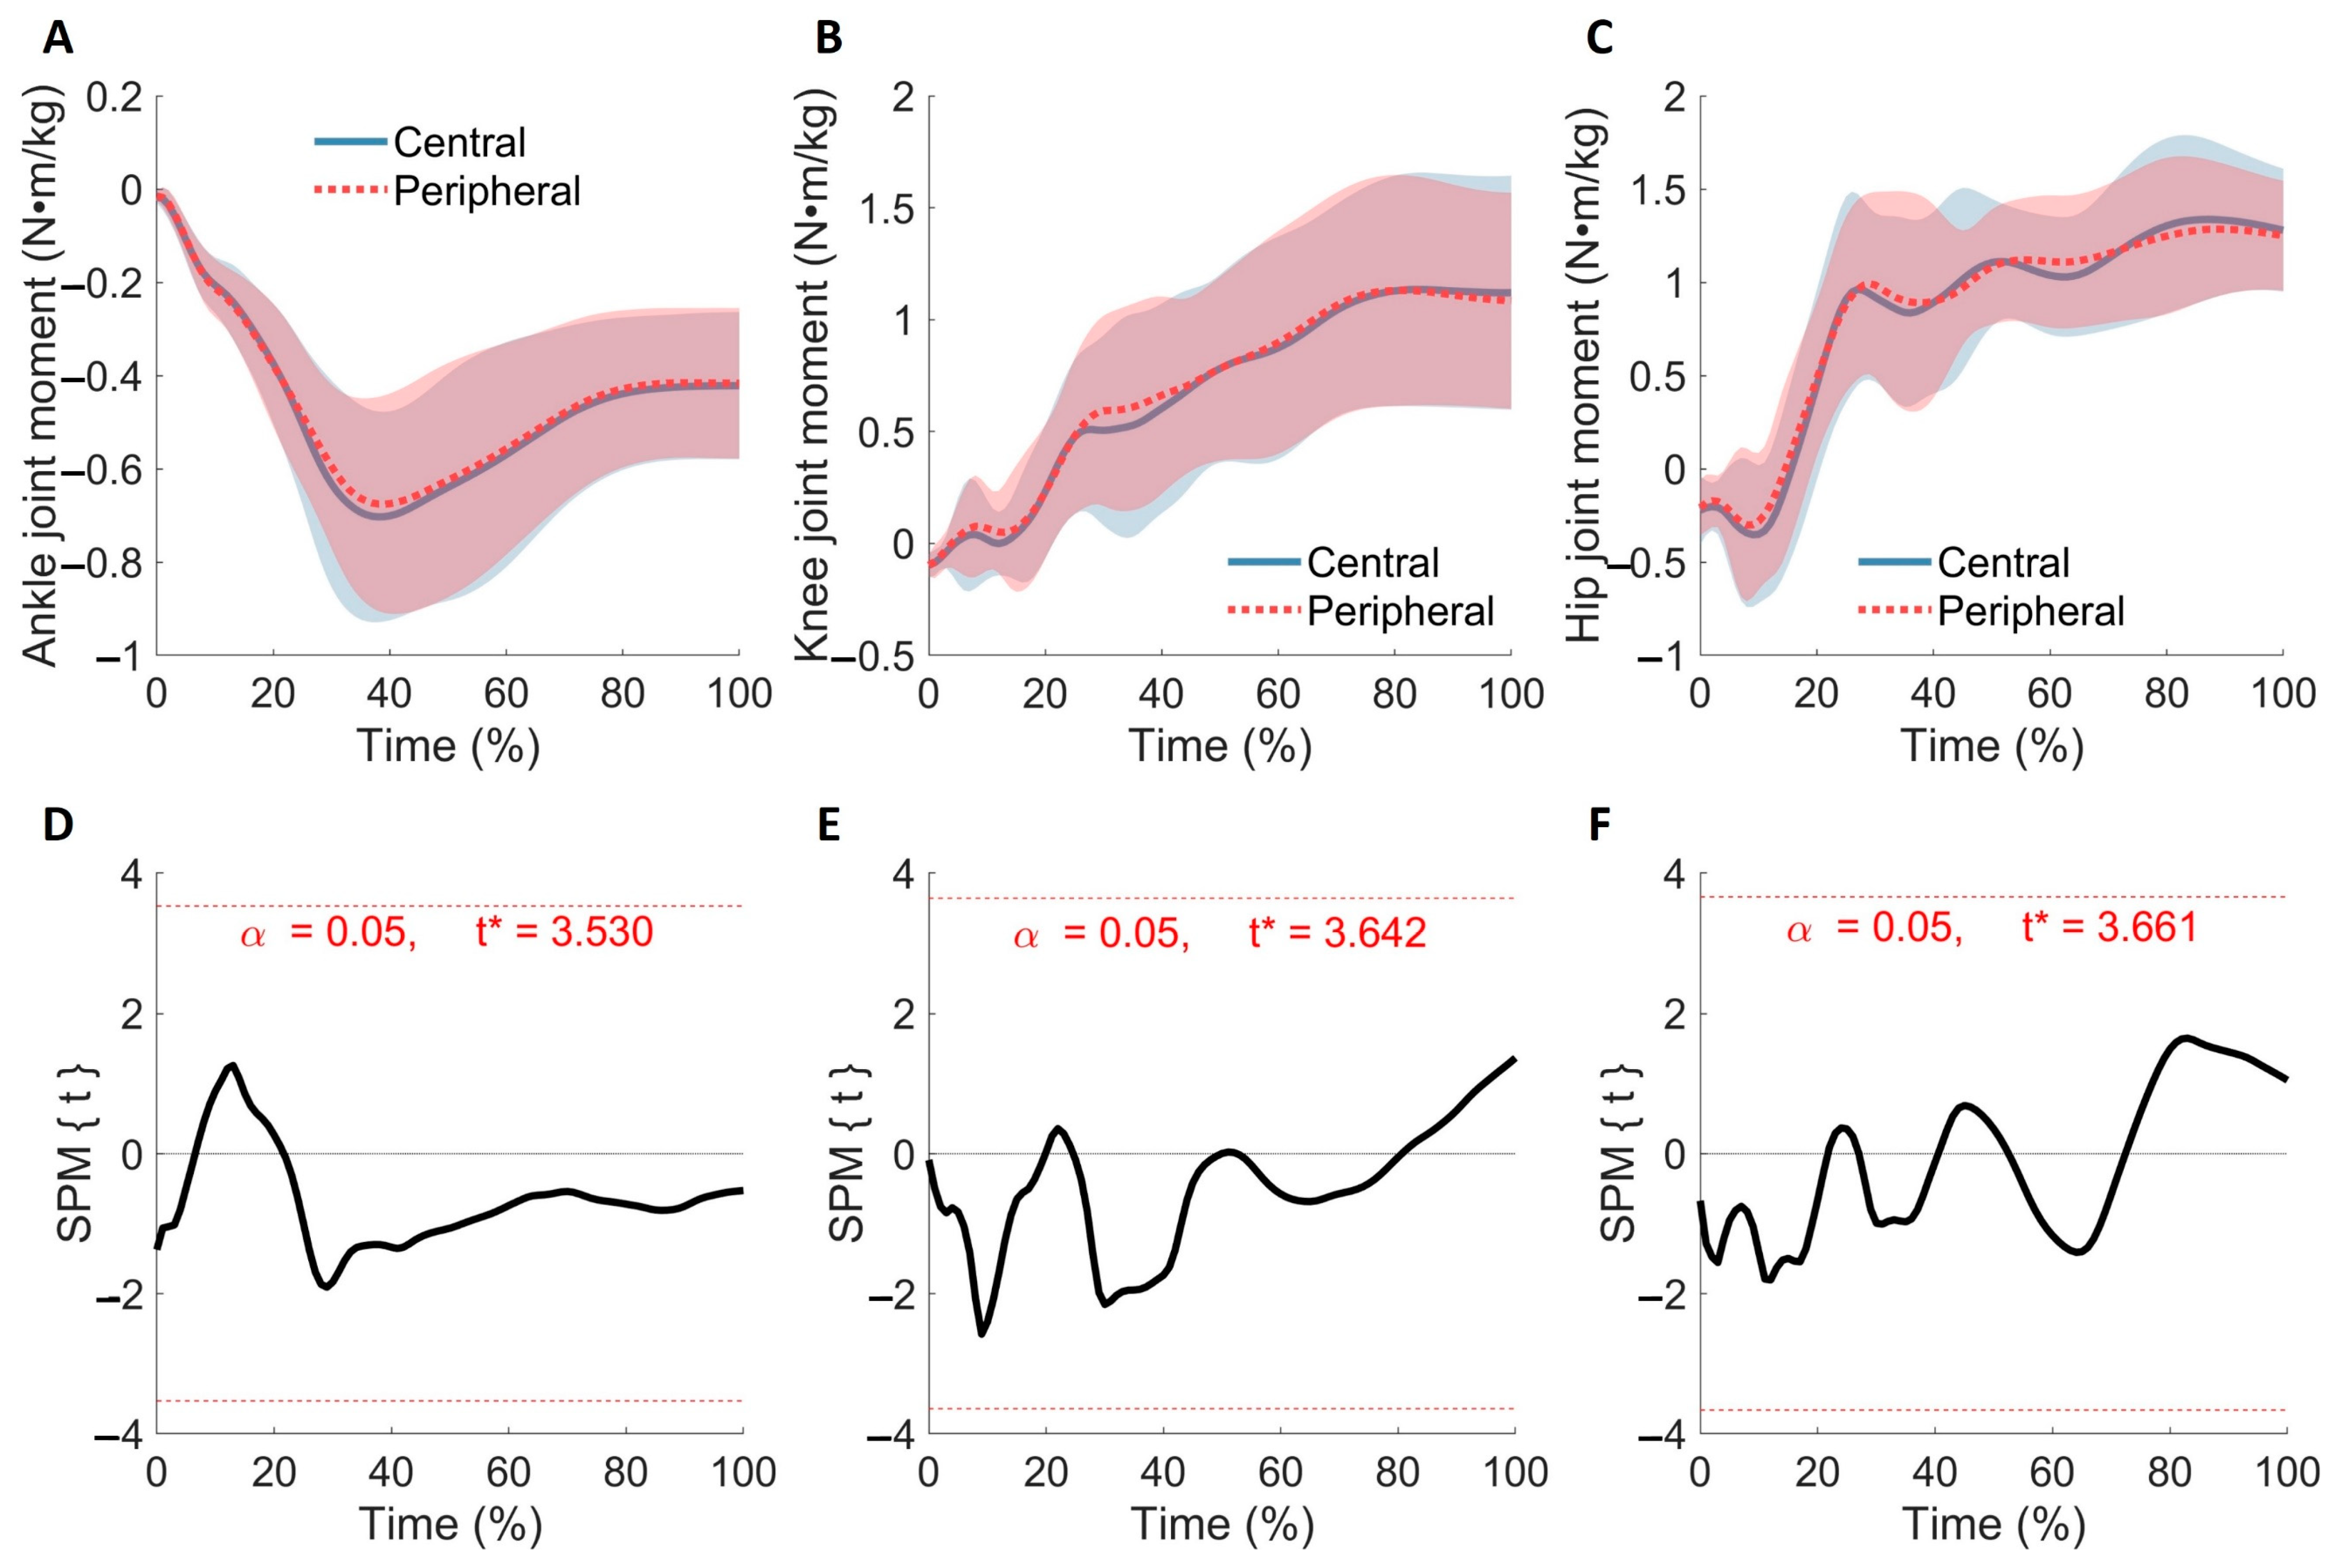
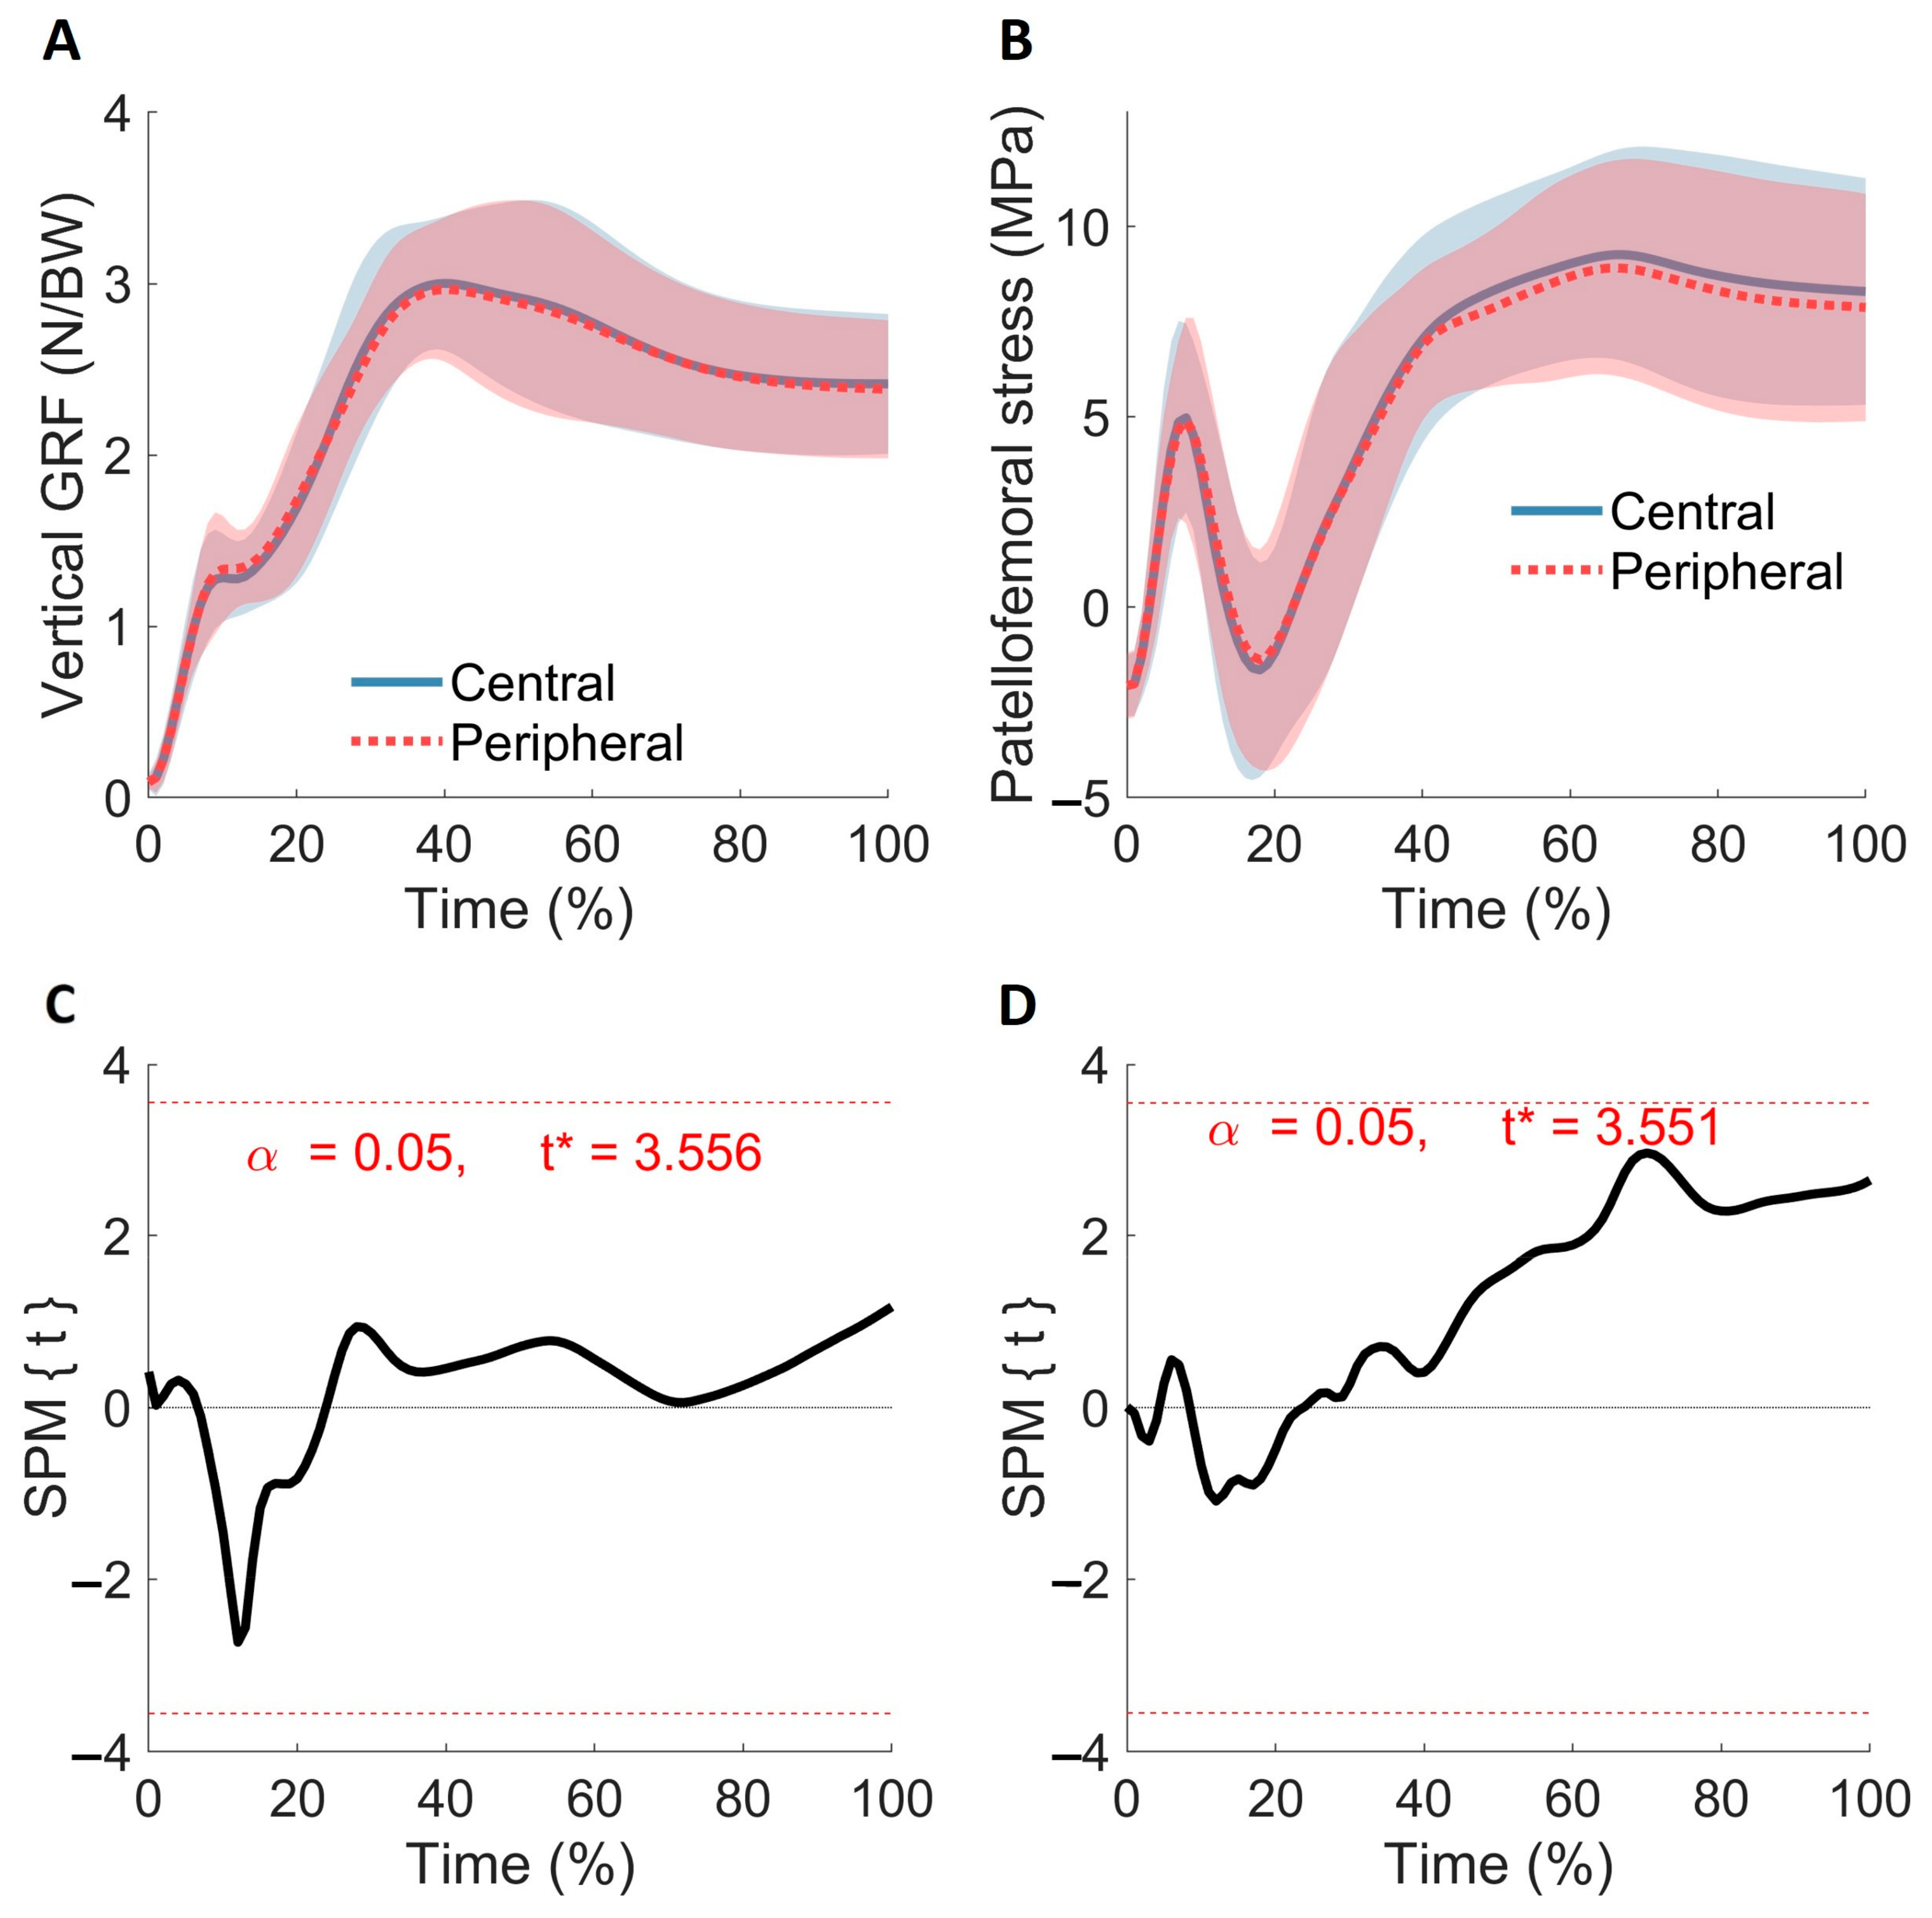
Nine trials of each drop jump task (central vs. peripheral vision) were averaged. A paired Student’s t-test was then conducted to determine the statistical differences in time to attain peak knee flexion using the statistical package R (version 4.1.0, R Development Core Team). Each dataset on joint angles, joint moments, vertical GRF, and PFJS within time-series (data from initial contact to peak knee flexion during the first landing) was also time-normalized into 101 data points (representing 0–100%). Afterward, each dependent variable between landing conditions was compared with SPM paired t-test [39] using MATLAB software with an open-source SPM code (www.spm1d.org). The α level was set at 0.05 for all tests. Cohen’s d effect size (d) was calculated when statistical significances were detected. Then, the effect sizes within the period were averaged.

3. Results

We did not observe any statistical difference between landing conditions (central vs. peripheral vision) in time to peak knee flexion (Table 2), lower-extremity joint angles (sagittal plane: Figure 1).
We observed significant difference in the frontal plane ankle and hip joint (Figure 2). Specifically, participants with the peripheral vision condition showed greater ankle joint inversion (7.5% to 13.3%: 0.3°, d = 0.19; 29.0% to 30.6: 0.4°, d = 0.23; 76.3% to 91.8%: 0.4°, d = 0.23, Figure 2A,D) and hip joint adduction (10.5% to 26.3%: 0.9°, d = 0.35; 66.3% to 96.9%: 1.2°, d = 0.31, Figure 2C,F).
We did not observe statistical difference between landing conditions in joint moments (sagittal plane: Figure 3; frontal plane: Figure 4), and vertical GRF and PFJS (Figure 5).

4. Discussion

This study compared the lower-extremity dynamics (joint kinematics, kinetics, and vertical GRF) and the PFJS between the landing with and without looking at the landing spot during a single-leg drop jump task. Although we observed several alterations in the frontal plane ankle and hip joint (Figure 2), the magnitudes of changes were negligeable (altered joint angles < 1.2°, d < 0.35). Therefore, our hypothesis that no difference would be observed in movement dynamics and PFJS was mostly supported, which agreed with the results of previous reports in which visual input was manipulated. Specifically, blindfolded subjects in previous studies did not show alterations in vertical GRF [21] and preparatory muscle activities [22] during the double-leg landing relative to a condition with normal vision (not blindfolded). Moreover, landing while receiving less visual information (e.g., not looking at the ground with eyes open) showed no difference in vertical GRF and preparatory muscle activity [18] during a double-leg landing compared with landing conditions that received full visual information (e.g., looking at the ground). Our data therefore propose that less visual focus on the landing spot during the landing phase of a single-leg drop jump does not increase the risk of lower-extremity traumatic and overuse injuries.
Furthermore, no difference observed in most dependent variables between the landing conditions explained the delimitation of this study. Hence, the landing height and the horizontal distance from the force platform were fixed at 30 cm and 3 cm, respectively. The lower-extremity joints also have to manage greater external forces as landing height increases [40]. Therefore, previous studies have suggested that the dropping height, which possibly increases injury risk during double-leg landing, was >60 cm [41]. A study also proposed that single-leg landings from a height of 30 cm or less does not exceed the threshold at which the normal integration of sensory input is altered [42]. Our participants were healthy populations that the amount of visual deficit would have easily been complemented by other systems (e.g., substitution of proprioception) [43], including a short-term learning effect [44]. Previously, only ten practice trials ended the neuromechanical compensatory movements during double-leg landing when participants were blindfolded [22]. Another study [21] reported that perceiving and understanding the laboratory environment (e.g., landing height, equipment, and testing procedures) before being blindfolded did not result in movement deviations. However, our participants were proposed to have learned movement patterns of the single-leg drop jump task through repetitive practice trials over three separate days. Therefore, the adaptation of the task-specific movement [16,22] and environmental perception [21] may also explain why we did not observe any movement differences between the landing conditions.
As we discussed in the introduction, little data are available on movement alterations regarding the level of visual information during landing [18,19,20,21,22,23]. Double-leg landing without receiving visual information (being blindfolded) resulted in decreased knee flexion and increased vertical GRF [19,20]. These movement alterations also increased the risk of traumatic injuries because the vestibular and proprioceptive system did not completely compensate for visual information deficits (blocking vision) [20]. Alternatively, movement alterations were not observed when looking at the landing spot was manipulated during the single- [23] and double- [18] leg-landing periods. Hence, since our participants did not use a blindfold, they fully received visual information (central vision condition) or at least partially (peripheral vision condition) during the task. This result implies that the normal sensorimotor system would function as long as it received visual afferent information [45], thereby maintaining dynamic joint stability. Furthermore, we analyzed the whole landing phase (initial contact to peak knee flexion) of the task [26,33], which did not show any difference between landing conditions. Our data (time ranged between 162 ms and 169 ms, Table 2) also included the estimated time frame for ACL injuries (20 to 70 ms) [27,28,29] or ankle sprain (50 to 90 ms) [1]. Therefore, unless visual inputs were blocked, the level of visual information (visual focus) is not proposed to be a factor that alters the lower-extremity landing mechanics from a 30 cm height.
As a single-leg drop landing can acutely cause femoral cartilage deformation [10], the amount of PFJS can be the potential source of overuse injury [10,46]. Likewise, our data showed that the level of visual information did not affect PFJS during the landing phase. Therefore, since the cumulative joint contact stress can lead to joint degeneration [46], the amount of PFJS estimates the risk of the patellofemoral conditions [30]. The peak PFJS in our participants during the task was also calculated as approximately 9 MPa (Figure 5), which is similar to that of descending walking [47]. Additionally, compared to other functional movements, this value is smaller than that of the body weight of two-legged squats (12 MPa) [48], but greater than that of single-leg squats (7 MPa) [49], forward lunging (6.0 MPa) [50], self-selected fast waking (3 MPa) [30], single-leg hopping (2 MPa) [51], and self-selected free walking (2.0 MPa) [30], whereas the amounts of peak PFJS during various movements have been reported [30,47,48,49,50,51]. Similarly, the specific amount or duration of (cumulative) PFJS that is proposed to lead to overuse injury is unknown [48,50,52]. Thus, our results demonstrated that the amount of PFJS related to overuse injury is not affected by the level of visual information (visual focus) during a task that requires single-leg dynamic stability.
Notably, it is important to acknowledge the study limitations. Females have different landing mechanics, such as greater GRF [53], greater knee valgus [54], and less knee flexion [55]. Hence, comparing sex differences was not the purpose of our study, which was also not considered in the statistical analyses as in previous studies with a similar study design (crossover repeated measures) [20,23]. Therefore, future studies should examine the interaction between the level of visual input and sex discrepancies in the risk of injury during a single-leg drop jump task. Second, PFJS in our study was calculated using the kinematic and kinetic variables in the sagittal plane [30]. Thus, since the patella moved in multiple planes, future estimation of PFJS should take account of variables in multiple planes using other methods (e.g., computational modeling using OpenSim) [56]. Lastly, parameters on landing conditions (e.g., visual focus, height, and movement after landing) were unpredictable in real athletic situations. An unanticipated single-leg-landing condition also showed greater ankle joint and impact kinetics [9,57] than an anticipated landing condition. Therefore, care should be taken when applying the results of our study to unanticipated landing conditions.

5. Conclusions

A single-leg landing with less visual focus (by looking up) on a landing spot did not change lower-extremity movement patterns. Therefore, the level of visual inputs has little effect on the risk of traumatic and overuse injuries when landing from a height of 30 cm.

Author Contributions

Conceptualization, J.P.; methodology, J.K., K.S., S.Y.L. and J.P.; software, H.K. and S.Y.L.; formal analysis, H.K. and J.P.; resources, S.Y.L.; data curation, K.S. and S.Y.L.; writing—original draft preparation, J.K. and J.P.; writing—review and editing, J.K., K.S., H.K., S.Y.L. and J.P.; visualization, H.K. and J.P.; supervision, J.P.; funding acquisition, J.P. All authors have read and agreed to the published version of the manuscript.

Funding

This work was supported by the National Research Foundation of Korea Grant funded by the Korean Government (NRF-2014S1A5A8019804).

Institutional Review Board Statement

The study was conducted according to the guidelines of the Declaration of Helsinki, and approved by the Institutional Review Board of Kyung Hee University (protocol code: KHU IRB 2014-G04).

Informed Consent Statement

Informed consent was obtained from all subjects involved in the study.

Data Availability Statement

The data presented in the study are available on request from the corresponding author.

Conflicts of Interest

The authors declare no conflict of interest.

References

  1. Fong, D.T.; Chan, Y.Y.; Mok, K.M.; Yung, P.S.; Chan, K.M. Understanding acute ankle ligamentous sprain injury in sports. Sports Med. Arthrosc. Rehabil. Ther. Technol. 2009, 1, 14. [Google Scholar] [CrossRef] [Green Version]
  2. Koga, H.; Nakamae, A.; Shima, Y.; Iwasa, J.; Myklebust, G.; Engerbretsen, R.B.; Krosshaug, K. Mechanisms for noncontact anterior cruciate ligament injuries: Knee joint kinematics in 10 injury situations from female team handball and basketball. Am. J. Sports Med. 2010, 38, 2218–2225. [Google Scholar] [CrossRef] [PubMed]
  3. Brazen, D.M.; Todd, M.K.; Ambegaonkar, J.P.; Wunderlich, R.; Peterson, C. The effect of fatigue on landing biomechanics in single-leg drop landings. Clin. J. Sport Med. 2010, 20, 286–292. [Google Scholar] [CrossRef] [PubMed]
  4. Podraza, J.T.; White, S.C. Effect of knee flexion angle on ground reaction forces, knee moments and muscle co-contraction during an impact-like deceleration landing: Implications for the non-contact mechanism of ACL injury. Knee 2010, 17, 291–295. [Google Scholar] [CrossRef] [PubMed]
  5. Shin, C.S.; Chaudhari, A.M.; Andriacchi, T.P. Valgus plus internal rotation moments increase anterior cruciate ligament strain more than either alone. Med. Sci. Sports Exerc. 2011, 43, 1484–1491. [Google Scholar] [CrossRef] [PubMed]
  6. Bisseling, R.W.; Hof, A.L.; Bredeweg, S.W.; Zwerver, J.; Mulder, T. Are the take-off and landing phase dynamics of the volleyball spike jump related to patellar tendinopathy? Br. J. Sports. Med. 2008, 42, 483–489. [Google Scholar] [CrossRef] [Green Version]
  7. Nunes, G.S.; Barton, C.J.; Serrão, F.V. Females with patellofemoral pain have impaired impact absorption during a single-legged drop vertical jump. Gait Posture 2019, 68, 346–351. [Google Scholar] [CrossRef]
  8. Terada, M.; Gribble, P.A. Jump landing biomechanics during a laboratory recorded recurrent ankle sprain. Foot Ankle Int. 2015, 36, 842–848. [Google Scholar] [CrossRef] [PubMed]
  9. Simpson, J.D.; Stewart, E.M.; Rendos, N.K.; Cosio-Lima, L.K.; Wilson, S.J.; Macias, D.M.; Chander, H.; Kinght, A.C. Anticipating ankle inversion perturbations during a single-leg drop landing alters ankle joint and impact kinetics. Hum. Mov. Sci. 2019, 66, 22–30. [Google Scholar] [CrossRef]
  10. Harkey, M.S.; Blackburn, J.T.; Hackney, A.C.; Lewek, M.D.; Schmitz, R.J.; Nissman, D.; Pietrosimone, B. Comprehensively assessing the acute femoral cartilage response and recovery after walking and drop-landing: An ultrasonographic study. Ultrasound Med. Biol. 2018, 44, 311–320. [Google Scholar] [CrossRef]
  11. Riemann, B.L.; Lephart, S.M. The sensorimotor system, part I: The physiologic basis of functional joint stability. J. Athl. Train 2002, 37, 71–79. [Google Scholar] [PubMed]
  12. Proske, U.; Gandevia, S.C. The proprioceptive senses: Their roles in signaling body shape, body position and movement, and muscle force. Physiol. Rev. 2012, 92, 1651–1697. [Google Scholar] [CrossRef] [PubMed]
  13. Cullen, K.E. The vestibular system: Multimodal integration and encoding of self-motion for motor control. Trends Neurosci. 2012, 35, 185–196. [Google Scholar] [CrossRef] [PubMed] [Green Version]
  14. Horak, F.B. Postural orientation and equilibrium: What do we need to know about neural control of balance to prevent falls? Age Ageing 2006, 35 (Suppl. S2), ii7–ii11. [Google Scholar] [CrossRef] [Green Version]
  15. Scott, S.H.; Cluff, T.; Lowrey, C.R.; Takei, T. Feedback control during voluntary motor actions. Curr. Opin. Neurobiol. 2015, 33, 85–94. [Google Scholar] [CrossRef]
  16. Ostry, D.J.; Gribble, P.L. Sensory plasticity in human motor learning. Trends Neurosci. 2016, 39, 114–123. [Google Scholar] [CrossRef] [PubMed] [Green Version]
  17. Sarlegna, F.R.; Mutha, P.K. The influence of visual target information on the online control of movements. Vision Res. 2015, 110, 144–154. [Google Scholar] [CrossRef]
  18. Liebermann, D.G.; Hoffman, J.R. Timing of preparatory landing responses as a function of availability of optic flow information. J. Electromyogr. Kinesiol. 2005, 15, 120–130. [Google Scholar] [CrossRef]
  19. Chu, Y.; Sell, T.C.; Abt, J.P.; Nagai, T.; Deluzio, J.; McGrail, M.; Rowe, R.; Smalley, B.; Lephart, S.M. Air assault soldiers demonstrate more dangerous landing biomechanics when visual input is removed. Mil. Med. 2012, 177, 41–47. [Google Scholar] [CrossRef] [PubMed] [Green Version]
  20. Santello, M.; McDonagh, M.J.; Challis, J.H. Visual and non-visual control of landing movements in humans. J. Physiol. 2001, 537, 313–327. [Google Scholar] [CrossRef] [PubMed]
  21. Liebermann, D.G.; Goodman, D. Pre-landing muscle timing and post-landing effects of falling with continuous vision and in blindfold conditions. J. Electromyogr. Kinesiol. 2007, 17, 212–227. [Google Scholar] [CrossRef]
  22. Magalhães, F.H.; Goroso, D.G. Preparatory EMG activity reveals a rapid adaptation pattern in humans performing landing movements in blindfolded condition. Percept. Mot. Skills 2009, 109, 500–516. [Google Scholar] [CrossRef] [PubMed]
  23. Terada, M.; Ball, L.M.; Pietrosimone, B.G.; Gribble, P.A. Altered visual focus on sensorimotor control in people with chronic ankle instability. J. Sports Sci. 2016, 34, 171–180. [Google Scholar] [CrossRef]
  24. Taylor, J.B.; Ford, K.R.; Nguyen, A.D.; Shultz, S.J. Biomechanical comparison of single- and double-leg jump landings in the sagittal and frontal plane. Orthop. J. Sports Med. 2016, 4, 2325967116655158. [Google Scholar] [CrossRef] [PubMed] [Green Version]
  25. Xu, D.; Jiang, X.; Cen, X.; Baker, J.S.; Gu, Y. Single-leg landings following a volleyball spike may increase the risk of anterior cruciate ligament injury more than landing on both-legs. Appl. Sci. 2021, 11, 130. [Google Scholar] [CrossRef]
  26. Yeow, C.H.; Lee, P.V.S.; Goh, J.C.H. An investigation of lower extremity energy dissipation strategies during single-leg and double-leg landing based on sagittal and frontal plane biomechanics. Hum. Mov. Sci. 2011, 30, 624–635. [Google Scholar] [CrossRef] [PubMed]
  27. Bates, N.A.; Schilaty, N.D.; Ueno, R.; Hewett, T.E. Timing of strain response of the ACL and MCL relative to impulse delivery during simulated landings leading up to ACL failure. J. Appl. Biomech. 2020, 36, 148–155. [Google Scholar] [CrossRef] [PubMed]
  28. Krosshaug, T.; Nakamae, A.; Boden, B.P.; Engerbretsen, L.; Smith, G.; Slauterbeck, J.R.; Hewett, T.E.; Bahr, R. Mechanisms of anterior cruciate ligament injury in basketball: Video analysis of 39 cases. Am. J. Sports Med. 2007, 35, 359–367. [Google Scholar] [CrossRef]
  29. Shin, C.S.; Chaudhari, A.M.; Andriacchi, T.P. The influence of deceleration forces on ACL strain during single-leg landing: A simulation study. J. Biomech. 2007, 40, 1145–1152. [Google Scholar] [CrossRef] [PubMed]
  30. Brechter, J.H.; Powers, C.M. Patellofemoral stress during walking in persons with and without patellofemoral pain. Med. Sci. Sports Exerc. 2002, 34, 1582–1593. [Google Scholar] [CrossRef] [PubMed]
  31. Farrokhi, S.; Keyak, J.H.; Powers, C.M. Individuals with patellofemoral pain exhibit greater patellofemoral joint stress: A finite element analysis study. Osteoarthr. Cartil. 2011, 19, 287–294. [Google Scholar] [CrossRef] [Green Version]
  32. Glaviano, N.R.; Kew, M.; Hart, J.M.; Saliba, S. Demographic and epidemiological trends in patellofemoral pain. Int. J. Sports Phys. Ther. 2015, 10, 281–290. [Google Scholar] [PubMed]
  33. Schmid, S.; Moffat, M.; Gutierrez, G.M. Effect of knee joint cooling on the electromyographic activity of lower extremity muscles during a plyometric exercise. J. Electromyogr. Kinesiol. 2010, 20, 1075–1081. [Google Scholar] [CrossRef]
  34. Park, J.; Song, K.; Lee, S.Y.; Ryu, H. Ankle Joint Cooling did not but knee joint Cooling altered the quadriceps and gastrocnemius neuromuscular Activation during a Single-leg Drop Jump. Exerc. Sci. 2020, 29, 225–232. [Google Scholar] [CrossRef]
  35. Jackson, K.M. Fitting of mathematical functions to biomechanical data. IEEE Trans. Biomed. Eng. 1979, 26, 122–124. [Google Scholar] [CrossRef] [PubMed]
  36. Blackburn, J.T.; Padua, D.A. Sagittal-plane trunk position, landing forces, and quadriceps electromyographic activity. J. Athl. Train. 2009, 44, 174–179. [Google Scholar] [CrossRef] [Green Version]
  37. Van Eijden, T.M.G.J.; Kouwenhoven, E.; Verburg, J.; Weijs, W.A. A mathematical model of the patellofemoral joint. J. Biomech. 1986, 19, 219–229. [Google Scholar] [CrossRef]
  38. Connolly, K.D.; Ronsky, J.L.; Westover, L.M.; Küpper, J.C.; Frayne, R. Differences in patellofemoral contact mechanics associated with patellofemoral pain syndrome. J. Biomech. 2009, 42, 2802–2807. [Google Scholar] [CrossRef]
  39. Pataky, T.C. Generalized n-dimensional biomechanical field analysis using statistical parametric mapping. J. Biomech. 2010, 43, 1976–1982. [Google Scholar] [CrossRef]
  40. Norcross, M.F.; Lewek, M.D.; Padua, D.A.; Shultz, S.J.; Weinhold, P.S.; Blackburn, J.T. Lower extremity energy absorption and biomechanics during landing, part I: Sagittal-plane energy absorption analyses. J. Athl. Train. 2013, 48, 748–756. [Google Scholar] [CrossRef] [PubMed] [Green Version]
  41. Peng, H.T. Changes in biomechanical properties during drop jumps of incremental height. J. Strength Cond. Res. 2011, 25, 2510–2518. [Google Scholar] [CrossRef] [PubMed]
  42. Miall, R.C.; Kitchen, N.M.; Nam, S.H.; Lefumat, H.; Renault, A.G.; Ørstavik, K.; Cole, J.D.; Sarlegna, F.R. Proprioceptive loss and the perception, control and learning of arm movements in humans: Evidence from sensory neuronopathy. Exp. Brain Res. 2018, 236, 2137–2155. [Google Scholar] [CrossRef] [PubMed] [Green Version]
  43. Lefumat, H.Z.; Vercher, J.L.; Maill, R.C.; Cole, J.; Buloup, F.; Bringoux, L.; Bourdin, C.; Sarlegna, F.R. To transfer or not to transfer? Kinematics and laterality quotient predict interlimb transfer of motor learning. J. Neurophysiol. 2015, 114, 2764–2774. [Google Scholar] [CrossRef] [PubMed] [Green Version]
  44. Chen, H.Y.; Chang, H.Y.; Ju, Y.Y.; Tsao, H.T. Superior short-term learning effect of visual and sensory organisation ability when sensory information is unreliable in adolescent rhythmic gymnasts. J. Sports Sci. 2017, 35, 1197–1203. [Google Scholar] [CrossRef] [PubMed]
  45. Franklin, D.W.; So, U.; Burdet, E.; Kawato, M. Visual feedback is not necessary for the learning of novel dynamics. PLoS ONE 2007, 2, e1336. [Google Scholar] [CrossRef] [PubMed]
  46. Buckwalter, J.A.; Anderson, D.D.; Brown, T.D.; Tochigi, Y.; Martin, J.A. The roles of mechanical stresses in the pathogenesis of osteoarthritis: Implications for treatment of joint injuries. Cartilage 2013, 4, 286–294. [Google Scholar] [CrossRef] [PubMed]
  47. Waiteman, M.C.; Briani, R.V.; Pazzinatto, M.F.; Ferreira, A.S.; Ferrari, D.; de Olivia Silva, D.; de Azevedo, F.M. Relationship between knee abduction moment with patellofemoral joint reaction force, stress and self-reported pain during stair descent in women with patellofemoral pain. Clin. Biomech. 2018, 59, 110–116. [Google Scholar] [CrossRef] [PubMed]
  48. Powers, C.M.; Ho, K.Y.; Chen, Y.J.; Souza, R.B.; Farrokhi, S. Patellofemoral joint stress during weight-bearing and non-weight-bearing quadriceps exercises. J. Orthop. Sports Phys. Ther. 2014, 44, 320–327. [Google Scholar] [CrossRef] [Green Version]
  49. Escamilla, R.F.; Zheng, N.; Macleod, T.D.; Edwards, W.B.; Imamura, R.; Hreljac, A.; Fleisig, G.S.; Wilk, K.E.; Moorman, C.T., 3rd; Andrews, J.R. Patellofemoral joint force and stress during the wall squat and one-leg squat. Med. Sci. Sports Exerc. 2009, 41, 879–888. [Google Scholar] [CrossRef]
  50. Escamilla, R.F.; Zheng, N.; MacLeod, T.D.; Edwards, W.B.; Hreljac, A.; Fleisig, G.S.; Wilk, K.E.; Moorman, C.T., 3rd; Imamura, R.; Andrews, J.R. Patellofemoral joint force and stress between a short- and long-step forward lunge. J. Orthop. Sports Phys. Ther. 2008, 38, 681–690. [Google Scholar] [CrossRef] [PubMed]
  51. Ristow, A.; Besch, M.; Rutherford, D.; Kernozek, T.W. Patellofemoral joint loading during single-leg hopping exercises. J. Sport Rehabil. 2020, 29, 1131–1136. [Google Scholar] [CrossRef] [PubMed]
  52. Wallace, D.A.; Salem, G.J.; Salinas, R.; Powers, C.M. Patellofemoral joint kinetics while squatting with and without an external load. J. Orthop. Sports Phys. Ther. 2002, 32, 141–148. [Google Scholar] [CrossRef] [PubMed] [Green Version]
  53. Aizawa, J.; Hirohata, K.; Ohji, S.; Ohmi, T.; Yagishita, K. Limb-dominance and gender differences in the ground reaction force during single-leg lateral jump-landings. J. Phys. Ther. Sci. 2018, 30, 387–392. [Google Scholar] [CrossRef] [PubMed] [Green Version]
  54. Russell, K.A.; Palmieri, R.M.; Zinder, S.M.; Ingersoll, C.D. Sex differences in valgus knee angle during a single-leg drop jump. J. Athl. Train. 2006, 41, 166–171. [Google Scholar] [PubMed]
  55. Leppänen, M.; Pasanen, K.; Kujala, U.M.; Vasankari, T.; Kannus, P.; Äyrämö, S.; Kroshaug, T.; Bahr, R.; Avela, R.; Perttunen, J.; et al. Stiff landings are associated with increased ACL injury risk in young female basketball and floorball players. Am. J. Sports Med. 2017, 45, 386–393. [Google Scholar] [CrossRef]
  56. Kim, N.; Browning, R.C.; Lerner, Z.F. The effects of pediatric obesity on patellofemoral joint contact force during walking. Gait Posture 2019, 73, 209–214. [Google Scholar] [CrossRef]
  57. Dicus, J.R.; Seegmiller, J.G. Unanticipated ankle inversions are significantly different from anticipated ankle inversions during drop landings: Overcoming anticipation bias. J. Appl. Biomech. 2012, 28, 148–155. [Google Scholar] [CrossRef]
Figure 1. Sagittal plane joint angle. Descriptive statistics for each condition (mean ± 1 standard deviation error cloud) for the ankle (A), knee (B), and hip (C) joint angles. Time was determined from initial contact (0%) to peak knee flexion (100%). The black line is the t-value of each time point for the ankle (D), knee (E), and hip (F) joint angles. The dotted redline is the threshold of significance. No significant difference was observed in the sagittal plane joint angle between the landing conditions.
Applsci 12 02599 g001
Figure 2. Frontal plane joint angle. Descriptive statistics for each condition (mean ± 1 standard deviation error cloud) for the ankle (A), knee (B), and hip (C) joint angles. Time was determined from initial contact (0%) to peak knee flexion (100%). The black line is the t-value of each time point for the ankle (D), knee (E), and hip (F) joint angles. The dotted redline is the threshold of significance. The gray areas are the time periods in which significant differences occurred. Statistical differences were detected in the frontal plane ankle (D) and hip (F) joint angle between the landing conditions. No significant difference was observed in the frontal plane knee joint angle (E).
Applsci 12 02599 g002
Figure 3. Sagittal plane joint moment. Descriptive statistics for each condition (mean ± 1 standard deviation error cloud) for the ankle (A), knee (B), and hip (C) joint moments. Time was determined from initial contact (0%) to peak knee flexion (100%). The black line is the t-value of each time point for the ankle (D), knee (E), and hip (F) joint moment. The dotted redline is the threshold of significance. No significant difference was observed in the sagittal plane joint moment between the landing conditions.
Applsci 12 02599 g003
Figure 4. Frontal plane joint moment. Descriptive statistics for each condition (mean ± 1 standard deviation error cloud) for the ankle (A), knee (B), and hip (C) joint moments. Time was determined from initial contact (0%) to peak knee flexion (100%). The black line is the t-value of each time point for the ankle (D), knee (E), and hip (F) joint moment. The dotted redline is the threshold of significance. No significant difference was observed in the frontal plane joint moment between the landing conditions.
Applsci 12 02599 g004
Figure 5. Vertical ground reaction force and patellofemoral joint stress (PFJS). Descriptive statistics for each condition (mean ± 1 standard deviation error cloud) for vertical ground reaction force (A) and PFJS (B). Time was determined from initial contact (0%) to peak knee flexion (100%). The black line is the t-value of each time point for the vertical ground reaction force (C) and PFJS (D). The dotted redline is the threshold of significance. Likewise, no significant difference was observed in vertical ground reaction force and PFJS between the landing conditions.
Applsci 12 02599 g005
Table 1. Patellofemoral joint stress calculations.
Equation #Discription
1Lever arm = 0.8E-8x3 − 0.129E-7x2 + 0.28E-5x + 0.462
x = tibiofemoral joint angle (deg)
2Quadriceps Force (N) = knee extension moment (N·m)/lever arm
3k = (4.62E-1 + 1.47E-3x − 3.84E-5x2)/(1 − 1.62E-2x + 1.55E-4x2 − 6.98E-7x3)
4Patellofemoral joint reaction force (N) = k × quadriceps force
5Patellofemoral joint contact area (mm2) = 0.0781x2 + 0.6763x + 151.75
6Patellofemoral joint stress (MPa) = patellofemoral joint reaction force/patellofemoral joint contact area
Table 2. Time to peak knee flexion.
Landing ConditionTime to Peak Knee Flexion
Central vision0.162 ± 0.019 ms
Peripheral vision0.169 ± 0.022 ms
Values are mean ± 95% confidence intervals. There was no statistical difference (t = −1.4; p = 0.16).
Publisher’s Note: MDPI stays neutral with regard to jurisdictional claims in published maps and institutional affiliations.

