1. Introduction
High-strength low-alloy (HSLA) structural steel keeps increasing remarkably due to its equivalent weight to strength ratio to meet specific structural strength, particularly in machinery and offshore industries where fatigue loading is prevalent. The failure in steel structure subjected to cyclic loading often arise from surface defect induced by manufacturing processes that could nucleate crack. Several studies of test data obtained for steel and a few other materials require a comprehensive material parameter that affects crack growth [
1,
2,
3]. Recently, the viability of the computation approach is replacing the destructive, time-consuming and expensive methods in structural integrity assessment-related decisions. Many factors influence fatigue crack growth (FCG) in structures, the stress intensity factor (SIF) in the crack front is a significant parameter in the prediction analysis using linear elastic fracture mechanics (LEFM). Hence, an accurate evaluation of SIFs is extremely important. Furthermore, The Griffith theory allows for a limited amount of plasticity at the crack tip as the energy release rate (G) leads to the same results as the SIF in linear elastic condition proposed by Irwin in steel [
4].
Over the years, numerical methods provide a more accurate approach to extract the SIFs. However, crack front shape in finite element (FE) analysis is still a challenge with error percentage far beyond the experimental solutions [
5,
6]. The geometry changes as the crack progress is ensured with adaptive remeshing techniques in FEM in SIF [
7]. The accuracy depends on effective meshing and sensitivity of the crack front shape and smaller crack growth increments. The virtual crack closure technique (VCCT) option offers a simpler but more general way for obtaining the energy release rate estimation in crack propagation at the crack tip which requires additional post-processing procedures with more precise results [
8,
9]. Rybicki and Kanninen [
10] proposed VCCT in two-dimensional finite element stress intensity analysis with a coarse grid for modes I and II. The method is performed with constant strain elements using nodal forces and nodal displacements, the results were poor when with higher-order elements. Shivakumar et al. [
11] developed Irwin’s theory for three-dimensional bodies applied in the finite element method. However, not all conventional FEM meshing tools can perfectly compute the SIF because the singularity near the crack tip fields. Consequently, very fine meshes are appropriate near the crack tip [
12].
Research efforts on three-dimensional FEM based on VCCT are rare despite suggestions of the crack faces model using the iso-parametric for three-dimensional crack analyses [
13]. Andrzej [
14] describes the algorithm process for 3D VCCT implementation with brick elements in FE analyses using quarter-point singular finite interface elements. The pre- and post-processing database is stored and accomplished in Patran FE software providing solid modelling, meshing and analysis setup. At the same time, Nastran code is used as the FE solver to execute the VCCT. Chang et. al. [
15] implemented the numerical LEFM analysis of energy release rate in 3D VCCT with various a/W ratio using self-developed FEM code with the first-order tetrahedral elements. The stable crack analyses result under Mode-I condition showed good applicability apart from the long-cracked geometries. Lin and Smith describe the 3D implementation of fatigue crack growth rate with planar crack [
16]. Several numerical efforts such as the feature-preserving discretization paired with a local refinement approach adopted to capture small geometric features and locally resolve regions of damage propagation have showed improvements in the efficiency and accuracy of singularities [
17]. Other interesting numerical tools for addressing similar challenges emerge in FE-based techniques, such as meshfree peridynamic methods that discretize areas into nodes, each with a defined volume in the reference configuration. In addition, hybrid meshfree discretization has recently been developed to improve the numerical performance of peridynamic models [
18,
19].
Another solution for this problem is a new faceted surface model placed at the crack front to calculate G based on the VCCT. This new interface element uses shape functions to move the crack front location to compute accurate forces and displacements [
20]. Modelling the moving crack requires an adaptive local remeshing element to deal with the singularity field, which is one of the basic issues. The remeshing at cycle interval and faceted surface in MSC Marc/Mentat for local mesh adaptation can resolve the element type constraints highlighted by Areias et al. [
21,
22]. Commercial software MSC Marc/Mentat VCCT is engaged in estimating the strain energy release rate on the component crack front, as shown by the FE computation of SIFs in an updated crack closure integral. The energy release rate is evaluated with forces and displacements around the crack tip in VCCT, which is critical to having an accurate propagation analysis.
This FEM analysis uses the VCCT alongside surface crack initiator for energy release rate to improve stress intensity extraction for crack growth in mode (I). The method of adaptive local and global remeshing for the crack growth in a single edge notched tension (SENT) specimen under cyclic loading of various stress values of a constant amplitude loading (CAL) is implemented. The research effort describes the crack length and growth pattern related to the load cycles for the stress ratio R = 0 and 0.1 for the energy release rate at the crack front. The accuracy of LEFM estimation with FEM depends on the material crack growth parameters used in the simulation. The accuracy and consistency are evaluated and compared within the experimental results.
2. Materials and Methods
The analysis of crack propagation history demands knowledge of appropriate material parameters to define crack propagation behaviour.
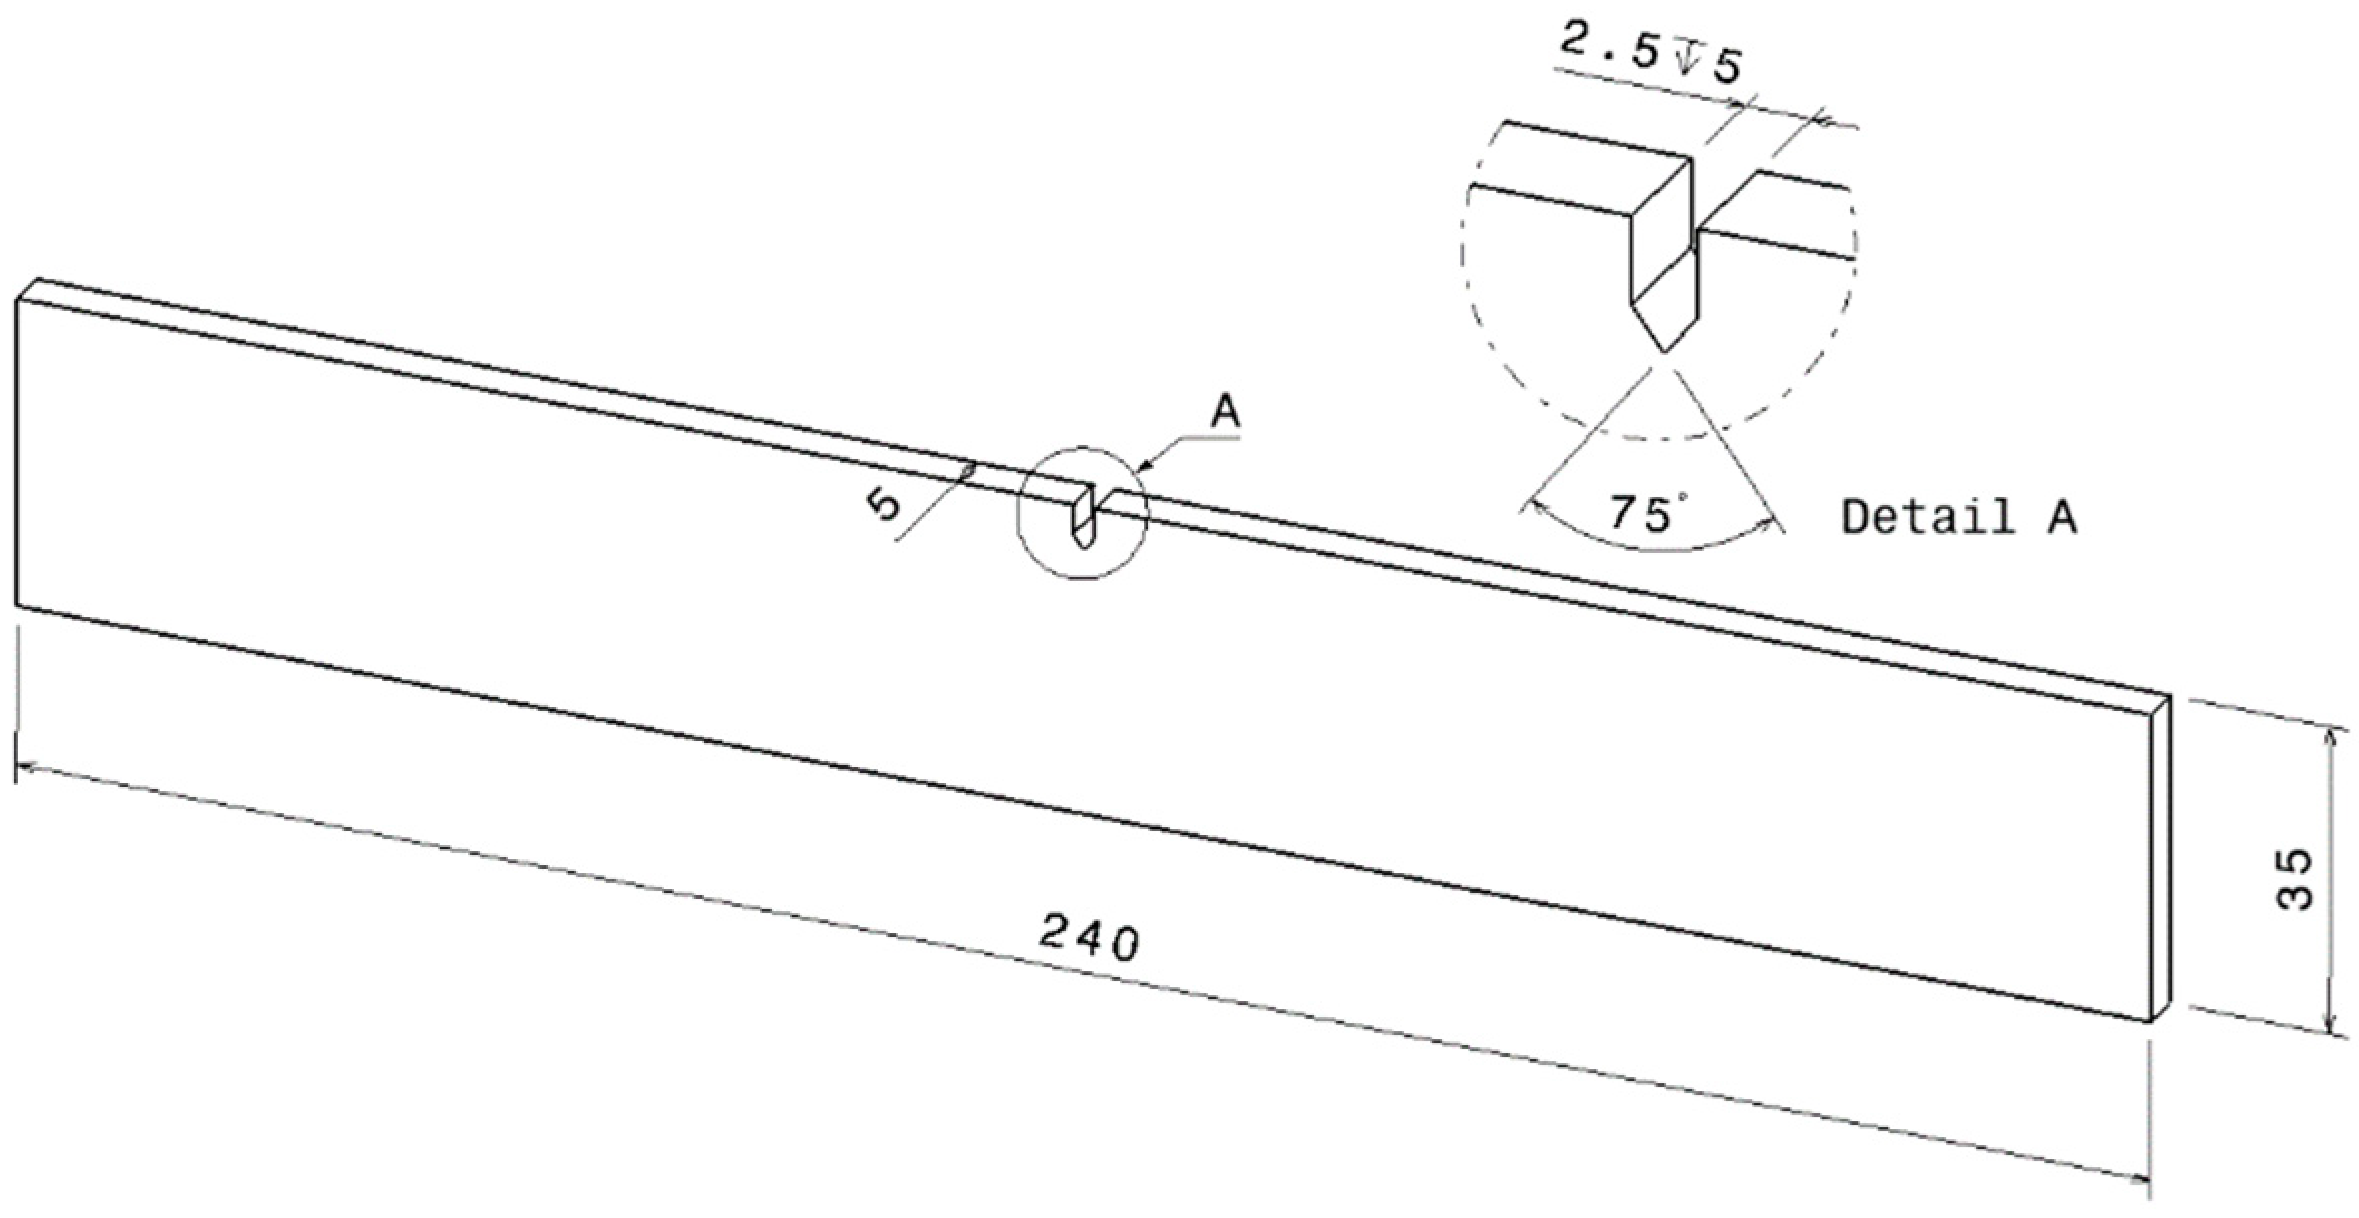
Figure 1 is the crack propagation specimen geometry with initial crack for S355 and S960 structural steel in the experimental studies. The fatigue crack growth rate was performed according to ASTM E647 [
23] with an electromagnetic resonance testing machine using crack gauge and specialized optical measurement system comprising an industrial camera with telecentric lens and LEDs. The crack initiation and propagation with the steel specimen in the fatigue rig under constant amplitude loading (CAL) at each stress ratio. The material data generated with the high-strength steel S355 and S960 plate with a thickness of 5 mm were used to determine the crack growth parameters, C and the slope m with the Paris’ law diagram where the crack is stable.
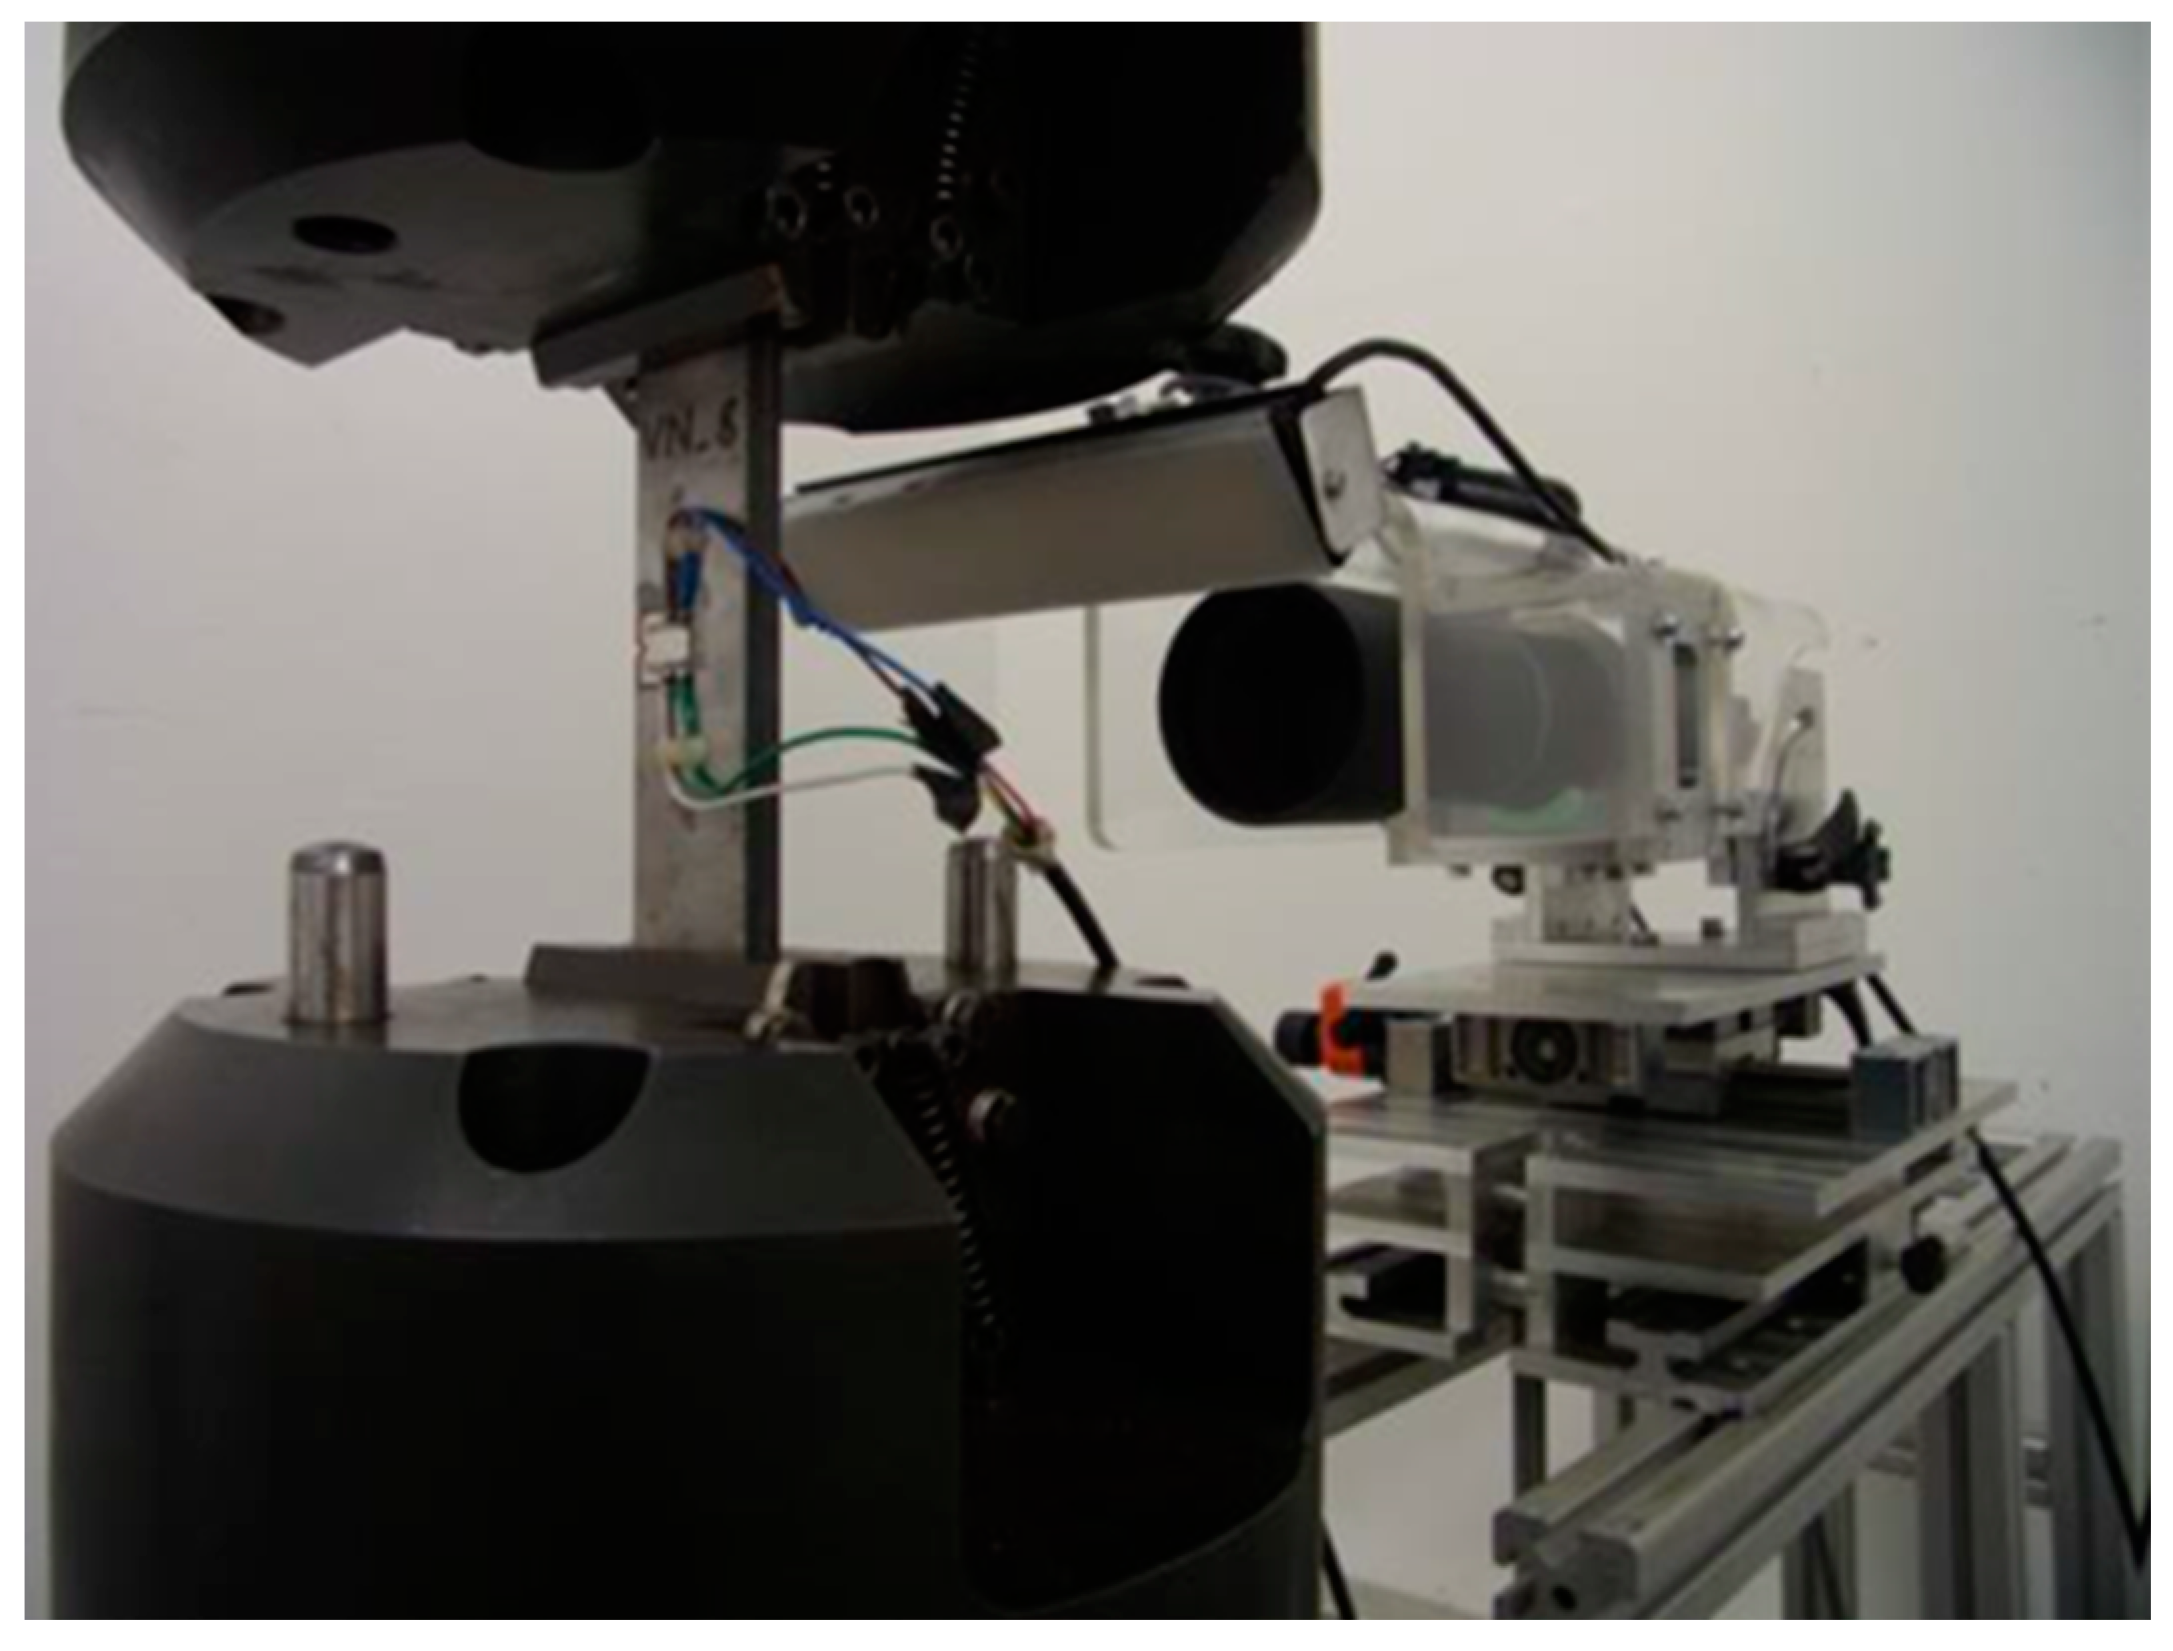
The traveling camera with a telecentric lenses trails the crack evolution in the test rig, suitable for a thin test piece. However, for a thicker specimen the surface observation is unreliable where the crack front tends to bend [
24]. The test rig is paused at an interval to take the best image quality. Crack gauge is applied directly on the specimen surface and the crack length is continuously measured during the test with constant current, and the resistance-based voltage drop is measured with the measurement of the change in resistance, resulting in correlation of the whole crack surface or area favouring crack propagation measurement in steel material. The fatigue test configuration is illustrated in
Figure 2 and both measurements were taken at opposite sides of the specimen. The crack measurement is amplified with a precision voltmeter for crack gauge of the RUMUL electromotive resonance machine. The measurement system is linked to the test machine to record crack length and number of load cycles simultaneously.
Fracture mechanics often plays a role in predicting components that are subject to time-dependent crack growth mechanisms. The SIF (K) is given by the following relation and non-dimensional function (
) is the effect of SENT geometry in Equation (2).
Based on the Paris law model for crack growth rate, Equation (3) describes the relationship of the rate of growth of a fatigue crack according to the load characteristic of the SIF around the crack front, which is a function of the range of stress intensity to accomplish the load cycle. Therefore, a linear approximation of the upper limit of the curve in a logarithmic scale for horizontal and vertical axes is plotted. The material constant (C) is the curve intercept with the da/dN axis, whereas m is the slope of the curve determined.
2.1. FCG Assessment of the Energy Release Rate with VCCT
In LEFM, the single scaling parameter is SIF (K) as the crack progresses in Equation (1) have been correlated with energy methods for stress function [
25]. The crack propagation for planar crack is possible once the energy released for unit width and length of fracture surface ∆a is proportional to the fracture toughness characteristics of the material as strain energy release rate, (G). The strain energy release rate range (∆G) is computed with VCCT using finite elements with the integration of the Paris law in Equation (4) using the fracture crack parameter (C and m) for crack growth simulation.
VCCT is a nodal release method which calculates the strain energy release rate (G) by calculating a force, area of surfaces created and a displacement. Nodes at interfaces are released when the G is high enough to propagate the crack. The energy balance can be expressed using (G) as a fracture criterion as crack starts to grow when it reaches the critical energy release rate value in Equation (5), where Π is the strain energy and ‘da’ is the change in crack length which depends on the geometry of the structure and the current loading.
Irwin described (G) as the result of crack extension which is correlated to the strain energy release rate based on the crack closure integral theory [
26]. The phenomenon has been for interface failure of stress components [
27,
28]. For 3D VCCT, the modified Irwin equation is Equation (6):
where (w
i) is the element length and (s) is the distance along the crack front, the distance between the crack tip and the point of surface crack is r, the distance of crack extension is Δa and the displacement in the y-direction is Δv during the crack extension when the normal stress (σ
y) is acting along the closed crack surface (line). The results of the node forces (F) ahead of the crack front and the node displacements behind the crack front for the i
th segment with contributions for elements on each side of the crack front. For mode 1 planar crack is estimated with node 8 element as describe by [
29] in Equation (7). The X and Z, respectively are the tangential (x-axis) and normal (z-axis) components of the nodal forces, while ∆u and ∆v are the corresponding relative displacement variation of the nodes.
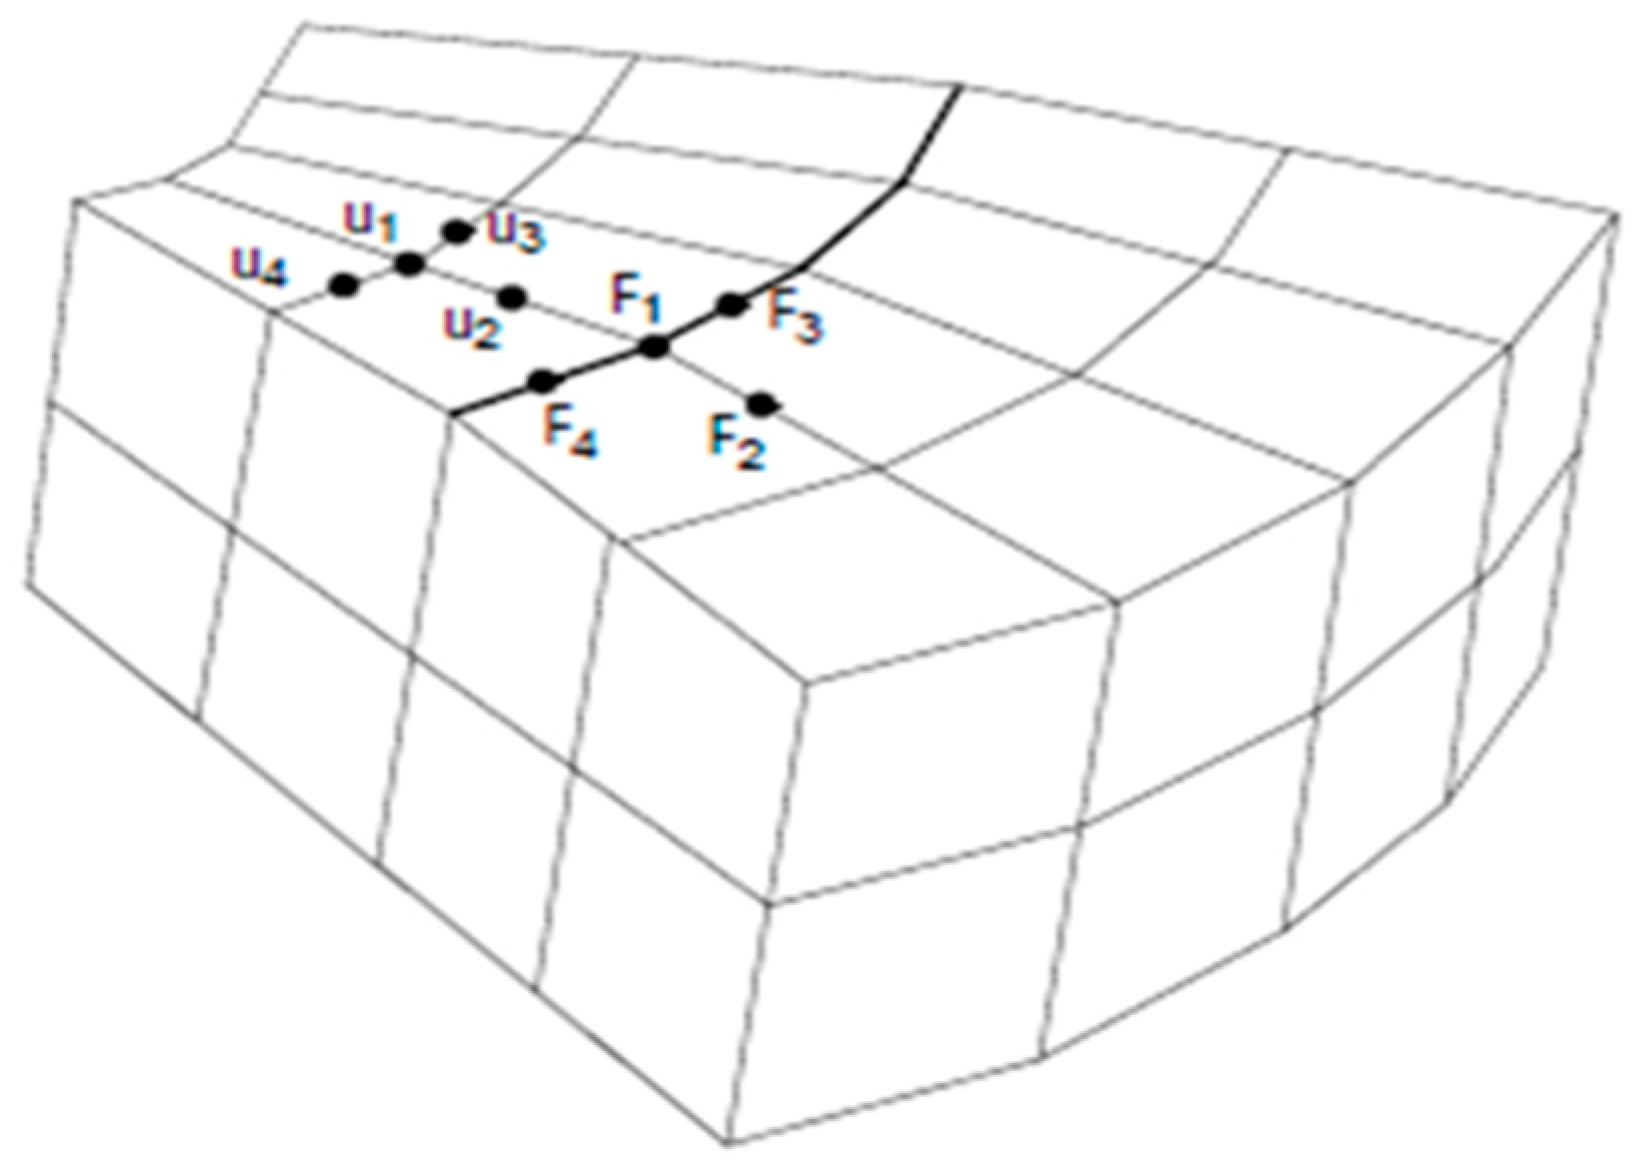
For 3D solid conditions, the evaluation is carried out separately for each node along the crack front of the model as illustrated in
Figure 3. u is crack opening displacement at crack face. For the case of higher-order elements, the contributions from the mid-side nodes included as the obtained strain energy release rate G
Imax and G
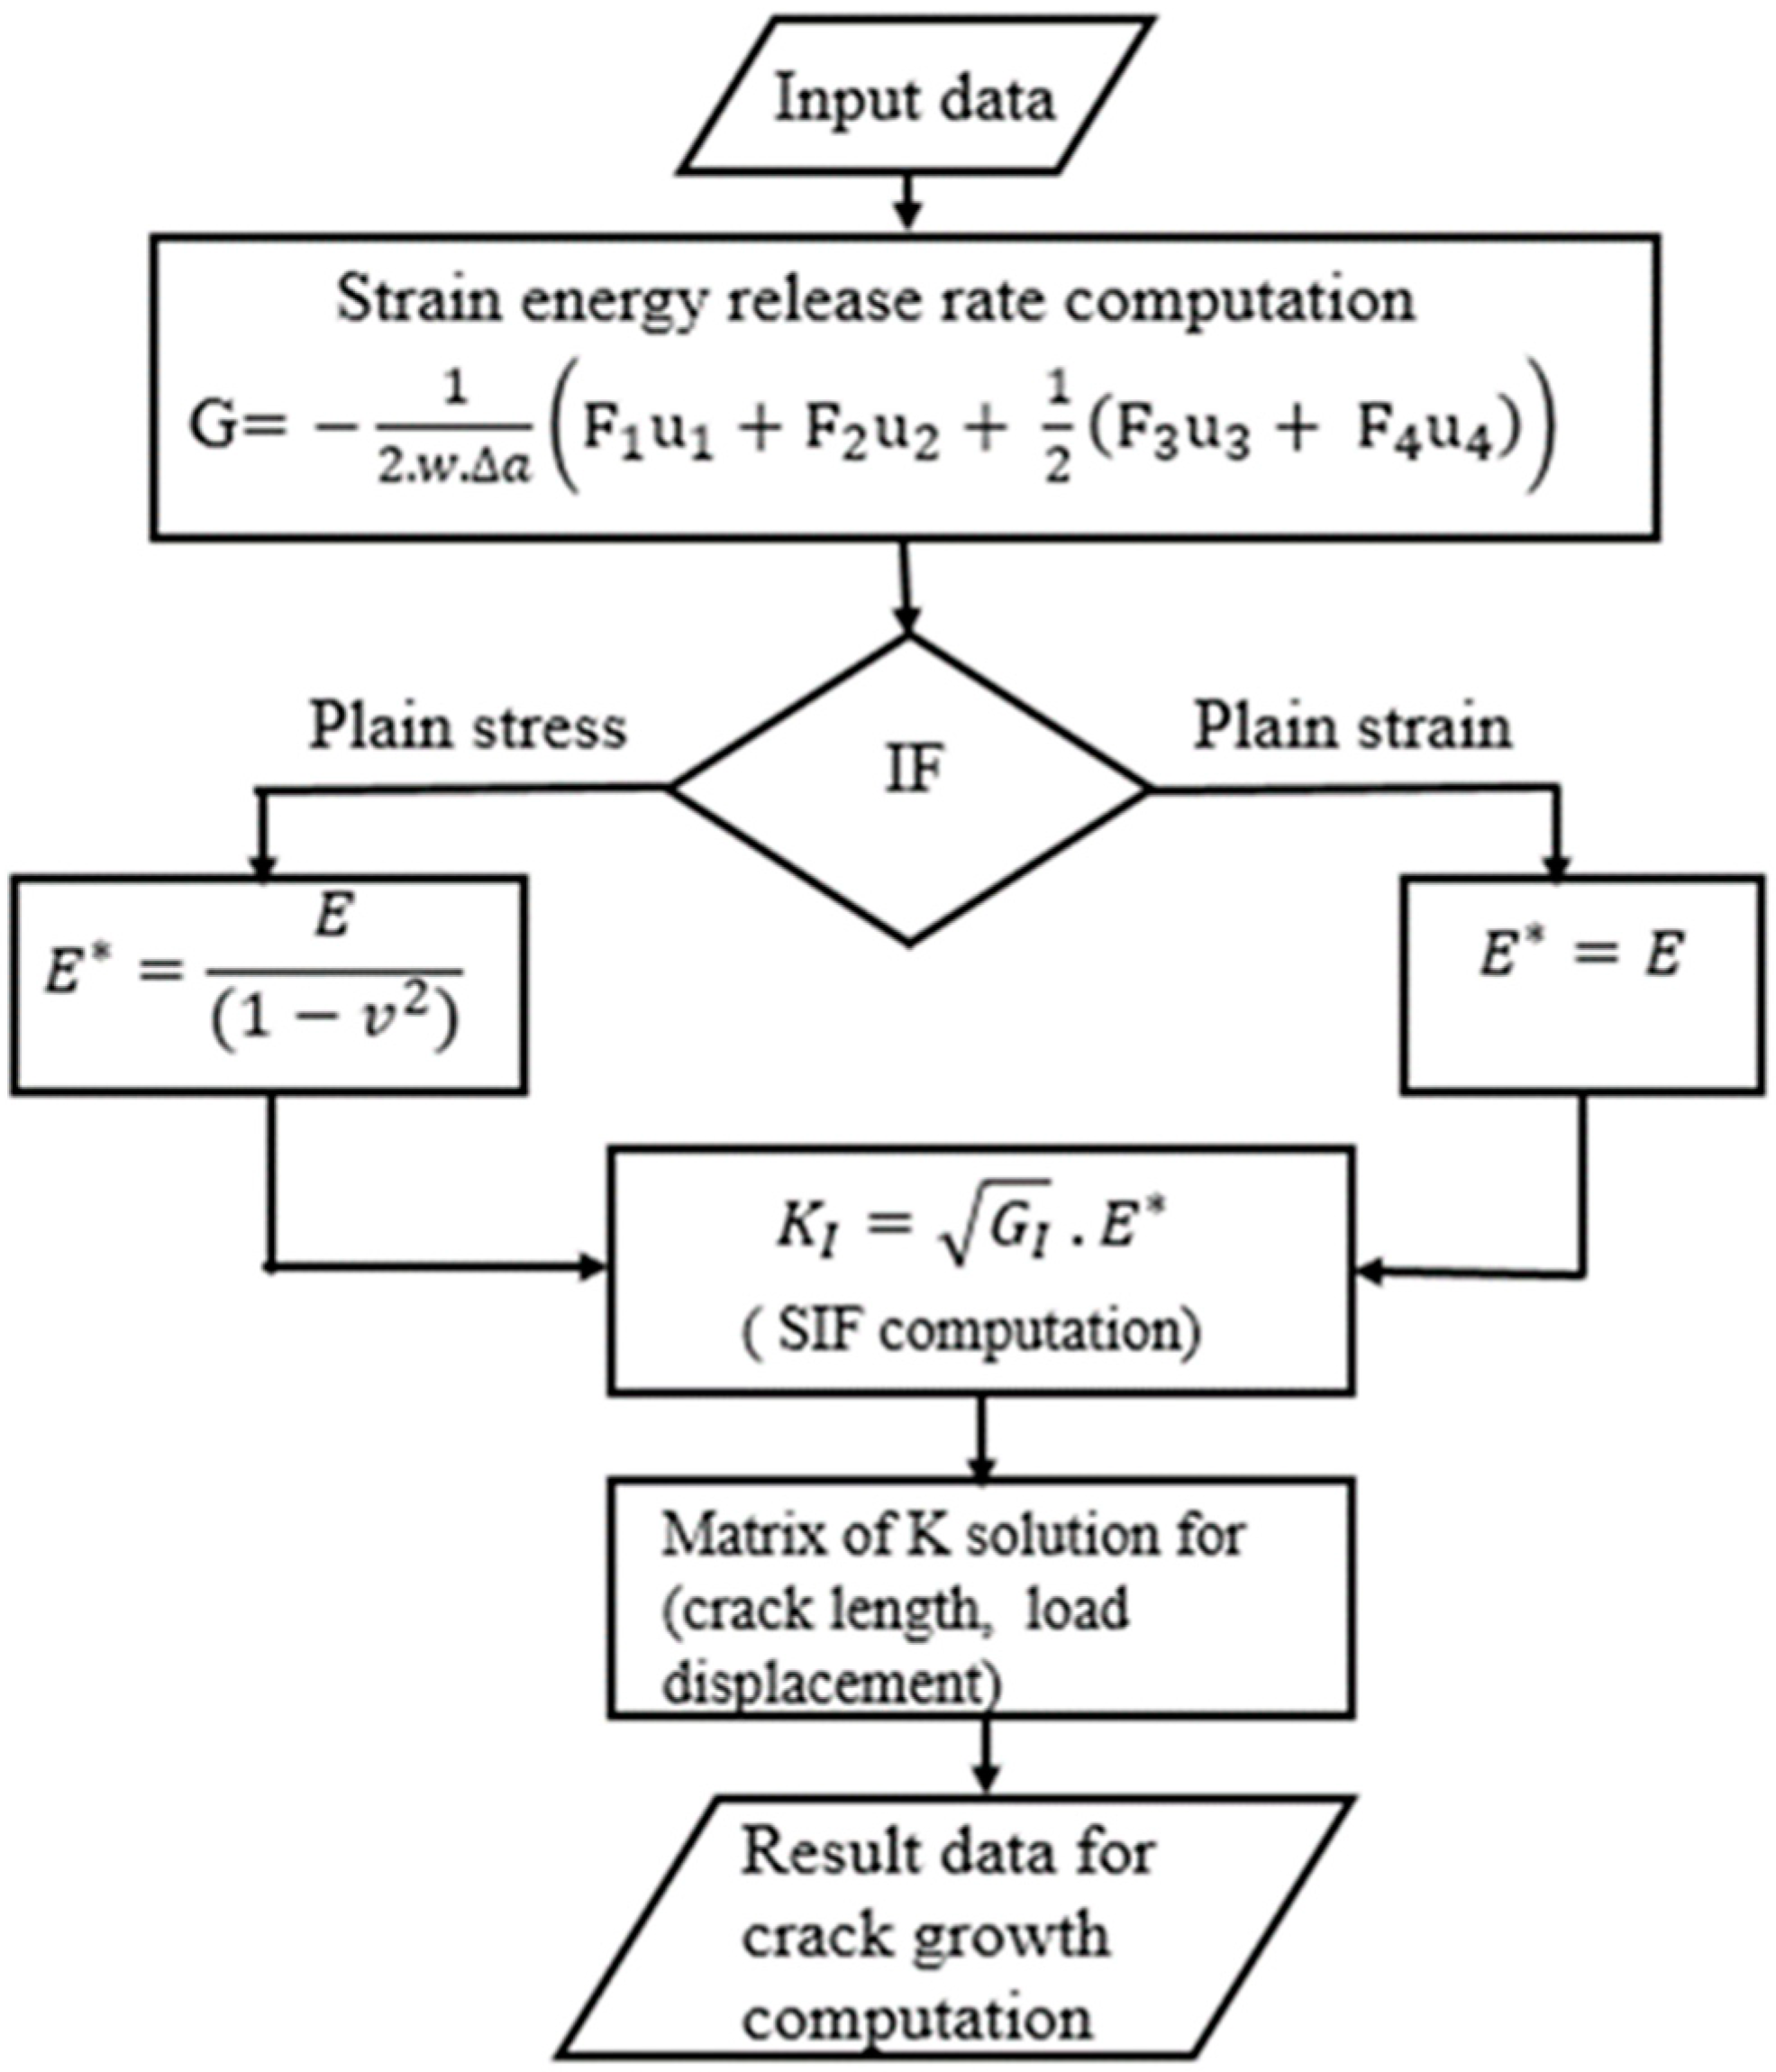
Imin in fatigue loading are calculated based on Equations (8) and (9). The simplified representation of the numerical procedure implemented in program VCCT for SIF based on energy release rate solver is illustrated
Figure 4.
The crucial procedure for FEM calculation of a crack component is considering nodes coordinates, elements, topology with a peculiar mesh generator for cracks, the material properties and loading condition implemented in the VCCT program of MSC Marc/Mentat with visualization of the input model. Most crack models are explicitly with stress or displacement fields near the crack front provided SIF (KI) or G can be determined through a number of algorithm steps. The incremental time step is followed in the FE analysis and post-processing of the specific analysis to determine crack growth rate.
2.1.1. Geometrical Modelling
The numerical assessment utilizes the mechanical properties in
Table 1 and the Paris coefficient material parameter obtained from the experiment as stated in
Table 2, respectively. The 3D finite element of SENT specimen in
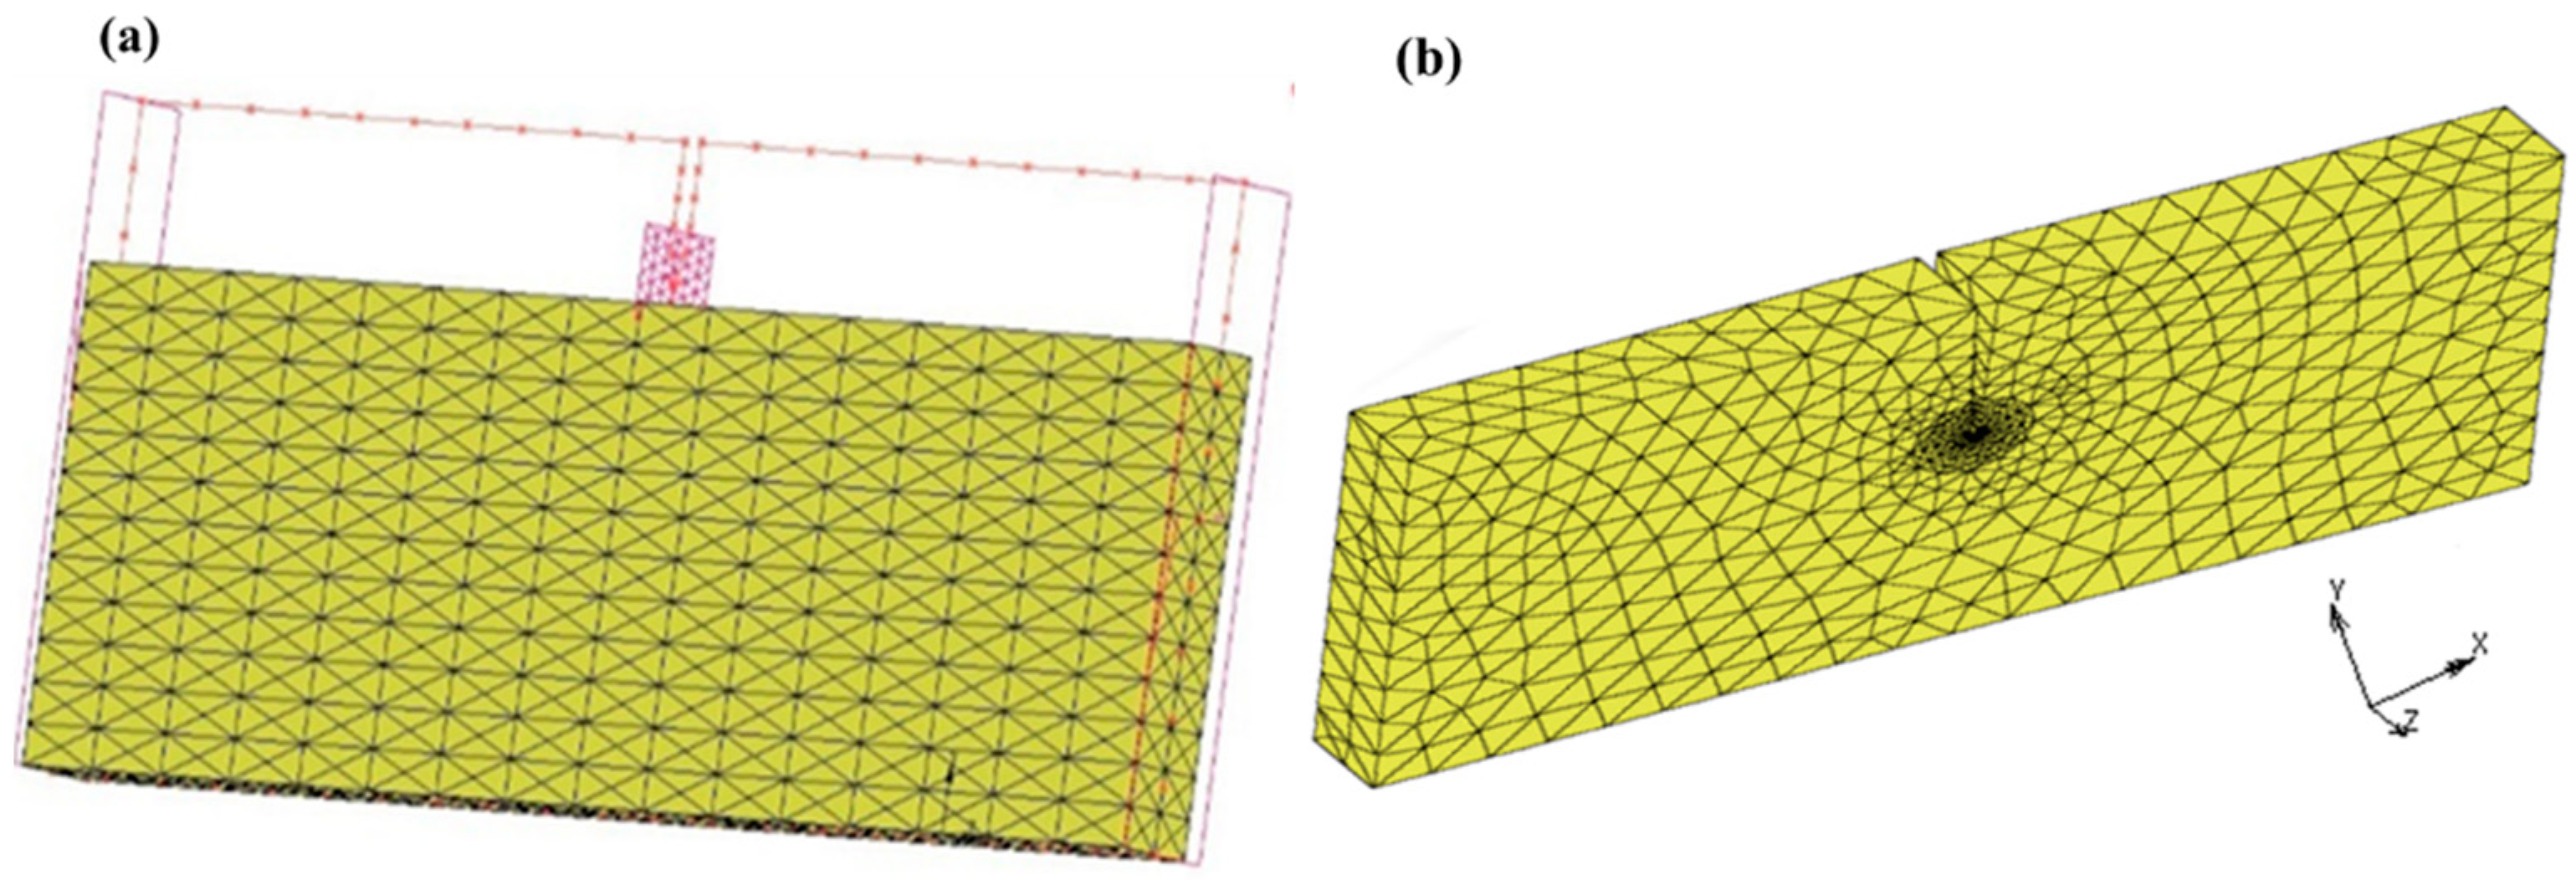
Figure 1 (left) for crack growth analysis is modelled using 72,000 elements and 24,558 nodes with tetrahedral meshing. One of the criteria to significantly enhance the accuracy of VCCT in FE analysis is to use higher-order elements. The geometry model was created using the characteristic size of 2 mm and subsequently discretized with patran-tetra remeshing type to increase the nodes since the solution of the governing equations is executed at the nodes in FE analysis.
The remeshing-based 3D tetrahedral solid element allows fully general crack paths and change in crack surfaces. The limitation is that the region where the crack is located must support global remeshing. The crack is defined by means of a faceted surface, which is basically a mesh made out of tetrahedral meshing. The actual crack is defined by the intersection of the faceted surface and the mesh illustrated in the clipped model in
Figure 5a. To overcome the singularity effect that occurs in a very small area along the element edges [
13]. The singularity in VCCT Marc automatically generates a special mapped mesh around the new crack fronts for good accuracy. The node along the crack front with the highest loading based on the specified growth increment while the other nodes will use the scaled down growth increment. A template crack with crack initiation and remeshing is used to estimate the crack growth in mode I, with the shape of the crack front.
Figure 5b shows adaptive remeshing with global remesh criteria assigned to the contact body with global patran-tetra properties, timing and location. The SENT model is defined as the contact body to be remeshed separately from the standard remeshing criteria of the faceted surface, as crack growth activates the automatic remeshing. For the elements in the crack surface extension due to growth, where all front nodes are growing the same amount. The part of the crack surface which is inside the surface mesh will eventually form the new updated crack front.
2.1.2. Boundary Condition
The experimental conditions are closely replicated for the FEM boundary conditions. One end is restricted for all degrees of freedom in displacement and rotation, respectively (x = y = z = 0). The other end is controlled by fixed displacement in two directions (y = z = 0), while load depends on load ratio R = 0 and R = 0.1 along the x-direction with the sine-based cyclic load table generated from the time-independent variable function in the simulation. The fatigue time period is taken into account when defining the table for the load variation. The load stress of 62.5, 100 and 150 MPa is applied at various stages of the computation.
2.1.3. Mesh Sensitivity Analysis
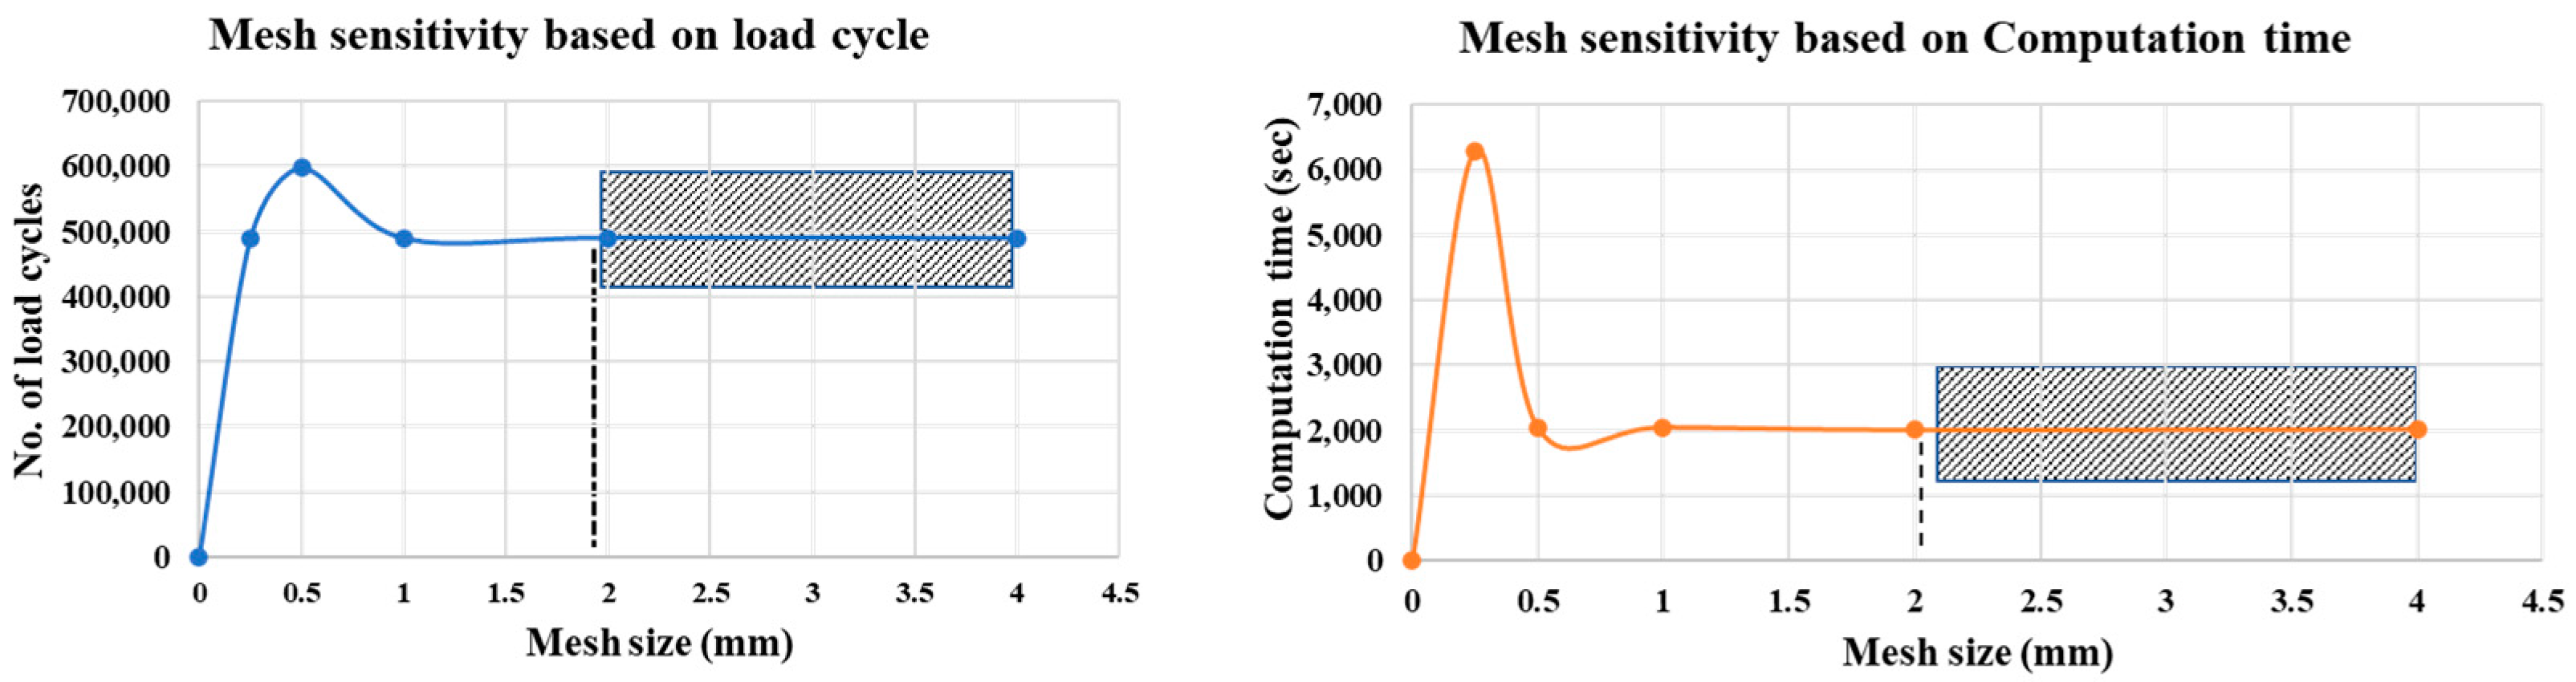
Fatigue crack growth simulations were performed with varying levels of mesh refinement in an attempt to verify the FEM crack propagation analysis as the accuracy strongly relies on the minimum element size around the crack tip; therefore, the computational cost compared to the error level based on mesh size is somewhat a trade-off [
30,
31]. In the analysis, for comparison purposes, the same tests are also carried out for the 3D solid FEM model by creating a batch file (.bat) coding in MSC Marc/Mentat. The script enables multiple meshes to run with less computer memory consumption. A direct solver is used for the solving process to run the solid mechanic computation with a multi-frontal parallel sparse algorithm.
The software-running environment is 12-GB RAM, CPU 3.10 GHz, and Intel-i5 processors. Firstly, multiple files with different mesh size/number of elements are created to verify the mesh size dependency on the crack propagation rate and the corresponding number of load cycles. The analysis in
Figure 6 determines the choice of 2 mm mesh size. Secondly, the crack front radius is determined from a distance between nodes along the front [
20]. Because of the complicated stress field singularity along the crack front, a compact mesh must be produced and regenerated as the crack grows [
32]. The adaptive remeshing (in this case, the faceted surface in simulation software) with initial quarter-point element behaviour is computed with 2 mm. The broken line indicates the adopted mesh size within the numerical FE analysis.
3. Results and Discussion
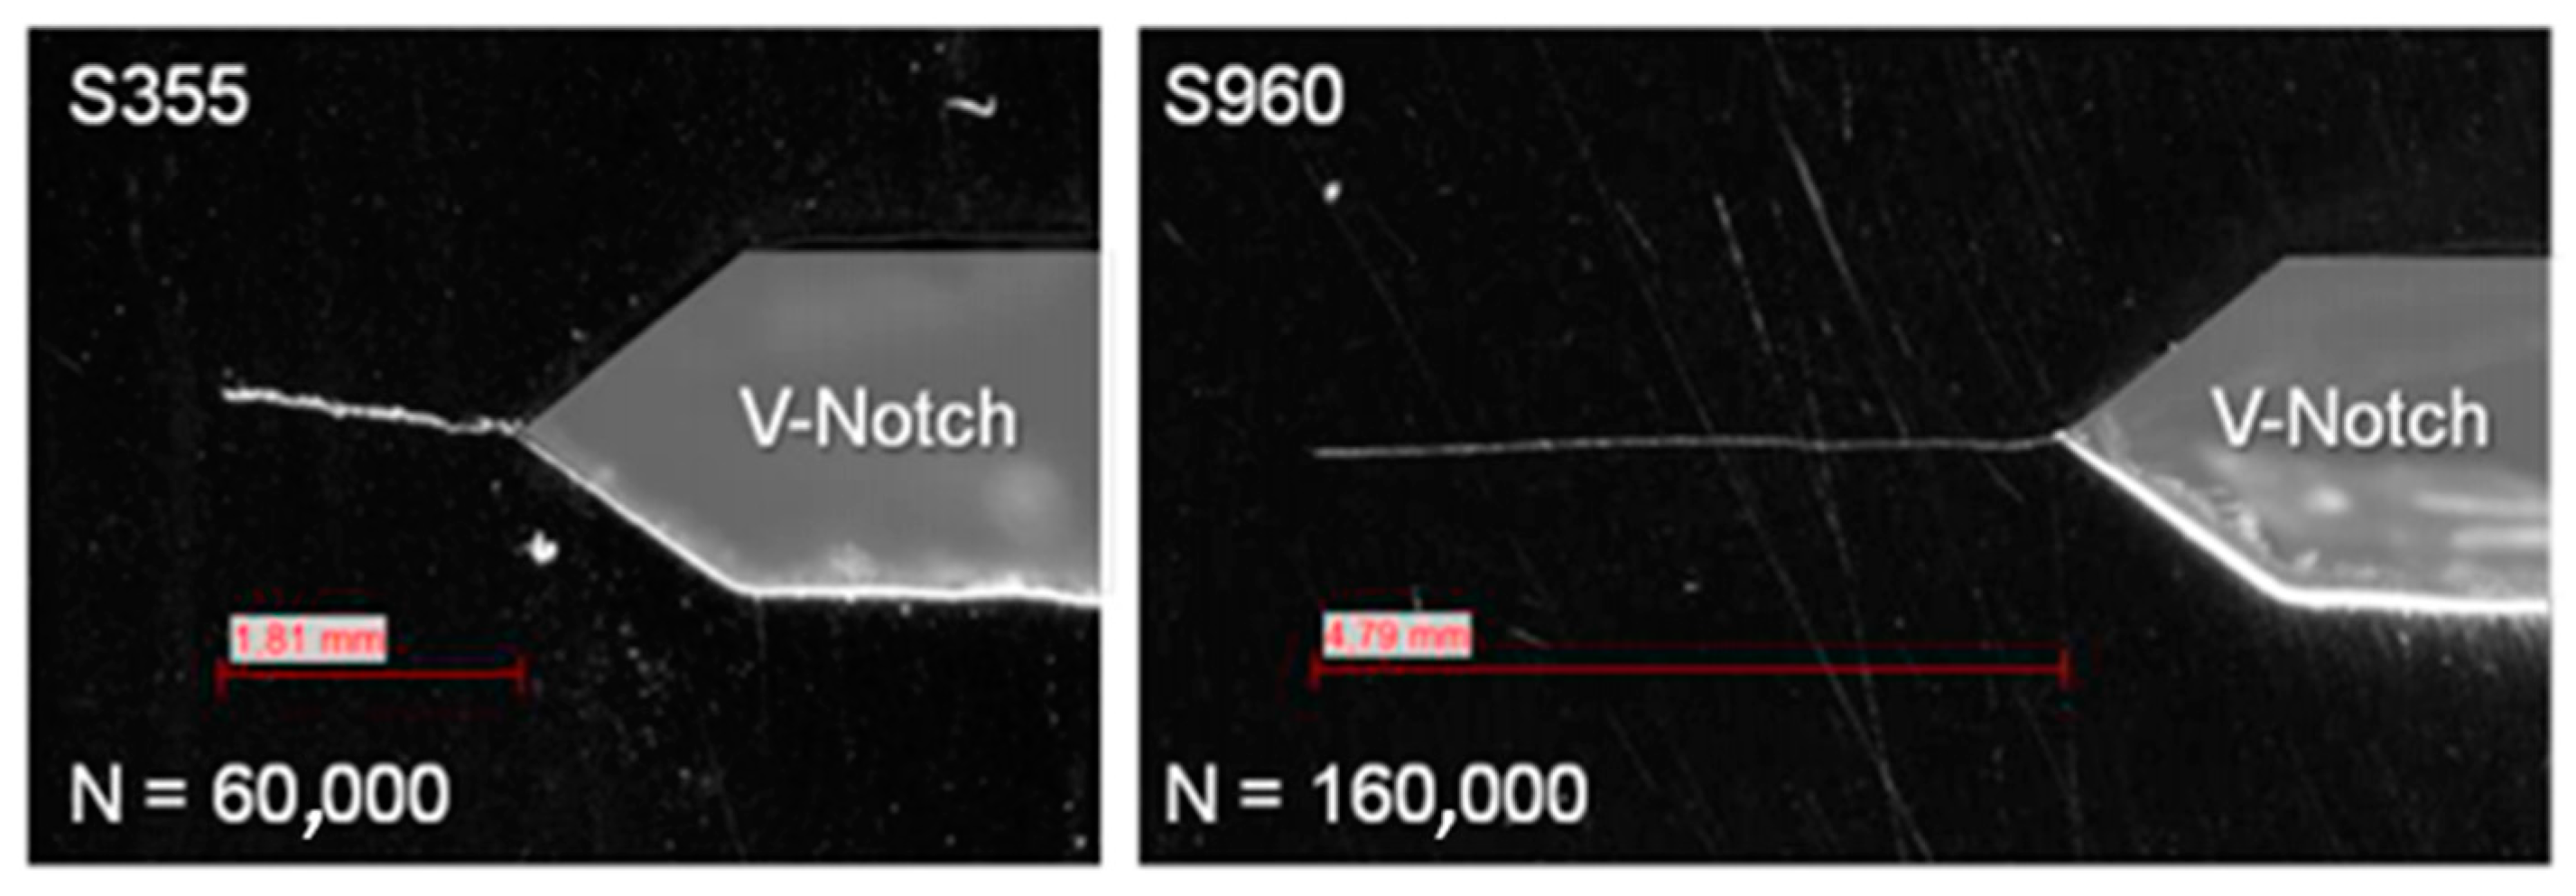
The crack growth rate for the processing of experimental data, a method based on an incremental polynomial method was used. The test rig is paused at an interval of 10,000 cycles to take the optical measurement and the crack notch was taken as the datum, the final dimension is illustrated in
Figure 7. The crack length of the specimen was verified alongside load cycles in
Figure 8, for the S355 and S960 for the crack gauge and optical measurement, respectively. Both methods of measurement evaluation agree with the fatigue crack growth rate performed according to ASTM E647. The slight deviation in both techniques could be attributed to the little asymmetric crack growth on the opposite side of the specimen.
The FCGR (da/dN) plotted as a function SIF range obtained from the experiment is illustrated in
Figure 9 which characterizes the resistance of a material to the stable crack extension under cyclic loading. From the values of ∆K, there is a slight difference observed between the S355 and S960 steel. However, the gap between this crack growth rate is faster in S960 when ∆K values increases.
The regression analysis method of the effective da/dN vs. ∆K data of the specimens is implemented under the defined stress ratio. The mean values of m and C are calculated. The characteristic of the FCGR parameters in terms of the Paris theory in Equation (3) is presented in
Table 2 for each independent steel specimens. More so, the S960 steel has a greater value of C and a slightly lesser m value than the S355 steel specimen during the stable region of the crack growth.
VCCT-Based Fatigue Crack Growth
The consequence of crack extension (G) during the fracture per unit process of a newly created fracture surface is implemented in the FE computation of field variable at the nodes to approximate the values of the interior element by interpolation of nodal values. The element edge alignment with the crack in the finite element method analysis provides vital benefits in the numerical modelling of crack propagation with constant amplitude, high cycle fatigue. The analysis is run for the same increments after the unloading step has to crack through the thickness.
Figure 10 presents the distribution of stress in terms of the von Mises and deformation shape in the FE model for symmetrically loaded crack configurations with sharp crack. Furthermore, the anticipated small-scale yield elastic singularity governed by stresses at distances from the notch tip characterise the condition in which linear elastic SIFs form a valuable measure of the intensity of the surrounding elastic field.
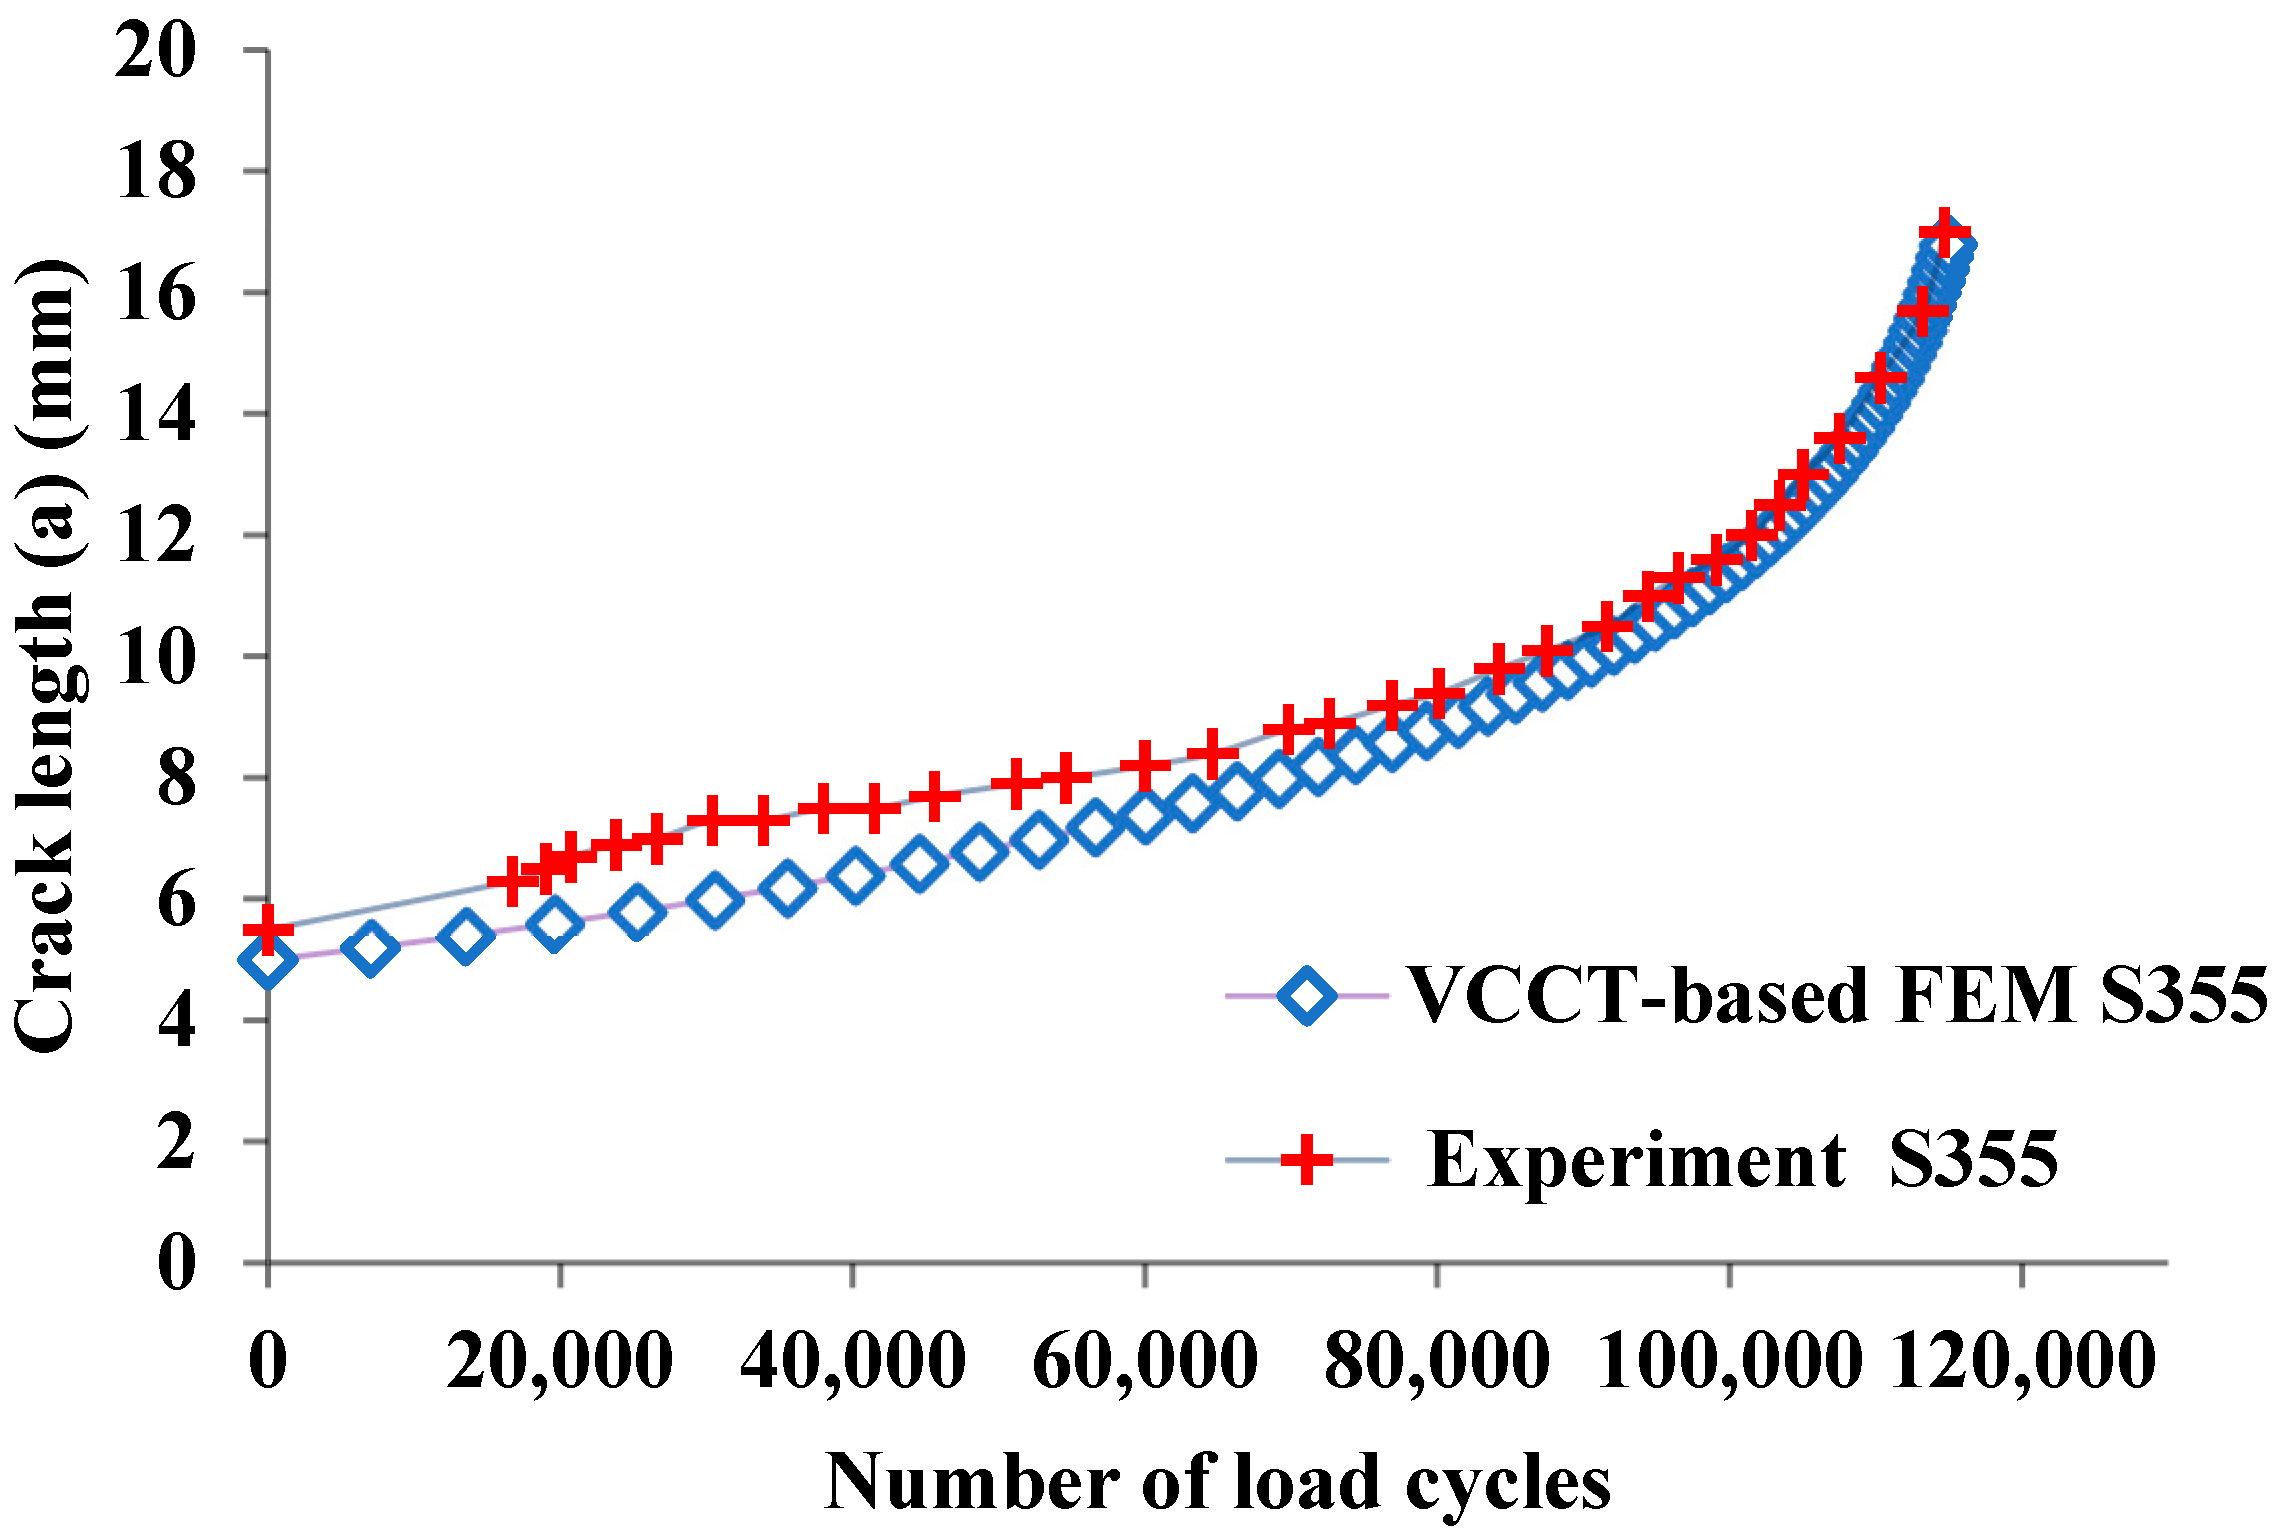
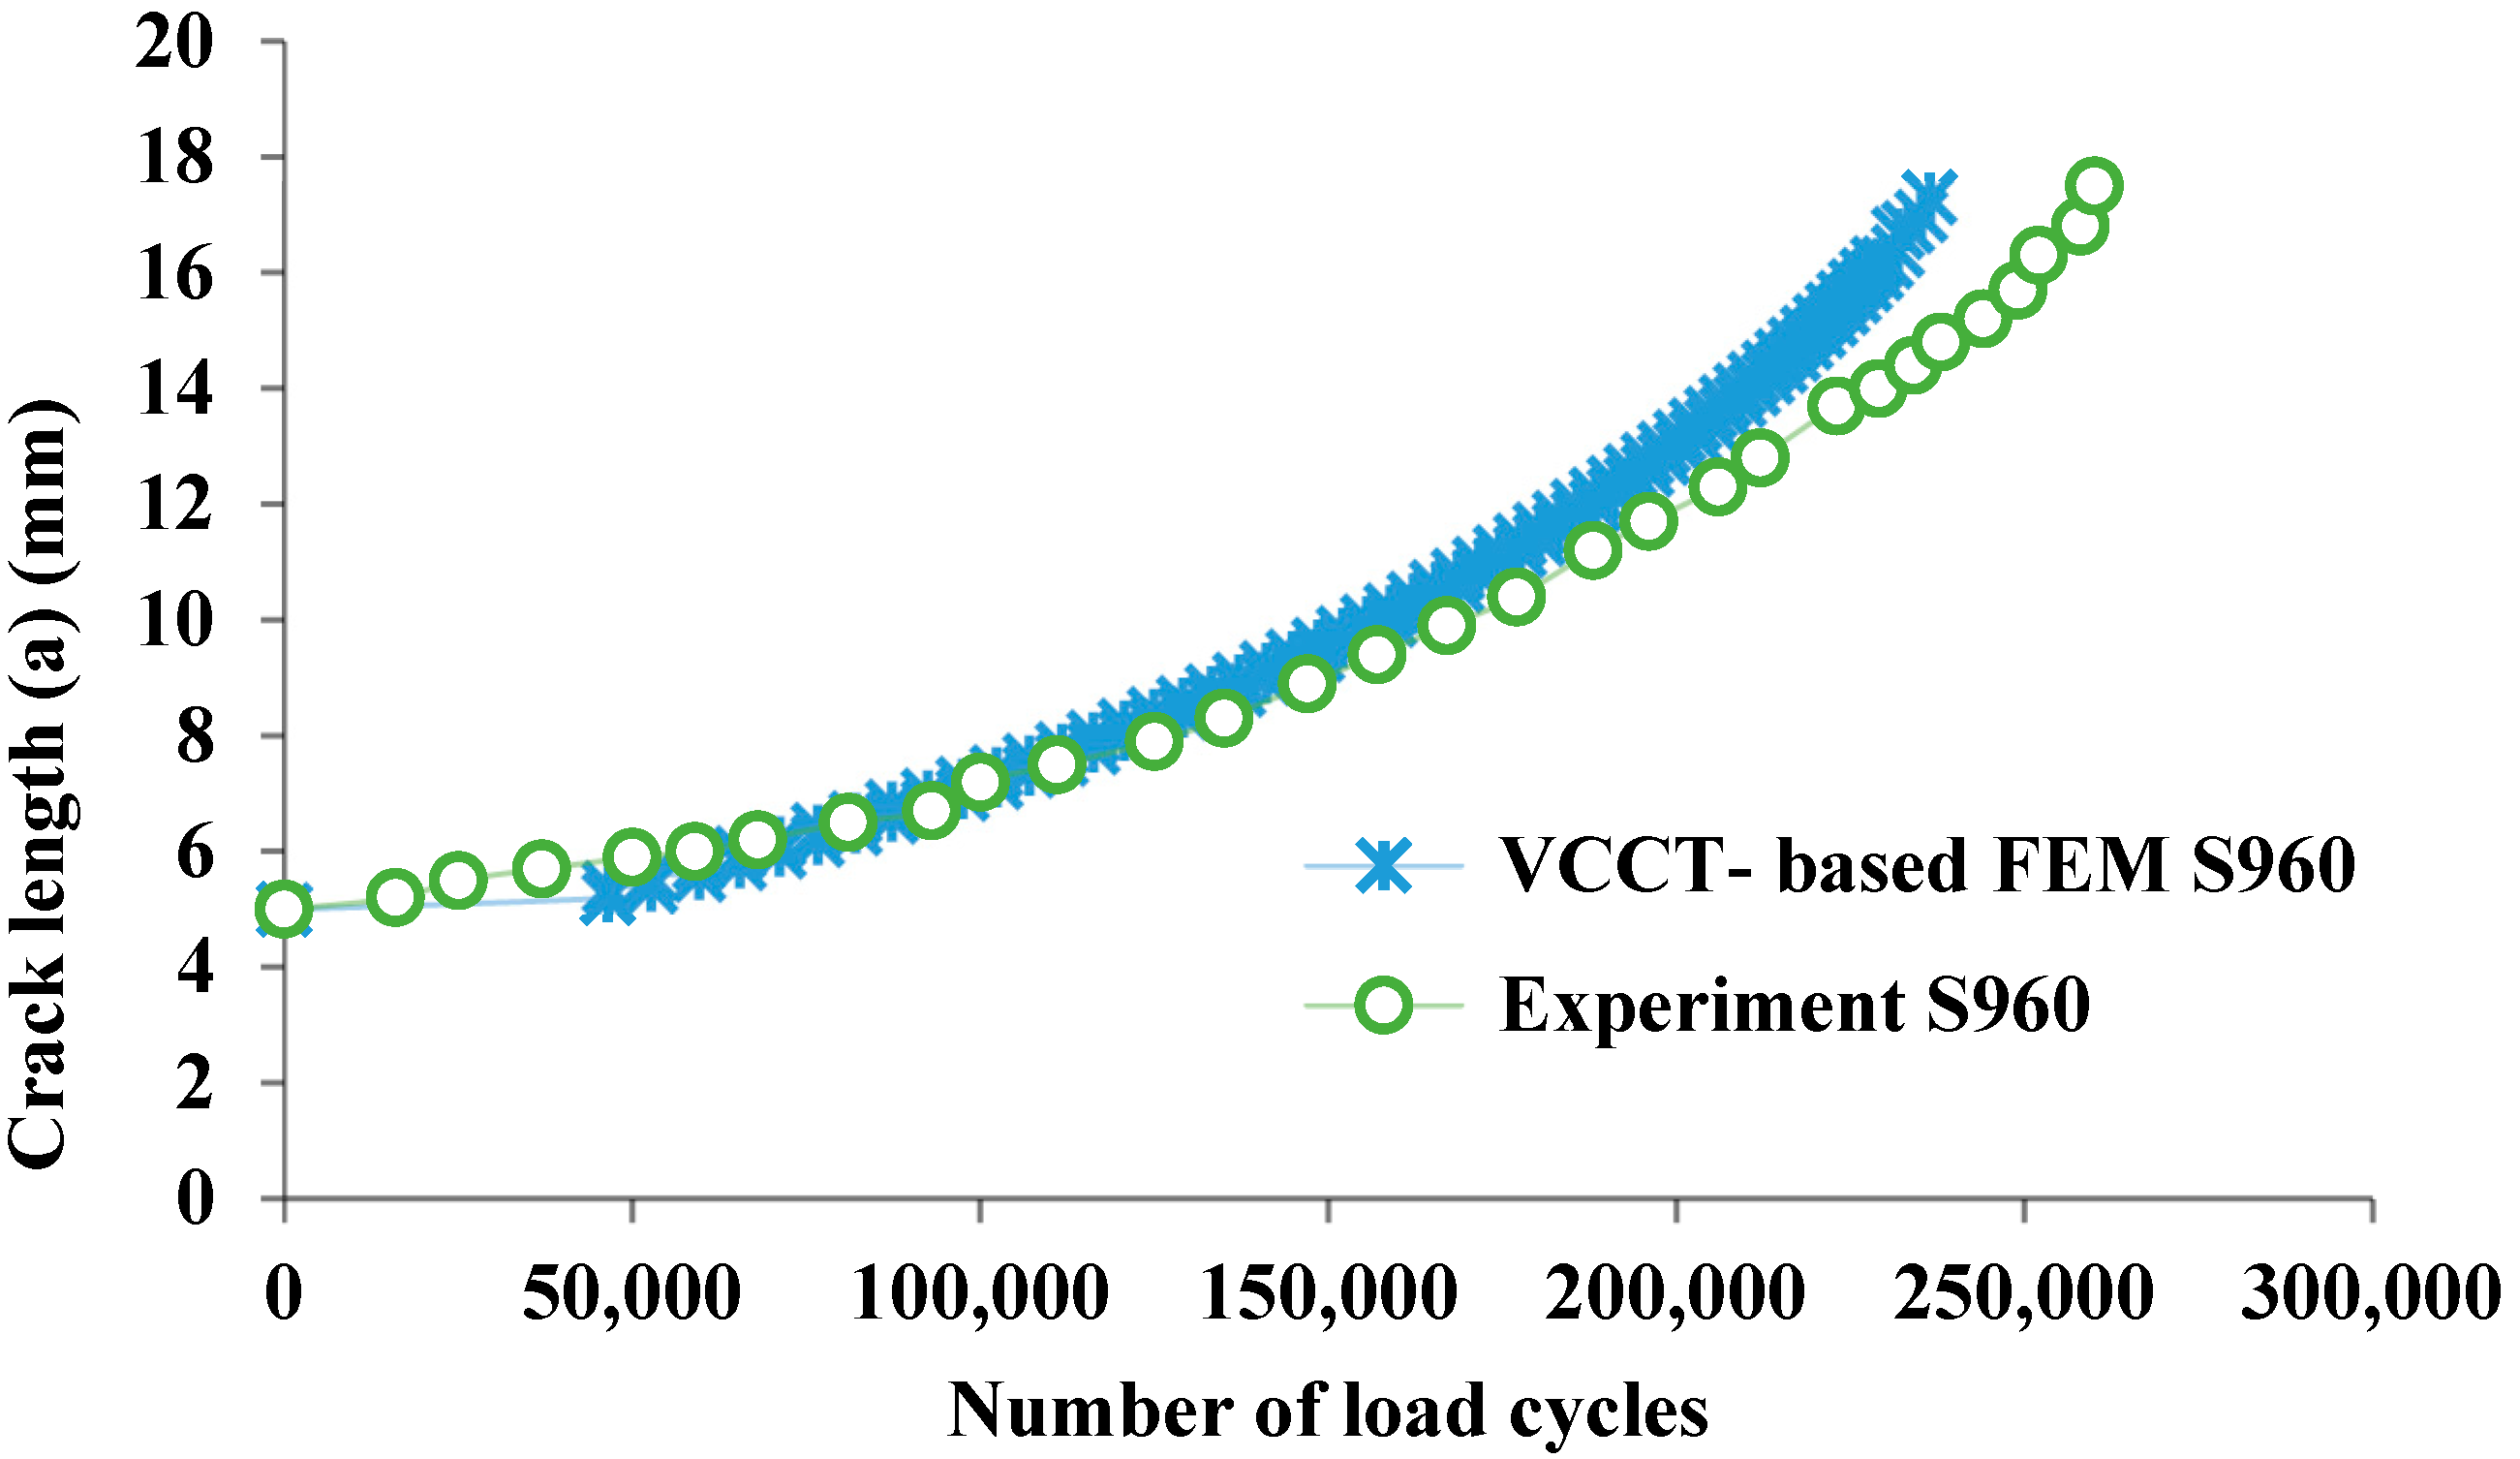
Calculation from the test starts after initial crack length and the crack growth increment of 0.2 mm as recommended by IIW [
33]. The post-processing results for the cycle count are obtained from the simulation. The crack growth curve at stress ratio R = 0 for S355 with 150 MPa and 100 MPa was applied for S960 steel, the comparison of the results with the experiment is presented in
Figure 11 and
Figure 12, respectively.
Table 3 depicts the percentage error based on the load cycle at a crack length of 17 mm of both the experimental and numerical results. The FCG based on the strain energy release rate for VCCT presents a better performance close to the experiment value of load cycle with corresponding crack trend in S355 steel than that of the S960 steel. Although, fracture mechanics is more explicit, which is accomplished with a crack growth test with pre-cracked standard specimens to get the crack behaviour. However, other material qualities such as yield strength, tensile strength, and modulus of elasticity may have an influence on metal fatigue strength.
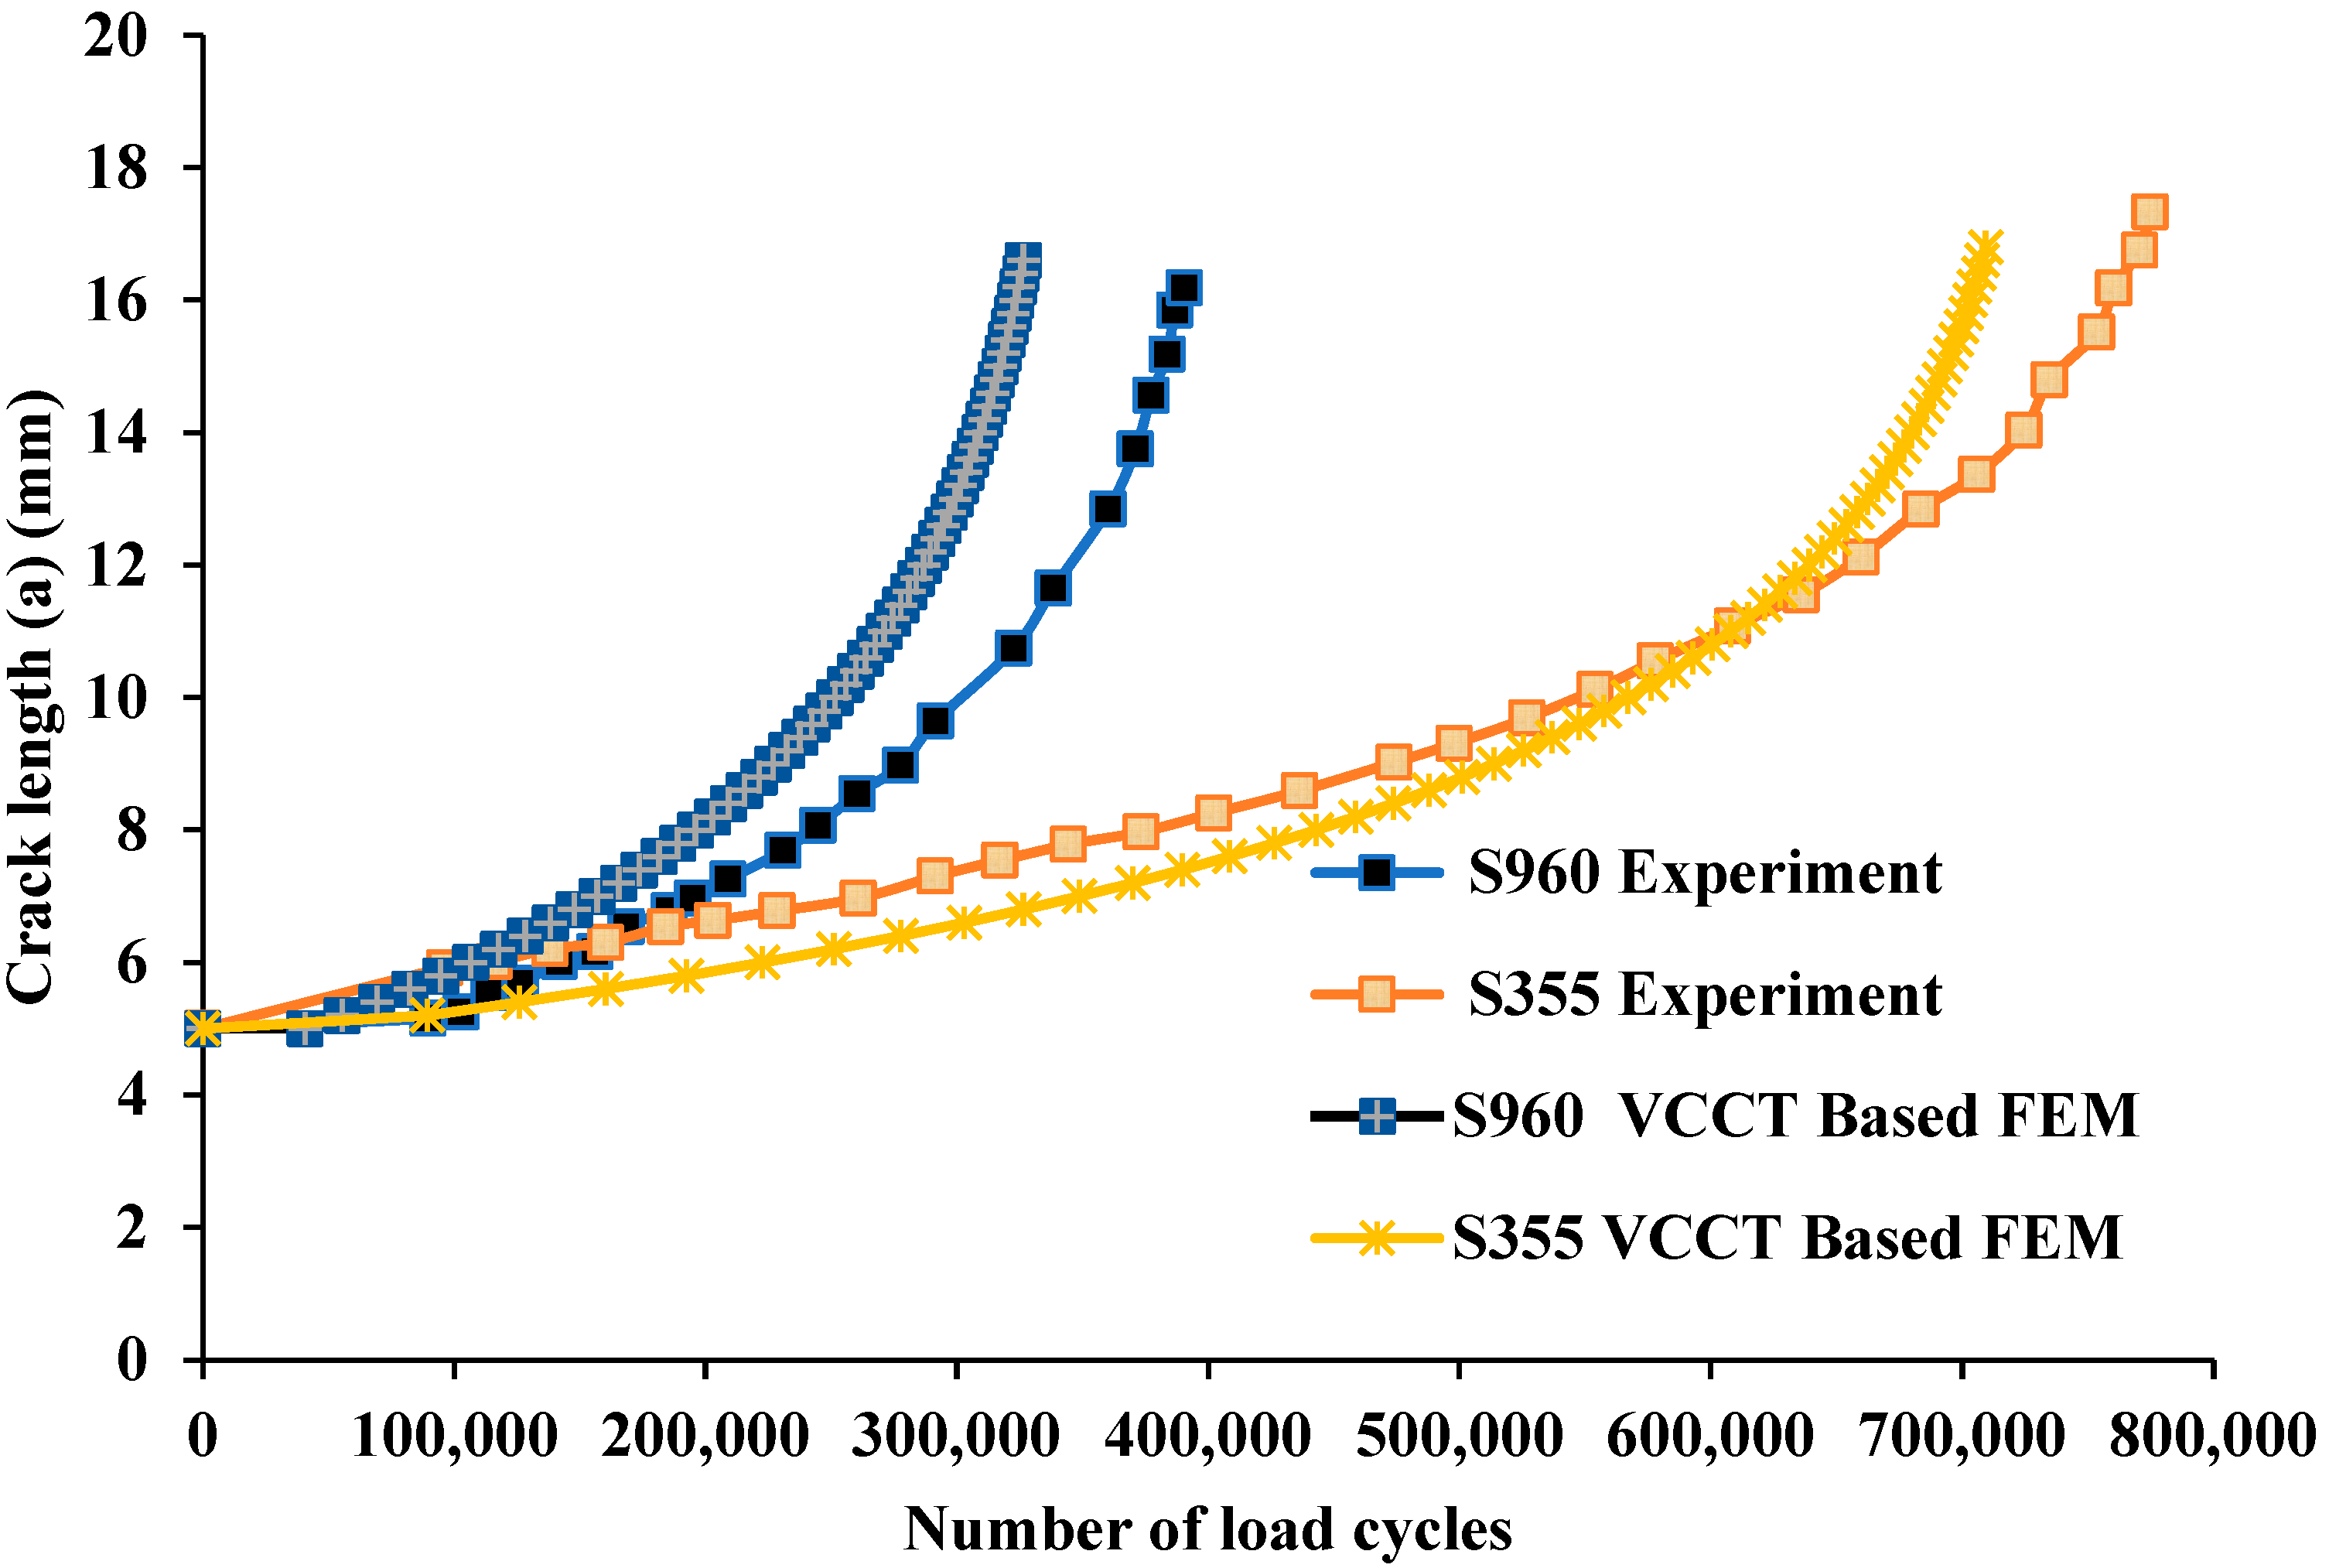
The value of the stress ratio R has a very strong effect on the crack growth rate, the simulation of 3D FEM model with a stress ratio R = 0.1 and applied CAL of 62.5 MPa for S355 and S960 steel performed. The predicted crack length plot as a function of load cycle counts is presented in
Figure 13. Furthermore,
Table 4 displays the percentage error based on the number of load cycles at the crack length of 17 mm for both steels.
Although the steel properties are quite different, many works of literature dealt with the effect of fatigue crack properties of very high strength steels. The fatigue crack initiation stage of high-strength low alloys steel such as S960 withstands a longer load cycle. This was the reason why steel S960 performed at 100 MPa and 150 MPa is applied for S355 steel. Hence, the computation shows a faster crack propagation rate in the case of the S960 steel [
34,
35]. However, the fatigue crack resulted in exponential growth between the steels compared with the same stress ratios. Furthermore, comparing the effects of the stress ratio in the predicted fatigue crack propagation of both sheets of steel. The VCCT can explain this increase in fatigue crack propagation rate using the similarity concept. Overall, these results indicate that the adaptive remeshing strategy with VCCT in MSC Marc/Mentat is capable of the conservative prediction of fatigue crack propagation.


 ,
, 


