Article

Eco-Geophysical and Geoecological Factors in Assessing the State of the Geological Environment Based on the Analysis of Spatial Databases of the Territory of the Republic of North Ossetia–Alania

Geophysical Institute of Vladikavkaz Scientific Centre, Russian Academy of Sciences, 362002 Vladikavkaz, Russia
*
Author to whom correspondence should be addressed.
Submission received: 3 February 2022 / Revised: 25 February 2022 / Accepted: 2 March 2022 / Published: 3 March 2022
(This article belongs to the Collection Geoinformatics and Data Mining in Earth Sciences)

Abstract

:
The article considers the main sources of pollutionin the territory of the Republic of North Ossetia–Alania. A study of environmental geophysical factors in the city of Vladikavkaz was carried out at 126 points; indicators of noise pollution, electric fields and the level of gamma radiation were measured. A geoaccumulation index of heavy metals in soils and indices of carcinogenic and non-carcinogenic risks were calculated and corresponding maps were constructed. The obtained data supporting a high level of carcinogenic risk are consistent with a high level of cancer morbidity in the city, which indicates a close relationship between morbidity and the carcinogenic risk index. It has been determined that emissions from road transport are greater by an order of magnitude than stationary sources emissions, while there is a steady trend towards an increase in air pollution as a result of the increasing negative impact of motor vehicle emissions. It has been established that the most hazardous way for heavy metals to enter the human body from the soil is by inhalation. It has been determined that in areas where environmental pollution with heavy metals is higher, cancer morbidity is also higher.

1. Introduction

Environmental pollution has become a global problem due to the growing anthropogenic impact. It should be noted that almost all types of natural phenomena and processes of a geological, hydrogeological, and meteorological nature are sources of risk [1]. We have developed a scheme of the main sources of environmental pollution for the territory of the Republic of North Ossetia–Alania (Figure 1). The main sources of pollution are discussed in detail below.
Noise pollution is one of the three most significant environmental disturbances in the world. With the growth of urbanization, noise has become a permanent part of human life and one of the essential parametric pollutants of the urban environment. The problem of protection of the population against increased noise is, first of all, a problem of health maintenance [2]. Acoustic pollution worldwide constitutes about 70–75% of all environmental pollution. Noise pollution leads to increased fatigability in humans and animals, a decrease in labor productivity, as well as physical and nervous diseases [3,4,5,6,7]. One of the main environmental problems in cities is noise pollution from road transport, which largely determines the quality of life of the population [8]. Noise pollution is assessed by the following parameters: sound level, loudness, vibration, and sound pressure [9,10].
Every person, regardless of location, is constantly exposed to various doses of radiation [11]. Radiation pollution of the environment comes from sources of both terrestrial and cosmic origin. Radiation of terrestrial origin is caused by the decomposition of uranium 235 and 238, thorium 232, and potassium 40 [11]. The extraterrene component is caused by cosmic rays, and the magnitude of this radiation depends on altitude, latitude, and the solar cycle [12]. The terrestrial component is associated with the geological structure and features of the environment [13]. In addition to natural sources of background radiation, anthropogenic activities, such as the survey and exploitation of natural resources (leading in some cases to a significant increase in the radiation impact on the population [14]), also make a significant contribution [15,16,17,18,19].
According to a number of modern studies, there are concerns that magnetic fields can affect the health of the population. The possibility of such an effect has provoked a serious scientific dispute and drawn attention among the population exposed to radiation [20,21,22,23,24,25,26,27,28,29,30,31,32]. Since 1998, studies have provided evidence that power-frequency electromagnetic fields have adverse biological effects on children’s health, in particular, in carcinogenesis due to electric and magnetic fields exposure in residential premises [21,22] and cancer among children consequent onparental exposure [23],as well asoccupational cancer diseases, including leukemia, brain cancer, and breast cancer [24]. Some research data on the effects of electromagnetic fields on the human body also indicate an increased risk of miscarriage [25], neurodegenerative diseases, such as amyotrophic lateral sclerosis and Alzheimer’s disease [26], heart disease [27], and suicide [28].
Information on outdoor background field strength in urban areas may be of interest because there is no data on the magnitude of magnetic radiation when the greater part of the population is exposed to significant levels over long periods. It was the lack of information about electromagnetic fields in the urbanized territories of the Republic of North Ossetia–Alania that prompted the present study, the purpose of which is to construct maps of the magnetic and electric fields.
In the areas where mining and processing enterprises are located, one of the main sources of disturbance and pollution of the components of the natural environment are solid mineral waste storage facilities (the total mass of waste materials in the Russian Federation reaches more than 20 billion tons). This causes the deterioration of sanitary and hygienic conditions, the emergence of areas of increased soil pollution, and surface and groundwater pollution, which leads to the continuous transformation of natural landscapes into man-made landscapes and hence to the loss of natural resources [33].
The greatest harm is caused by dusty manmade deposits—dumps of products of the imperfect technology used for the processing of non-ferrous metal ores, rock dumps and dumps of substandard ores containing hazardous concentrations of free silica (SiO2), and toxic metals in the airborne dust (Cu, Zn, Pb, Ni), causing air pollution and the destruction of organisms. This situation has developed in the mountainous provinces of the North Caucasus, which has a high concentration of mining and metallurgical industry facilities and social infrastructures [34].
More than 30 enterprises are located in the industrial hub of the city of Vladikavkaz. Their activities are in one way or another connected with air pollution. The largest enterprise in the Republic was OJSC “Electrozinc”, which has been actively polluting the environment throughout the years of its existence [35,36,37]. At the end of 2016, by agreement of the leadership of the Republic and OJSC “Electrozinc”, the environmentally harmful lead production was terminated. At the time of writing, OJSC “Electrozinc” is in a stand-by condition [38].
A large number of air pollutants with various toxicities enter the environment during the movement or operation of road transport. Pollutants enter the environment from vehicles equipped with internal combustion engines as well as their elements (brakes, clutch discs, tires, and fuel tanks), and, in addition, from wear to road surfaces.
The level of air pollution varies over time and space depending on various features, such as proximity to roads, vehicle fleet composition, traffic flow, and the presence of other sources of pollution. Modern works investigate the spatial distribution of pollution based on geoinformation technologies [39,40]. Pollution by particulate matter contained in waste gases may be the largest potential threat to public health [41]. Numerous studies indicate that some diseases are directly related to the levels of air pollution caused by large amountsof road transport [42,43,44,45,46].

2. Methods

2.1. Methods for Map Construction Based on Spatial Databases

Pollutant concentrations can vary greatly across the surface of the earth, so it is very difficult to obtain an accurate spatial distribution of heavy metals. The presence of a certain proportion of samples that exceed the established regulatory threshold has been a classic method of characterizing the degree of soil contamination [47,48]. However, the classical estimation method has many limitations whichprobably cause errors or uncertainties in pollution assessments.
The classical statistical method usually requires that data be subject to a number of assumptions: independence of observations, exact or approximate normality of observations, and large and repeated sampling. Mapping the spatial distribution of pollutants requires the use of spatial interpolation methods. The most commonly used interpolation methods are inverse distance weighting (IDW), kriging, and spline.
Interpolation accuracy is related to the precise definition of the polluted area and its boundaries. Consequently, this directly affects the accuracy of pollution assessment. There have been many studies of the performance of the spatial interpolation methods mentioned above, but the results are not clear-cut [49]. Some of them found that the kriging method performed better than IDW [50], while others showed that kriging is no better than alternative methods [51].
The first considered interpolation method of kriging is based on the assumption that the interpolated parameter can be considered as a regionalized variable. As with IDW, the kriging estimation is given by a linear combination of the observed values with weights. Depending on the stochastic properties of random fields, different types of kriging are applied. The type of kriging defines the linear constraint on weights implied by the unbiased condition. There are several types of kriging, including simple kriging, ordinary kriging, universal kriging, etc., and ordinary kriging is the most commonly used method. The ordinary kriging weights are derived from the kriging equations using the semivariance function. The parameters of the semivariance function and the nugget effect can be estimated using the empirical semivariance function [52]. The unbiased assessment of the semivariance function is half the average squared difference between paired data values:
γ ( p ) = 1 2 N ( h ) i = 1 N ( h ) [ z ( x i ) z ( x i + h ) ] 2
where γ(h) is the semivariance value at distance interval h,N(h) is the number of sample pairs within the distance interval h, and z(xi + h) and z(xi) are sample values at two points separated by the distance interval h.
The next kind of interpolatorsareradial basis functions (RBF). This is the name given to a large family of exact interpolators that use a basic equation that depends on the distance between the interpolated point and the sampling points. The RBF prediction value can be expressed as the sum of two components [53]:
Z ( x ) = i = 1 m a i f i ( x ) + j = 1 n b j ψ ( d j )
where (dj) shows the radial basis functions and dj is the distance from sample site to prediction point x. fi(x) is a trend function, a member of a basis for the space of polynomials of degree < m. The coefficients ai and bj are calculated by means of the resolution of the following system of n + m linear equations; n is the total number of known points used in the interpolation.
Polynomial interpolation is a process of finding a formula (often a polynomial) whose graph will pass through a given set of points. Global polynomial interpolation corresponds to the polynomial of the entire surface, while local polynomial interpolation can be seen as a combination of global polynomial methods and a moving average procedure. Instead of fitting the polynomial to the entire dataset, it is fitted to a local subset defined by the window, as in the moving average model. The size of this window should be large enough to include a reasonable number of data points in the process.
The next method is an inverse distance weighting (IDW), which is based on the assumption that the forecasts are presented by a linear combination of the available data. The following expression is an interpolating function:
Z ( x ) = i = 1 n w i z i / i = 1 n w i , w i = d i u
where Z(x) is the predicted value at an interpolated point, Zi is at a known point, n is the total number of known points used in interpolation, di is the distance between point i and the prediction point, and wi is the weight assigned to point i. Greater weighting values are assigned to values closer to the interpolated point. As the distance increases, the weight decreases [54], and u is the weighting power that determines how the weight decreases as the distance increases.
It should be clear that all interpolation results contain errors. The identification of a region as polluted should not be based only on interpolation results. It is recommended to consider the natural background and human activities before making a decision. To obtaina more reliable estimate of pollution, more samples from the uncertainty region of the pollution assessment can be added. The uncertainty of the pollution assessment is mainly in the area of high local variations, so additional sampling in the area of uncertainty is recommended.

2.2. Methods for Calculating Indices of Soil Pollution and Risks to Public Health

Muller, G. [55] developed the geoaccumulation index (Igeo), which is widely used in European studies of trace metals [56]. This method estimates environmental pollution by comparing the difference between current and pre-industrial concentrations. It was first developed for the assessment of the quality of bottom sediments of rivers and was used to assess soil pollution [57]. To calculate Igeo for the soils of the surveyed plots, the following equation is proposed:
I geo = log 2 C n 1 . 5 B n
where Cn is the measured concentration of each heavy metal found in the studied soil (mg/kg) and Bn is the geochemical background value of heavy metals in soil for different provinces (mg/kg). The constant 1.5 is used due to possible variations in the initial data [57]. The geoaccumulation index consists of 7 classes or points, among which the highest 6 classes reflects 100-fold enrichment compared to background values [58].
The USEPA health risk assessment model is used to assess the non-carcinogenic and carcinogenic impact on humans exposed to heavy metals [59].
Average daily intake (ADI) is calculated using the following expression [59]:
ADI = C × IR × EF × ED BW × AT
where ADI is an average daily intake (mg/kg per day), C is the concentration of heavy metals in a particular exposure medium (mg/kg), IR is the ingestion rate (kg/day), EF is the exposure frequency (day/year), ED is the exposure duration (year), BW is body weight (kg), and AT is the time period over which the dose is averaged (day). For non-carcinogenic effects AT = ED × 365 (days) and for carcinogenic effects AT = 25,550 (days) (70 years × 365 days/year).
Considering the characteristics of soil pollution with heavy metals, two pathways of exposure are often considered [59]:
  • Ingestion:
    ADI ing = C S × IR S × EF × ED BW × AT
    where ADIing is the average daily intake from ingestion (mg/kg per day), CS is the heavy metal concentration in the soil (mg/kg), and IRs is the ingestion rate of soil (kg/day).
  • Dermal absorption:
    ADI dermal = C S × SA × AF × ABS × EF × ED BW × AT
    where ADIdermal is the average daily intake from dermal absorption (mg/kg per day), CS is the heavy metal concentration in the soil (mg/kg), SA is the exposed skin surface area (cm2), AF is the adherence factor (mg/cm2 per day), and ABS is the dermal absorption index (unitless).
Non-carcinogenic risk is assessed by calculating hazard quotient (HQ) values. For composite heavy metal pollution, a hazard index (HI) is used to assess the overall non-carcinogenic risk, which summarizes the HQ for each heavy metal [59]. It is assumed that the exposed population has no potential risk when the HI is below one.
HQ = ADI RfD
HI = HQ
where HI is the estimated non-carcinogenic health index and RfD is the reference dose of certain heavy metal (mg/kg per day).
Due to the lack of reference doses for the assessment of dermal absorption, USEPA has developed a method for extrapolating oral toxicity values for use in dermal risk assessment [59].
RfD ABS = RfD 0 × ABS GI
where RfDABS is skin contact reference dose (mg/kg per day), RfD0 is the oral reference dose (mg/kg per day), and ABSGI is the gastrointestinal absorption factor (unitless). Carcinogenic risk is estimated by calculating lifetime carcinogenic risk (LCR) values using the equation given below.
LCR = ADI × SF
where LCR is a dimensionless lifetime cancer risk and SF is a carcinogenic potential factor (per mg/kg per day). Generally, an LCR greater than 1 × 10⁻⁴ is considered to have a significant impact on health, while an LCR of 1 × 10⁻⁶–1 × 10⁻⁴ is considered widely acceptable, and an LCR below 1 × 10⁻⁶ is considered insignificant [31].
Similar to the dermal absorption reference dose, the dermal absorption carcinogenic potential factor is extrapolated below [59]:
SF ABS = SF 0 / ABS GI
where SFABS is the dermal absorption carcinogenic potential factor (per mg/kg per day), SF0 is the oral carcinogenic potential factor (per mg/kg per day), and ABSGI is the gastrointestinal absorption factor (unitless).

3. Results

3.1. Creation of Spatial Databases

To assess the level of environmental pollution, we have developed several spatial databases.
One of the databases is the “Database of Soil Pollution in the Republic of North Ossetia–Alania”. The spatial boundaries and the research area extended over aterritory of 810 km2, with a level of soil pollution (according to the results of previous work) from medium to crisis, within the administrative boundaries of the Republic of North Ossetia–Alania.
The main geological tasks of the work carried out were the following:
-
Assessment of the current state of soil pollution, including pesticides and radioactive substances, and prediction of its change under natural and man-made conditions on the territory of North Ossetia–Alania;
-
Development of proposals and recommendations for the prevention of soil pollution;
-
Preparation of environmental maps marking the geopathogenic zones (zones of environmental risk) in North Ossetia–Alania.
A total of 1104 sampling points were included in the specified spatial database.
To monitor ecogeophysical factors of the environment in Vladikavkaz, we measured the indicators of noise pollution and the levels of gamma and electromagnetic radiation at 126 points of the city. The noise level was measured using an Ecogeofizika-110A, a noise and vibration meter, manufactured by the Russian company Oktava (Tula, Russia). Gamma radiation levels were measured using a DBGA-OCHA gamma radiation dosimeter. To study the electric and magnetic fields, measurements were carried out with an IEP-05 electric field meter and with IMP 05/1 and 05/2 magnetic field meters. The results of the work were also formalized in the form of a spatial database for subsequent analysis and the creation of maps.
There are close correlations between the value of the received quantitiesof metals and their concentrations in the body of a person working in production. In particular, chemical production workers have accelerated development of pathologiesrelating tothe bioelectrical and contractile function of the heart, atherogenic changes in blood serum, neurocirculatory dystonia, myocardial dystrophy, atherosclerosis, and chronic heart failure [60]. When considering the situation of population that does not work in such industries but lives in the halo of their distribution, it should be noted that there is a direct relationship between chemical pollution of the environment and an increase in the frequency of allergies, bronchopulmonary pathology, thyroid hyperplasia, caries, and neuropsychiatric and physical developmental disorders. Theecological conditionality of congenital malformations and malignant growths, which are markers of chronic exposure to xenobiotics, has also been noted.
A special database was developed for processing and subsequent analysis of the obtained data. The parameters of the database included the location, gender, age of the patient, localization of the lesion inthe patient’s body (brain, larynx, stomach, female genital organs, thyroid gland, intestines, skin, bones, blood, lungs, lymph nodes, face, mammary gland, male genital organs, liver, kidneys, prostate); a total of 17 items. (Full names of patients are not included in the primary datafor ethical reasons.)
Patients were divided into several groups according to age up to 20 years, 20–29 years, 30–39 years, 40–49 years, 50–59 years, 60–69 years, and 70 years and older. The obtained data were superimposed on a digital map-scheme of the development of the city. In other words, in GIS technologies, the places of residence (streets, buildings, and their numbers) of patients were plotted on the map-scheme of the building stock, thus creating a distribution of the incidence of malignant growths over the area of the city.

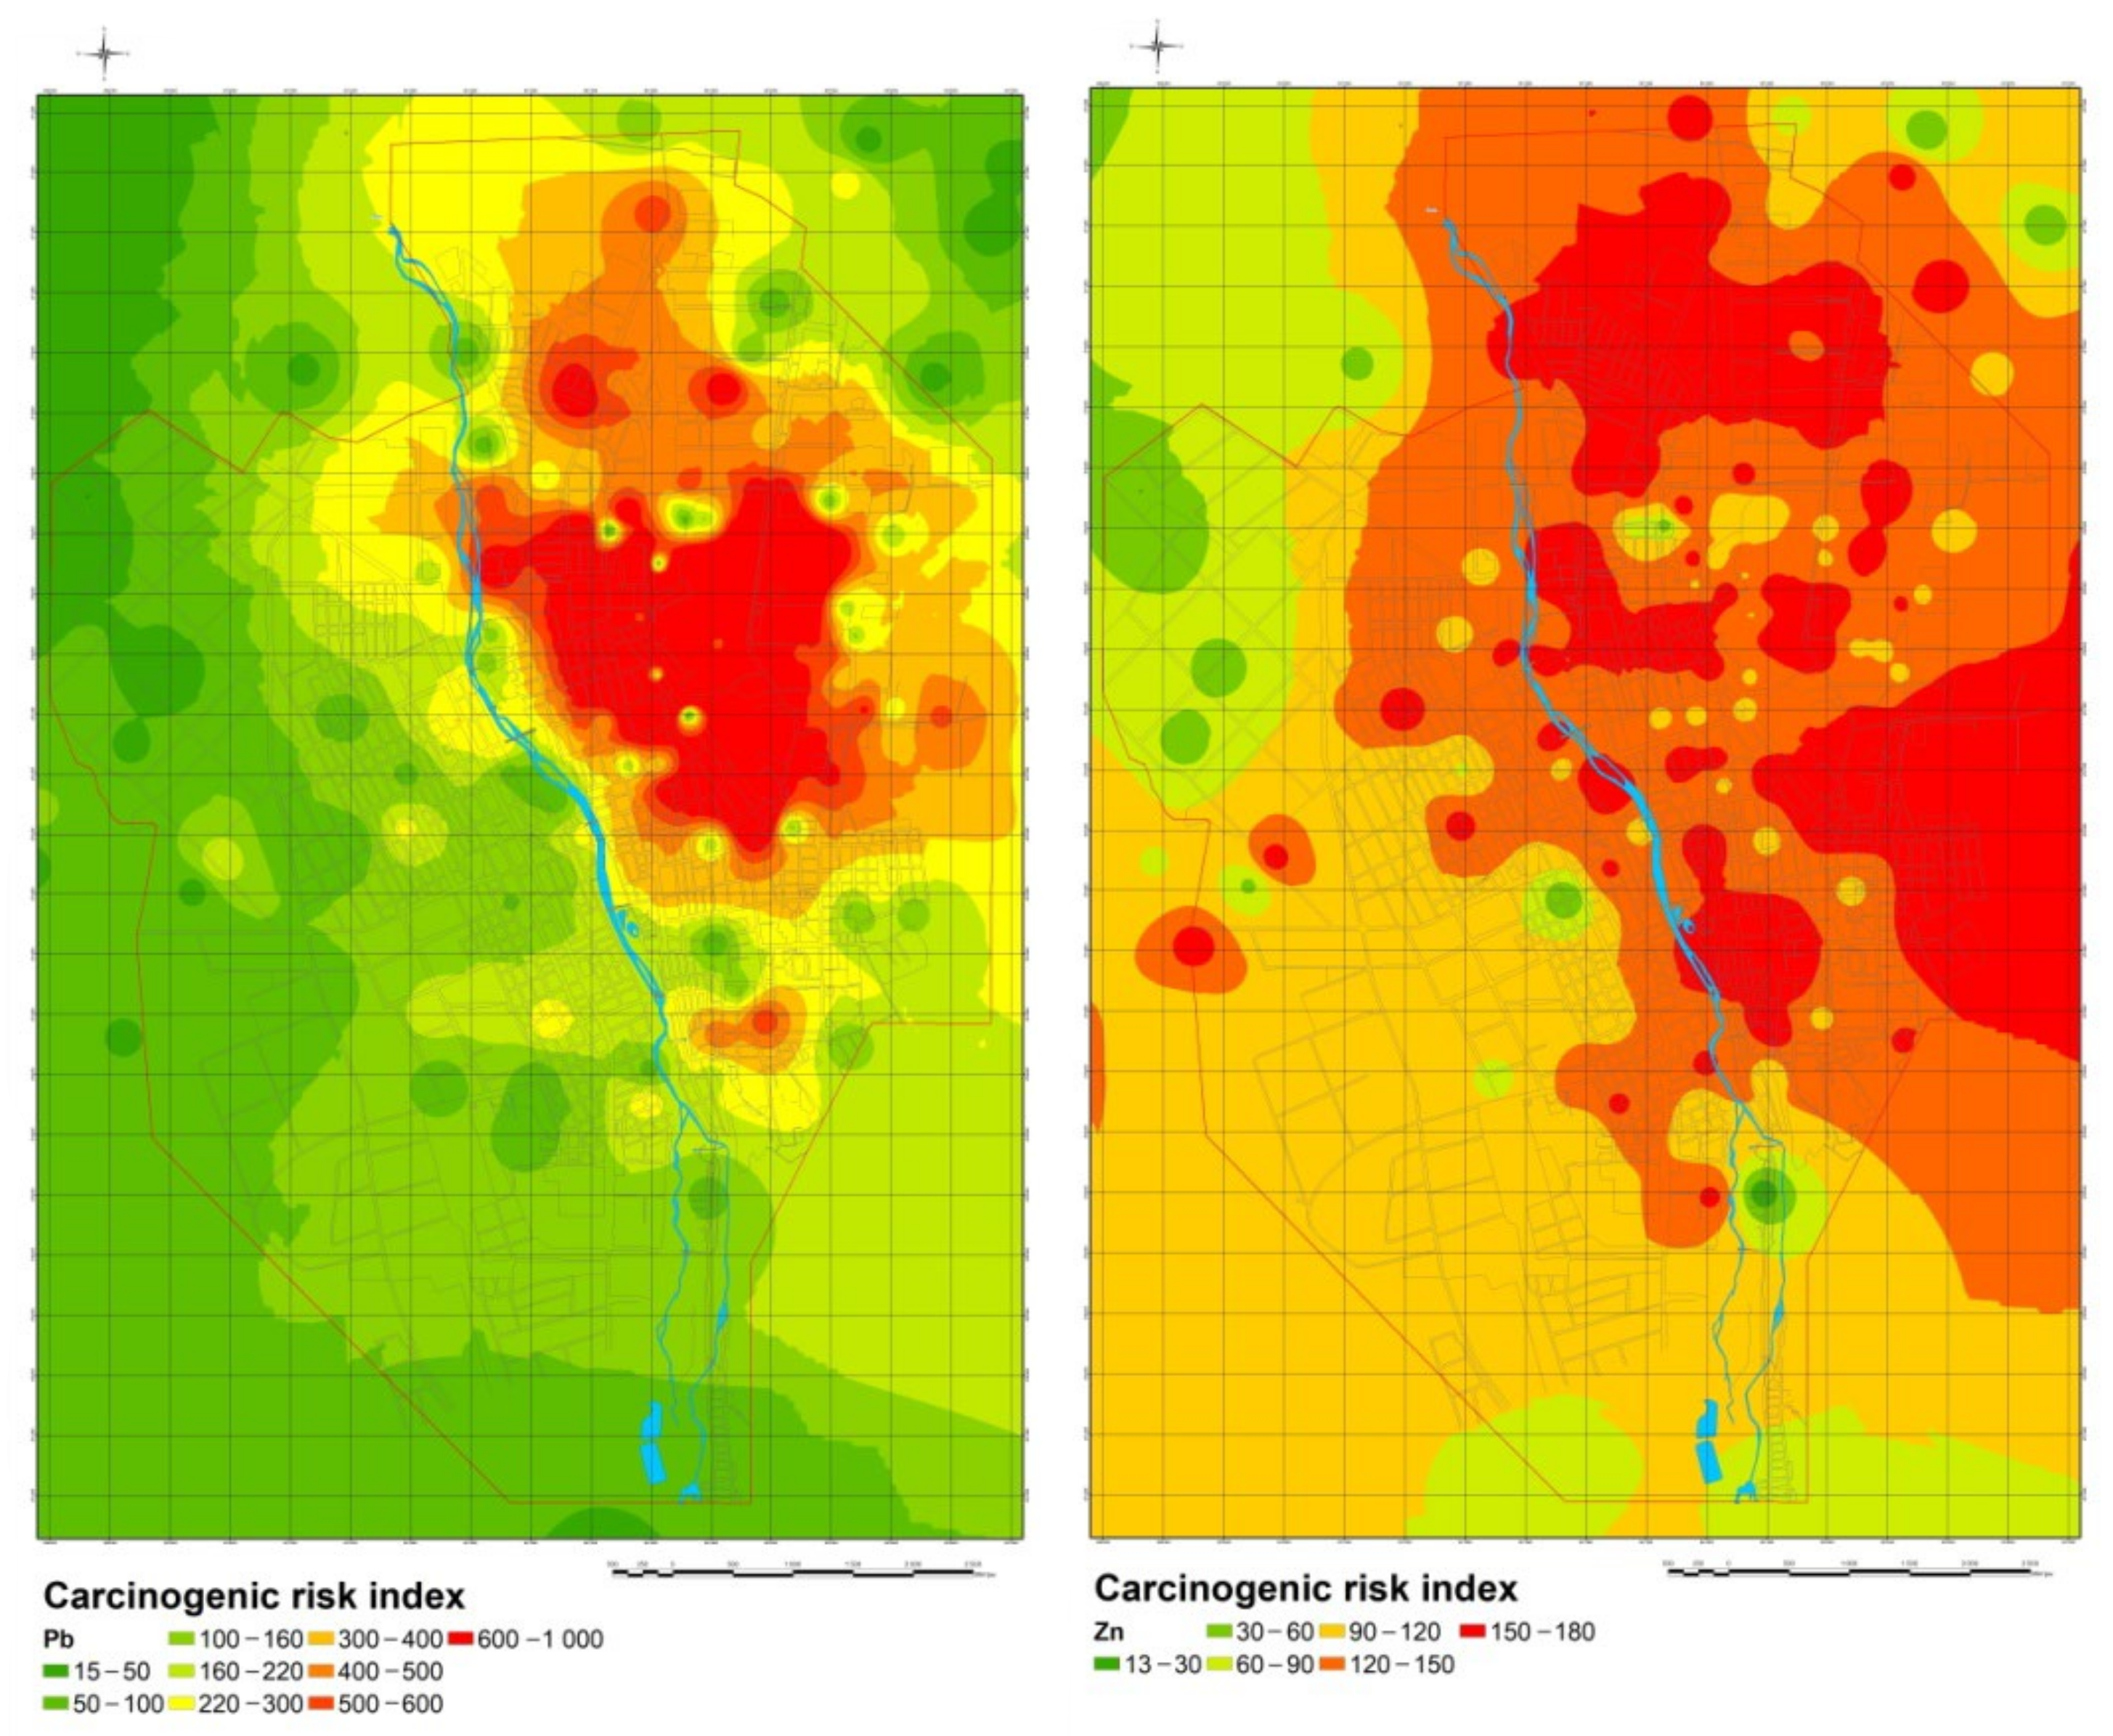
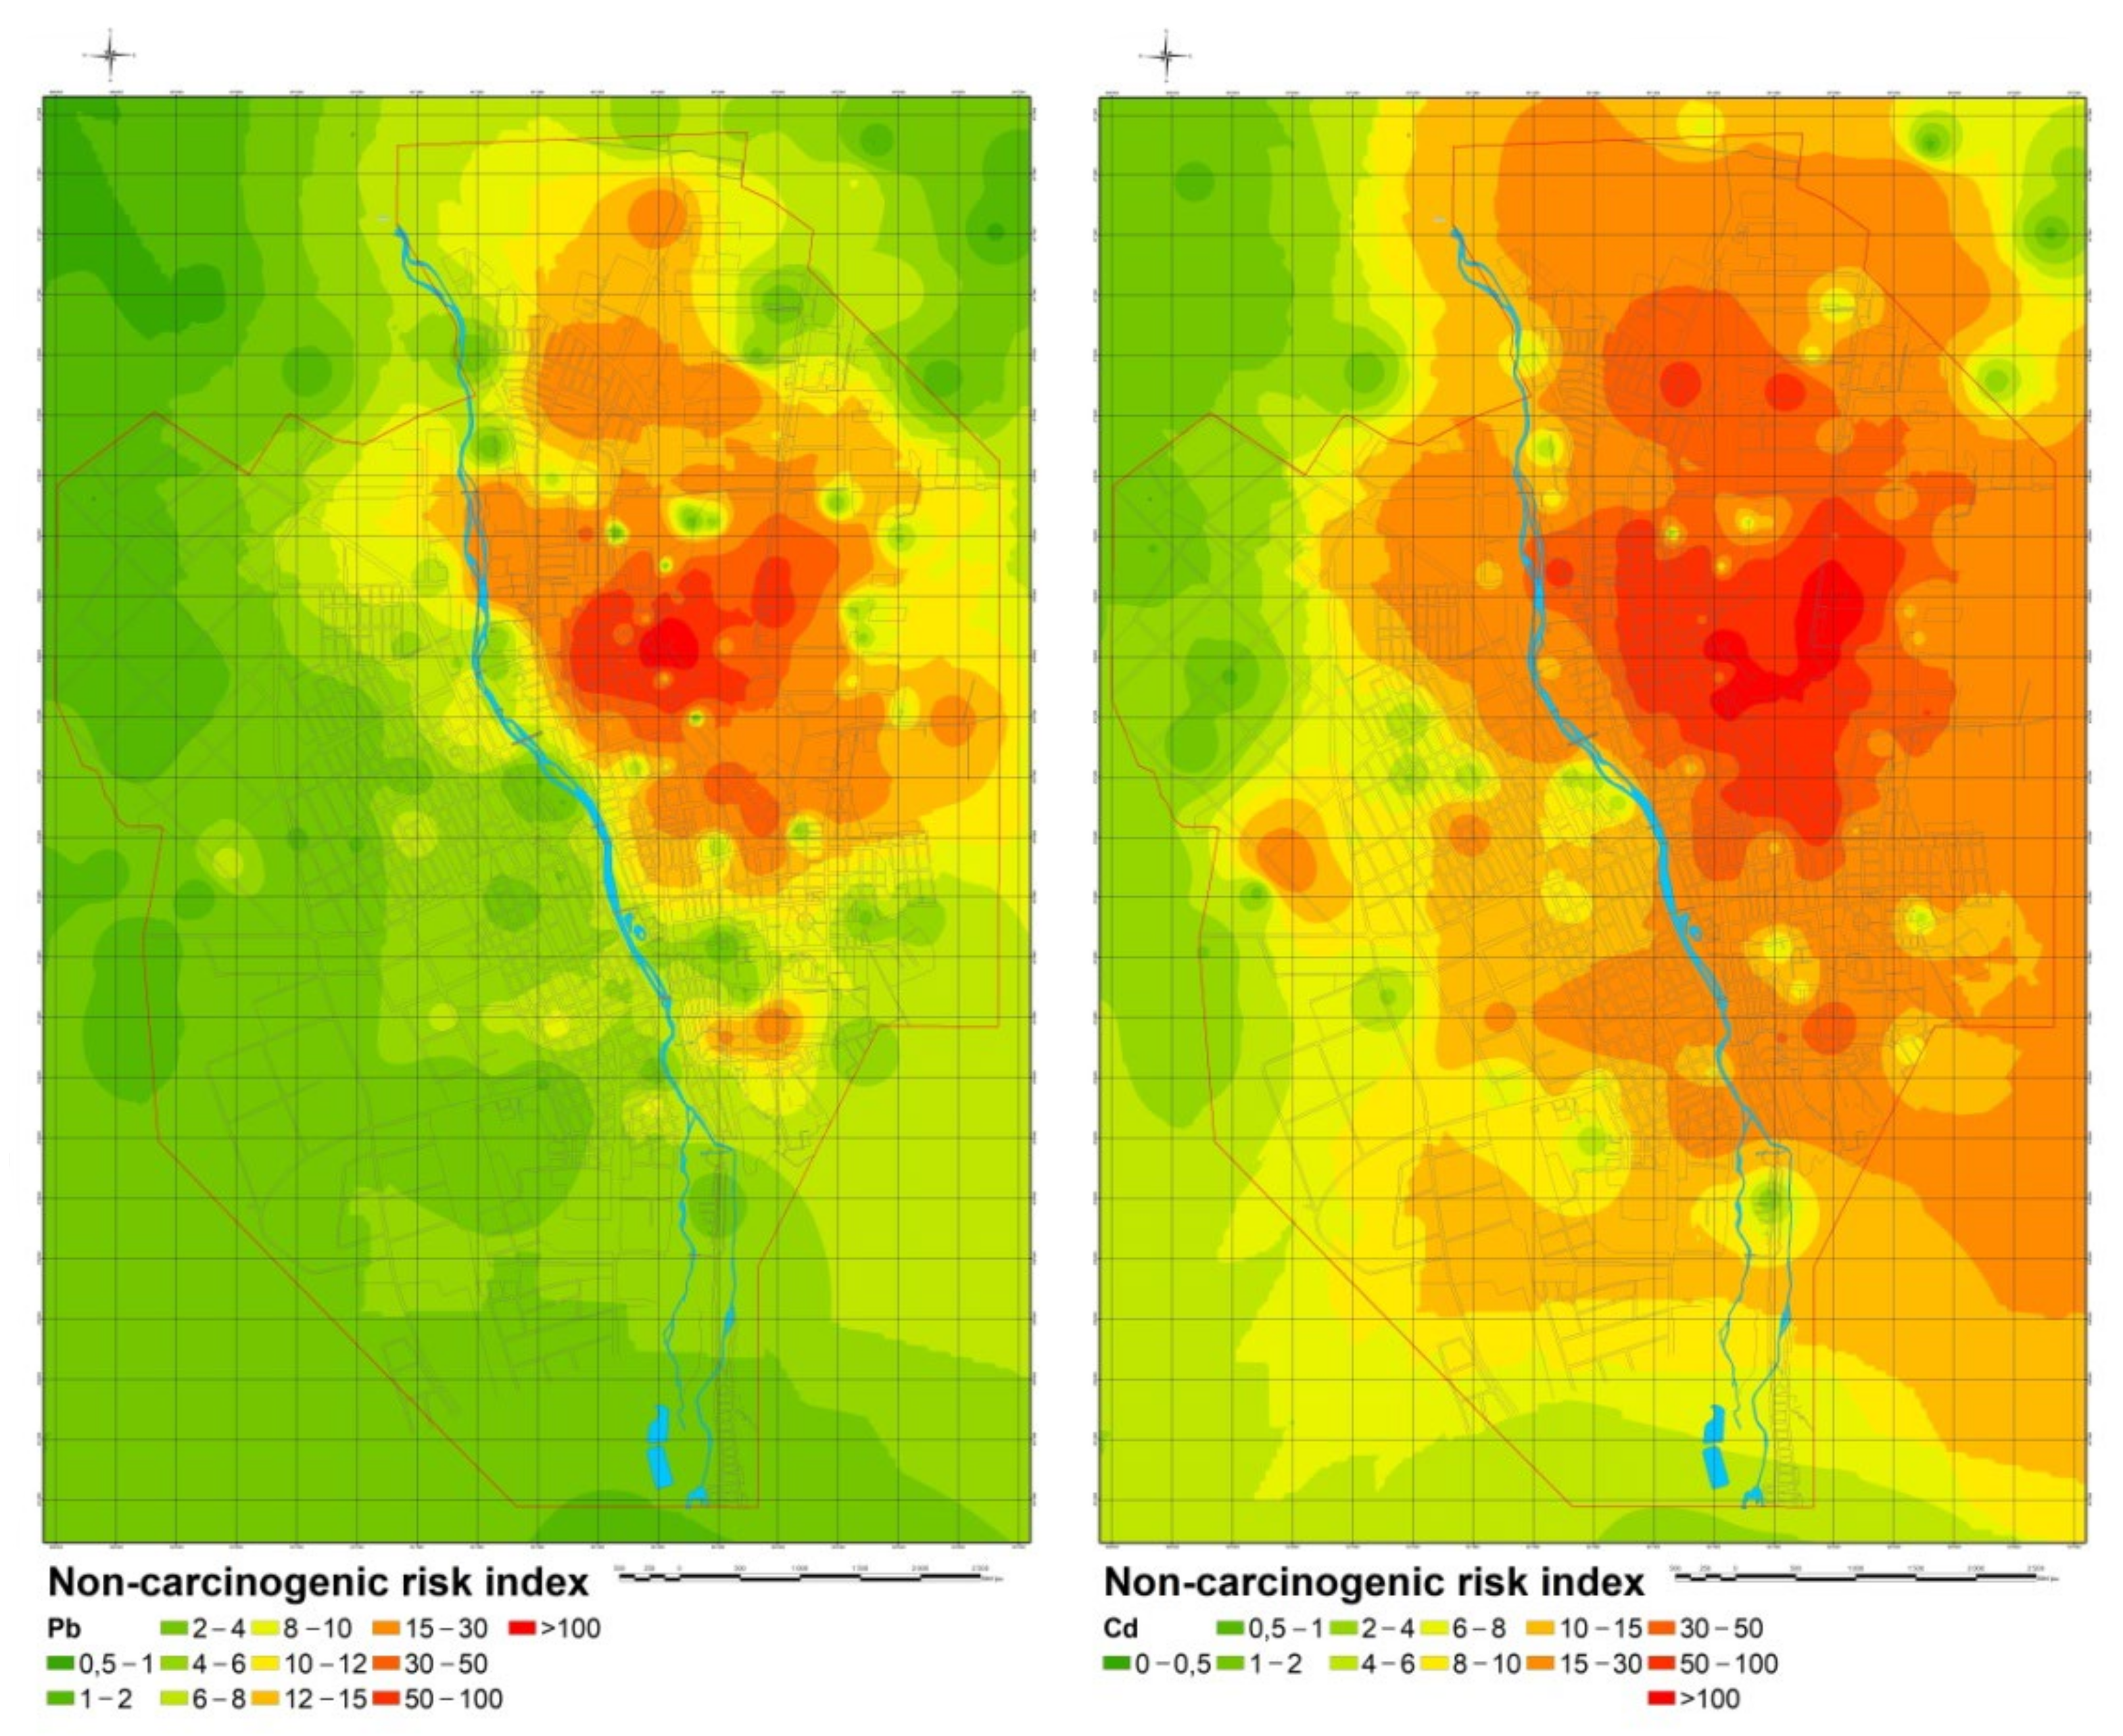
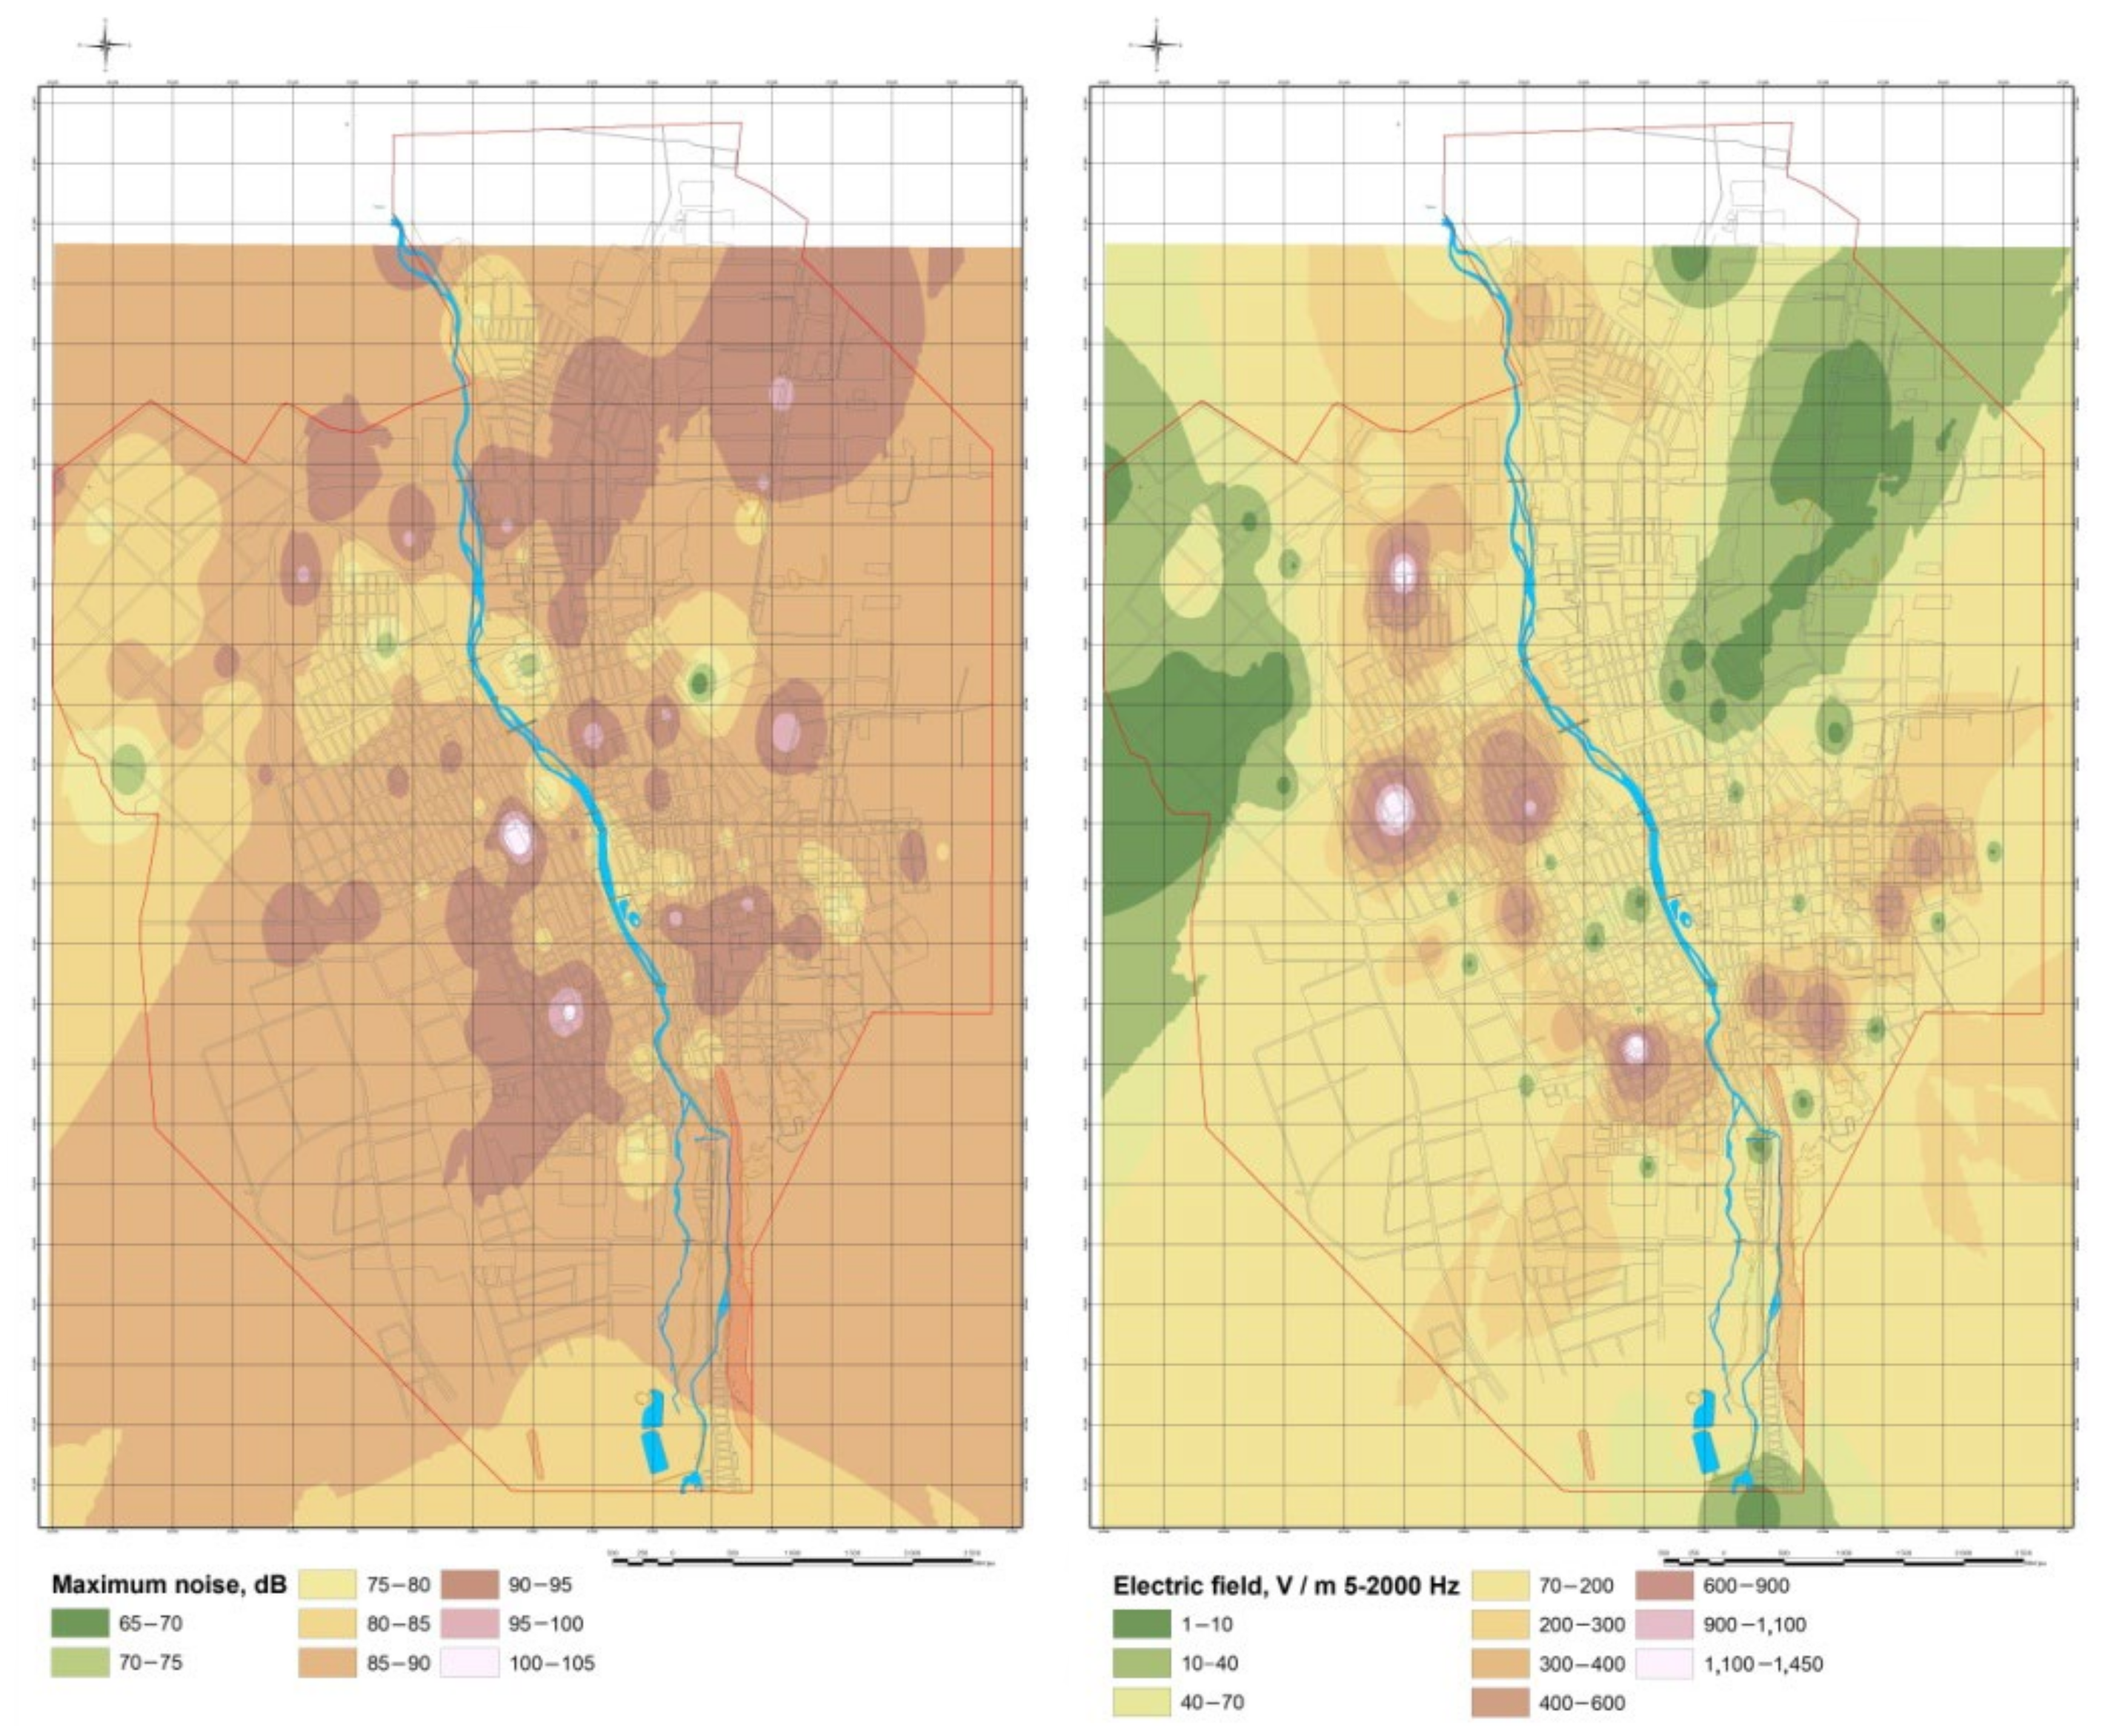
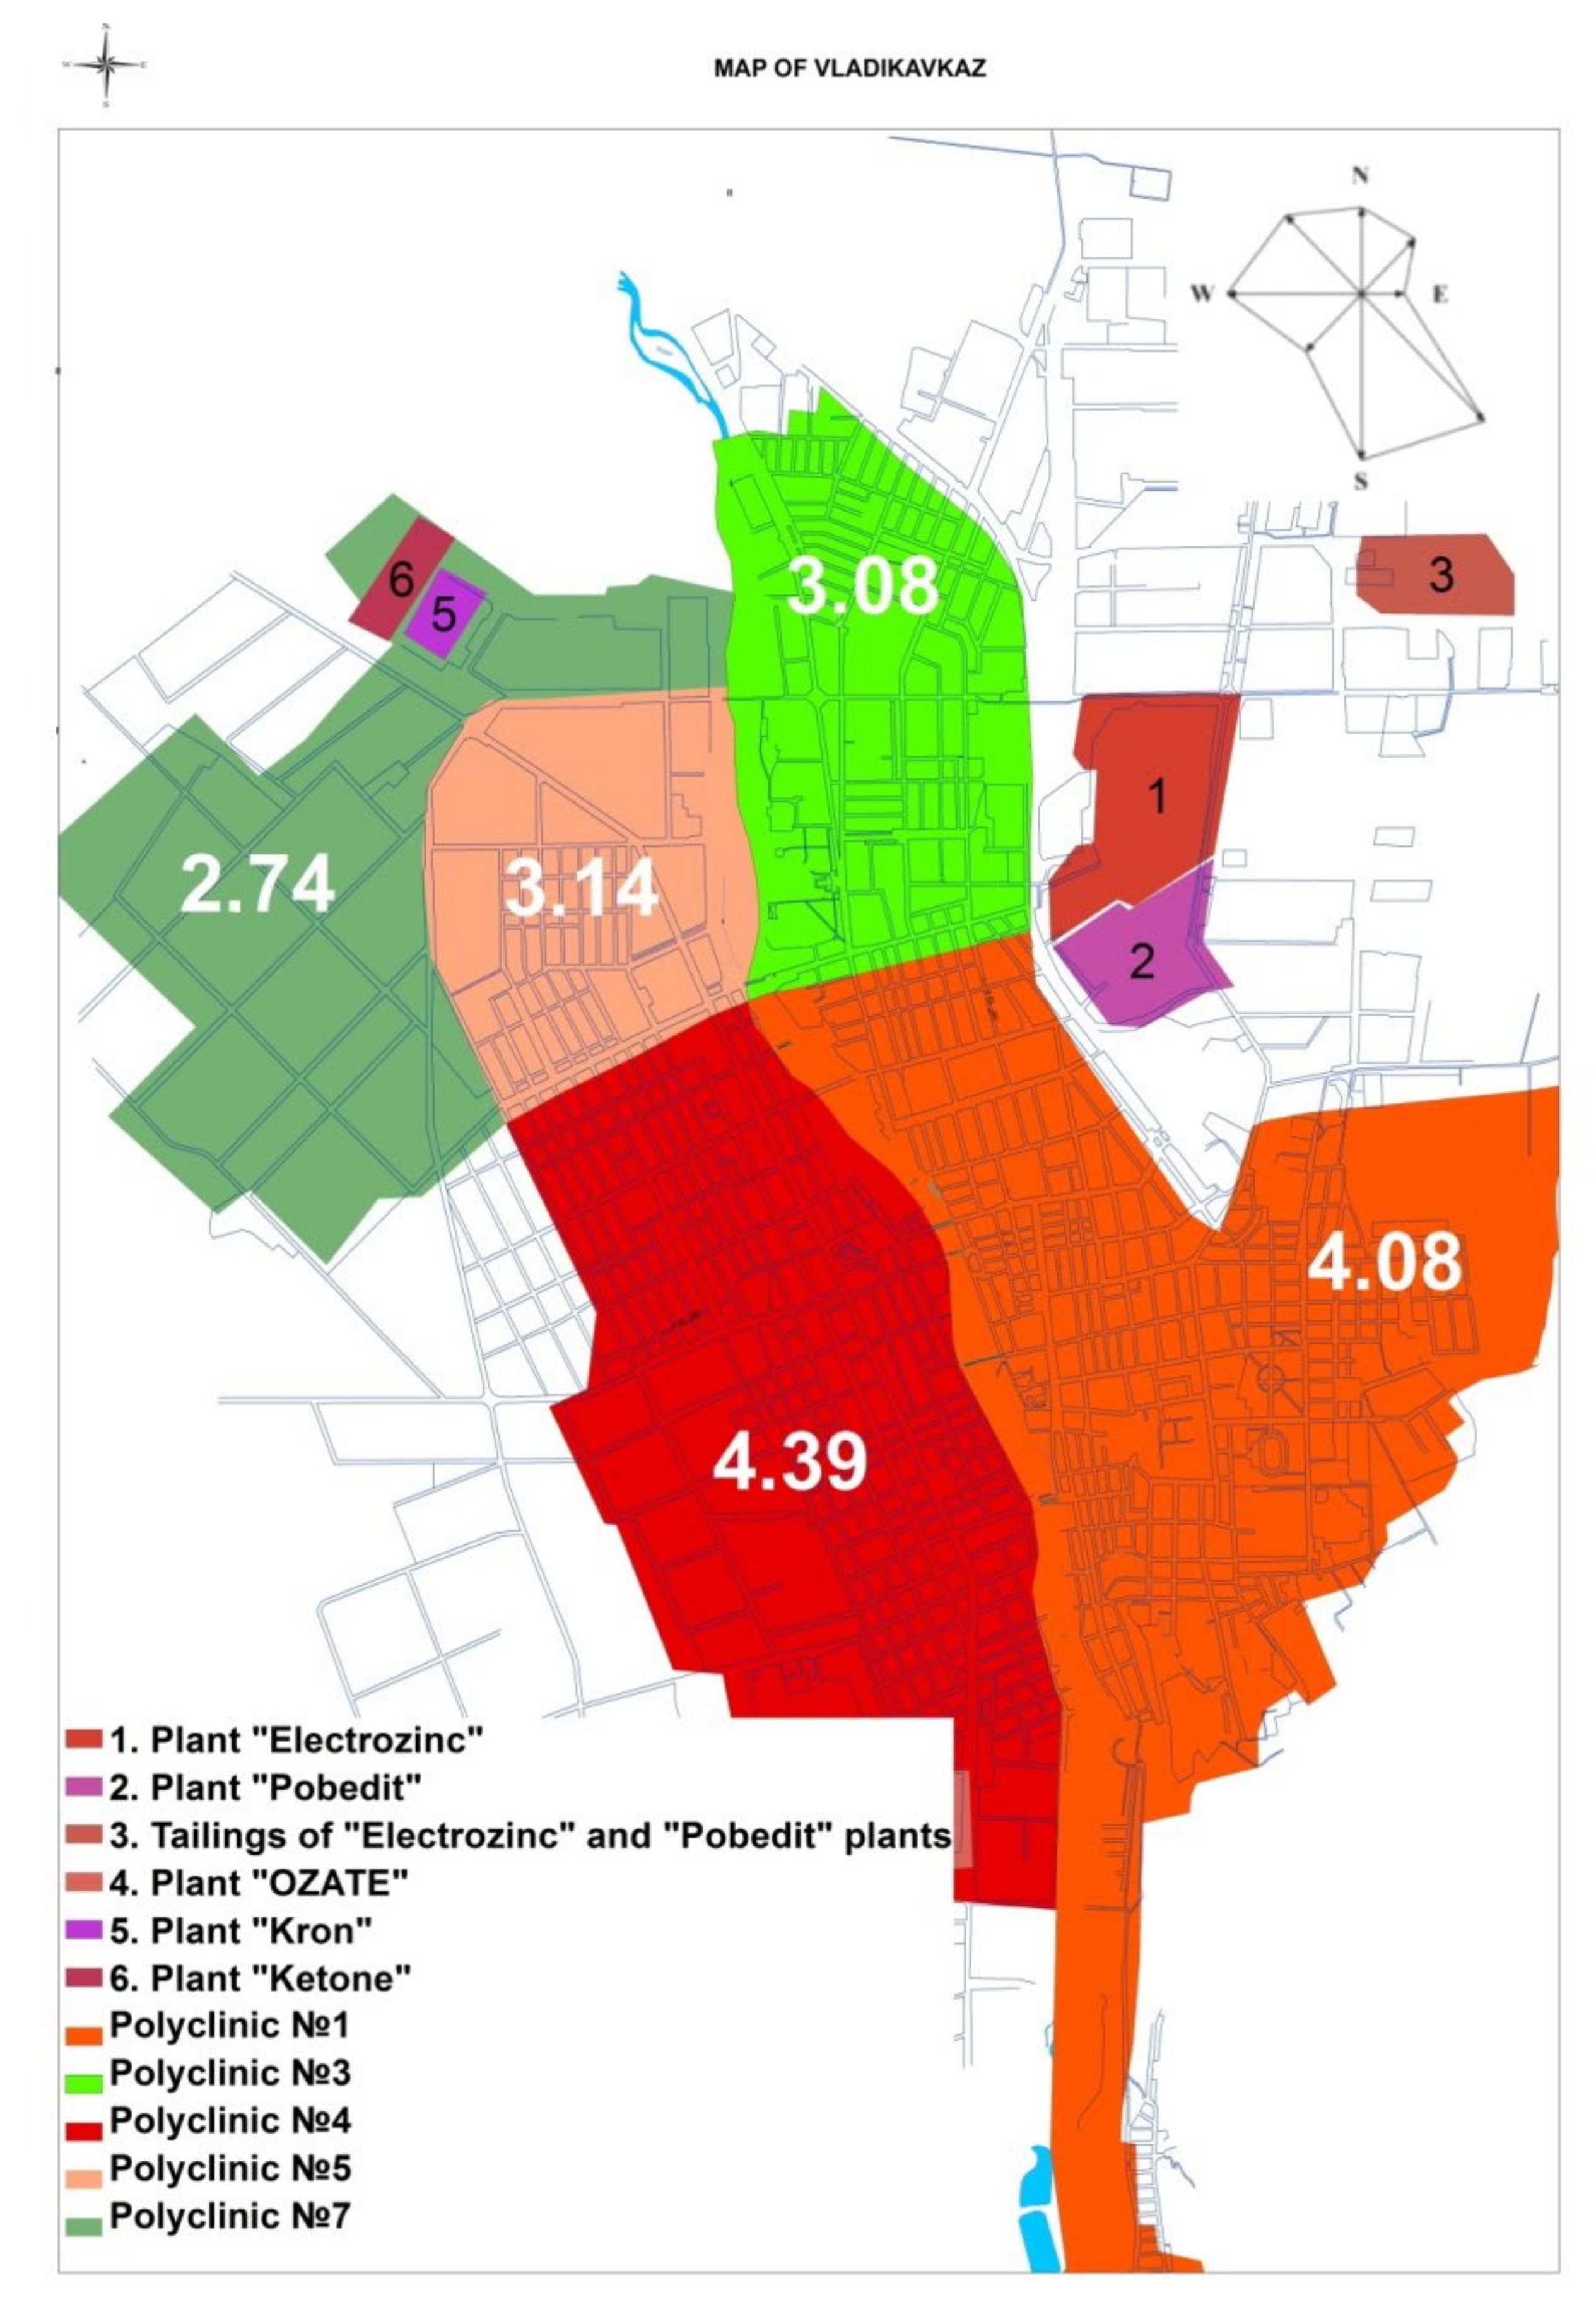
3.2. Development of Maps of Territory Pollution and Morbidity of the Population

Based on the conducted research and the obtained data within the North Ossetia–Alania region, we have identified areas of the territory with varying degrees of environmental stress (catastrophic, critical, crisis, intense, and relatively satisfactory) (Figure 2).
The most polluted sites in the territory of the Republic of North Ossetia–Alania are the Sadon ore district and the city of Vladikavkaz.
Until 1984, the tailings of the Sadon ores were stored in a temporary tailing dump located in a narrow side valley (left tributary of the Ardon River) above the settlement of Mizur. From 1929 to 1984 the factory worked in the mode of winter storage of tailings and dumped them into the Ardon River during the flood period.
Heavy metals (HM) enter the territory of this region as part of two anthropogenic flows: with the waters of the river Unaldon, through the feed ditches system, and due to deflation of the dry part of the tailing.
According to research data collected in the area of the Unal tailing dump, a complex anomaly of technogenic origin was defined in the soils. The spatial structure of the anomaly is determined by the morphology of the river valleys of the Ardon and Unaldon rivers and has a length of up to 1.5 km with a width of 0.2–0.8 km. The identified halos are characterized by a complex composition, the absence of longitudinal–transverse zoning, the coincidence of centers with the maximum contents of ore elements, and spatial proximity to pollution sources, which indicates their technogenic origin.
Investigations of the territory of North Ossetia–Alania pollution were carried out in two stages, which made it possible to study the dynamics of the increase in pollution of the territory over ten years. Based on the results of the studies carried out in stages 1 and 2, the soils in the vicinity of the main areas of pollution were ranked according to the value of the total index Zc. The results of the two-stage studies form the basis of the map of soil pollution dynamics over time (Figure 3).
By comparing the results of studies at both stages, it was found that, with a slight decrease in the concentration of pollutants at stage 2 of the studies, the area of the zones of permissible and moderately hazardous pollution zones increased by a significant amount.
Based on the developed database of Vladikavkaz territory pollution and the methods described in Section 2.2, we constructed maps of the geoaccumulation index for various metals (Figure 4).
Analyzing the constructed maps of the geoaccumulation index, the territory of Vladikavkaz was subjected to significant pollution by some heavy metals. The level of cadmium pollution for the entire territory has increased by two orders of magnitude compared to the pre-industrial era. For lead and copper, the situation is little better: in most of the territory, pollution does not go beyond the third hazard class. Pollution with mercury, zinc, and nickel, according to the geoaccumulation index, is insignificant and does not exceed the first hazard class.
In addition, maps of carcinogenic risk index (Figure 5) and non-carcinogenic risk index (Figure 6) were constructed; the indices were calculated as the ratio of the average daily dose from exposure to chemicals entering the human body from the soil to the reference concentrations for chronic exposure. Values less than one are considered as safe. For the inhalation intake of heavy metals from the soil, for all the studied indicators except mercury, a significant excess of the maximum permissible values was found.
For the oral intake of heavy metals from the soil into the human body, the values of the carcinogenic risk index do not exceed one for all the studied elements, except lead and 0.4 for cadmium. At the same time, for non-carcinogenic risk, the index values are significantly higher than one in the areas of the greatest contamination for cadmium and lead.
It has been determined that the most hazardous method of heavy metals intake from the soil into the human body is by inhalation, for which there is a significant excess of the permissible risk level. The oral way poses a significantly lower level of risk. The third option for heavy metals intake from the soil into the human body is dermal exposure, which gives values forthe carcinogenic risk index close to zero.
Thus, the overall level of carcinogenic risk for the territory of Vladikavkaz due to the intake of heavy metals from the soil into the human body significantly exceeds safe values. In this case, the overall risk is an integral indicator of individual risk values for various methods of heavy metals intake. However, given that the level of risk for inhalation intake significantly exceeds the risk levels for oral and dermal exposure of the soil, the maps of the carcinogenic risk index for inhalation intake of heavy metals can be considered as the final maps. At the same time, the oral way also significantly exceeds dermal exposure.
According to the results of the study of ecogeophysical pollution factors in the territory of Vladikavkaz, corresponding maps were also constructed (Figure 7). Based on the results of observations, certain orders and patterns of changes in the structure of the movement of passenger cars and trucks along the main traffic routes at different times of the day were defined; they provide a basis for the analysis and development of appropriate mathematical models as well as the prediction of environmental well-being in the zone of increased noise risk. The population of the city of Vladikavkaz is exposed to noise for a significant period of time, exceeding the permissible level by 1 to 38 dBA.
According to the obtained data for levels of gamma radiation, it can be concluded that the population of the city of Vladikavkaz is exposed to gamma radiationin the range of 0.05–0.18 μSv/h and at an average value of 0.11 μSv/h, which is below the maximum permissible level. The electric field strength reached values up to 1400 V/m at individual measurement points, with an allowable level of 800 V/m, significantly exceeding the maximum permissible values. At the same time, it should be noted that on the outskirts of the city, at points adjacent to power lines, as well as on the city streets with tram traffic, there is a significant increase in these indicators compared to other points.
In the course of this study, all available data on the dynamics of emissions from road transport in North Ossetia–Alania over the past 20 years were collected and analyzed.
The results of the analysis made it possible to establish that there is a direct relationship between traffic flow density and air pollution. At the same time, the most intense environmental pollution is observed in the area of the cinema “Druzhba” and the Arkhonsky crossroad, which are the places of the greatest traffic congestion. The studies for establishing the relationship between the number of moving vehicles and the level of environmental pollution were carried out using correlation and regression analysis (Figure 8).
It has been determined that the increase of pollutant emissions into the atmosphere from road transport is growing linearly, similar to the growth in the number of vehicles. In this case, the value of the approximation reliability R2 is equal to 0.97. A high concentration of sulfur dioxide (up to four maximum permissible concentrations) was detected on the highways at the entrance to the city, which, in particular, may serve as an indirect sign of the use of low-quality fuel by heavy-duty vehicles. The federal highway, which leads to the Georgian Military Highway, passes right through the city. Its extremely high congestion is caused by the fact that it is the only existing land road connecting Russia with Armenia, Georgia, and Turkey.
Pollution of the city territory fromvarious sources does not occurwithout leaving a trace and there are a number of signs or factors of a changing level of pollution. Analysis of the data showed that, in our opinion, the most reliable indicator of the presence of a correlation relationship between the pollution of the territory with heavy metals can be considered malignant growths, which are markers of chronic exposure to xenobiotics.
According to the generally accepted method of polyclinic territorial zoning [61,62,63,64,65,66] along the service boundaries of polyclinics, cancer incidence values were obtained for different years, as well as the average value for several years, which was put on the map (Figure 9).
Previously, we found that inhalation is the most hazardous way for heavy metals to enter the human body from soil. To assess the influence of prevailing winds on the incidence of the population, the wind rose for the territory of Vladikavkaz was considered. Figure 7 shows that the prevailing direction of airflow is south; thus, it can be concluded that, according to the constructed maps of carcinogenic risk, the highest value of cancer morbidity should be observed for the southern part of the city, which was obtained using the polyclinic zoning method. The lower morbidity rate for Polyclinic No. 1 compared to Polyclinic No. 4 can be explained by the fact that Polyclinic No. 1 serves nearby villages which are located at a greater distance from the source of pollution [67,68,69,70,71,72,73,74].
To study the possible correlation between the number of malignant growth cases and age groups, we compiled a table of the number of cases of cancer morbidity in the adult population of Vladikavkaz, arrangedaccording to age group, for the period from 2005 to 2010, along the service boundaries of polyclinics. The total number of cancer morbidity cases was calculated along the service boundaries of polyclinics (Table 1).
Using the average value of the number of cancer morbidity cases in polyclinics and, having plotted the dependence of percentage of cases on age group, the shape of the approximating curve was obtained using the least squares method (Figure 10). This type of curve has a clearly expressed quadratic form, which was considered when constructing it. Taking such a high value of the approximation reliability R2 = 0.989 into account, we can conclude that the resulting equation describes this dependence very accurately.
Calculating the predictive value of the number of patients using the obtained regression expression, we can conclude that the established dependence of the percentage of patients on age group with a high degree of accuracy allows us to determine the number of manifestations of cancer morbidity in different age groups depending on the total number of patients. As an accuracy test of the obtained regression expression, the expected values of the number of diseases for different age groups were calculated for the territory of the Alagir district of the Republic of North Ossetia–Alania, where we also studied morbidity. On the basis ofour calculations, it was found that the predicted values of the number of cancer diseases differed from the real valuesby no more than 3 percent. The obtained results also indicate that a high degree of contamination of the territory with heavy metals and their accumulation in the human body, i.e., cumulative effect, significantly increases morbidity inthe population with age.

4. Discussion of the Results

Based on the conducted research and the obtained data within the North Ossetia–Alania region, we have identified areas of the territory with varying degrees of environmental stress: catastrophic, critical, crisis, intense, and relatively satisfactory. Investigations of the territory of North Ossetia–Alania pollution were carried out in two stages, which made it possible to study the dynamics of the increase in pollution of the territory over a ten-year period. According to the results of the studies of both stages, it was found that, with a slight decrease in the concentration of pollutants at stage 2, the area of the zones of permissible and moderately hazardous pollution zones increased by a significant amount.
Monitoring of ecogeophysical factors of the environment in Vladikavkaz was carried out: indicators of noise pollution, electric fields, and the level of gamma radiation were measured. According to the results of observations, certain orders and patterns of changes in the structure of the movement of passenger cars and trucks along the main traffic routes in Vladikavkaz, the Republic of North Ossetia–Alania at different times of the day were defined; they provided a basis for the analysis and for the development of appropriate mathematical models, as well as the prediction of environmental well-being in the zone of increased noise risk.
The population of the city of Vladikavkaz is exposed to noise for a significant period of time, exceeding the permissible level by 1 to 38 dBA.
According to the obtained data, it can be concluded that the population of the city of Vladikavkaz is exposed to gamma radiation in the range of 0.05–0.18 μSv/h and at an average value of 0.11 μSv/h, which is below the maximum permissible level. The electric field strength reached values up to 1400 V/m at individual measurement points, with an allowable level of 800 V/m, significantly exceeding the maximum permissible values. At the same time, it should be noted that on the outskirts of the city, at points adjacent to power lines, as well as on the city streets with tram traffic, there is a significant increase in these indicators compared to other points.
It has been determined that the most hazardous method of heavy metals intake from the soil into the human body is by inhalation. According to the obtained data, all the elements, except mercury, form a higher level of risk significantly exceeding one. For the oral intake of heavy metals from the soil into the human body, the values of the risk index do not exceed one for all the studied elements, except lead and 0.4 for cadmium. At the same time, the risk values for lead are exceeded for the limited area of the former plant “Electrozinc”. For dermal exposure tothe soil, the risk values for all elements are close to zero. Considering that the level of risk for inhalation intake significantly exceeds the risk levels for oral and dermal exposure of the soil, the maps of the carcinogenic risk index for inhalation intake of heavy metals can be considered as final maps.
A significant contribution to environmental pollution and, in particular, atmospheric air is made by road transport. The results of the analysis made it possible to establish that there is a direct relationship between traffic flow density and air pollution. The obtained data indicate a steady trend towards an increase in air pollution as a result ofthe increasing negative impact of motor vehicle emissions, which also negatively affects the health of the population.
It has been determined that withcloser proximity to the industrial enterprises of non-ferrous metallurgy and the corresponding halos of soil contamination with heavy metals, cancer morbidity is higher amongthe population of Vladikavkaz in the localizations most susceptible to the influence of the considered heavy metals.
Using the least squares method, the functional dependence of the percentage of cases on age group was determined with the approximation reliability value R2 = 0.989, which confirms that a high degree of territory contamination with heavy metals and their accumulation in the human body significantly increase the morbidity of the population with age.

5. Conclusions

This article considers various methods of interpolation of data with spatial reference. Given that the interpolation methods considered in this study lead to almost identical results, we chose the inverse distance weighted (IDW) method as the interpolation method.
Databases have been developed for the content of heavy metals in soils in the territory of North Ossetia–Alania, databases of noise, radiation, electrical and magnetic pollution of the territory of Vladikavkaz, and a database for cancer morbidity of the population of North Ossetia–Alania.
For the territory of the Republic of North Ossetia–Alania, map-schemes of areas of ecological situations in mining areas have been developed. Two highlypolluted areas were identified. It has been determinedthat the active development of polymetallic ores has led to a significant level of contamination of the territory. At the same time, even though mining activity and enterprise operations have been stopped, pollution halos continue to increase. Whence it follows that the main sources of environmental pollution, at the moment, are significant dumps from the extraction and processing of polymetallic ores, which are located to the north of the OJSC “Electrozinc” in an unpreserved state and are exposed to wind currents and leaching by precipitation.
A geoaccumulation index of heavy metals in soils and indices of carcinogenic and non-carcinogenic risks were calculated and corresponding maps were constructed. It was established that the territory of Vladikavkaz was subjected to significant pollution by a number of heavy metals. Thus, the level of cadmium pollution for the entire territory has increased by two orders of magnitude compared to the pre-industrial era. For lead and copper, the situation is a little better: in most of the territory, pollution does not go beyond the third hazard class. The levels of carcinogenic and non-carcinogenic risks significantly exceed safe values.
Maps of noise, radiation, and electrical and magnetic pollution of the territory of Vladikavkaz were developed. It has been determined that, except for radiation, a significant excess of safe values is observed for all the studied indicators.
Air pollution by road transport was studied. It has been defined that emissions from road transport exceed stationary sources by an order of magnitude.
It has been established that in areas where environmental pollution with heavy metals is higher, cancer morbidity is also higher. The functional dependence of the percentage of disease on age group was confirmed. The morbidity of the population is an integral indicator of environmental pollution, which allows us to say that the obtained high values for population morbidity are associated with an extremely unfavorable environmental situation in the territory of North Ossetia–Alania.

Author Contributions

Conceptualization, V.Z., O.B., A.K. and T.Z.; methodology V.Z., O.B., A.K. and T.Z.; software, A.K. and T.Z.; validation, O.B. and A.K.; formal analysis, V.Z., O.B., A.K. and T.Z.; investigation, V.Z., O.B., A.K. and T.Z.; resources, O.B. and A.K.; data creation, V.Z., O.B., A.K. and T.Z.; writing—original draft preparation, V.Z., O.B. and A.K.; writing—review and editing, V.Z.; visualization, A.K. and T.Z.; supervision, V.Z. All authors have read and agreed to the published version of the manuscript.

Funding

This research received no external funding.

Institutional Review Board Statement

Not applicable.

Informed Consent Statement

Not applicable.

Data Availability Statement

Not applicable.

Conflicts of Interest

The authors declare no conflict of interest.

References

  1. Zaalishvili, V.B.; Beriev, O.G.; Kanukov, A.S.; Maysuradze, M.V. Mining impact on environment on the North Ossetian territory. Int. J. Geomate 2016, 10, 1693–1697. [Google Scholar]
  2. Muzet, A. Environmental noise, sleep and health. Sleep Med. Rev. 2007, 11, 135–142. [Google Scholar] [CrossRef] [PubMed]
  3. Alborov, I.D.; Burdzieva, O.G.; Zaalishvili, V.B. Technology for the maintenance of acoustic comfort on the transcaucasian highway in the zone of the residential areas adjusting the motor road. Akustika 2019, 32, 211–215. [Google Scholar] [CrossRef]
  4. Messingher, G.; Ryherd, E.E.; Ackerman, J. Hospital noise and staff performance. J. Acoust. Soc. Am. 2012, 132, 203. [Google Scholar] [CrossRef]
  5. Sørensen, M.; Andersen, Z.J.; Nordsborg, R.B.; Jensen, S.S.; Lillelund, K.G.; Beelen, R.; Schmidt, E.B.; Tjønneland, A.; Overvad, K.; Raaschou, N. Road traffic noise and incident myocardial infarction: A prospective cohort study. PLoS ONE 2012, 7, e39283. [Google Scholar]
  6. Basner, M.; Babisch, W.; Davis, A.; Brink, M.; Clark, C.; Janssen, S.; Stansfeld, S. Auditory and non-auditory effects of noise on health. Lancet 2014, 383, 1325–1332. [Google Scholar] [CrossRef] [Green Version]
  7. Verbeek, J.H.; Kateman, E.; Morata, T.C.; Dreschler, W.A.; Mischke, C. Interventions to prevent occupational noise-induced hearing loss. Cochrane Database Syst. Rev. 2012, 10, CD006396. [Google Scholar]
  8. Miedema, H.M.E.; Oudshoorn, C.G.M. Annoyance from transportation noise: Relationships with exposure metrics DNL and DENL and their confidence intervals. Environ. Health Perspect. 2001, 109, 409–416. [Google Scholar] [CrossRef]
  9. Ohrstrom, E.; Skanberg, A.; Svensson, H.; Gidlof-Gunnarsson, A. Effects of road traffic noise and the benefit of access to quietness. J. Sound Vibrat. 2006, 295, 40–59. [Google Scholar] [CrossRef]
  10. Liang, M.J.; Zhao, F.; French, D.; Zheng, Y.Q. Characteristics of noise-canceling headphones to reduce the hearing hazard for MP3 users. J. Acoust. Soc. Am. 2012, 131, 4526–4534. [Google Scholar] [CrossRef]
  11. Ugbede, F.O.; Echeweozo, E.O. Estimation of annual effective dose and excess lifetime cancer risk from background ionizing radiation levels within and around quarry site in Okpoto-Ezillo, Ebonyi State, Nigeria. J. Environ. Earth Sci. 2017, 7, 74–79. [Google Scholar]
  12. UNSCEAR. United Nations Scientific Committee on the Effect of Atomic Radiation: Exposures from Natural Radiation Sources; Report to General Assembly, with Scientific Annexes; United Nations: New York, NY, USA, 2000. [Google Scholar]
  13. Gholami, M.; Mirzaei, S.; Jomehzadeh, A. Gamma background radiation measurement in Lorestan province, Iran. Int. J. Radiat. Res. 2011, 9, 89–93. [Google Scholar]
  14. Zaks, T.V.; Burdzieva, O.G.; Zaalishvili, V.B. Impact of noise, gamma radiation and other geophysical factors on population health. Akustika 2019, 32, 206–210. [Google Scholar] [CrossRef]
  15. Agbalagba, E.O.; Avwiri, G.O.; Ononugbo, C.P. GIS mapping of impact of industrial activities on the terrestrial background ionizing radiation levels of Ughelli metropolis and its Environs, Nigeria. Environ. Earth Sci. 2016, 75, 1425. [Google Scholar] [CrossRef]
  16. Emelue, H.U.; Jibiri, N.N.; Eke, B.C. Excess lifetime cancer risk due to gamma radiation in and around Warri refining and petrochemical company in Niger Delta, Nigeria. Br. J. Med. Med. Res. 2014, 4, 2590–2598. [Google Scholar] [CrossRef]
  17. Ononugbo, C.P.; Avwiri, G.O.; Tutumeni, G. Measurement of natural radioactivity and evaluation of radiation hazards in soil of Abua/Odual districts using multivariable statistical approach. Br. J. Environ. Sci. 2016, 4, 35–48. [Google Scholar]
  18. Saito, K.; Sakamoto, R.; Nagaoka, T.; Tsutsumi, M.; Moriuchi, S. Measurements of gamma dose rates in dwellings in the Tokyo metropolitan area. Radiat. Prot. Dosim. 1997, 69, 61–67. [Google Scholar] [CrossRef]
  19. Sivakumar, R.; Selvasekarapandian, S.; Mugunthamanikandan, N.; Raghunath, V.M. Indoor gamma dose measurements in Gudalore (India) using TLD. Appl. Radiat. Isot. 2002, 56, 883–889. [Google Scholar] [CrossRef]
  20. D’Amore, G.; Anglesio, L.; Tasso, M.; Benedetto, A.; Roletti, S. Outdoor background elf magnetic fields in an urban environment. Radiat. Prot. Dosim. 2001, 94, 375–380. [Google Scholar] [CrossRef]
  21. Portier, C.J.; Wolfe, M.S. (Eds.) Assessment of Health Effects from Exposure to Power-Line Frequency Electric and Magnetic Fields; NIH Publication. No. 98-3981; National Institute of Environmental Health Sciences (NIEHS) Working Group Report of the National Instates of Health: Research Triangle Park, NC, USA, 1998.
  22. Wartenburg, D. Residential EMF exposure and childhood leukemia: Metal-analysis and population attributable risk. Bioelectromagn. Suppl. 2001, 5, 86–104. [Google Scholar] [CrossRef]
  23. Feychting, M.; Floderus, B.; Ahlbom, A. Parental occupational exposure to magnetic fields and childhood cancer (Sweden). Cancer Causes Control 2000, 11, 151–156. [Google Scholar] [CrossRef] [PubMed]
  24. Savitz, D.A.; Cai, J.; van Wijngaarden, E.; Loomis, D.; Mihlan, G.; Dufort, V.; Kleckner, R.C.; Nylander-French, L.; Kromhout, H.; Zhou, H. Case-cohort analysis of brain cancer and leukemia in electric utility workers using a refined magnetic field jobexposurematrix. Am. J. Ind. Med. 2000, 38, 417–425. [Google Scholar] [CrossRef]
  25. Li, D.-K.; Odoull, R.; Wi, S.; Janevic, T.; Golditch, I.; Bracken, T.D.; Senior, R.; Rankin, R.; Iriye, R. A population-based perspective cohort study of personal exposure to magnetic fields during pregnancy and the risk of miscarriage. Epidemiology 2002, 13, 9–20. [Google Scholar] [CrossRef]
  26. Ahlbom, A. Neurodegenerative diseases, suicide and depressive symptoms in relation to EMF. Bioelectromagn. Suppl. 2001, 5, 132–143. [Google Scholar] [CrossRef]
  27. Savitz, D.A.; Liao, D.; Sastre, A.; Fleckner, R.C.; Kavet, R. Magnetic field exposure and cardiovascular disease mortality among electric utility workers. Am. J. Epidemiol. 1999, 149, 135–142. [Google Scholar] [CrossRef] [Green Version]
  28. Van Wijngaarden, E.; Savitz, D.A.; Kleckner, R.C.; Cai, J.; Loomis, D. Expsoure to electromagnetic fields and suicide among electric utility workers: A nested case-control study. Occup. Environ. Med. 2000, 57, 258–263. [Google Scholar] [CrossRef] [PubMed] [Green Version]
  29. Miller, A.B.; To, T.; Agnew, D.A.; Wall, C.; Green, L.M. Leukemia following occupational exposure to 60 Hz electric and magnetic fields among Ontario electricity utility workers. Am. J. Epidemiol. 1996, 144, 150–160. [Google Scholar] [CrossRef]
  30. Washburn, E.P.; Orza, M.J.; Berlin, J.A.; Nicholson, W.J.; Todd, A.C.; Frumkin, H.; Chalmers, T.C. Residential Proximity to Electricity Transmission and Distribution Equipment and Risk of Childhood Leukemia, Childhood Lymphoma, and Childhood Nervous System Tumors: Systematic Review, Evaluation, and Meta-analysis. Cancer Causes Control 1994, 5, 299–309. [Google Scholar] [CrossRef]
  31. Merchant, C.J.; Renew, D.C.; Swanson, J. Exposures to Power-frequency Magnetic Fields in the Home. J. Radiol. Prot. 1994, 14, 77–87. [Google Scholar] [CrossRef]
  32. Preece, A.W.; Grainger, P.; Golding, J.; Kaune, W. Domestic Magnetic Field Exposures in Avon. Phys. Med. Biol. 1996, 41, 71–81. [Google Scholar] [CrossRef]
  33. Alborov, I.D.; Burdzieva, O.G.; Tedeeva, F.G.; Alborov, S.T.; Alborova, D.I. The impact of the mining and processing industry on the ecosphere. In Proceedings of the III All-Russian (National) Scientific and Practical Conference with International Participation “Modern Scientific, Technical and Social and Humanitarian Research: Current Issues, Achievements and Innovations”, Vladikavkaz, Russia, 24–26 May 2021; pp. 75–81. [Google Scholar]
  34. Alborov, I.D.; Tedeeva, F.G.; Glazov, A.P. Deformation of the natural landscape by the activities of mining and metallurgical production in the Republic of North Ossetia-Alania. Life Saf. 2018, 2, 9–11. (In Russian) [Google Scholar]
  35. Zaalishvili, V.B.; Kanukov, A.S.; Korbesova, K.V. Pollution of urbanized territories by motor transport using the example of the republic of North Ossetia—Alania. In Proceedings of the E3S Web of Conferences, Moscow, Russia, 19–22 November 2019; Volume 164, p. 07024. [Google Scholar] [CrossRef]
  36. Burdzieva, O.G.; Zaalishvili, V.B.; Beriev, O.G.; Zaks, T.V.; Kanukov, A.S. On the environmental aspects of modern urbanized territory during strong earthquakes. Earthq. Eng. Constr. Saf. 2012, 3, 62–67. [Google Scholar]
  37. Burdzieva, O.G.; Zaalishvili, V.B.; Beriev, O.G.; Kanukov, A.S.; Maisuradze, M.V. Influence of mining activities on environmental pollution. Geol. Geophys. Russ. South 2014, 4, 8–13. [Google Scholar]
  38. Zaalishvili, V.B.; Burdzieva, O.G.; Zaks, T.V.; Kanukov, A.S. Investigation of ecogeophysical factors of the environment of Vladikavkaz. In Proceedings of the E3S Web of Conferences, Moscow, Russia, 19–22 November 2019; Volume 164, p. 07026. [Google Scholar] [CrossRef]
  39. Zhang, C.S. Using multivariate analyses and GIS to identify pollutants and their spatial patterns in urban soils in Galway, Ireland. Environ. Pollut. 2006, 142, 501–511. [Google Scholar] [CrossRef]
  40. Wang, M.E.; Bai, Y.Y.; Chen, W.P.; Markert, B.; Peng, C.; Ouyang, Z.Y. A GIS technology based potential eco-risk assessment of metals in urban soils in Beijing, China. Environ. Pollut. 2012, 161, 235–242. [Google Scholar] [CrossRef]
  41. Hoek, G.; Brunekreef, B.; Goldbohm, S.; Fischer, P.; van den Brandt, P.A. Association between mortality and indicators of traffic-related air pollution in the Netherlands: A cohort study. Lancet 2002, 360, 1203–1209. [Google Scholar] [CrossRef] [Green Version]
  42. Künzli, N.; Kaiser, R.; Medina, S.; Studnicka, M.; Chanel, O.; Filliger, P.; Herry, M.; Horak, F., Jr.; Puybonnieux-Texier, V.; Quenel, P.; et al. Public-health impact of outdoor and traffic-related air pollution: A European assessment. Lancet 2000, 356, 795–801. [Google Scholar] [CrossRef]
  43. Wjst, M.; Reitmeir, P.; Dold, S.; Wulff, A.; Nicolai, T.; Vonloeffelholzcolberg, E.F.; Vonmutius, E. Road traffic and adverse-effects on respiratory health in children. Br. Med. J. 1993, 307, 596–600. [Google Scholar] [CrossRef] [Green Version]
  44. Janssen, N.A.H.; Brunekreef, B.; van Vliet, P.; Aarts, F.; Meliefste, K.; Harssema, H.; Fischer, P. The relationship between air pollution from heavy traffic and allergic sensitization, bronchial hyperresponsiveness, and respiratory symptoms in Dutch schoolchildren. Environ. Health Perspect. 2003, 111, 1512–1518. [Google Scholar] [CrossRef] [PubMed] [Green Version]
  45. Lienesch, L.A.; Dumont, J.N.; Bantle, J.A. The effect of cadmium on oogenesis in xenopuslaevis. Chemosphere 2000, 41, 1651–1658. [Google Scholar] [CrossRef]
  46. Dehghani, M.; Keshtgar, L.; Javaheri, M.R.; Derakhshan, Z.; Conti, G.O.; Zuccarello, P.; Ferrante, M. The effects of air pollutants on the mortality rate of lung cancer and leukemia. Mol. Med. Rep. 2017, 15, 3390–3397. [Google Scholar] [CrossRef] [PubMed] [Green Version]
  47. Chen, T.B.; Wong, J.W.C.; Zhou, H.Y.; Wong, M.H. Assessment of trace metal distribution and contamination in surface soils of Hong Kong. Environ. Pollut. 1997, 96, 61–68. [Google Scholar] [CrossRef]
  48. Cheng, J.-L.; Shi, Z.; Zhu, Y.-W. Assessment and mapping of environmental quality in agricultural soils of Zhejiang Province, China. J. Environ. Sci. China 2007, 19, 50–54. [Google Scholar] [CrossRef]
  49. Shi, W.; Liu, J.; Du, Z.; Song, Y.; Chen, C.; Yue, T. Surface modelling of soil pH. Geoderma 2009, 150, 113–119. [Google Scholar] [CrossRef]
  50. Yasrebi, J.; Saffari, M.; Fathi, H.; Karimian, N.; Moazallahi, M.; Gazni, R. Evaluation and comparison of ordinary kriging and inverse distance weighting methods for prediction of spatial variability of some soil chemical parameters. Res. J. Biol. Sci. 2009, 4, 93–102. [Google Scholar]
  51. Gotway, C.A.; Ferguson, R.B.; Hergert, G.W.; Peterson, T.A. Comparison of kriging and inverse-distance methods for mapping soil parameters. Soil Sci. Soc. Am. 1996, 60, 1237–1247. [Google Scholar] [CrossRef]
  52. Webster, R.; Oliver, M.A. (Eds.) Geostatistics for Environmental Scientists, 2nd ed.; Wiley: Hoboken, NJ, USA, 2007. [Google Scholar]
  53. Aguilar, F.J.; Aguera, F.; Aguilar, M.A.; Carvajal, F. Effects of terrain morphology, sampling density, and interpolation methods on grid DEM accuracy. Photogramm. Eng. Remote Sens. 2005, 71, 805–816. [Google Scholar] [CrossRef] [Green Version]
  54. Shepard, D. A Two-Dimensional Interpolation Function for Irregularly-Spaced Data; ACM: New York, NY, USA, 1968. [Google Scholar]
  55. Muller, G. Index of geoaccumulation in sediments of the Rhine River. GeoJournal 1969, 2, 108–118. [Google Scholar]
  56. Ji, Y.Q.; Feng, Y.C.; Wu, J.H.; Zhu, T.; Bai, Z.P.; Duan, C.Q. Using geoaccumulation index to study source profiles of soil dust in China. J. Environ. Sci. 2008, 20, 571–578. [Google Scholar] [CrossRef]
  57. Loska, K.; Wiechuła, D.; Korus, I. Metal contamination of farming soils affected by industry. Environ. Int. 2004, 30, 159–165. [Google Scholar] [CrossRef]
  58. Förstner, U.; Ahlf, W.; Calmano, W.; Kersten, M. Sediment Criteria Development. Contributions from Environmental Geochemistry to Water Quality Management; Technische Universität Hamburg: Hamburg, Germany, 1990. [Google Scholar]
  59. USEPA. Guidelines for the Health Risk Assessment of Chemical Mixtures; USEPA: Washington, DC, USA, 1986. [Google Scholar]
  60. Zaalishvili, V.B.; Burdzieva, O.G.; Kanukov, A.S.; Arkhireeva, I.G.; Dzobelova, L.V.; Korbesova, K.V.; Margoshvili, M.T. Morbidity of the population of an urbanized area in an unfavorable environmental situation. In Modern Problems of Geology, Geophysics and Geoecology of the North Caucasus; Collective Monograph Based on the Materials of the IX All-Russian Scientific and Technical Conference; CGI RAS: Vladikavkaz, Russia, 2019; pp. 598–603. (In Russian) [Google Scholar]
  61. Burdzieva, O.G.; Beriev, O.G.; Zaks, T.V. Influence of Environmental Factors on the Ecological Well-Being and Health of the City of Vladikavkaz Monograph; Publishing House of the Geophysical Institute-Branch of the Vladikavkaz: Vladikavkaz, Russia, 2019; 247p, ISBN 978-5-904868-24-6. (In Russian) [Google Scholar]
  62. Burdzieva, O.G.; Beriev, O.G.; Zaks, T.V.; Kanukov, A.S. The relationship between the distribution of heavy metals in an urbanized area and cancer morbidity. Proc. Kabard.-Balkar. Sci. Cent. Russ. Acad. Sci. 2016, 74, 102–108. (In Russian) [Google Scholar]
  63. Zaalishvili, V.B.; Beriev, O.G.; Burdzieva, O.G.; Kanukov, A.S.; Zaks, T.V. Relationship between technogenic pollution of the urbanized area with mining waste and morbidity of the population. In Dangerous Natural and Technogenic Geological Processes in the Mountainous and Foothill Areas of the North Caucasus; Zaalishvili, V.B., Ed.; Publishing House of the Geophysical Institute-Branch of the Vladikavkaz: Vladikavkaz, Russia, 2010; pp. 433–438. (In Russian) [Google Scholar]
  64. Zaalishvili, V.B.; Burdzieva, O.G.; Zaks, T.V.; Kanukov, A.S.; Beriev, O.G. The study of the development of neoplasms among residents of an urbanized mountainous territory. In Young Scientists in Solving Urgent Problems of Science; VSC RAS: Vladikavkaz, Russia, 2011; pp. 148–152. (In Russian) [Google Scholar]
  65. Zaalishvili, V.B.; Beriev, O.G.; Burdzieva, O.G.; Kanukov, A.S. Pollution of the urbanized territory with industrial waste and morbidity of the population. In Geodynamics, Volcanism, Seismicity and Exogenous Geological Processes of Natural and Technogenic Nature in the Caucasus; Abstracts of the All-Russian Conference; CGI RAS: Vladikavkaz, Russia, 2014; p. 18. (In Russian) [Google Scholar]
  66. Zaalishvili, V.B.; Chotchaev, K.O.; Shempelev, A.G.; Melkov, D.A.; Burdzieva, O.G.; Parada, S.G.; Dzeranov, B.V.; Dzhgamadze, A.K. Geodynamic situation in Central Caucasus and structural complexes on depth section of Genaldon profile. In Proceedings of the VIII Science and Technology Conference “Contemporary Issues of Geology, Geophysics and Geo-Ecology of the North Caucasus” (CIGGG 2018) “Advances in Engineering Research”, Essentuki, Russia, 10–13 October 2018; pp. 325–331. (In Russian). [Google Scholar]
  67. Bekuzarova, S.A.; Tebieva, D.I.; Bekmurzov, A.D.; Kebalova, L.A.; Korbesova, K.V. Phytoremediation of air toxicity of roads. Geol. Geophys. Russ. South 2020, 10, 127–135. (In Russian) [Google Scholar] [CrossRef]
  68. Chotchaev, H.O.; Burdzieva, O.G.; Zaalishvili, V.B. Influence of geodynamic processes on the geoecological state of high mountain areas. Geol. Geophys. Russ. South 2020, 10, 70–100. (In Russian) [Google Scholar] [CrossRef]
  69. Chotchaev, H.O.; Burdzieva, O.G.; Zaalishvili, V.B. Zoning of high mountainous areas by geoecological loads caused by geodynamic and climatic influences. Geol. Geophys. Russ. South 2021, 11, 81–94. (In Russian) [Google Scholar] [CrossRef]
  70. Alborov, I.D.; Zaalishvili, V.B. Influence of wind conditions and pressure the influence of atmospheric air on the reliability of mine ventilation and the human body. Geol. Geophys. Russ. South 2021, 11, 148–159. (In Russian) [Google Scholar] [CrossRef]
  71. Bosikov, I.I.; Klyuev, R.V.; Tekiev, M.V. Analysis of spatial distribution of chemical elements of apatite-stafelite ore. Geol. Geophys. Russ. South 2021, 11, 137–157. (In Russian) [Google Scholar] [CrossRef]
  72. Zaalishvili, V.B.; Kanukov, A.S.; Korbesova, K.V. Assessment of the Impact of Road Traffic on the Pollution of Urbanized Territories. Geol. Geophys. Russ. South 2021, 11, 135–146. (In Russian) [Google Scholar] [CrossRef]
  73. Zaalishvili, V.B.; Burdzieva, O.G.; Kanukov, A.S.; Dzobelova, L.V. Development of cancerogenic risk index maps for the territory of Vladikavkaz. Geol. Geophys. Russ. South 2021, 11, 147–160. (In Russian) [Google Scholar] [CrossRef]
  74. Zalikhanov, M.C.; Kagermazov, A.K.; Sozaeva, L.T.; Bekkiev, K.M. About the possibility of using the output data of the global atmosphere model GFS NCEP in ecological research. Geol. Geophys. Russ. South 2021, 11, 161–169. (In Russian) [Google Scholar] [CrossRef]
Figure 1. Scheme of the main sources of environmental pollution for the territory of the Republic of North Ossetia–Alania.
Applsci 12 02644 g001
Figure 2. Map-scheme of areas of ecological situations in the mining regions of North Ossetia–Alania.
Applsci 12 02644 g002
Figure 3. Maps of soil pollution dynamics over time.
Applsci 12 02644 g003
Figure 4. Geoaccumulation index of cadmium and lead for the territory of Vladikavkaz.
Applsci 12 02644 g004
Figure 5. Carcinogenic risk index maps for lead and zinc for the territory of Vladikavkaz.
Applsci 12 02644 g005
Figure 6. Non-carcinogenic risk index maps for lead and cadmium for the territory of Vladikavkaz.
Applsci 12 02644 g006
Figure 7. Maps of noise pollution and distribution of the electric field level (V/m) registered in the territory of Vladikavkaz.
Applsci 12 02644 g007
Figure 8. Average daily carbon monoxide concentrations in atmospheric air during the year, mg/m3.
Applsci 12 02644 g008
Figure 9. The incidence of malignant growths within the territory of urban polyclinics.
Applsci 12 02644 g009
Figure 10. Dependence of the percentage of cases on age group.
Applsci 12 02644 g010
Table 1. Dependence of the number of the cancer morbidity cases on age groups.
Polyclinic No.The Number of Cancer Morbidity Cases in Different Age Groups
Total Number18–2930–3940–4950–5960–6970 and Older
118433757217335439758
348381034102109220
416612341121294328851
5737112665120197316
710452537113236311323
Publisher’s Note: MDPI stays neutral with regard to jurisdictional claims in published maps and institutional affiliations.

