Article

Modelling Approach for the Prediction of Machinability in Al6061 Composites by Electrical Discharge Machining

by
Hariharan Sree Ram
1,
Marimuthu Uthayakumar
1,*,
Shanmugam Suresh Kumar
1,
Sundaresan Thirumalai Kumaran
1 and
Kinga Korniejenko
2
1
Faculty of Mechanical Engineering, Kalasalingam Academy of Research and Education, Krishnankoil 626126, India
2
Faculty of Materials Engineering and Physics, Cracow University of Technology, al. Jana Pawła II 37, 31-864 Kraków, Poland
*
Author to whom correspondence should be addressed.
Submission received: 3 February 2022 / Revised: 2 March 2022 / Accepted: 3 March 2022 / Published: 4 March 2022
(This article belongs to the Special Issue Modeling of Metal Removal Processes)

Abstract

:

Featured Application

Aerospace and automobile industries.

Abstract

This work aims to identify the pattern for the major output parameters, material removal rate (MRR) and surface roughness (Ra) of different combinations of Al6061-based composites. Based on the verification carried out on these patterns using analysis of variance (ANOVA) as the mathematical tool, the work predicts the mentioned output characteristics while machining Al6061 composites of different material compositions based on their hardness values. ANOVA was employed for the generation of equations of the particular composite. The equations were compared for the coefficients of each parameter employed in ANOVA. The work was carried out comparing the characteristic equation of different combinations of Al6061-based composite. The results indicate that the coefficients of the current show a drastic variation when compared to other coefficients for both the output parameters. It was observed that the current and its coefficients contribute to the output parameters based on the variation in hardness. For surface roughness, the constant of the characteristic equation was also found to influence the parameter for the change in hardness. The equation derived for both material removal rate (MRR) and surface roughness (Ra) were identified to be matching with the experimental result carried out for validation. The average variation observed was 9.3% for MRR and 7.2% for surface roughness.

1. Introduction

The requirement of improved strength-to-weight ratio materials has led to the introduction of composite materials in many applications such as structural, automotive, space, manufacturing, etc. The major challenges while switching over to composite materials from conventional metals or alloys is the machining of the material to the required size and shape. Obtaining the materials of near-net shape requires a machining process. Therefore, machining becomes necessary for the manufacturing of a part using composite materials. This leads to the use of nonconventional machining processes where the tool and workpiece will never have physical contact and the machining is carried out by using a spark or chemical process or by using a water jet. In the nonconventional machining process, recent trends have inclined towards EDM due to its cost effectiveness and the capability to handle various composites effectively. These reasons have persuaded a lot of manufacturers to opt for EDM as a machining process for hard-to-machine composite material, mainly metal matrix composites for manufacturing different components.
Natraj and Ramesh [1] worked on optimising the parameters of Al6061-5% Al2O3-3% SiC-2% E-glass in EDM. The work identified current and pulse-on time as the major contributors in surface roughness and MRR. It was also identified, using the Box–Behnken design of experiments of response surface methodology (RSM) that optimum current was 12.4 A, pulse-on time was 30 µs and pulse-off time was 7 µs. The work also identified that the addition of E-glass did not affect the properties of the material. Murugesan and Balamurugan [2] developed an experimental analysis using the grey relation method for Al6061 reinforced with 15% SiC. The experiment was also conducted using a change of polarity of the workpiece. It was identified that the current was the significant contributor in the output parameters of MRR and surface roughness. It was also identified that the pulse-on time and the pressure of lubricant also plays a significant role in the output parameters. The identified optimal values for current, pressure of dielectric and pulse-on time were 4 A, 0.5 kg/cm2 and 400 µs, respectively. The work also identified that a negative polarity of the electrode provided better results
Balbir Singh et al. [3] experimented to identify the contributing parameters for Al6061 with 10% SiC. The work concluded that the higher current increases the MRR and tool wear rate, but diminishes the surface roughness. The increase in pulse-on time increases the MRR as well as the surface roughness. The optimum values of pulse-on time and pulse-off time were identified to be in the range of 90 to 200 μs for better output parameters. Dey, S Debnath and Pandey [4] used grey relation analysis (GRA) along with the response surface methodology (RSM) approach to optimise the Al6061 cenosphere composite. It was identified that the hybrid approach is able to provide an improved result when compared with the initial experimental results. The optimum values identified were a pulse current of 9.9126 A, pulse-on time of 210.002 μs, reinforcement content of 3.6936% and flushing pressure of 0.5999 MPa. Wuyi Ming et al. [5] worked on optimising the parameters for Al6061, Inconel and SKD11. The work identified that the percentage of energy transferred to the workpiece was small for all three materials. The range of energy transfer to the workpiece was identified to be between 8 and 12% for Al6061 and between 3 and 4% for Inconel and SKD 11. It was also identified that for difficult-to-cut materials, the increase in discharge current reduced specific discharge energy, but the energy distribution to the workpiece was found to be constant.
Narendra Singh et al. [6] conducted ANOVA-based analysis on Al6061 with 10% SiC. The work identified that the increase in current and pulse-on time increased the parameters considered, which were mainly MRR and surface roughness. By using RSM, the MRR was improved by 30.13% in powder-mixed EDM and 24.27% in normal EDM. Rajkumar et al. [7] worked on Al6061 reinforced with boron carbide and graphite, manufactured using stir casting and heat-treated through two different processes, which were conventional and microwave-based heat treatment. The work also identifies current and pulse-on time as the major parameters contributing to MRR and surface roughness. The design values were identified to be 9 A current and 46 μs pulse-on time for the optimum results. Nandakumar and Kanakaraj [8] studied the mechanical properties of two different aluminium-based composites. It was concluded that the increase in the addition of graphite and SiC had enhanced the tensile strength and hardness, whereas addition of graphite in alumina-reinforced aluminium metal matrix composite does not provide any variation in tensile strength. Arunkumar and Swamy [9] carried out the study on the mechanical properties of the Al6061–fly ash-E-glass fibre composites. The work concluded that the addition of fly ash had improved the hardness and tensile strength by nearly 60–70%, whereas the addition of E-glass fibre had not shown any significant influence in the properties of the composite. Prasanth et al. [10] worked on comparing the mechanical properties of Al6061 mixed with SiC and graphite as the reinforcements. It was observed in the work that the addition of 12% SiC as the reinforcement increased hardness by 50% and tensile strength by 60%, whereas the addition of the same percentage of graphite reduced the hardness by 25% but increased the tensile strength by 60%. Nagendran et al. [11] studied the mechanical properties of Al6061 reinforced with SiC and titanium dioxide. The work identified that the tensile strength dropped when the addition of the reinforcement was more than 4% each in the matrix. However, hardness continued to increase with the increased reinforcement percentage. The hardness improvement was observed to be nearly 5.5% when 6% SiC and TiO2 was added to the base matrix. Nagendra Maurya et al. [12] studied the mechanical property of the Al6061 composite with different percentages of SiC. The work concluded that the hardness, as well as tensile strength of the composite, improved by 12.5% with 5% inception of SiC into the composite. Uthayakumar et al. [13] worked on functionally graded aluminium matrix composites for machining parameters of surface roughness, electrode wear rate, overcut and power consumption in EDM. The work aimed for the application of the material in a disc-brake rotor. The work identified that the pulse current plays a major role in the output parameters. The optimised values of current and pulse-on time were identified to be 5 A and 50 μs. Marafona and Araujo [14] conducted studies on the influence of the workpiece hardness on the EDM process for different alloys. It was identified in the work that the workpiece hardness and related parameters have significant influence on the surface roughness and MRR of the EDM process. The work aimed at developing a model based on the input data for steel, and identified that the derived model is able to predict the values with a maximum error of 5.2% for MRR and 0.8% for surface roughness to the experimental values. Raza et al. [15] conducted a study on Al6061-SiC composite using different electrodes on its performance variation for MRR and surface roughness. It was identified that brass electrode provided a better MRR and surface finish when compared to copper and steel electrodes. The brass electrode provided 23.2% higher MRR and 20.3% better surface finish when compared with copper electrode. Steel electrode provided 35.3% and 32.3% less MRR and surface finish, respectively. S. Singh [16] conducted a study on Al6061 with Al2O3 as the reinforcement using grey relational analysis. The work identified that pulse current is the major factor in determining the MRR and surface roughness of the composite. Kashif Ishfaq et al. [17] conducted an experimental study for the machining of Al6061-7.5% SiC composite using wire EDM. The work indicated on the challenges in the machining of Al6061-based composites. The work evaluated the magnitude of errors due to the wire vibrations and lag. The work evaluated the corner variations and errors in cutting orientations. These variations were expected due to the presence of SiC as the reinforcement element in the composite. The work identified that the lower current with a lower pulse-on time and a higher voltage provided low variations in the considered parameters. Doresamy et al. [18] worked on the optimization and modelling of wire EDM of Al6061-based composite reinforced with Silicon Carbide particles. The work identified the optimum parameters of current, pulse-on time, pulse-off time, voltage and wire speed for the MRR of the specimens. It was also identified that current is the major contributor for the considered parameter. A regression model was also developed for predicting the MRR for different compositions in this work. The optimum values were identified as current—5 A, ton—40 µs, toff—10 μs and voltage—90 V. H. Singh et al. [19] worked on the MRR and tool wear rate of Al6061 with copper and brass electrodes. The work identified that the MRR was maximal at a peak current of 15 A for both the electrodes, and that tool wear was minimal for copper electrode when compared to brass electrode.
Mythili and Thanigaivelan [20] carried out a study of wire EDM in Al6061-Al2O3 composite with reinforcement weight fractions of 6 and 8%. The influence of the input parameters of current, gap voltage, wire tension and dielectric pressure were considered for this work. The work concluded that the current is the major contributor for the variation in MRR and surface roughness. The optimum values were identified using TOPSIS analysis. N. Velmurugan et al. [21] worked on the development of a prediction tool using ANFIS to identify the surface quality of an Al6061-based composite by identifying current, wire feed, pulse-on time and pulse-off time. The work was able to predict the behaviour with very close proximity to the experimental results. The average error rate was observed to be 1.67%. Singh et al. [22] worked on Al6061 composites with SiC and graphite reinforcement with the independent variables of current, voltage, pulse duration and tool material. The study was carried out using ANOVA. The output parameters determined were MRR and Ra. The work identified that current is the major contributing factor and that an increase in current and pulse duration increased the MRR, but reduced surface finish. Meanwhile, the increase in voltage reduced MRR and surface finish. The work also identified that the electrode material has a significant contribution to the output parameters. Kareem et al. [23] studied the characteristics of Al6061 composites manufactured using stir casting and compared the material properties with the base alloy. It was identified in the work that the material properties were enhanced with the addition of reinforcement in the base alloys and that stir casting is an economic and efficient technique for the development of Al6061 composites. Amruth Babu and Gurupavan [24] worked on the wire EDM machining of Al6061 composite with various percentages of SiC added to it. The work was conducted with the input parameters of current, pulse-on time, pulse-off time and wire feed rate. It was identified that the surface roughness reduced with the addition of SiC in the base alloy. The work also identified that the increase in the percentage of SiC reduced the surface roughness. Thiagarajan et al. [25] carried out a study of the machining of Al6061 composite with nano SiC and nano ZrO2 as reinforcements using wire EDM, using ANOVA and multiresponse optimisation. The work identified that second-order mathematical equations are required to identify the influencing parameters for kerf width and surface roughness. The work also illustrated that there was a linear correlation between surface roughness and pulse-on time. The kerf width showed an exponential increase with increase in pulse-on time. The pulse-off time showed a directly opposite phenomenon when compared to pulse-on time. The increase in gap voltage showed a decrease in the kerf width as well as the surface roughness. Using multiresponse optimisation, the optimum values were identified—while keeping the input parameters—as 6.11 µs as pulse-on time, 6.52 µs as pulse-off time and 67.8 V as gap voltage. Anjani Srivastava et al. [26] worked on the optimisation of the EDM of the Al6061 composite with 8% SiC. The work applied response surface methodology (RSM) for the mathematical model, and the Box–Behnken Design (BBD) approach was employed for the experimental design. The input parameters employed were current, pulse-on time and duty cycle. The work evaluated the material removal rate (MRR), electrode wear rate (EWR) and surface roughness of the machined specimen. The variation in MRR was dominated by the current. The variation in EWR was dominated by pulse-on time and the surface roughness was dominated by current as well as pulse-on time. The optimum parameters for MRR were identified to be 8 A peak current, 183.84 msec Ton and 8.67 duty cycle using the theory of desirability. Bindya Devi et al. [27] carried out a comprehensive review on the recent trends in the machining of aluminum-based metal matrix composites in the recent scenario. The review covered the importance of EDM in the machining of difficult-to-machine composites of aluminum and identified the need for the prediction of the output parameters of an EDM process based on material properties and the input parameters. Shyn et al. [28] worked on the optimisation of major and minor process parameters in obtaining the MRR, EWR and Ra for Al6061-6% B4C metal matrix composites (MMC). Extensive work was carried out with the input parameters as current, spark-on time, spark-off time, pulse-on time, gap voltage, duty factor and flushing pressure. The work used RSM to optimise the parameters. The MRR showed the output value at the error level of 0.167%, the surface roughness showed an error rate of 2.31% and the electrode wear rate showed an error in the range of 9.31% with the experimental value. Ishfaq et al. [29] worked on the machining of Al6061-7.5% SiC composite in high-speed wire EDM. The work aimed at optimizing the kerf width, surface roughness and cutting rate based on the input parameters of current, voltage and pulse-on time. The voltage was identified to be the dominating factor for surface roughness. Current was identified to be the dominating factor for kerf width and the pulse-on time was the dominating factor in cutting rate. A better surface finish was achieved with lower current and voltage. The Scanning Electron Microscope (SEM) images revealed that narrow craters are produced when the machining is carried out at lower voltage and current. RSM was used to predict the error levels in the corner accuracy as well as the cutting orientations. The model was able to predict the values within 5% error. M Singh and S Maharana [30] worked on EDM machining of Al6061 composite reinforced with SiC and graphite. The work was carried out with the input parameters, current, pulse-on time, pulse-off time and gap voltage and the output parameter was set as MRR. The work identified that voltage has very low significance in the MRR of the material. It was also identified that the current and pulse-on time are the major contributors to the MRR. Increased pulse-off time reduced the MRR. Golshan et al. [31] carried out an optimisation study of the Al/SiC composites using the nondominated sorting genetic algorithm, which is a multiresponse algorithm for identifying the optimum MRR and Ra of the composite. Since both output parameters are contrasting, the work chose a multiresponse algorithm to optimise both the parameters. Two different algorithms, the single genetic algorithm (SGA) and nondominated sorting genetic algorithm (NSGA-II) were identified for the optimisation, and the author finalised the work based on NSGA-II. The input parameters considered were current, pulse-on time, gap voltage and the volume fraction of SiC in the composite. The work identified that the optimisation in both MRR and Ra can be achieved by keeping the current and pulse-on time constant and varying the voltage and the volume fraction of SiC. This algorithm, once developed, can provide a proper optimised condition for the specified input parameters. Jithin and Suhas [32] carried out an extensive review on electric discharge texturing (EDT) which is a modified EDM used for different applications. The work discussed the diverse level of applications of EDT and different types of EDT adopted for these applications. The work elaborated on the different parameters which controls the output surface topology in EDT. The variation of the surface roughness due to the variation in the parameters was also detailed in the review paper. The development of deliberate surface modifications using EDM and EDT was also discussed. Various modelling methods with the comparison of the output models were carried out in this work. The work identified that 3D multicrater analysis is required for the proper modelling of EDT. Peta et al. [33] carried out research work on the surface topology of an EDM machining of Al6060 alloy with discharge energy as the only input parameter. The study identified the strong influence of discharge energy in the surface topology and the parameters linked with the discharge energy were managed automatically by the EDM machine. The work identified that the generated model failed at finer scales below 11 μm. The best results on the relationship of surface topology with discharge energy were identified to have occurred in the values ranging from 36 μm to 41 μm. Peta et al. [34] conducted investigative studies to identify the relationship between wettability and surface microgeometry of Al6060 alloy. The work was able to identify a strong correlation between parameters pertaining to surface texture and the wettability of the alloy. The size and shape of the surface created due to EDM was identified to have a direct link with the discharge energy and the contact angle, which is the inverse of wettability of the material. Joshi et al. [35] carried out machining of stainless-steel surfaces using copper electrode, employing dry EDM with a pulsating magnetic field. The pulsating magnetic field provided a rotating magnetic wave around the spark, thereby improving the spark density. It was identified that the MRR improved by 130% with zero electrode wear when dry EDM with a pulsating magnetic field was used for the machining. Dhadda et al. [36] worked on the enhancement of pool-boiling heat transfer of Al6061 alloy during EDM. The input parameters which were considered for the study were discharge current and pulse-on time. A data-dependant system was employed to identify the relation between the surface topology and boiling performance during the machining process. The average roughness parameter was identified to have a greater correlation with the crater diameter. Golshan et al. [37] carried out studies on the optimisation of parameters for drilling of Al7075 alloy which has been extensively used in the aerospace industry. The NSGA-II algorithm was used for the development of optimised surface roughness and the dimensional error of the drilled hole. The cutting speed, feed rate and drill diameter were taken as the important input parameters for the model. A linear pattern was observed for the relations between the dimensional error and the surface roughness. The algorithm was able to successfully identify the dimensional error for the required surface roughness or vice versa. Saravanan et.al. [38] carried out numerical and finite-element analysis (FEA) for simulating drilling in CFRP laminates and the results were compared with the experimental result. The numerical analysis was carried out using a genetic algorithm. The results indicate that the variations observed using the FEA showed 20% variation and the genetic-algorithm-based mathematical model showed a variation in the range of 10%. The numerical analysis also identified the optimised condition for the input parameters for the improved output parameters.
Identification of the optimum input parameters had been a major challenge in the machining of the composites using EDM. In an EDM process, a spark between the tool and the workpiece through a dielectric medium leads to material removal from the workpiece. The process of material removal is very complex, as the phase change from a solid to plasma state of the material of the workpiece and the removal of material by the flowing dielectric also plays a vital part in the proper material removal and the surface roughness of the final component. Proper removal of the materials from the workpiece due to sparks reduces the chance of formation of a white layer on the surface of the workpiece. The re-solidification of the molten metal during the pulse-off time leads to the formation of a white layer on the surface of the workpiece. This formation of white layers on the machined surface of workpiece due to resolidification of the melted material also adds to the uncertainty of the output parameters such as MRR and surface roughness.
The referred works indicate that the material property of the workpiece had a vital role in the output parameters of the machining. This work aims to predict the output parameters linking it with hardness, which is identified to be one of the major properties of a composite material [14]. This work aims to provide a prediction of the different output parameters based on the experimental values obtained by Singh [16], Raza [15], Murugesan [2] and Nataraj [1] in the machining of different combinations of Al6061 composites and to compare the mathematical models to identify and predict the output parameters based on the variation of these parameters. The mathematical model was validated by carrying out experiments on a different combination of Al6061 composite, viz. Al6061-1% SiC metal matrix composite.
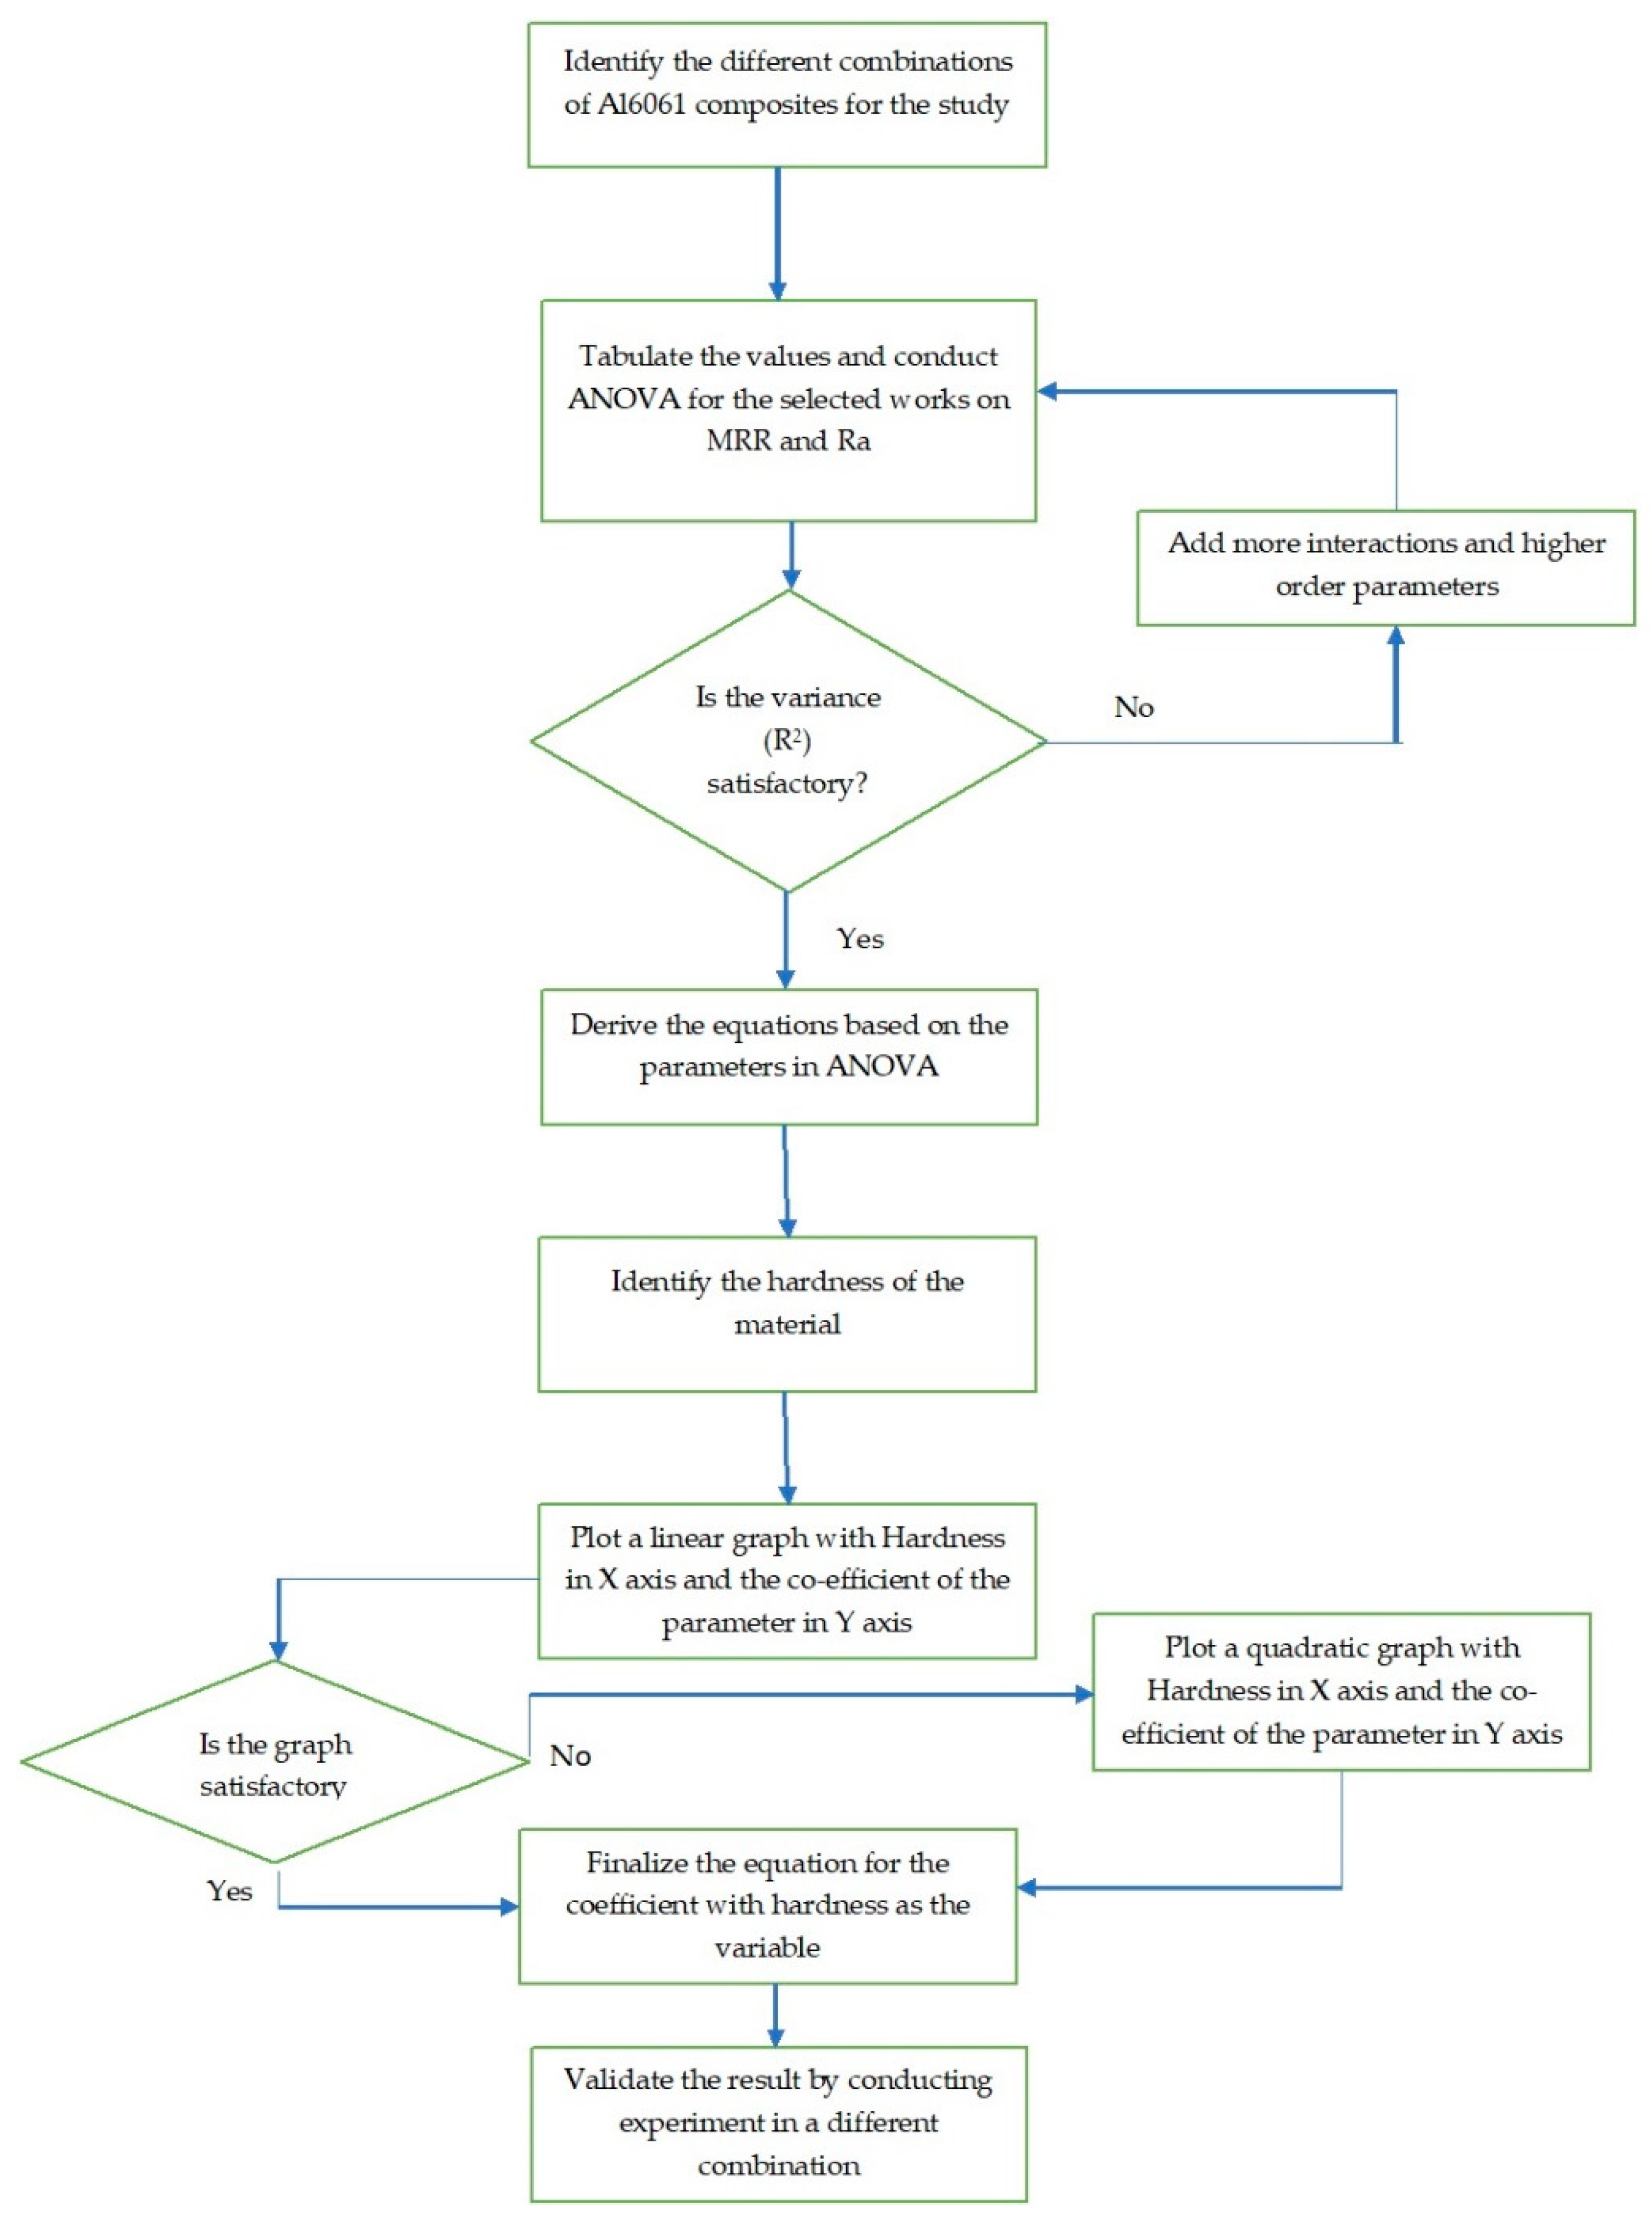
The objectives of the present work are:
  • To identify the optimum mathematical model for Al6061 metal matrix composite with different combinations of reinforcements, mainly SiC;
  • To identify the pattern of variation of coefficients of different input parameters used in the mathematical model based on the hardness of each material;
  • To create an equation for each coefficient, thereby predicting the mathematical model for a new combination once the hardness of the material is obtained;
  • To verify the derived equations by carrying out experiments on Al6061-1% SiC MMC and comparing the model results with the experimental results.

2. Materials and Methods

This section provides insight on the methodology adopted for the composite preparation, characterisation and testing, mathematical modelling, experimental plan and validation of the model by comparing the results obtained from the experimental work.

2.1. Materials

The base material employed for this work was Al6061 alloy steel. The base material was supplied by M/s Coimbatore Metal Mart, Coimbatore, Tamil Nadu, India. The reinforcement used for the improvement of mechanical properties was silicon carbide (SiC). The reinforcement material was supplied by M/s Carborundum Universal, Kochi, Kerala, India. The percentage of SiC added were 1%, 3%, 5% and 9%. The composite with 1% SiC was used for the validation of the model. The manufacturing process employed for the composite was stir casting (Figure 1.). The methodology adopted was as follows:
  • The casting die was preheated to 400 °C;
  • An Al6061 cylindrical rod of 25 mm diameter, cut to a length of 100 mm, was added to the crucible and kept in the furnace.
  • The base material was heated to the temperature of 850 °C for taking it above the liquidous state.
  • The molten metal was stirred using a stirrer at 700 rpm and allowed to cool down slowly.
  • The reinforcement (SiC) powder was slowly added to the molten metal without stopping the stirring action.
  • 2% magnesium was added to the molten composite to improve its wettability.
  • The molten mixture was poured into the preheated rectangular die of size 200 mm × 150 mm × 30 mm to obtain the final composite.
  • The poured composite was allowed to cool down in the die to obtain the final specimen in the solid condition.
The fabricated composite material is examined via Scanning Electron Microscope (SEM), optical microscope and Energy Dispersive X-ray Analysis (EDAX) for microstructural characterisation. The optical microscope employed for the analysis was QS–17AT manufactured by M/s QS Metrology (New Delhi, India). The magnifications available in the microscope were 100, 200 and 400× (10× at the eyepiece and 10, 20, and 40× at the achromatic objective). It is understood that the uniform distribution reinforced particles in the matrix. The SEM, optical microscope and the EDAX images of the specimen are provided in Figure 2 and Figure 3, respectively. The SEM images of the sample clearly indicate the presence of reinforcement in the grain boundaries, refining the grain boundaries and improving the material properties. The sample preparation for the SEM and microscopic analysis consists of the following steps:
  • A piece with a square cross section with length 80 mm and 25 mm side was cut from the specimen;
  • The sample to be tested was first polished manually using a series of emery papers 1/0, 2/0, 3/0 and 4/0;
  • The hand-polished specimen was repolished by using a mechanically rotating wheel covered with polishing cloth, and simultaneously, alumina powder mixed in water was poured on the wheel area where polishing was carried out;
  • For mirror-type surface finish, diamond paste was used on the clean surface;
  • The sample was cleaned using flowing water and Kellars etchant, which is a mixture of nitric, hydrochloric and hydrofluoric acid applied on the surface to reveal the microstructure.
  • The sample is dried using a hand drier and carefully covered and preserved for microstructure analysis without any contact with the polished surface.
The EDAX image of the composite shows that the material composition in the final composite is satisfactory. The elements which are part of the Al6061 alloy as well as the reinforcement can be observed in the EDAX image. Therefore, it can be clearly identified that the reinforcement is uniformly distributed in the specimen. The proper reinforcement distribution in the base matrix, especially at the grain boundaries, plays an important role in determining the machinability of the fabricated composite. The deposit of the reinforcements in grain boundaries provides substantial improvement to the material’s properties of the base matrix material. An improper mixing of the reinforcement can affect the machining outputs, as the machining at different settings is carried out in the same specimen at different areas. Therefore, a variation in the distribution will vary the material’s properties and thereby provide an erratic result for the researcher. The changes in the machinability of the material can be predicted by modelling and optimisation tools.
The cast composite was machined using EDM at M/s A1 cosmic tools, Coimbatore. The machining was carried out using 25 mm diameter copper rod as electrode and for different parameters of current (A), pulse-on time (Ton) and pulse-off time (Toff). The values of the parameters used is provided in Table 1. After machining, the specimen was tested for surface roughness in the surface tester, Mitutoyo-surftest SJ 201 manufactured by Mitutoyo, Kanagawa, Japan with the precision level of 0.01 μm. The MRR was calculated by weighing the specimen prior to and after completing each experimental work and dividing the weight difference with the time consumed for the machining.
Figure 4 shows the EDM used for the machining of the composite. Altra ZNC7040 model EDM was employed for the machining of the composite. The voltage was set to a constant value of 210 V and the flushing pressure was kept at 0.5 kg/cm2. The electrol EDM oil (Viscosity CST at 30 °C is 2.16 cs) was used as dielectric medium for the machining work. The depth of machining was set to 10 mm for all the experiments.
The hardness of the composite was tested using a Vickers hardness-testing machine located at Amal Jyothi College of Engineering, Kottayam, Kerala, and was converted to HRB using standard table. The hardness was tested for a load of 10 N with a dwell time of 10 s. The hardness was measured at three different spots for all the samples used for regression analysis as well as for the validation. The average of the values for each sample were taken as the final hardness.
Based on the hardness value obtained, the values of MRR and surface roughness were determined using the coefficient equations derived based on the previous results obtained using various literatures, as well as the results of the experiments carried out for regression analysis. The values based on the mathematical modelling were validated by comparing them with the values obtained through the validation experiment.

2.2. Methodology

The flow chart of the methodology adopted is depicted in Figure 5. The following steps were adopted to obtain the final results:
  • The work was initiated by locating the works of different combinations of Al6061 composites reinforced with different percentages of SiC varying from 3% to 15%;
  • The experimental values of different works carried out by different researchers on Al6061 composites were taken as the input for the present work. The values were used to create the mathematical models using analysis of variance (ANOVA), satisfying the requirements of variance (R2) level above 85%;
  • The mathematical equations were developed for the MRR and surface roughness (Ra) based on the ANOVA;
  • The mathematical equations developed for different combinations were based on different parameters were listed down and compared for materials under consideration;
  • The coefficients of each considered parameter were compiled and a graph was generated with the parameter on Y-axis and the hardness on X-axis. This graph was also checked for its precision levels and the best matching plots were taken for further studies;
  • This pattern was used to create equations based on hardness for the coefficients of different parameters under consideration and these values were used to predict the output parameters;
  • Based on the equations, for a new material combination of Al6061 with different hardness, the MRR as well as Ra can be predicted for the specified input parameters;
  • The result was validated through the following steps:
    Manufacture the composite with a different combination using stir casting;
    Measure the hardness of the composite;
    Carry out experiments in EDM using a set of readings similar to the values used for the regression analysis;
    Carry out SEM analysis for the uniformity of the reinforcement in the composite;
    Measure the MRR and Ra of the machined composite;
    Calculate the MRR and Ra based on the developed mathematical model;
    Compare the two values and identify the error;
    Based on the error, discuss the applicability of the mathematical model on application for the similar composites.

3. Results and Discussion

The work was conducted based on Al6061 with different compositions of SiC. The input parameters considered were current (A), pulse-on time (Ton) and pulse-off time (Toff). The developed ANOVA considered ONE degree of freedom for all the terms.
The ANOVA table and the mathematical formulation were prepared. Table 2 and Table 3 provide the summary of the ANOVA for the materials considered for the work. The first four material data were taken from the already published manuscripts [1,2,15,16] and the last three materials were developed and experimented to obtain a satisfactory regression equation to enable the extrapolation.
The characteristic equations obtained were:
MRR = −0.438 + 0.0286 A + 0.00245 Ton + 0.00334 Toff − 0.00457 A ∗ A − 0.000004 Ton ∗ Ton − 0.000075 Toff ∗ Toff + 0.000249 A ∗ Ton
Ra = −0.11 + 0.605 A + 0.0327 Ton − 0.269 Toff + 0.0207 A ∗ A − 0.000006 Ton ∗ Ton + 0.00230 Toff ∗ Toff − 0.00151 A ∗ Ton
MRR = −0.097 + 0.0159 A + 0.001577 Ton − 0.000152 Toff − 0.000008 A ∗ A − 0.000005 Ton ∗ Ton + 0.000001 Toff ∗ Toff + 0.000030 A ∗ Ton − 0.000032 A ∗ Toff
Ra = 6.34 − 0.012 A + 0.00453 Ton − 0.01110 Toff + 0.00209 A ∗ A − 0.000005 Ton ∗ Ton + 0.000024 Toff ∗ Toff − 0.000061 A ∗ Ton + 0.000217 A ∗ Toff
MRR = −0.079 + 0.01075 A + 0.00073 Ton + 0.0042 Toff − 0.000214 A ∗ A + 0.000000 Ton ∗ Ton − 0.00005 Toff ∗ Toff − 0.000008 A ∗ Ton − 0.000095 A ∗ Toff
Ra = −27.8 + 0.526 A + 0.408 Ton + 4.94 Toff − 0.0155 A ∗ A − 0.00398 Ton ∗ Ton − 0.305 Toff ∗ Toff + 0.00224 A ∗ Ton + 0.0467 A ∗ Toff
MRR = −0.0218 + 0.00683 A + 0.00155 Ton + 0.00040 Toff + 0.000139 A ∗ A − 0.000004 Ton ∗ Ton − 0.000087 Toff ∗ Toff − 0.000016 A ∗ Ton − 0.000053 A ∗ Toff
Ra = −0.78 + 0.342 A + 0.335 Ton − 0.694 Toff + 0.0217 A ∗ A − 0.00544 Ton ∗ Ton + 0.0478 Toff ∗ Toff − 0.0118 A ∗ Ton + 0.0410 A ∗ Toff
The first set of material taken was Al6061-15% SiC based on the work by Murugesan and Balamurugan [2]. The work included 18 experiments, out of which 9 experimental values were adopted, ignoring the 9 values tabulated with a different polarity of electrode and workpiece. The input values considered for the experiment were: A (4, 8 and 12 A), Ton (200, 400 and 600 μs) and Toff (20, 40 and 60 μs). The equations obtained are provided as Equations (1) and (2). The second material considered was Al6061-20% Al2O3. The input for this work was taken from Singh [16]. A total of 18 experiments in his work were used for this ANOVA. The values of A were 10, 15 and 20 A; the values of Ton were 50, 100 and 200 μs; and the values of Toff were calculated based on the duty cycles of 0.4, 0.5 and 0.7. The equations obtained are provided as Equations (3) and (4). The third material considered for the work was Al6061-5% Al2O3-3% SiC-2% E-glass [1]. The ANOVA was generated with 15 experimental values provided by the author. The experiment was carried out for three values of A (5, 10 and 15 A), Ton (30, 40 and 50 μs) and Toff (7, 8 and 9 μs). The equations for MRR and surface roughness is provided in Equations (5) and (6).The fourth material considered was Al6061-7.5% SiC. The values were taken from the work of Raza et al. [15]. The work consisted of 15 experimental values. The input values of A were 3, 6 and 9; the values of Ton were 10, 20 and 30 μs; and the values of Toff were calculated based on the duty cycle of 0.7, 0.8 and 0.9. The equations obtained are provided in Equations (7) and (8).
The work pertaining to the Al6061 composites with the considered parameters was much smaller. Most of the works of Al6061 were identified to be in the area of wire EDM. Therefore, for the regression model, three composites were developed and EDM machining was carried out for these composites to identify a proper regression model. The composites developed were Al6061 with 3%, 5% and 9% SiC added to it with the average hardness value of 65, 69 and 75 HRB, respectively. Nine experiments each were carried out, with the values of current taken as 6, 9 and 12 A; the pulse-on times were taken as 36, 48 and 56 μs; and the pulse-off times were taken as 7, 8 and 9 μs. The characteristic equations for Al6061-3% SiC are provided as Equations (9) and (10), those of Al6061-5% SiC is provided as Equations (11) and (12) and for the Al6061-9% SiC composite are Equations (13) and (14).
MRR = −0.1 + 0.02203 A + 0.00167 Ton + 0.0016 Toff − 0.0011 A ∗ A − 0.0000036 Ton ∗ Ton + 0.00002 Toff ∗ Toff + 0.000122 A ∗ Ton − 0.000059 A ∗ Toff
Ra = −3.0494 + 0.0823 A + 0.0228 Ton + 0.4973 Toff + 0.0112 A ∗ A − 0.00544 Ton ∗ Ton − 0.0356 Toff ∗ Toff + 0.00223 A ∗ Ton + 0.0183 A ∗ Toff
MRR = −0.0287 + 0.018 A + 0.00183 Ton + 0.00125 Toff − 0.0007 A ∗ A − 0.000004 Ton ∗ Ton − 0.000002 Toff ∗ Toff + 0.00009 A ∗ Ton − 0.00005 A ∗ Toff
Ra = 1.0073 + 0.133 A + 0.1404 Ton − 0.298 Toff + 0.0164 A ∗ A − 0.00024 Ton ∗ Ton +0.0132 Toff ∗ Toff − 0.00194 A ∗ Ton + 0.0151 A ∗ Toff
MRR = 0.1321 + 0.00788 A + 0.00207 Ton + 0.000591 Toff +0.000448 A ∗ A + 0.000005 Ton ∗ Ton − 0.000057 Toff ∗ Toff + 0.000007 A ∗ Ton − 0.000037 A ∗ Toff
Ra = 7.093 + 0.2829 A + 0.4308 Ton − 1.4917 Toff + 0.0242 A ∗ A − 0.0046 Ton ∗ Ton − 0.0864 Toff ∗ Toff + 0.0105 A ∗ Ton + 0.0103 A ∗ Toff
The hardness of the considered composites is consolidated in Table 4.
Based on these inputs, graphs were plotted for the variations of each coefficient for the considered output parameters were plotted. The variation of each coefficient based on the hardness of the material is ascertained and the pattern of variation is identified by plotting graphs. The details of the graphs plotted for MRR are provided from Figure 6, Figure 7, Figure 8, Figure 9, Figure 10, Figure 11, Figure 12, Figure 13 and Figure 14 and those of surface roughness are provided from Figure 15, Figure 16, Figure 17, Figure 18, Figure 19, Figure 20, Figure 21, Figure 22 and Figure 23.
Figure 6, Figure 7, Figure 8, Figure 9, Figure 10, Figure 11, Figure 12, Figure 13 and Figure 14 show the variations in the coefficients with respect to hardness for the MRR. The equations derived for finding the coefficients based on the graphs for MRR considering the hardness in Brinell hardness number (HRB) are:
A = −6.34903846 × 10⁻⁵ ∗ HRB2 + 0.00747508 ∗ HRB − 0.19561562,
Ton = 3.97642998 × 10⁻⁵ ∗ HRB − 0.00090852,
Toff = −0.0001084 ∗ HRB + 0.0087219,
A2 = 7.5462 × 10⁻⁶ ∗ HRB2 − 0.0009 ∗ HRB + 0.0255,
Ton2 = −1.48915187 × 10⁻⁷ ∗ HRB + 6.05719921 × 10⁻⁶,
Toff2 = −2.984 × 10⁻⁷ ∗ HRB2 + 3.3609 × 10⁻⁵ ∗ HRB − 0.0009,
A × Ton = −5.8878 × 10⁻⁷ ∗ HRB2 + 7.0927 × 10⁻⁵ ∗ HRB − 0.002,
A × Toff = 2.1696 × 10⁻⁶ ∗ HRB − 0.0002,
Constant = 0.0009 ∗ HRB2 − 0.1028 ∗ HRB + 2.7796,
The coefficients of equations of MRR in tabular form is given in Table 5.
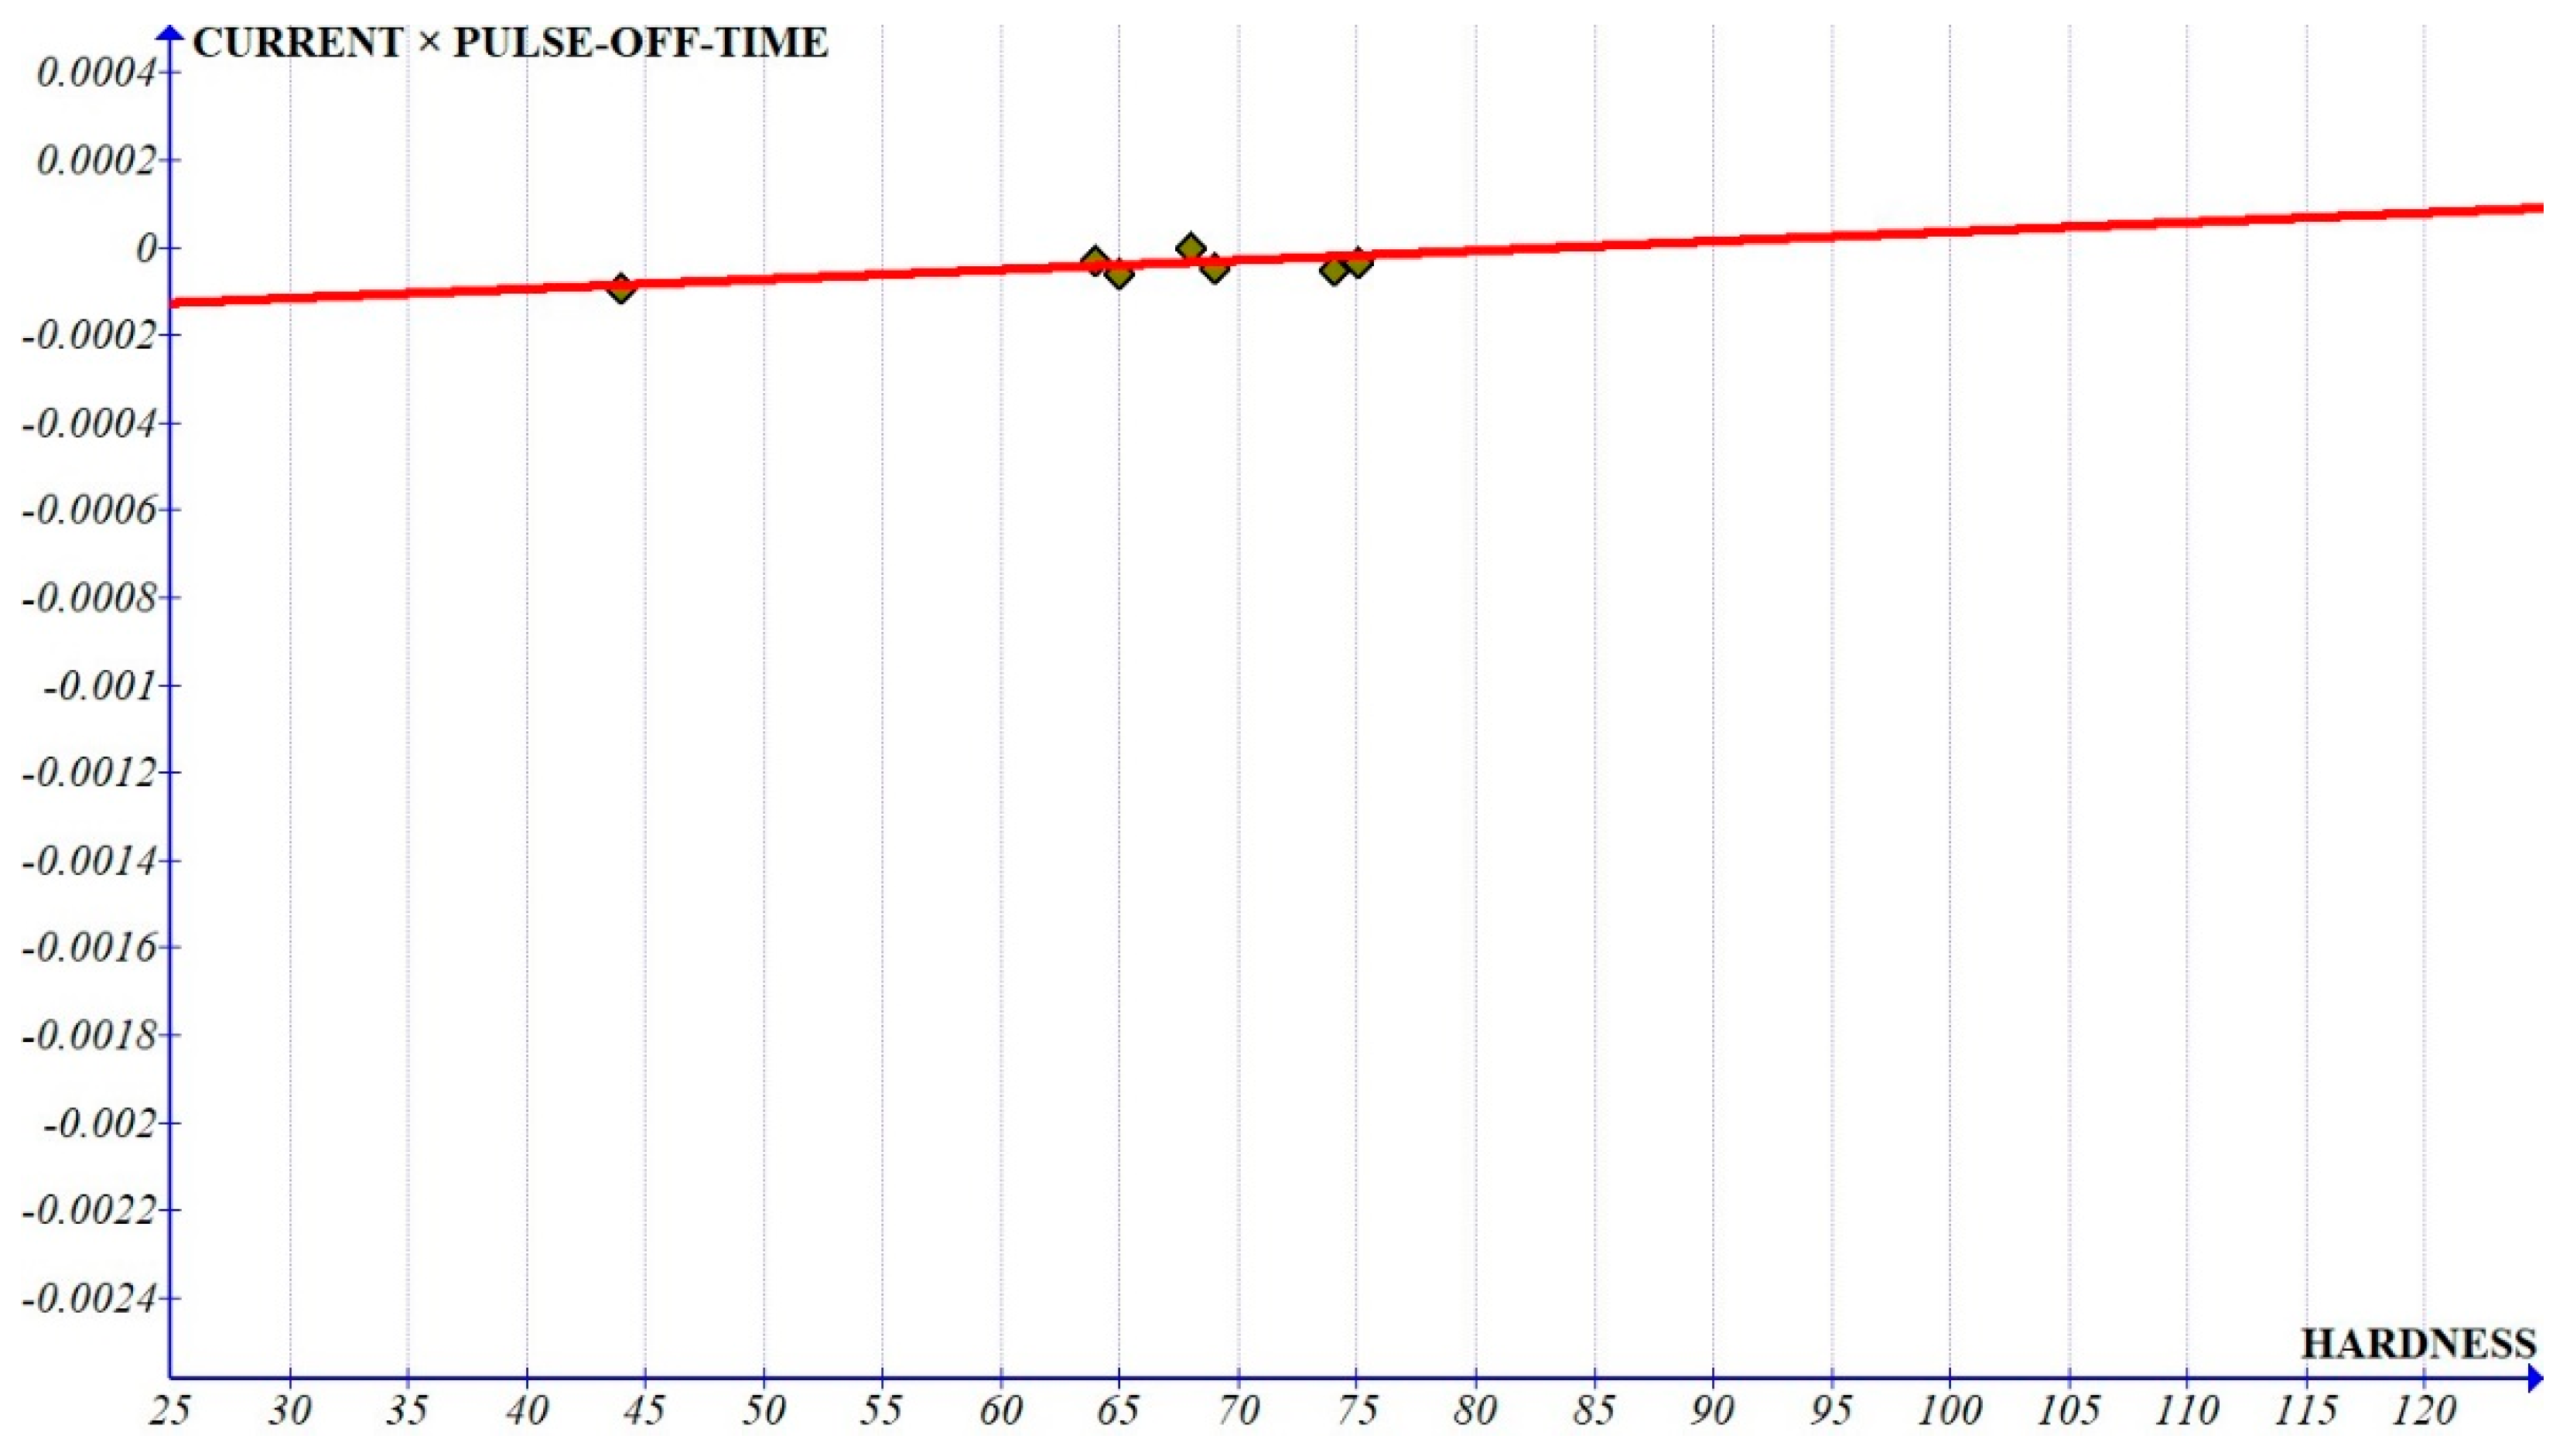
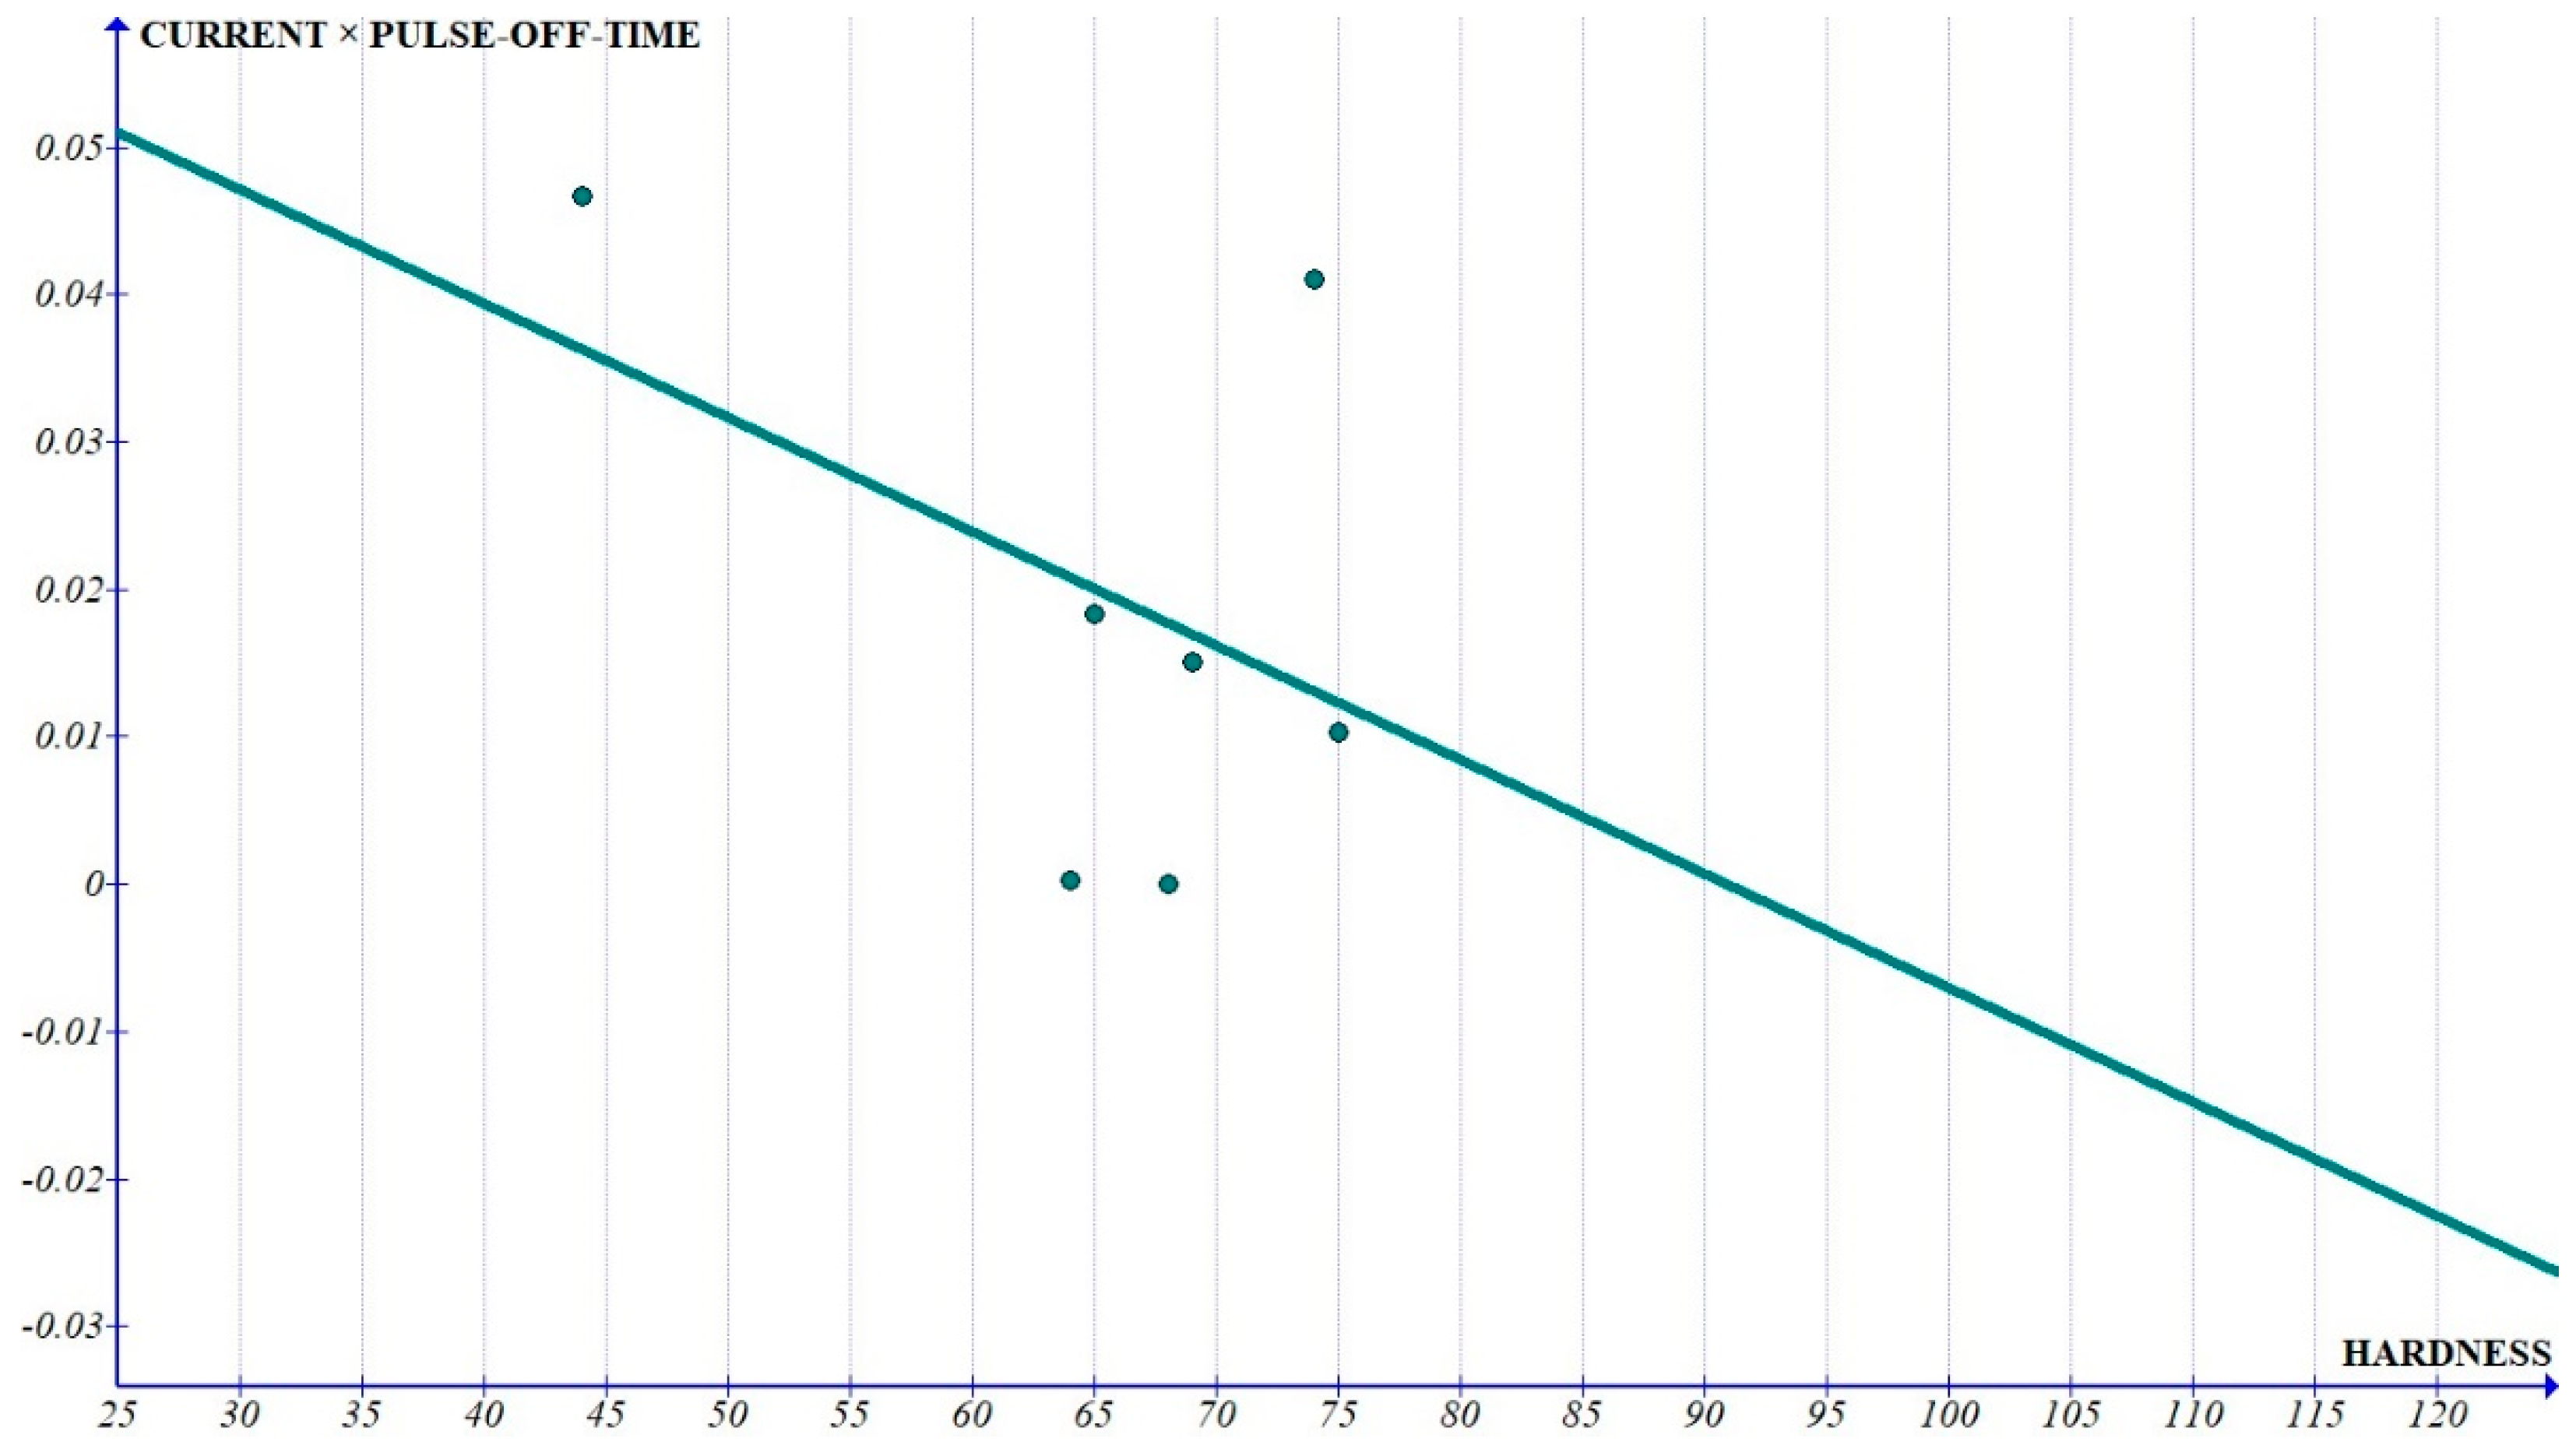
The curves of the interactions (Figure 10 and Figure 11) show a very small slope (in the range of 10−6) which implies that these coefficients can be considered as constants with respect to the hardness. Figure 6, Figure 8 and Figure 9, which show the interactions with independent parameters, show that the current was showing a quadratic variation, whereas Ton and Toff show a linear variation (Figure 8 and 
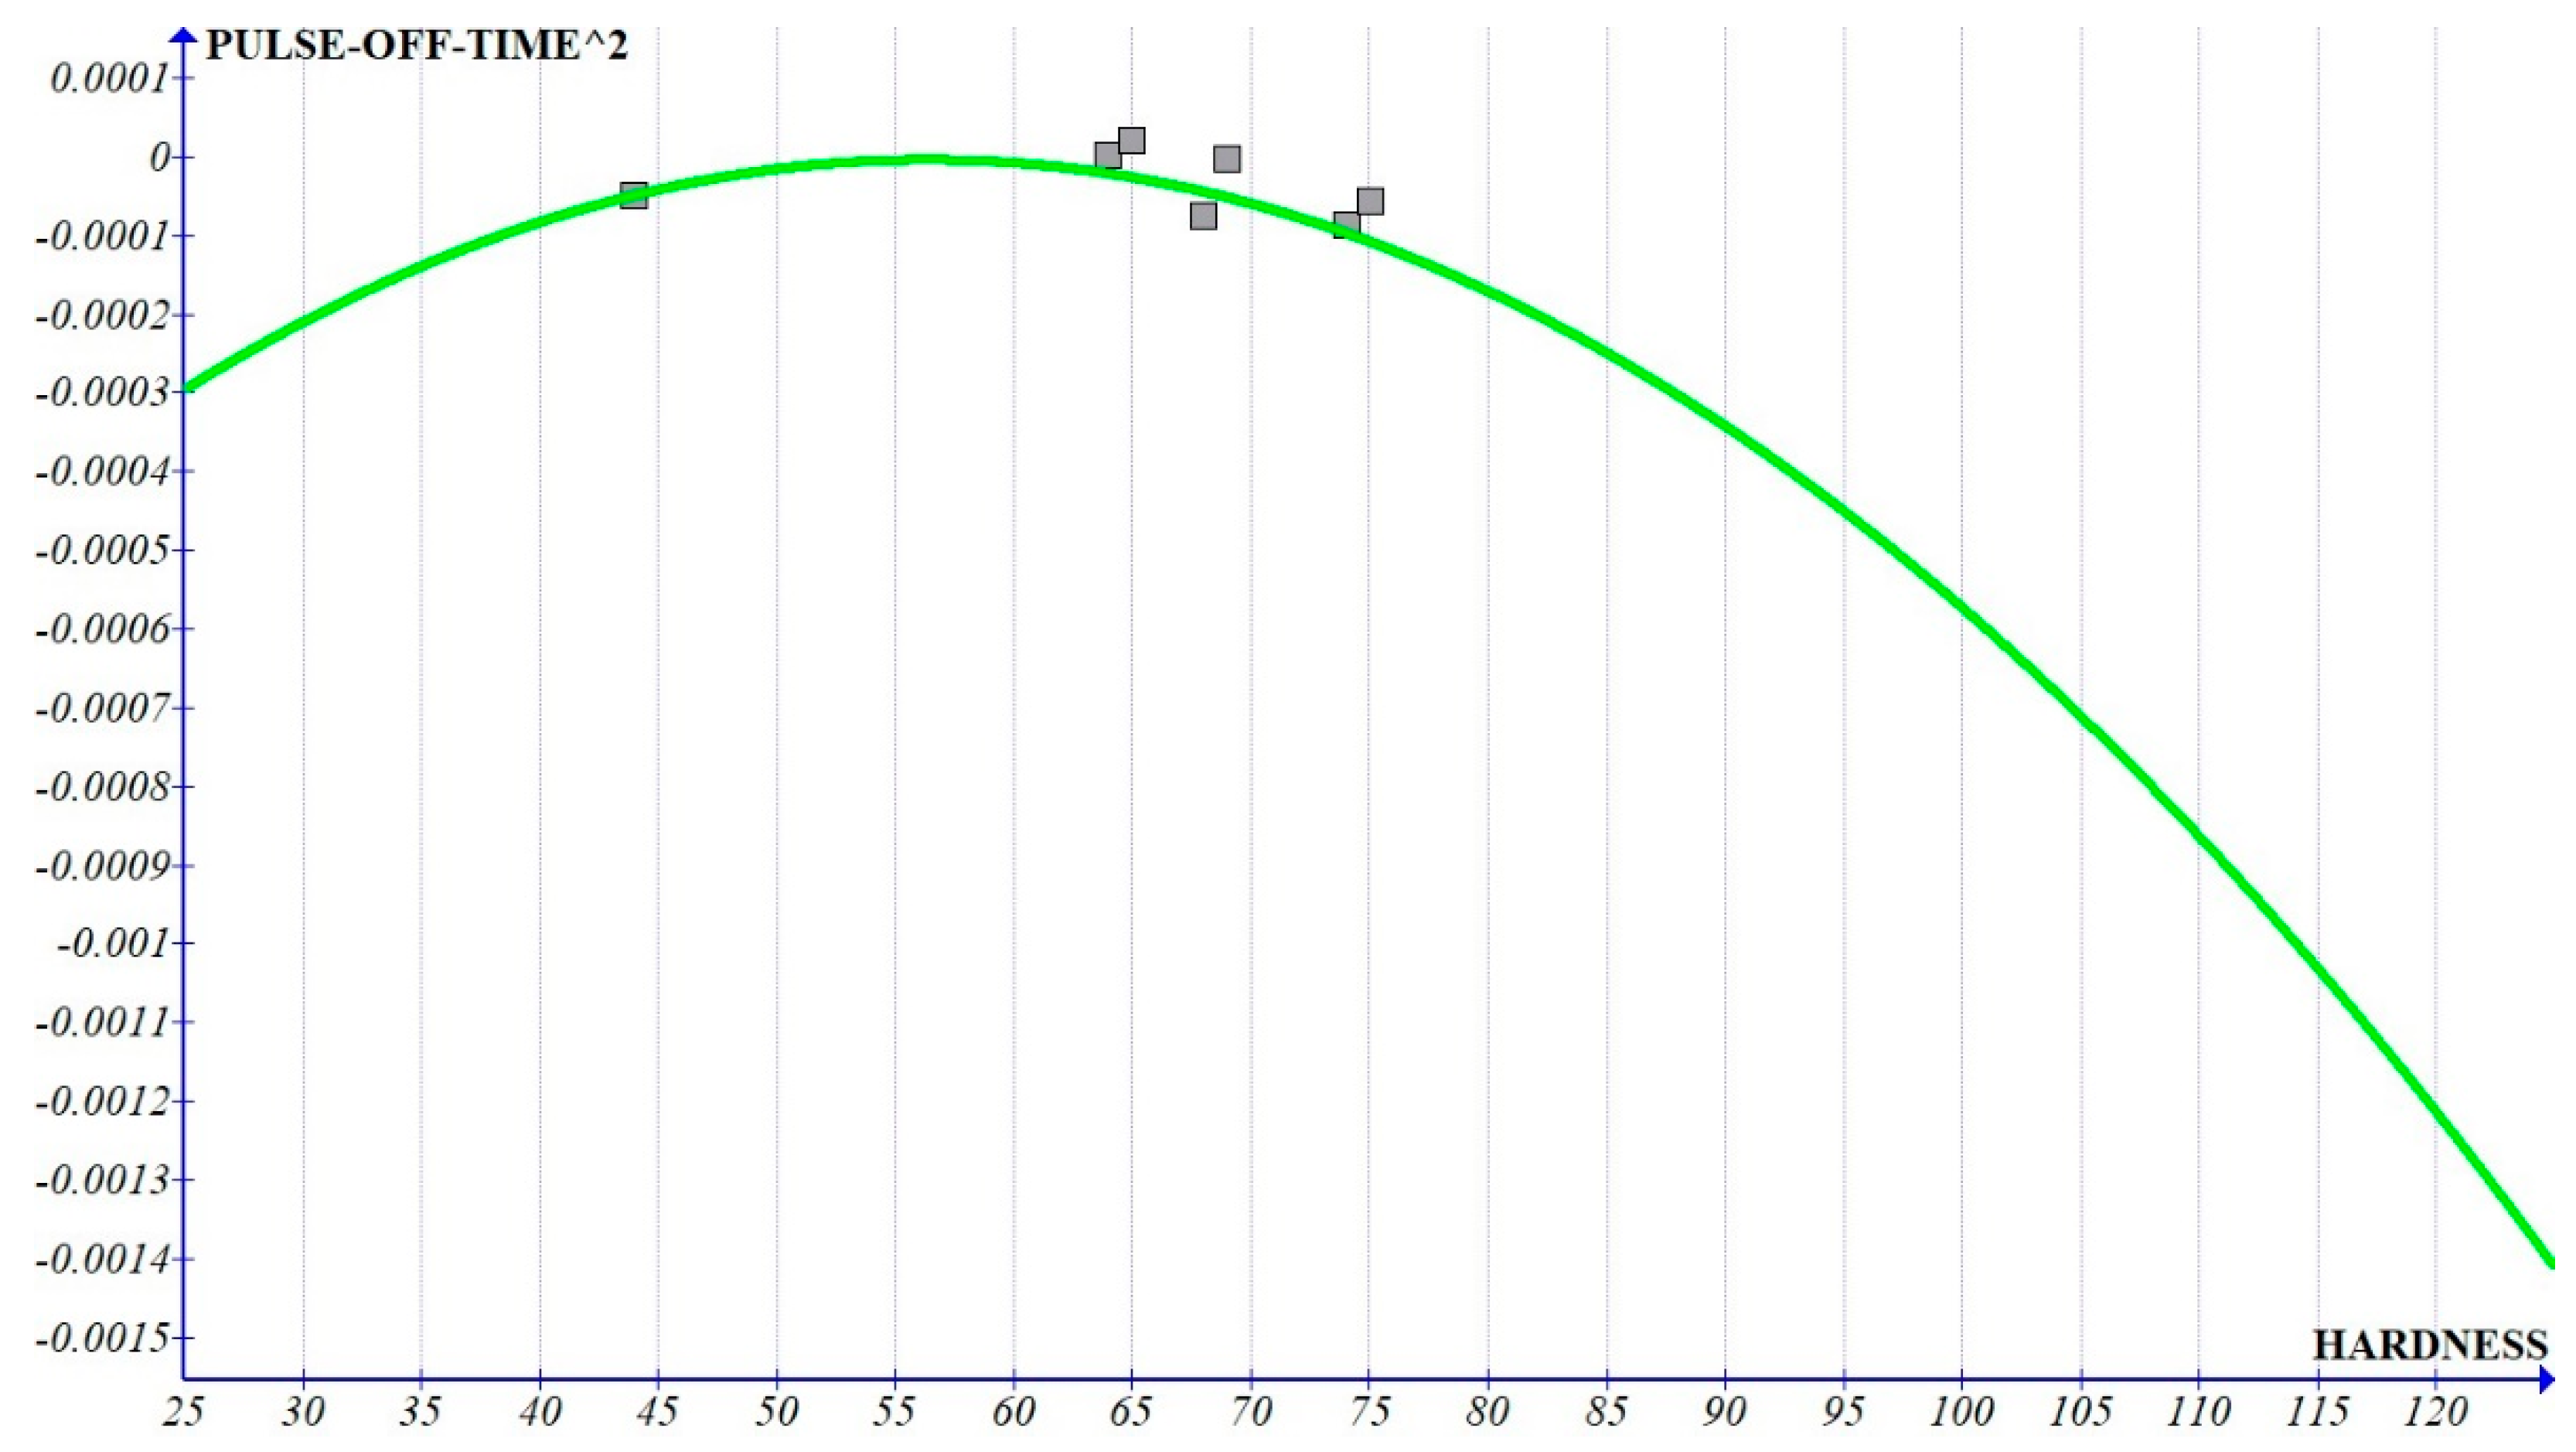
Figure 9). The graph clearly shows that the coefficient of pulse-off time reduces with increased hardness. This can be attributed to the fact that the solidification of the molten metal is quicker as the hardness of the material increases, leading to lower MRR. The increasing slope of pulse-on time with increased hardness, leading to increased MRR can be due to the nature of the composite to exist as two different components. The melting of the base matrix leads to the removal of the reinforcement, leading to increased MRR with increased percentage of the reinforcements, which increases the hardness. Since the slope of the graph of pulse-on time2 as well as pulse-off time2 (Figure 13 and 
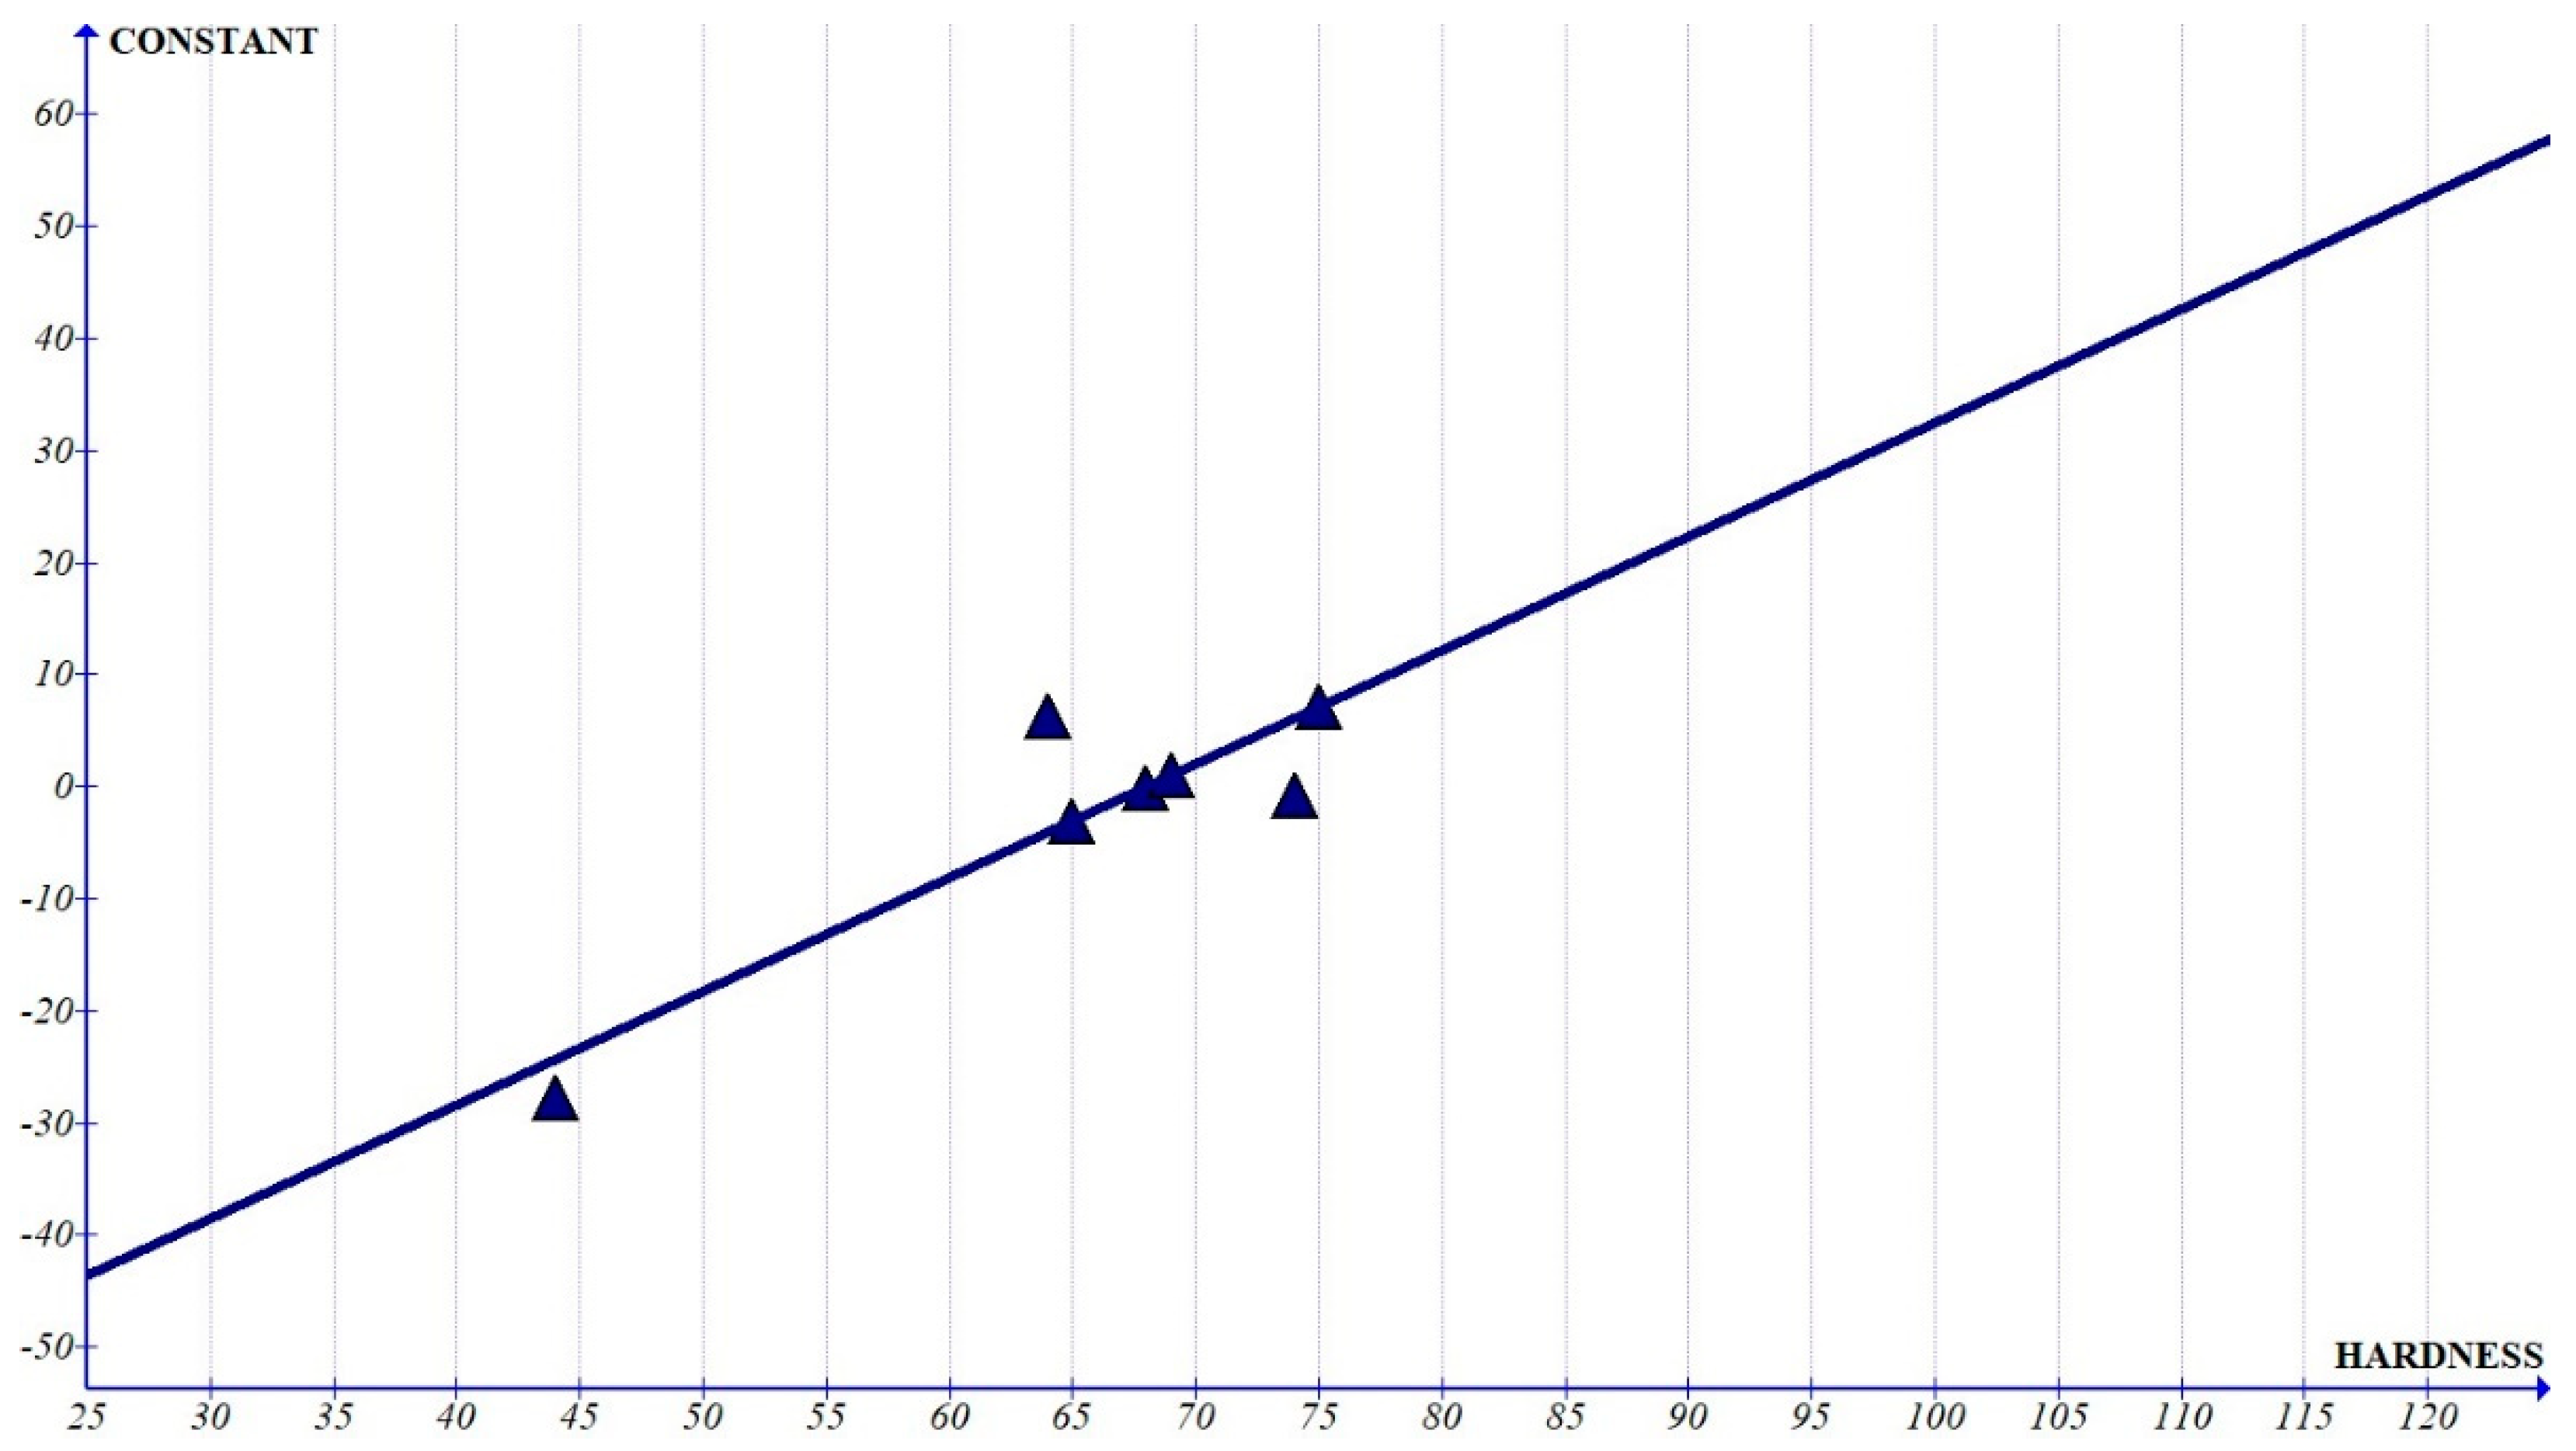
Figure 14) is less than 1% of the graph of pulse-on time and pulse-off time, we can consider that the variation is dominated by single-degree parameters when compared to its higher power. The value of the constant shows a quadratic variation (Figure 12). It can be observed that the value of the constant has an increasing trend at the zone related to Al6061 composites, which implies that it has more prominent influence as the hardness increases.
From the ANOVA, it can be found that current is the major contributor for the MRR for most of the composites. Next prominent factor was identified as the pulse-on time. The other parameters were found to be less significant for the Al6061 composites if we observe the summarised ANOVA table (Table 2).
A similar study was carried out for surface roughness, and the following graphs and equations were obtained:
Figure 15, Figure 16, Figure 17, Figure 18, Figure 19, Figure 20, Figure 21, Figure 22 and Figure 23 show the variation in the coefficients compared to hardness for the surface roughness.
The ANOVA of surface roughness also indicate that the equations obtained for the coefficients of surface roughness taking the hardness in HRB are:
A = 0.0012 ∗ HRB2 − 0.148 ∗ HRB + 4.6329
Ton = 0.0019 ∗ HRB2 − 0.2238 ∗ HRB + 6.6334
Toff = −0.1989 ∗ HRB + 13.4258
A2 = 0.0013 ∗ HRB − 0.0733
Ton2 = −2.7272 × 10⁻⁵ ∗ HRB2 + 0.0032 ∗ HRB − 0.0912
Toff2 = 0.0122 ∗ HRB − 0.8286
A ∗ Ton = 3.914 × 10⁻⁵ ∗ HRB2 + 0.0042 ∗ HRB − 0.1054
A ∗ Toff = 0.0008 ∗ HRB + 0.0703
Constant = 1.0143 ∗ HRB − 68.9794
The set of Equations are abbreviated in Table 6.
The graph of the interactions for surface roughness also shows a very small slope (in the range of 10−3) and can be considered to be constant for the evaluation (Figure 15 and Figure 16). The higher order coefficients also show a very small slope, except for the graph of pulse-off time2 (Figure 22), which shows that the higher-order terms can be ignored if a very precise prediction based on the hardness is not required. The graph of pulse-off time (Figure 20) shows a negative slope, indicating that the increase in hardness improves the surface finish. The trend could be due to white-layer formation and reduced craters while machining higher-hardness composite. The constant shows the maximum slope (Figure 17) which indicates that the variation in surface roughness has a larger contribution from this term if the values of the input parameters are low. For higher values, the significance of this term reduces. The coefficient of pulse-on time increases with hardness (Figure 21) which shows that the higher pulse-on time increases surface roughness whereas higher pulse-off time provides a better surface finish.

4. Validation

The fabricated composite was machined at varying conditions and the responses were noted. MRR was evaluated based on the weights of the specimen before and after machining of each sample at the specified settings. The finished samples were tested for surface roughness at M/s Unique Measurement Services, Coimbatore, using a Mitutoyo SJ201 surface tester. The values of the output parameters are tabulated in Table 7.
The hardness was calculated and the average HRB value was obtained as 61. The hardness was measured using the Vickers hardness-testing equipment located at Amal Jyothi College of Engineering. The values at three different intervals were taken and the average of these three values was considered as the final hardness. The values obtained were 62.1, 60.8 and 61.1. Based on this hardness value calculated, the corresponding equations are considered for the calculation of experimental responses, which are provided in Table 8.
The average variations were found to be 9.2% and 7.3%, respectively, with the maximum variation of 19.65% for MRR and 17.43% for Ra. The validated results provided a closer value when compared with the experimental results, and the same can be employed for the prediction of the MRR and Ra of the given composite

5. Surface Topography

Further, the machined surface is also examined using SEM with EDAX. Figure 24 depicts the machined-surface characterisation and Figure 25 confirms the presents of all elements in the machined surface.
During the machining time, the composite materials melted and partially vaporised. During the pulse-off time, solidification occurred of the liquefied material on the machined-pool surface itself. Meanwhile, the dielectric medium cooled the molten materials and flushed out the machined particle from the machining area. The solidified material on the machined surface created a layer called a white layer or resolidified layer. In addition, the bombardment of heat energy on the material surface created the melting of materials which caused craters on the surface of the materials. There was a possibility of craters to recombine with other craters on the surface and form a valley-like region. This resulted in the formation of higher surface roughness on the particular region on the machined part. The continuous expulsion of molten materials from the machined region also forms a wavy surface and influences the quality of the materials after the machining.

6. Conclusions

This work provides a simple and effective mathematical model for predicting the output parameters, MRR and Ra, of the Al6061-based metal matrix composites based on their variations in hardness. The results based on the ANOVA and validation indicate that:
  • The developed sample can be successfully utilised for the prediction of MRR and Ra of the given composite as the errors obtained were within 20% for the validated model;
  • The major contributor for the output parameters was identified to be current, except for Al6061-15% SiC, for which the pulse-on time was identified to be the major contributor. The change in the major contributor due to the increase in the percentage of SiC can be attributed to the increased hardness, which is evident from the graph of hardness vs pulse-on time;
  • The variation in the coefficients for hardness calculation was identified to be higher for the pulse-on time (~4 × 10⁻⁵) in case of MRR, which is showing a higher slope in the graph. This is evident as the increase in hardness increases the contribution of pulse-on time in ANOVA;
  • In case of surface roughness, a steeper slope was observed for the graphs of constant (1.0143), pulse-on time (~−0.1) and pulse-off time (−0.1989), indicating that these are the parameters that significantly vary the output parameter due to the variation in hardness;
  • The maximum variation observed for MRR was 19.65% and that of surface roughness was 17.43%. The average variation of the MRR and the surface roughness was identified to be 9.3% and 7.2%, respectively. Since the variations in the values are within the allowed range in most of the cases of validation, the methodology can be adopted for the prediction of Al6061-based composites.

7. Future Work

This work can be further conducted for different MMCs and can be further improved to identify a more generalised equations for the prediction of output parameters.

Author Contributions

Conceptualisation, H.S.R. and M.U.; methodology, M.U.; software, M.U., S.S.K. and S.T.K.; validation, M.U., S.S.K. and S.T.K.; formal analysis, S.S.K. and S.T.K.; investigation, H.S.R., S.S.K. and S.T.K.; resources, M.U.; data curation, M.U.; writing—original draft preparation, H.S.R.; writing—review and editing, M.U. and K.K.; visualisation, H.S.R.; supervision, M.U. and K.K.; funding acquisition, K.K. All authors have read and agreed to the published version of the manuscript.

Funding

This work has been financed by the Polish National Agency for Academic Exchange within the framework of the grant: E-mobility and sustainable materials and technologies EMMAT (PPI/APM/2018/1/00027/U/001).

Institutional Review Board Statement

Not applicable.

Informed Consent Statement

Not applicable.

Acknowledgments

The authors would like to acknowledge the support provided by M/s Carborundum Universal for providing the silicon carbide required for manufacturing the composites, free of cost.

Conflicts of Interest

The authors declare no conflict of interest. The funders had no role in the design of the study; in the collection, analyses, or interpretation of data; in the writing of the manuscript; or in the decision to publish the results.

References

  1. Nataraj, M.; Ramesh, P. Investigation on Machining Characteristics of Al 6061 Hybrid Metal Matrix Composite Using Electrical Discharge Machining. Middle-East J. Sci. Res. 2016, 24, 1932–1940. [Google Scholar]
  2. Murugesan, S.; Balamurugan, K. Optimisation by Grey Relational analysis of EDM parameters in machining of Al-15% SiC MMC using multiholeelectrode. J. Appl. Sci. 2012, 12, 963–970. [Google Scholar] [CrossRef] [Green Version]
  3. Singh, B.; Kumar, J.; Kumar, S. Investigating the Influence of Process Parameters of ZNC EDM on Machinability of A6061/10% SiC Composite. Adv. Mater. Sci. Eng. 2013, 2013, 173427. [Google Scholar] [CrossRef] [Green Version]
  4. Dey, A.; Debnath, S.; Pandey, K.M. Optimization of electrical discharge machining process parameters for Al6061/cenosphere composite using grey-based hybrid approach. Trans. Nonferrous Met. Soc. China 2017, 27, 998–1010. [Google Scholar] [CrossRef]
  5. Ming, W.; Zhang, Z.; Wang, S.; Huang, H.; Zhang, Y.; Zhang, Y.; Shen, D. Investigating the energy distribution of workpiece and optimizing process parameters during the EDM of Al6061, Inconel718, and SKD11. Int. J. Adv. Manuf. Technol. 2017, 92, 4039–4056. [Google Scholar] [CrossRef]
  6. Singh, B.; Kumar, J.; Kumar, S. Influences of Process Parameters on MRR Improvement in Simple and Powder-Mixed EDM of AA6061/10% SiC Composite. Mater. Manuf. Processes 2014, 30, 303–312. [Google Scholar] [CrossRef]
  7. Rajkumar, K.; Santosh, S.; Ibrahim, S.J.S.; Gnanavelbabu, A. Effect of Electrical discharge machining parameters on microwave heat treated Aluminium-Boron carbide-Graphite composites. Procedia Eng. 2014, 97, 1543–1550. [Google Scholar] [CrossRef] [Green Version]
  8. Nandakumar, N.; Kanakaraj, P. Study of Mechanical properties of Aluminium based hybrid metal matrix composites. Int. J. Mod. Eng. Res. 2019, 166–172. [Google Scholar]
  9. Arunkumar, M.B.; Swamy, R.P. Evaluation of Mechanical Properties of Al6061, flyash and E-glass fiber reinforced hybrid Metal matrix composites. ARPN J. Eng. Appl. Sci. 2011, 6, 40–44. [Google Scholar]
  10. Prasanth, S.N.; Nagaral, M.; Auradi, V. Preparation and Evaluation of Mechanical and Wear Properties of Al6061 reinforced with Graphite and SiC Particulate Metal Matrix Composites. Int. J. Mech. Eng. Rob. Res. 2012, 1, 106–112. [Google Scholar]
  11. Nagendran, N.; Shanmuganathan, V.K.; Gayathri, N.; Suresh, K.; Aravindh, S.; Prakash, E. Investigations on Mechanical Behavior of Al6061-TiO2-SiC Produced by Stir Casting. Int. J. Eng. Technol. 2018, 7, 369–371. [Google Scholar]
  12. Maurya, N.K.; Maurya, M.; Srivastava, A.K.; Dwivedi, S.P.; Kumar, A.; Chauhan, S. Investigation of mechanical properties of Al 6061/SiC composite prepared through stir casting technique. Mater. Today Proc. 2020, 25, 755–758. [Google Scholar] [CrossRef]
  13. Uthayakumar, M.; Babu, K.V.; Kumaran, S.T.; Kumar, S.S.; Jappes, J.W.; Rajan, T.P.D. Study on the machining of Al–SiC functionally graded metal matrix composite using die-sinking EDM. Part. Sci. Technol. 2019, 37, 103–109. [Google Scholar] [CrossRef]
  14. Marafona, J.D.; Araujo, A. Influence of Workpiece hardness on EDM Performance. Int. J. Mach. Tools Manuf. 2009, 49, 744–748. [Google Scholar] [CrossRef]
  15. Raza, M.H.; Wasim, A.; Ali, M.A.; Hussain, S.; Jahanzaib, M. Investigating the effects of different electrodes on Al6061-SiC-7.5 wt% during electric discharge machining. Int. J. Adv. Manuf. Technol. 2018, 99, 3017–3034. [Google Scholar] [CrossRef]
  16. Singh, S. Optimisation of machining characteristics in electric discharge machining of 6061Al/Al2O3p/20P composites by grey relational analysis. Int. J. Adv. Manuf. Technol. 2012, 63, 1191–1202. [Google Scholar] [CrossRef]
  17. Ishfaq, K.; Farooq, M.U.; Anwar, S.; Ali, M.A.; Ahmad, S.; El-Sherbeeny, A.M. A comprehensive investigation of geometrical accuracy errors during WEDM of Al6061-7.5% SiC composite. Mater. Manuf. Processes 2021, 36, 362–372. [Google Scholar] [CrossRef]
  18. Doreswamy, D.; Bongale, A.M.; Piekarski, M.; Bongale, A.; Kumar, S.; Pimenov, D.Y.; Giasin, K.; Nadolny, K. Optimization and Modeling of Material Removal Rate in Wire-EDM of Silicon Particle Reinforced Al6061 Composite. Materials 2021, 14, 6420. [Google Scholar] [CrossRef] [PubMed]
  19. Singh, H.; Singh, J.; Sharma, S.; Chohan, J.S. Parametric optimization of MRR & TWR of the Al6061/SiC MMCs processed during die-sinking EDM using different electrodes. Mater. Today Proc. 2021, 48, 1001–1008. [Google Scholar]
  20. Mythili, T.; Thanigaivelan, R. Optimization of wire EDM process parameters on Al6061/Al2O3 composite and its surface integrity studies. Bull. Pol. Acad. Sci. Tech. Sci. 2020, 68, 1403–1412. [Google Scholar]
  21. Velmurugan, N.; Muniappan, A.; Harikrishna, K.L.; Sakthiveld, T.G. Surface roughness modelling in wire EDM machining aluminium of Al6061 composite by ANFIS. Mater. Today Proc. 2021. [Google Scholar] [CrossRef]
  22. Singh, M.; Maharana, S.; Yadav, A.; Singh, R.; Maharana, P.; Nguyen, T.V.T.; Yadav, S.; Loganathan, M.K. An Experimental Investigation on the Material Removal Rate and Surface Roughness of a Hybrid Aluminum Metal Matrix Composite (Al6061/SiC/Gr). Metals 2021, 11, 1449. [Google Scholar] [CrossRef]
  23. Kareem, A.; Qudeiri, J.A.; Abdudeen, A.; Ahammed, T.; Ziout, A. A Review on AA 6061 Metal Matrix Composites Produced by Stir Casting. Materials 2021, 14, 175. [Google Scholar] [CrossRef] [PubMed]
  24. Amruth Babu, D.S.; Gurupavan, H.R. Experimental Investigation of Machining Performances of Al6061-SiC Metal Matrix Composite through Wire EDM. Int. Res. J. Eng. Technol. 2020, 7, 1335–1340. [Google Scholar]
  25. Thiagarajan, C.; Maridurai, T.; Shaafi, T.; Muniappana, A. Machinability studies on hybrid nano-SiC and nano-ZrO2 reinforced aluminium hybrid composite by wire-cut electrical discharge machining. Mater. Today Proc. 2021. [Google Scholar] [CrossRef]
  26. Srivastava, A.; Yadav, S.K.; Singh, D.K. Modeling and Optimization of Electric Discharge Machining Process Parameters in machining of Al 6061/SiCp Metal Matrix Composite. Mater. Today Proc. 2021, 44, 1169–1174. [Google Scholar] [CrossRef]
  27. Devi, M.B.; Birru, A.K.; Bannaravuri, P.K. The recent trends of EDM applications and its relevance in the machining of aluminium MMCs: A comprehensive review. Mater. Today Proc. 2021, 47, 6870–6873. [Google Scholar] [CrossRef]
  28. Shyn, C.S.; Rajesh, R.; Anand, M.D. Modeling and prediction of die sinking EDM process parameters for A6061/6%B4C metal matrix composite material. Mater. Today Proc. 2021, 42, 677–685. [Google Scholar] [CrossRef]
  29. Ishfaq, K.; Anwar, S.; Ali, M.A.; Raza, M.H.; Farooq, M.U.; Ahmad, S.; Salah, B. Optimization of WEDM for precise machining of novel developed Al6061-7.5% SiC squeeze-casted composite. Int. J. Adv. Manuf. Technol. 2020, 111, 2031–2049. [Google Scholar] [CrossRef]
  30. Singh, M.; Maharana, S. Investigating the EDM parameter effects on aluminium based metal matrix composite for high MRR. Mater. Today Proc 2020, 33, 3858–3863. [Google Scholar] [CrossRef]
  31. Golshan, A.; Gohari, S.; Ayob, A. Multi-objective optimisation of electrical discharge machining of metal matrix composite Al/SiC using non-dominated sorting genetic algorithm. Int. J. Mechatron. Manuf. Syst. 2012, 5, 385–398. [Google Scholar] [CrossRef] [Green Version]
  32. Jithin, S.; Joshi, S.S. Surface topography generation and simulation in electrical discharge texturing: A review. J. Mater. Process. Technol. 2021, 298, 117297. [Google Scholar] [CrossRef]
  33. Peta, K.; Mendak, M.; Bartkowiak, T. Discharge Energy as a Key Contributing Factor Determining Microgeometry of Aluminum Samples Created by Electrical Discharge Machining. Crystals 2021, 11, 1371. [Google Scholar] [CrossRef]
  34. Peta, K.; Bartkowiak, T.; Galek, P.; Mendak, M. Contact angle analysis of surface topographies created by electric discharge machining. Tribol. Int. 2021, 163, 107139. [Google Scholar] [CrossRef]
  35. Joshi, S.; Govindan, P.; Malshe, A.; Rajurkar, K. Experimental characterization of dry EDM performed in a pulsating magnetic field. CIRP Ann.—Manuf. Technol. 2011, 60, 239–242. [Google Scholar] [CrossRef]
  36. Dhadda, G.; Hamed, M.; Koshy, P. Electrical discharge surface texturing for enhanced pool boiling heat transfer. J. Mater. Processing Tech. 2021, 293, 117083. [Google Scholar] [CrossRef]
  37. Golshan, A.; Ghodsiyeh, D.; Gohari, S.; Ayob, A.; Baharudin, B.T. Optimization of Machining Parameters During Drilling of 7075 Aluminium Alloy. Appl. Mech. Mater. 2013, 248, 20–25. [Google Scholar] [CrossRef]
  38. Saravanan, M.; Ramalingam, D.; Manikandan, G.; Kaarthikeyen, R.R. Multi objective optimisation of drilling parameters using Genetic Algorithm. Procedia Eng. 2012, 38, 197–207. [Google Scholar] [CrossRef] [Green Version]
Figure 1. Casting die.
Applsci 12 02673 g001
Figure 2. Microstructure of the composite (a) SEM image; (b) optical microscope image.
Applsci 12 02673 g002
Figure 3. Material composition analysis of the fabricated composite: (a) EDAX and (b) Elemental mapping.
Applsci 12 02673 g003aApplsci 12 02673 g003b
Figure 4. EDM experimental facility.
Applsci 12 02673 g004
Figure 5. Methodology adopted.
Applsci 12 02673 g005
Figure 6. Hardness vs. coefficient of current for MRR.
Applsci 12 02673 g006
Figure 7. Hardness vs. coefficient of current2 for MRR.
Applsci 12 02673 g007
Figure 8. Hardness vs. coefficient of Ton for MRR.
Applsci 12 02673 g008
Figure 9. Hardness vs. coefficient of Toff for MRR.
Applsci 12 02673 g009
Figure 10. Hardness vs. coefficient of A × Ton for MRR.
Applsci 12 02673 g010
Figure 11. Hardness vs. coefficient of A ×Toff for MRR.
Applsci 12 02673 g011
Figure 12. Hardness vs. constant for MRR.
Applsci 12 02673 g012
Figure 13. Hardness vs. coefficient of Ton2 for MRR.
Applsci 12 02673 g013
Figure 14. Hardness vs. coefficient of Toff2 for MRR.
Applsci 12 02673 g014
Figure 15. Hardness vs. coefficient of A × Toff for surface roughness.
Applsci 12 02673 g015
Figure 16. Hardness vs. coefficient of A × Ton for surface roughness.
Applsci 12 02673 g016
Figure 17. Hardness vs. constant for surface roughness.
Applsci 12 02673 g017
Figure 18. Hardness vs. coefficient of Current2 for surface roughness.
Applsci 12 02673 g018
Figure 19. Hardness vs. coefficient of Current for surface roughness.
Applsci 12 02673 g019
Figure 20. Hardness vs. coefficient of Toff for surface roughness.
Applsci 12 02673 g020
Figure 21. Hardness vs. coefficient of Ton for surface roughness.
Applsci 12 02673 g021
Figure 22. Hardness vs. coefficient of Toff2 for surface roughness.
Applsci 12 02673 g022
Figure 23. Hardness vs. coefficient of Ton2 for surface roughness.
Applsci 12 02673 g023
Figure 24. Characterisation of machined surface.
Applsci 12 02673 g024
Figure 25. EDAX image of the machined surface.
Applsci 12 02673 g025
Table 1. Process parameters.
ParametersValues
Current (A)6, 9, 12
Ton (μm)36, 48, 56
Toff (μm)7, 8, 9
Table 2. Summary of the ANOVA for MRR.
Sl. No.MaterialContribution
RegressionATonToffA2T2onT2offA × TonA × Toff
1Al6061-15% SiC99.84%30.21%41.46%10.36%1.11%10.59%1.98%4.13%0%
2Al6061-20% Al2O391.48%73.73%12.83%1.42%0.08%0.87%2.05%0.01%0.5%
3Al6061-5% Al2O3-3% SiC-2% E-glass 98.38%90.08%5.87%0.72%1.67%0%0%0.01%0.01%
4Al6061-7.5% SiC96.68%78.23%15.43%2.3%0.42%0.02%0.19%0.07%0.03%
5Al6061-3% SiC100%46.67%38.25%0.56%6.54%0.3%7.22%0.36%0.1%
6Al6061-5% SiC100%41.26%39.79%0.26%3.44%0.07%8.29%4.93%1.97%
7Al6061-9% SiC100%80.98%9.95%3.14%0.00%5.02%0.36%0.53%0.01%
Table 3. Summary of ANOVA for surface roughness.
Sl. No.MaterialContribution
RegressionATonToffA2T2onT2offA × TonA × Toff
1Al6061-15% SiC98.13%18.68%67.91%7.16%0.38%1.47%0%2.52%0%
2Al6061-20% Al2O373.17%49.76%10.83%0.01%0.07%1.01%9.98%0.59%0.93%
3Al6061-5% Al2O3-3% SiC-2% E-glass 97.13%84.5%9.14%2.05%0.39%0.48%0.31%0.05%0.2%
4Al6061-7.5% SiC94.21%54.25%14.21%12.57%0.22%3.59%7.35%0%2.02%
5Al6061-3% SiC100%52.17%43.28%0.47%0.67%3.07%0.09%0.01%0.23%
6Al6061-5% SiC100%71.44%23.79%2.93%0.14%0.1%1.14%0.42%0.04%
7Al6061-9% SiC100%81.07%5.33%1.83%5.33%2.56%3.52%0.04%0.31%
Table 4. Hardness of the composites used in ANOVA.
Sl. NoWorkpiece MaterialHardness (HRB)
1Al6061-15% SiC68
2Al6061-20% Al2O364
3Al6061-5% Al2O3-3% SiC-2% E-glass 44
4Al6061-7.5% SiC74
5Al6061-3% SiC65
6Al6061-5% SiC69
7Al6061-9% SiC75
Table 5. The coefficients of equations for MRR.
CoefficientParameters for MRR
CurrentCurrent2ToffTonA ∗ TonA ∗ ToffToff2Ton2Constant
HRB2−6.35 × 10−57.546 × 10−600−5.888 × 10−60−2.984 × 10−700.0009
HRB0.0075−0.0009−0.00013.976 × 10−57.0927 × 10−52.17 × 10−63.361 × 10⁻⁵−1.489 × 10⁻⁷−0.1028
Constants−0.19560.02550.0087−0.0009−0.002−0.0002−0.00096.057 × 10−62.7796
Table 6. The coefficients of equations for Ra.
Coefficients Parameters for Ra
CurrentCurrent2ToffTonA ∗ TonA ∗ ToffToff2Ton2Constant
HRB20.0012000.00193.914 × 10−500−2.727 × 10−50
HRB−0.1480.0013−0.1989−0.22380.00420.00080.01220.00321.0143
Constants4.6329−0.073313.42586.6334−0.10540.0703−0.8286−0.0912−68.979
Table 7. Results of validated samples.
Sl NoCurrent (A)Ton (μs)Toff (μs)Material Removal Rate (MRR) [g/min]Surface Roughness
(Ra) [μm]
163670.05773.0380
264880.07195.2230
365690.09237.4640
493680.09244.6040
594890.11596.7750
695670.10918.9170
7123690.10105.6270
8124870.11409.6090
9125680.13459.7150
Table 8. Comparison of the experimental and mathematical model-based values for validation of the model.
MRR [g/min]Surface Roughness (Ra) [μm]
Current (A)Ton (μs)Toff (μs)CalculatedExperimentalPercentage VariationCalculatedExperimentalPercentage Variation
63670.048740.057715.522.50843.038017.431
64880.075960.0719−5.585.17015.22301.012
65690.094470.0923−2.357.23117.46403.121
93680.076990.092416.724.21794.60408.386
94890.108980.11596.016.96116.7750−2.746
95670.124090.1091−13.758.88688.91700.339
123690.081150.101019.655.99565.6270−6.551
124870.111980.11401.788.47199.609011.833
125680.136520.1345−1.5011.07849.7150−14.034
Publisher’s Note: MDPI stays neutral with regard to jurisdictional claims in published maps and institutional affiliations.

