Article

In Vitro Corrosion Behavior of Zn3Mg0.7Y Biodegradable Alloy in Simulated Body Fluid (SBF)

by
Cătălin Panaghie
1,
Ramona Cimpoeșu
1,*,
Georgeta Zegan
2,*,
Ana-Maria Roman
1,
Mircea Catalin Ivanescu
2,
Andra Adorata Aelenei
1,
Marcelin Benchea
3,
Nicanor Cimpoeșu
1 and
Nicoleta Ioanid
2
1
Faculty of Materials Science and Engineering, “Gh. Asachi” Technical University from Iasi, 700050 Iasi, Romania
2
Faculty of Dental Medicine, “Grigore T. Popa” University of Medicine and Pharmacy, 700115 Iasi, Romania
3
Faculty of Mechanical Engineering, “Gh. Asachi” Technical University from Iasi, 700050 Iasi, Romania
*
Authors to whom correspondence should be addressed.
Submission received: 15 December 2021 / Revised: 1 March 2022 / Accepted: 4 March 2022 / Published: 6 March 2022
(This article belongs to the Special Issue Active Materials for Medical Applications)

Abstract

:
Biodegradable metallic materials represent a new class of biocompatible materials for medical applications based on numerous advantages. Among them, those based on zinc have a rate of degradation close to the healing period required by many clinical problems, which makes them more suitable than those based on magnesium or iron. The poor mechanical properties of Zn could be significantly improved by the addition of Mg and Y. In this research, we analyze the electro-chemical and mechanical behavior of a new alloy based on Zn3Mg0.7Y compared with pure Zn and Zn3Mg materials. Microstructure and chemical composition were investigated by electron microscopy and energy dispersive spectroscopy. The electrochemical corrosion was analyzed by linear polarization (LP), cyclic polarization (CP) and electrochemical impedance spectroscopy (EIS). For hardness and scratch resistance, a microhardness tester and a scratch module were used. Findings revealed that the mechanical properties of Zn improved through the addition of Mg and Y. Zn, Zn-Mg and Zn-Mg-Y alloys in this study showed highly active behavior in SBF with uniform corrosion. Zinc metals and their alloys with magnesium and yttrium showed a moderate degradation rate and can be considered as promising biodegradable materials for orthopedic application.

1. Introduction

Recently, zinc (Zn) and its alloys have attracted considerable attention and are considered promising candidates for various medical applications, due to the much more suitable degradation rate compared to magnesium (Mg) and iron (Fe) alloys. However, it is important to note that its mechanical properties need to be improved to meet the standards for medical applications. The yield strength (MPa) of Zn-based alloys presents many variations based on their added elements and states (cast, heat treated, laminated, severe plastic deformation or powder metallurgy and additive manufacturing). The values obtained experimentally vary from 50 to 500 MPa from ZnCu to ZnCuMg or ZnLi alloys, respectively [1,2]. Vickers hardness (HV) was also reported with different values from 30 to 150 HV [1].
Jain et al. [3] studied the behavior of a complex Zn alloy (96.5% Zn) in marking out a uniform corrosion and a homogenous distribution of various reaction products obtained during the long-term immersion in SBF. Additionally, Xue et al. [4] studied a few Zn-Fe-Mg alloys in SBF and found that the Zn1Fe1Mg shows a good corrosion rate and superior mechanical properties. The corrosion rate of Zn-based alloys is influenced by the alloying elements and ranges from almost 0.050 mm/year to more than 0.300 mm/year determined by a potentiodynamic polarization test in Hank’s electrolyte solution [1]. Electro-corrosion determinations show that the values of corrosion potential and the corrosion current density of zinc and Zn-based alloys are between those of magnesium- and iron-based alloys [5]. The corrosion compounds from the surface are generally made of oxides, hydroxides and phosphates of the main elements.
After years of developing strategies and methods to improve or even combat the corrosion of metallic biomaterials, there is now a growing interest in the use of corrodible metals in medical device applications. These are called biodegradable or absorbable metals [6], as they are expected to gradually corrode in vivo by generating an appropriate host response and then dissolve completely upon tissue healing [7]. A gradual transfer of the load to the healing tissue and the prevention of secondary surgery are the two main reasons why this category of metals are favorable alternatives to existing corrosion-resistant metal implants used for temporary applications [8]. Metallic materials have been investigated mainly for absorbable medical devices [9].
Zinc and zinc-based alloys are very active metals in ionic media, especially in the presence of chlorine ions. In the last decade, in the field of biodegradable metals used to make implants that after a certain time must be removed from the body, more and more attention has been paid to zinc and zinc-based alloys [10,11,12]. The advantages of using these materials can be summed up by the fact that they have an average corrosion rate between the corrosion rates of magnesium and the corrosion rate of iron (standard electrode potential: Mg (−2.61 V) <Zn (−1.008 V) <Fe (−0.685 V vs. ENH) [13]. Additionally, zinc is an essential element from a biological perspective [14], having an excellent hemocompatibility, and its corrosion products work as an anti-inflammatory.
Zinc has an electrode potential between those of magnesium and iron, satisfying clinical requirements, and being a good candidate as a biodegradable metal [15,16]. Moreover, zinc is widely recognized as a nutrient with an important biological function involved in synthesis, such as DNA polymerase, RNA polymerase and many transcription factors [17]. Zn was further investigated for potential clinical applications [18]. Due to the low mechanical strength and low hardness, like Mg, Zn may not meet the requirements for the mechanical properties of the implant materials. To improve their mechanical performance, a good technique is alloying with different elements. Such Zn alloys are Zn–Mg alloys [19,20], or in our case, we propose ZnMgY alloys.
This study presents results on the microstructure, mechanical properties and electro-corrosive behavior of pure Zn, Zn3Mg and Zn3Mg0.7Y alloys to determine an appropriate alloy composition for optimal medical performance.

2. Materials and Methods

Experimental materials were realized from pure zinc (99.995%) in an electrolyte bath and pure magnesium and master-alloy MgY(70/30 wt%) bought from HunanCo China, Hunan, China, molten for 600 s at 480 °C in a standard oven with induction with Argon-purged gas (~0.75 atm), Induct-Ro, Iasi, Romania. The samples consisted of three materials: pure Zn, Zn3Mg and Zn3Mg0.7Y. The materials were obtained as bars machined from ingots (approx. 110 g), which were prepared by melting from high-purity raw materials. Zn, MgY and Mg were obtained from the following material quantities: for Zn3Mg0.7Y, we used 96.0 g pure Zn, 2.9 g MgY and 1.6 pure Mg. Zinc loss by volatilization was avoided by keeping a low melting temperature and by enhancing the element dissolution in the metal bath. The samples were re-melted five times to obtain proper chemical and structural homogeneity and to reduce the voids and microcracks from the melting process.
To highlight the effect of the re-melting, we performed a non-destructive test, using fluorescent penetrant liquids, Figure 1a,b. We used the hydrophilic post-emulsification method to detect different discontinuities of the melted alloy, such as cracks or porosity. The samples were cleaned in a technical alcohol machine before testing. We used a level-four sensitivity penetrant and a hydrophilic emulsifier at 7% concentration. A non-aqueous developer was used to obtain a better contrast, which amplified the indications. Standard parameters were used as follows: penetrant dwell time: 30 min; emulsifier time: 3 min; developer time: 15 min. Inspection was performed under UV light at 3000 µW/cm2 intensity measured at 12 inches [21]. The results of the remelting are visible primarily in the case of alloy and less of Zn pure, highlining a reduction of surface defects. Mechanical property modification was evaluated through hardness Vickers tests (HV) using HVT-1000 equipment (test force: 2.942 N–300 gF; dwell: 10 s; objective: 40× magnification, JVC TK-C92 1EC for surface image of the indentation trace) and a scratch test with CETR UMT-2 Tribometer equipment (the test consisted of the application of an increasing force of 1–15 N over a distance of 10 mm with 1 mm/s rate on the samples). Friction force (Fx) and acoustic emission (AE) data were registered during the test time, and the scratch distance was measured and recorded at a total sampling rate of 20 kHz. The apparent coefficient of friction (COF) was calculated for each sample and plotted against distance (mm). These parameters are important to establish the mechanical property modification with the addition of Mg and Y elements to pure Zn.
Electrochemical measurements were performed with a PARSTAT 4000 electrochemical system (Princeton Applied Research, Oak Ridge, TN, USA). A C145/170 type three electrode corrosion cell (Radiometer, Neuplassans, France) was used for both the dynamic measurements and the electrochemical impedance spectroscopy determinations, which is a glass cell with the possibility of liquid corrosion; static conditions were preferred in the present measurements [22]. The placement of the samples in the working cell was performed by means of a Teflon washer with an inner diameter of 7 mm, so that, for all samples, the surface of the working electrode (the portion of the sample exposed to the corrosion environment) was also equal to 0.385 cm2 [23]. A flat platinum electrode (S = 0.8 cm2) was used as an auxiliary electrode, and a saturated calomel electrode as a reference. All potentials were measured in relation to this electrode, but for simplicity, this is not specified in the tables and in the text. The solution used (Simulated Body Fluid—SBF) was naturally aerated. The working conditions used in the measurements were as follows [24]:
-
Linear anodic polarization for the Tafel method: potential range: (−200) ÷ (+200) mV with respect to the open circuit potential; potential scanning speed: dE/dt = 0.5 mV/s.
-
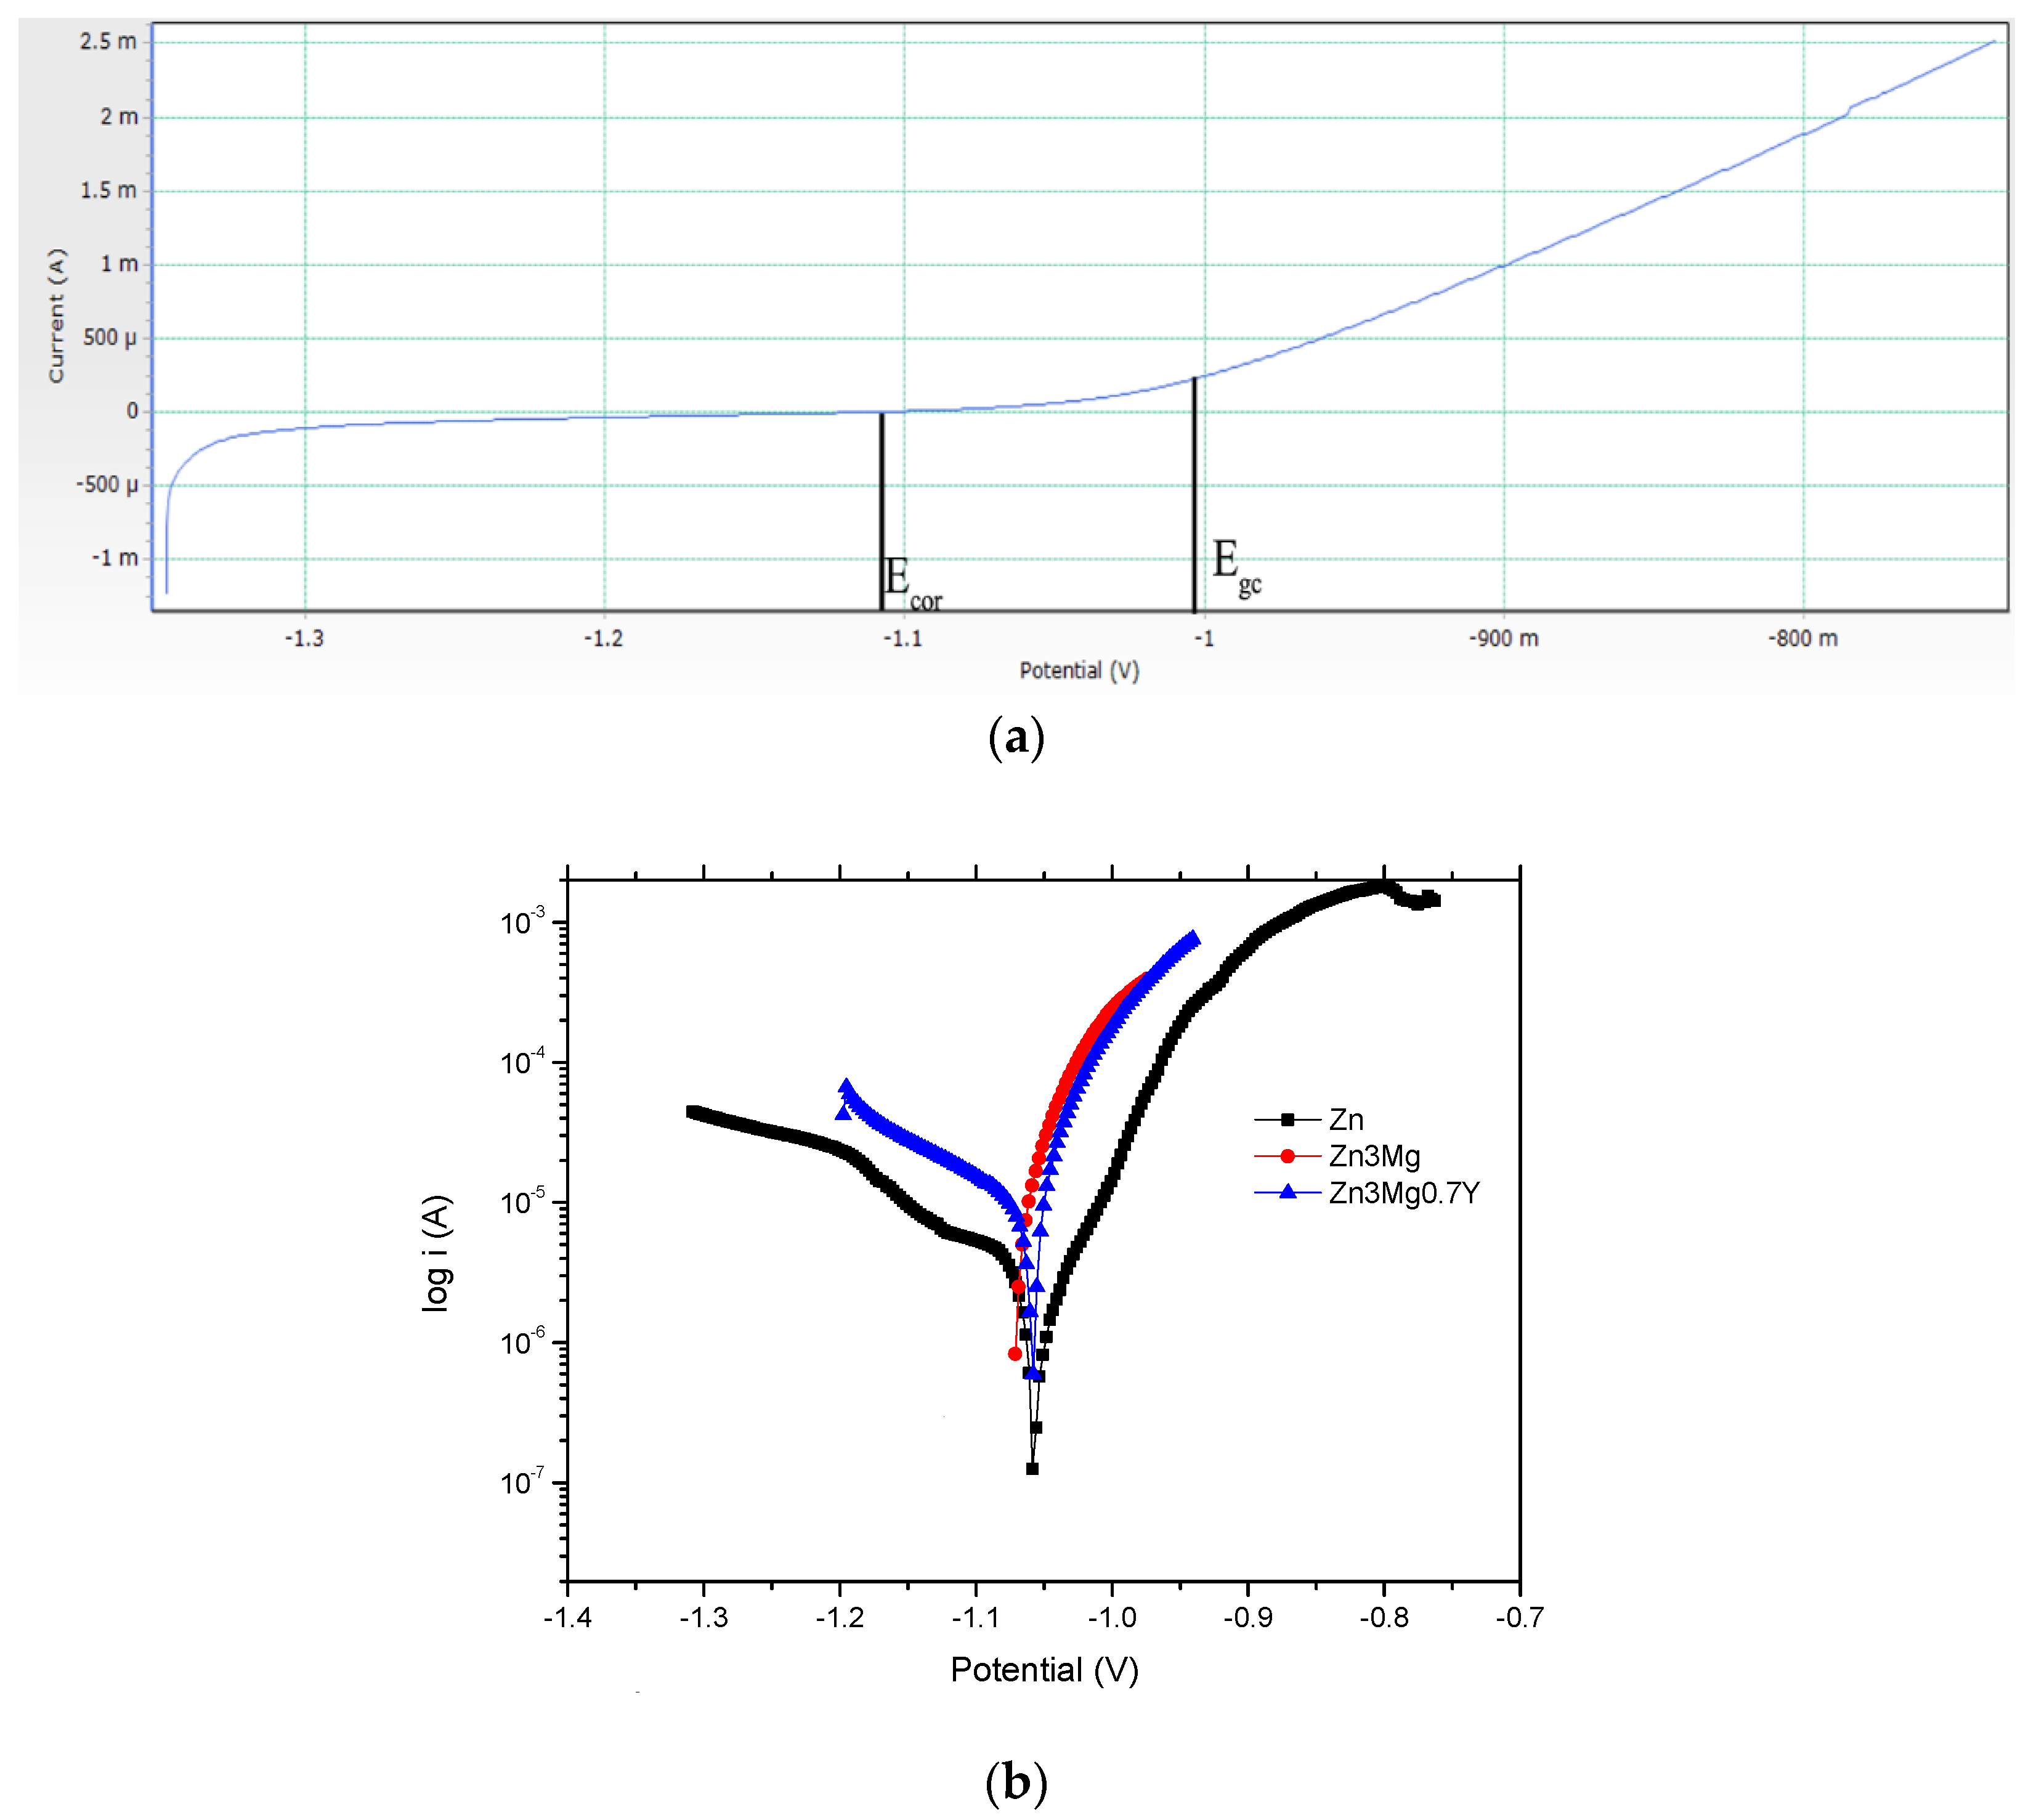
Extended linear anodic polarization: potential range: (−100) ÷ (+1000) mV from the potential in open circuit; potential scanning speed: dE/dt = 1 mV/s.
-
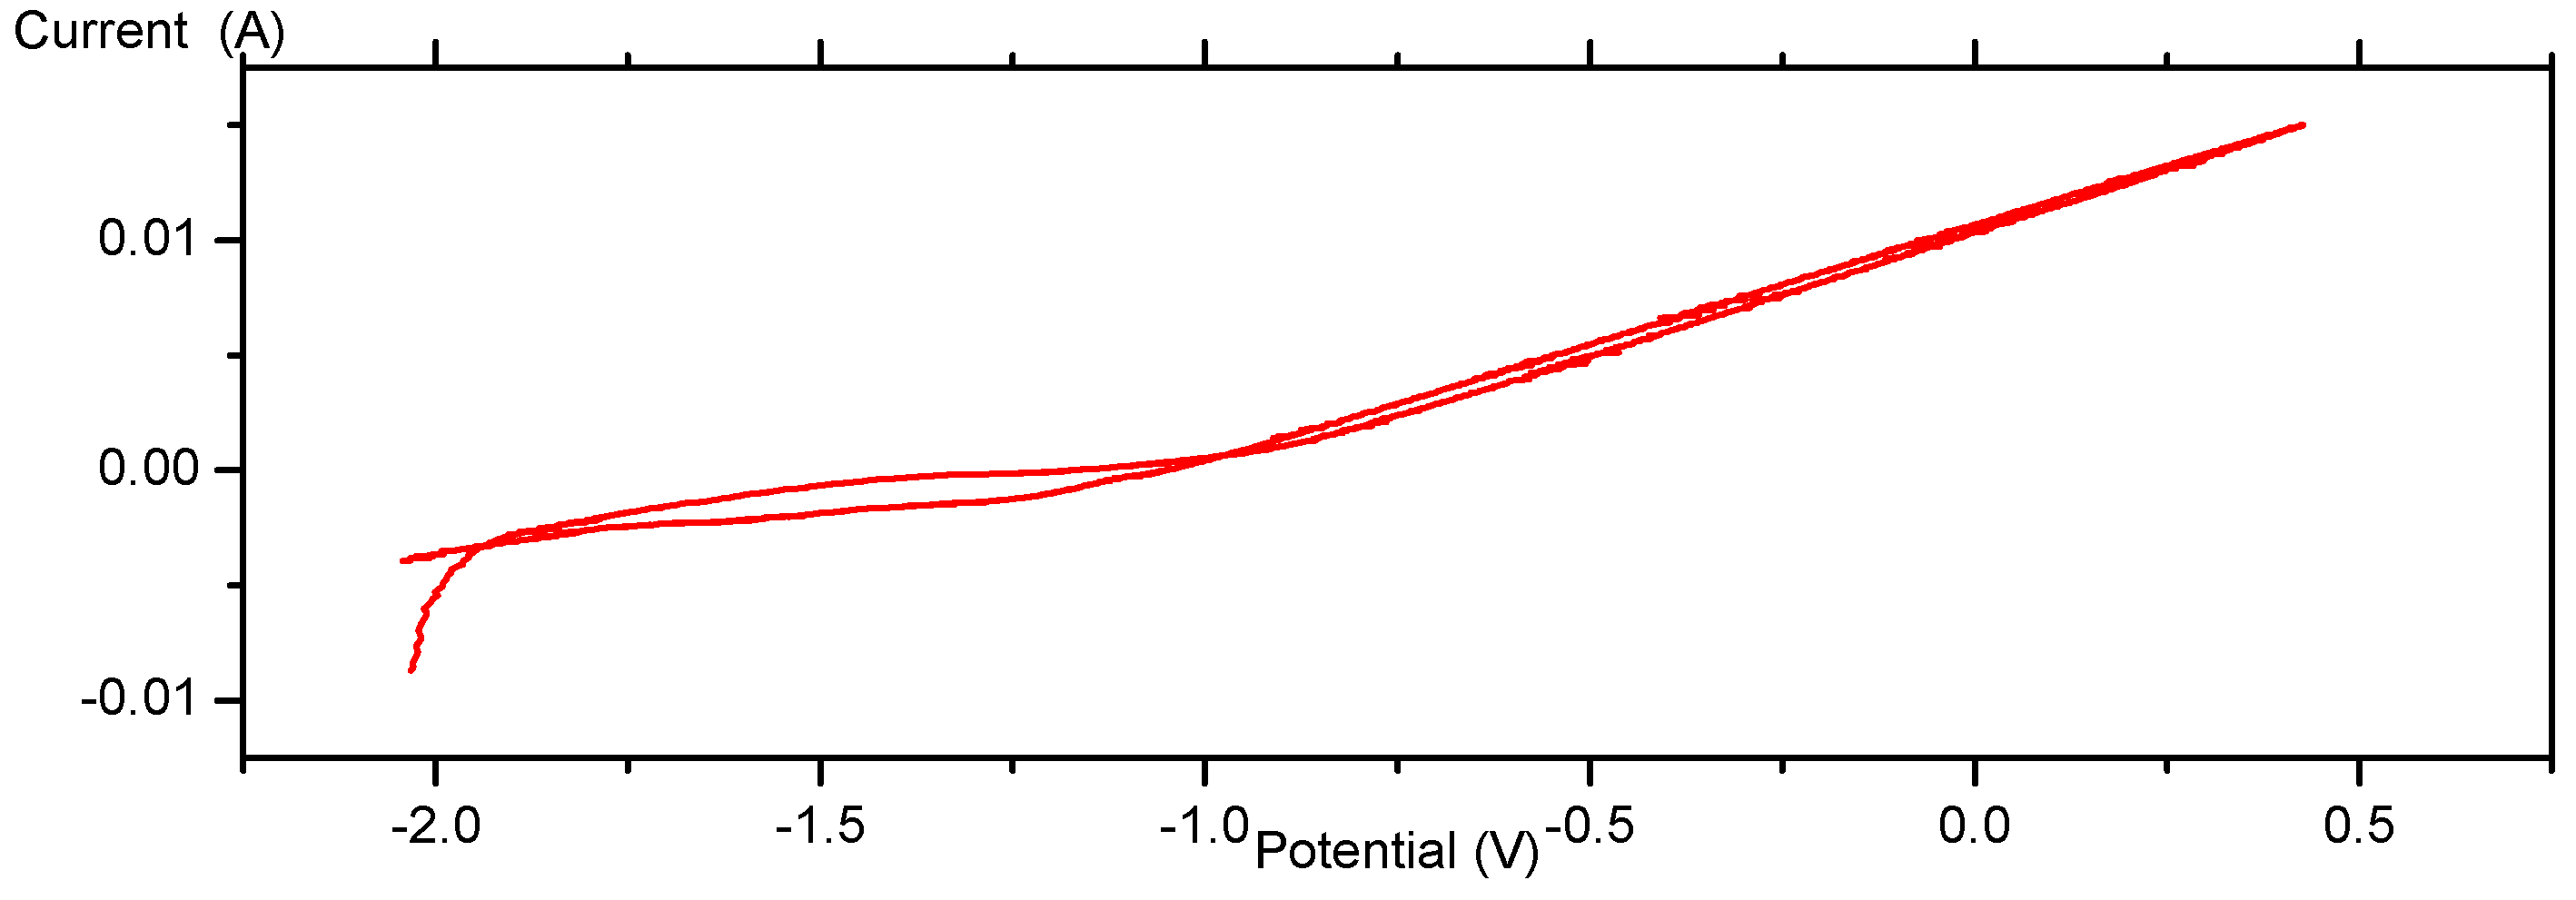
Cyclic polarization: potential range: (−500) ÷ (+2000) mV; potential scanning speed: 20 mV/s.
-
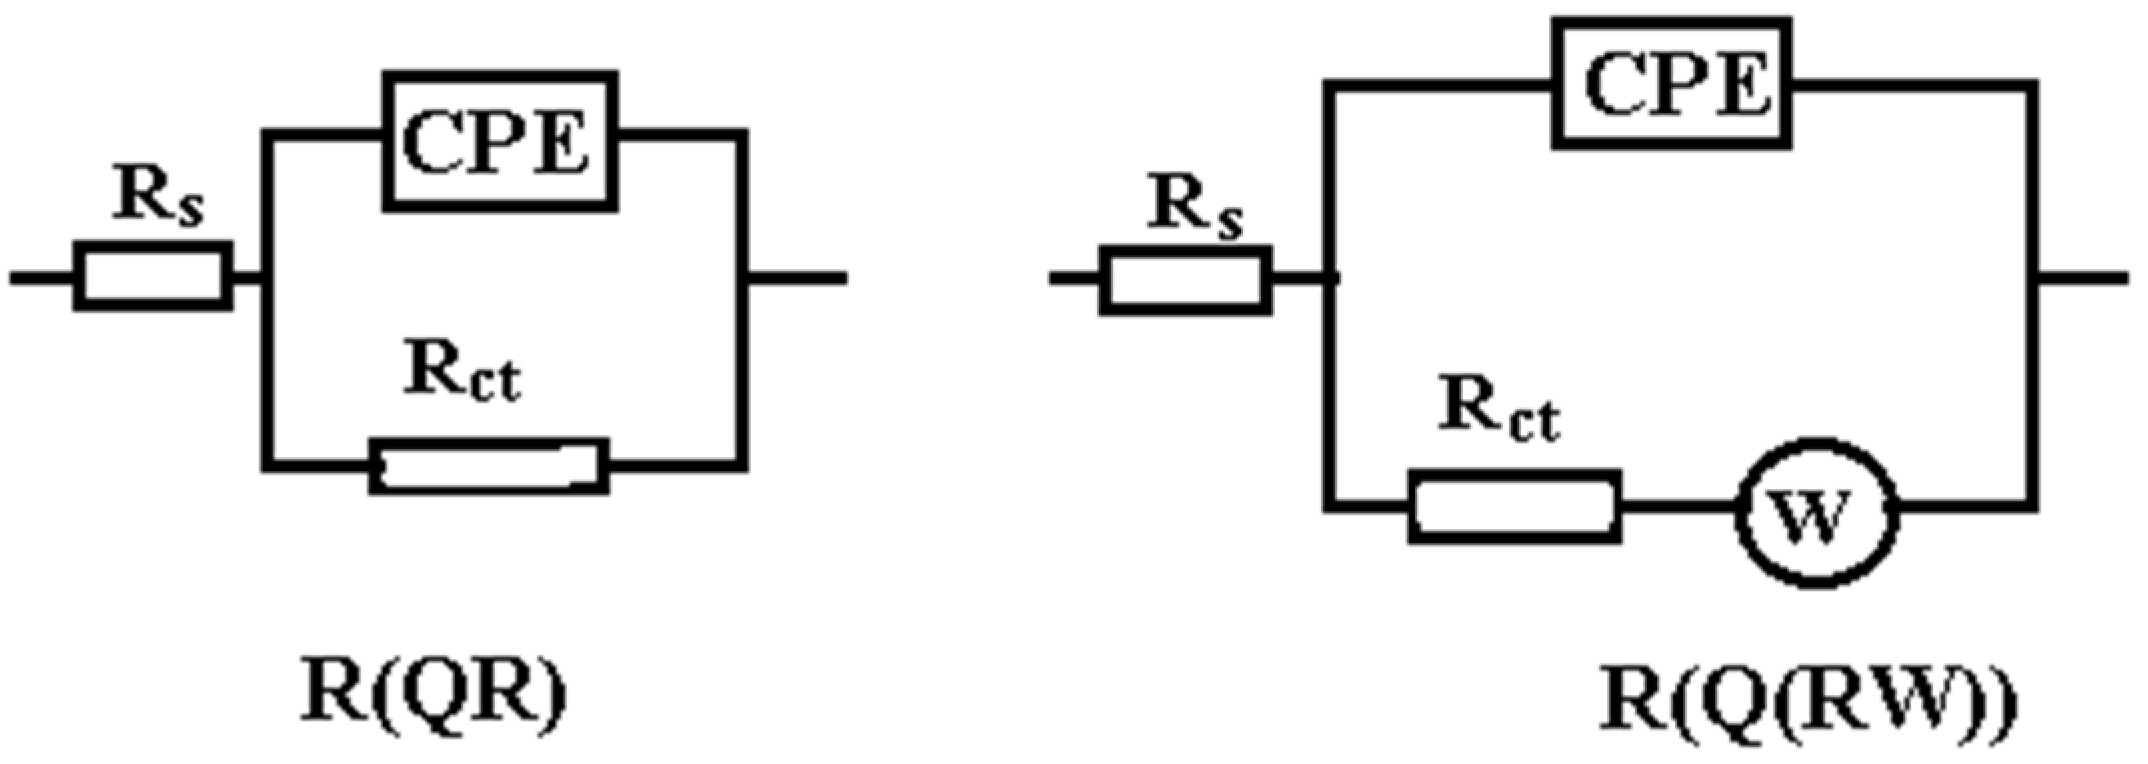
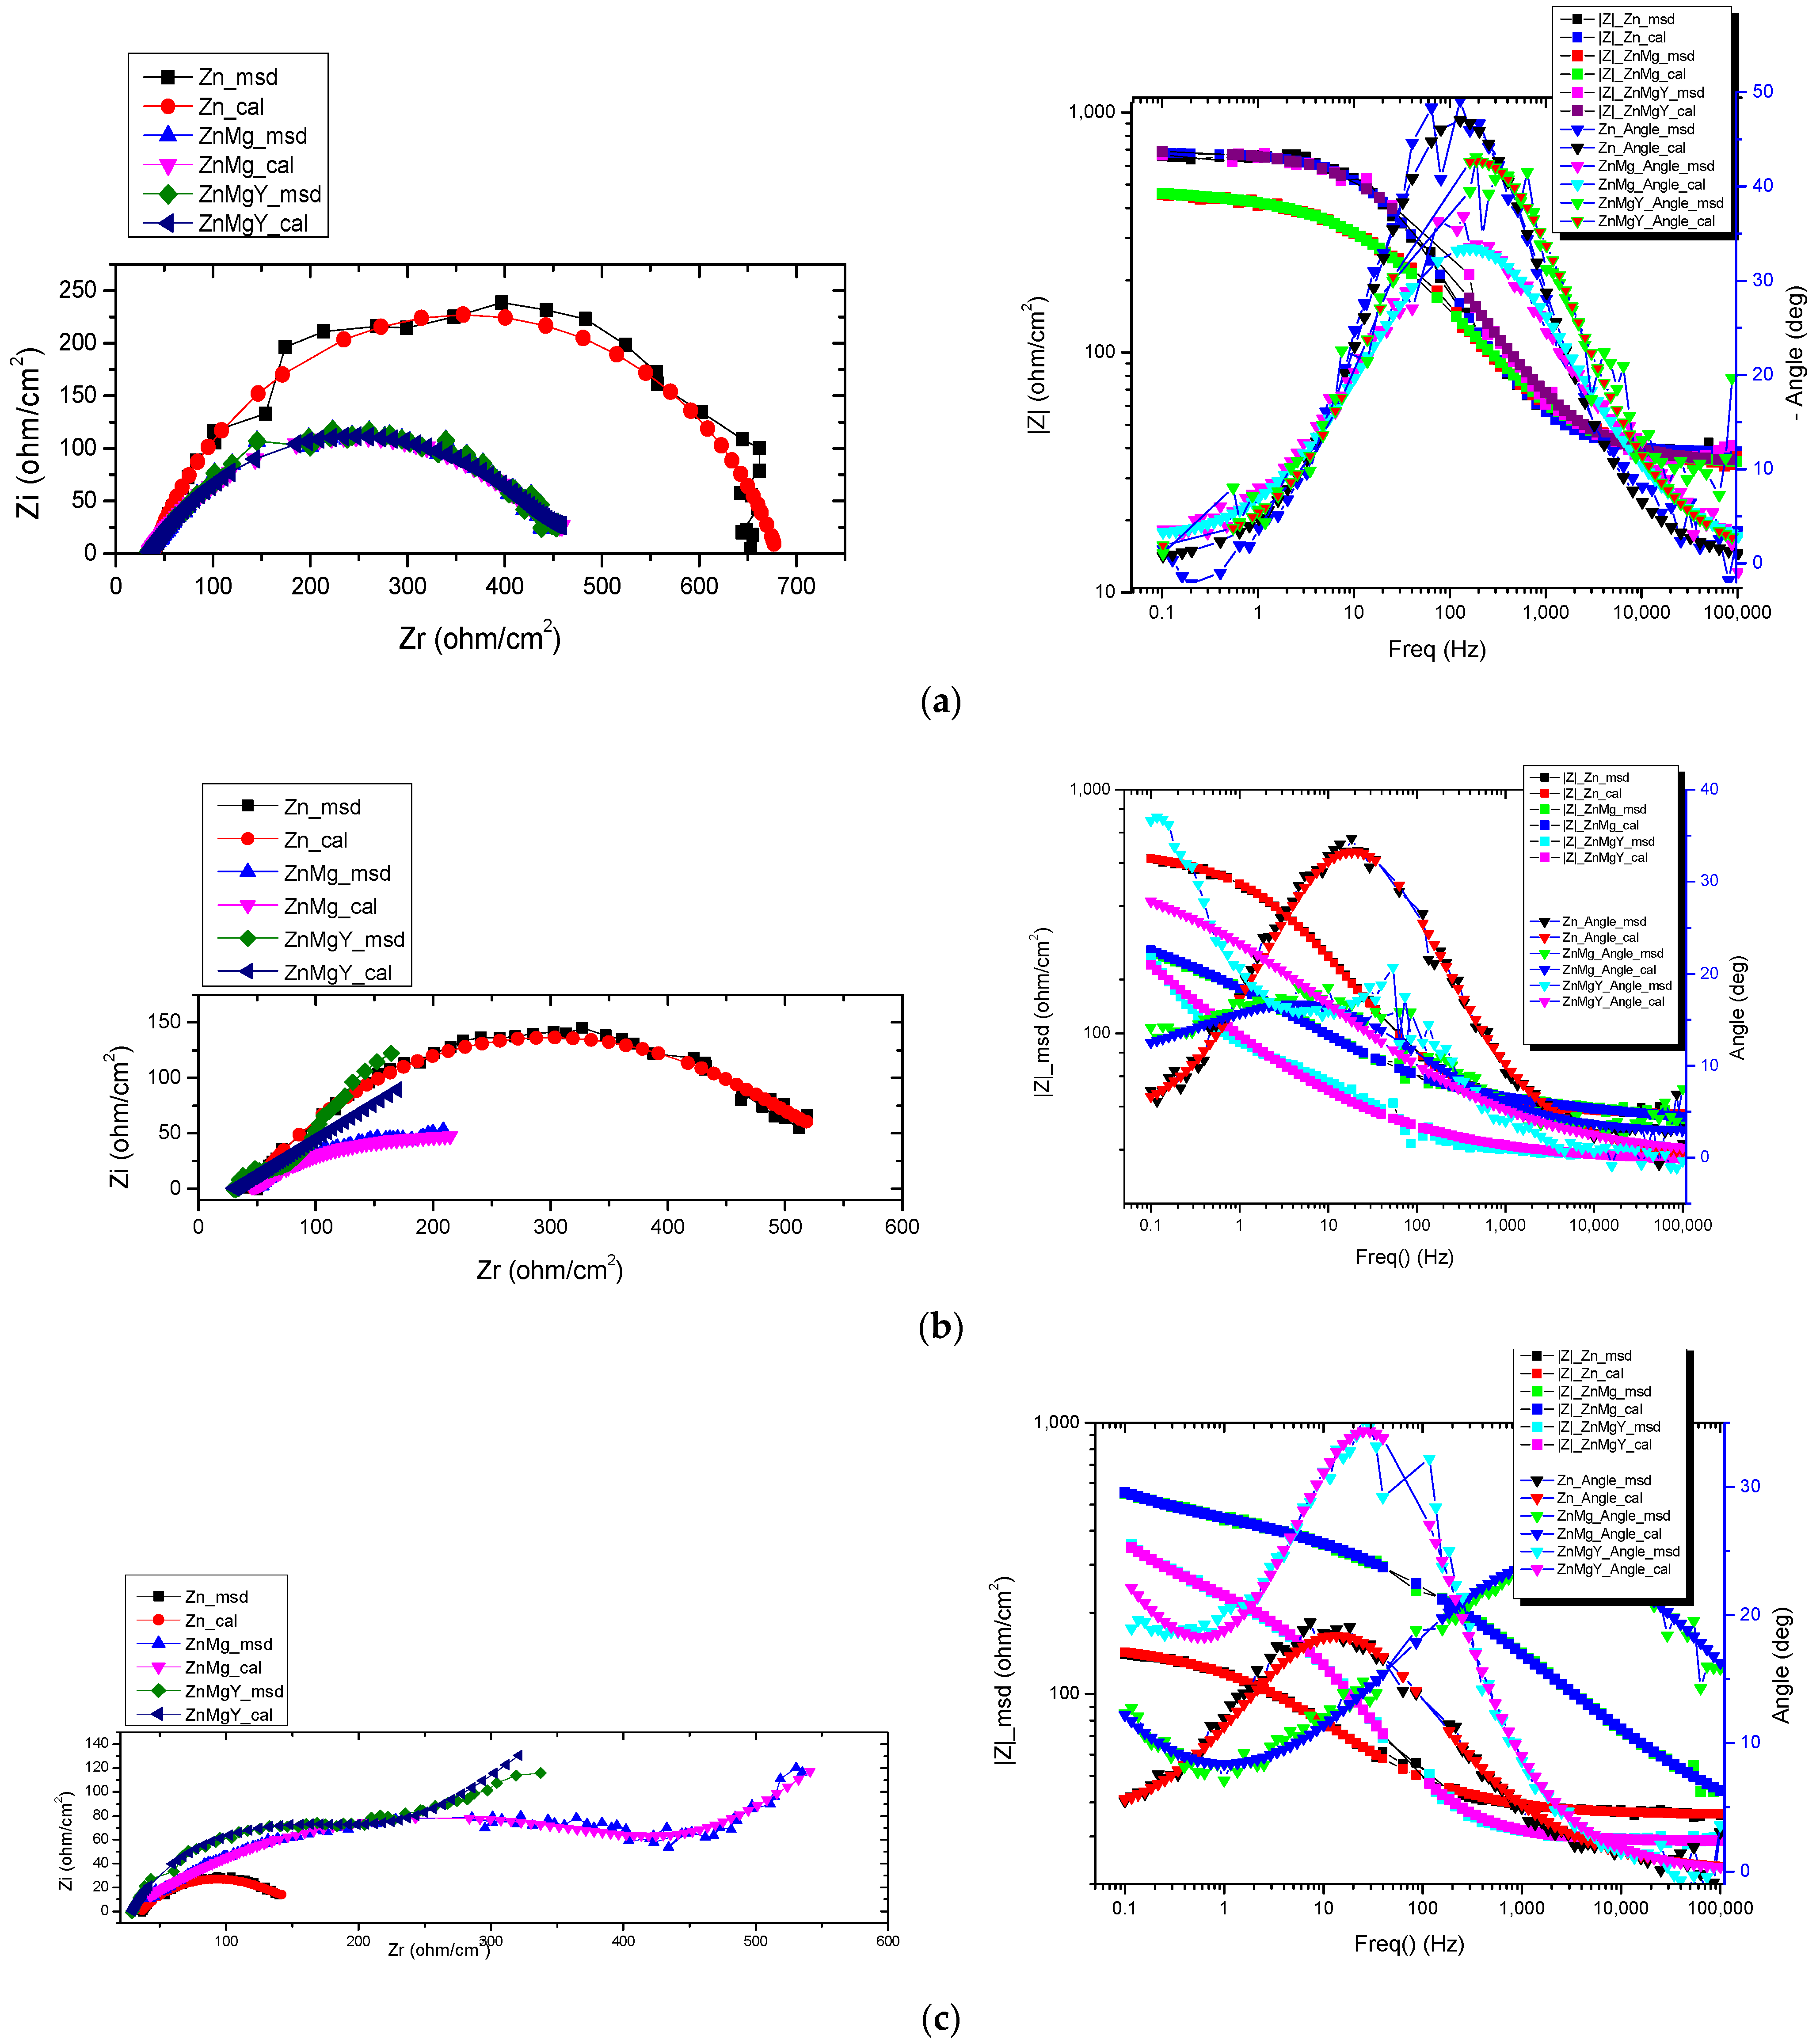
Electrochemical Impedance Spectroscopy measurements, at room temperature: working potential: open circuit potential; frequency range: 105 ÷ 0.1 Hz; potential amplitude: 10 mV.
The alloys’ surfaces and microstructures were analyzed with a scanning electron microscope: Vega Tescan-LMHII, SEM, (VegaTescan, Brno—Kohoutovice, Czech Republic). Images were obtained with a Secondary Electrons (SEs) detector with 16.0 mm working distance. Determinations of chemical composition were made with Energy Dispersive Spectroscope equipment, Bruker X-Flash, Mannheim, Germany. An XRD experiment was performed with Expert PRO MPD equipment, Panalytical (XRD, Panalytical, Almelo, The Netherlands model, with a copper X-ray tube). Immersion tests were performed in SBF solution using a thermostated enclosure at 37 ± 1 °C temperature for 1, 8 and 18 days. The samples were continuously moved from a side to the other using and automatically system at each hour. The mass variation of the samples was established using a Partner analytical balance. The samples were ultrasonically cleaned in technical alcohol for 60 min after the immersion period.

3. Results

The experimental materials were investigated by chemical composition, microstructural, mechanical properties and electro-chemical behavior in a simulated body fluid electrolyte.

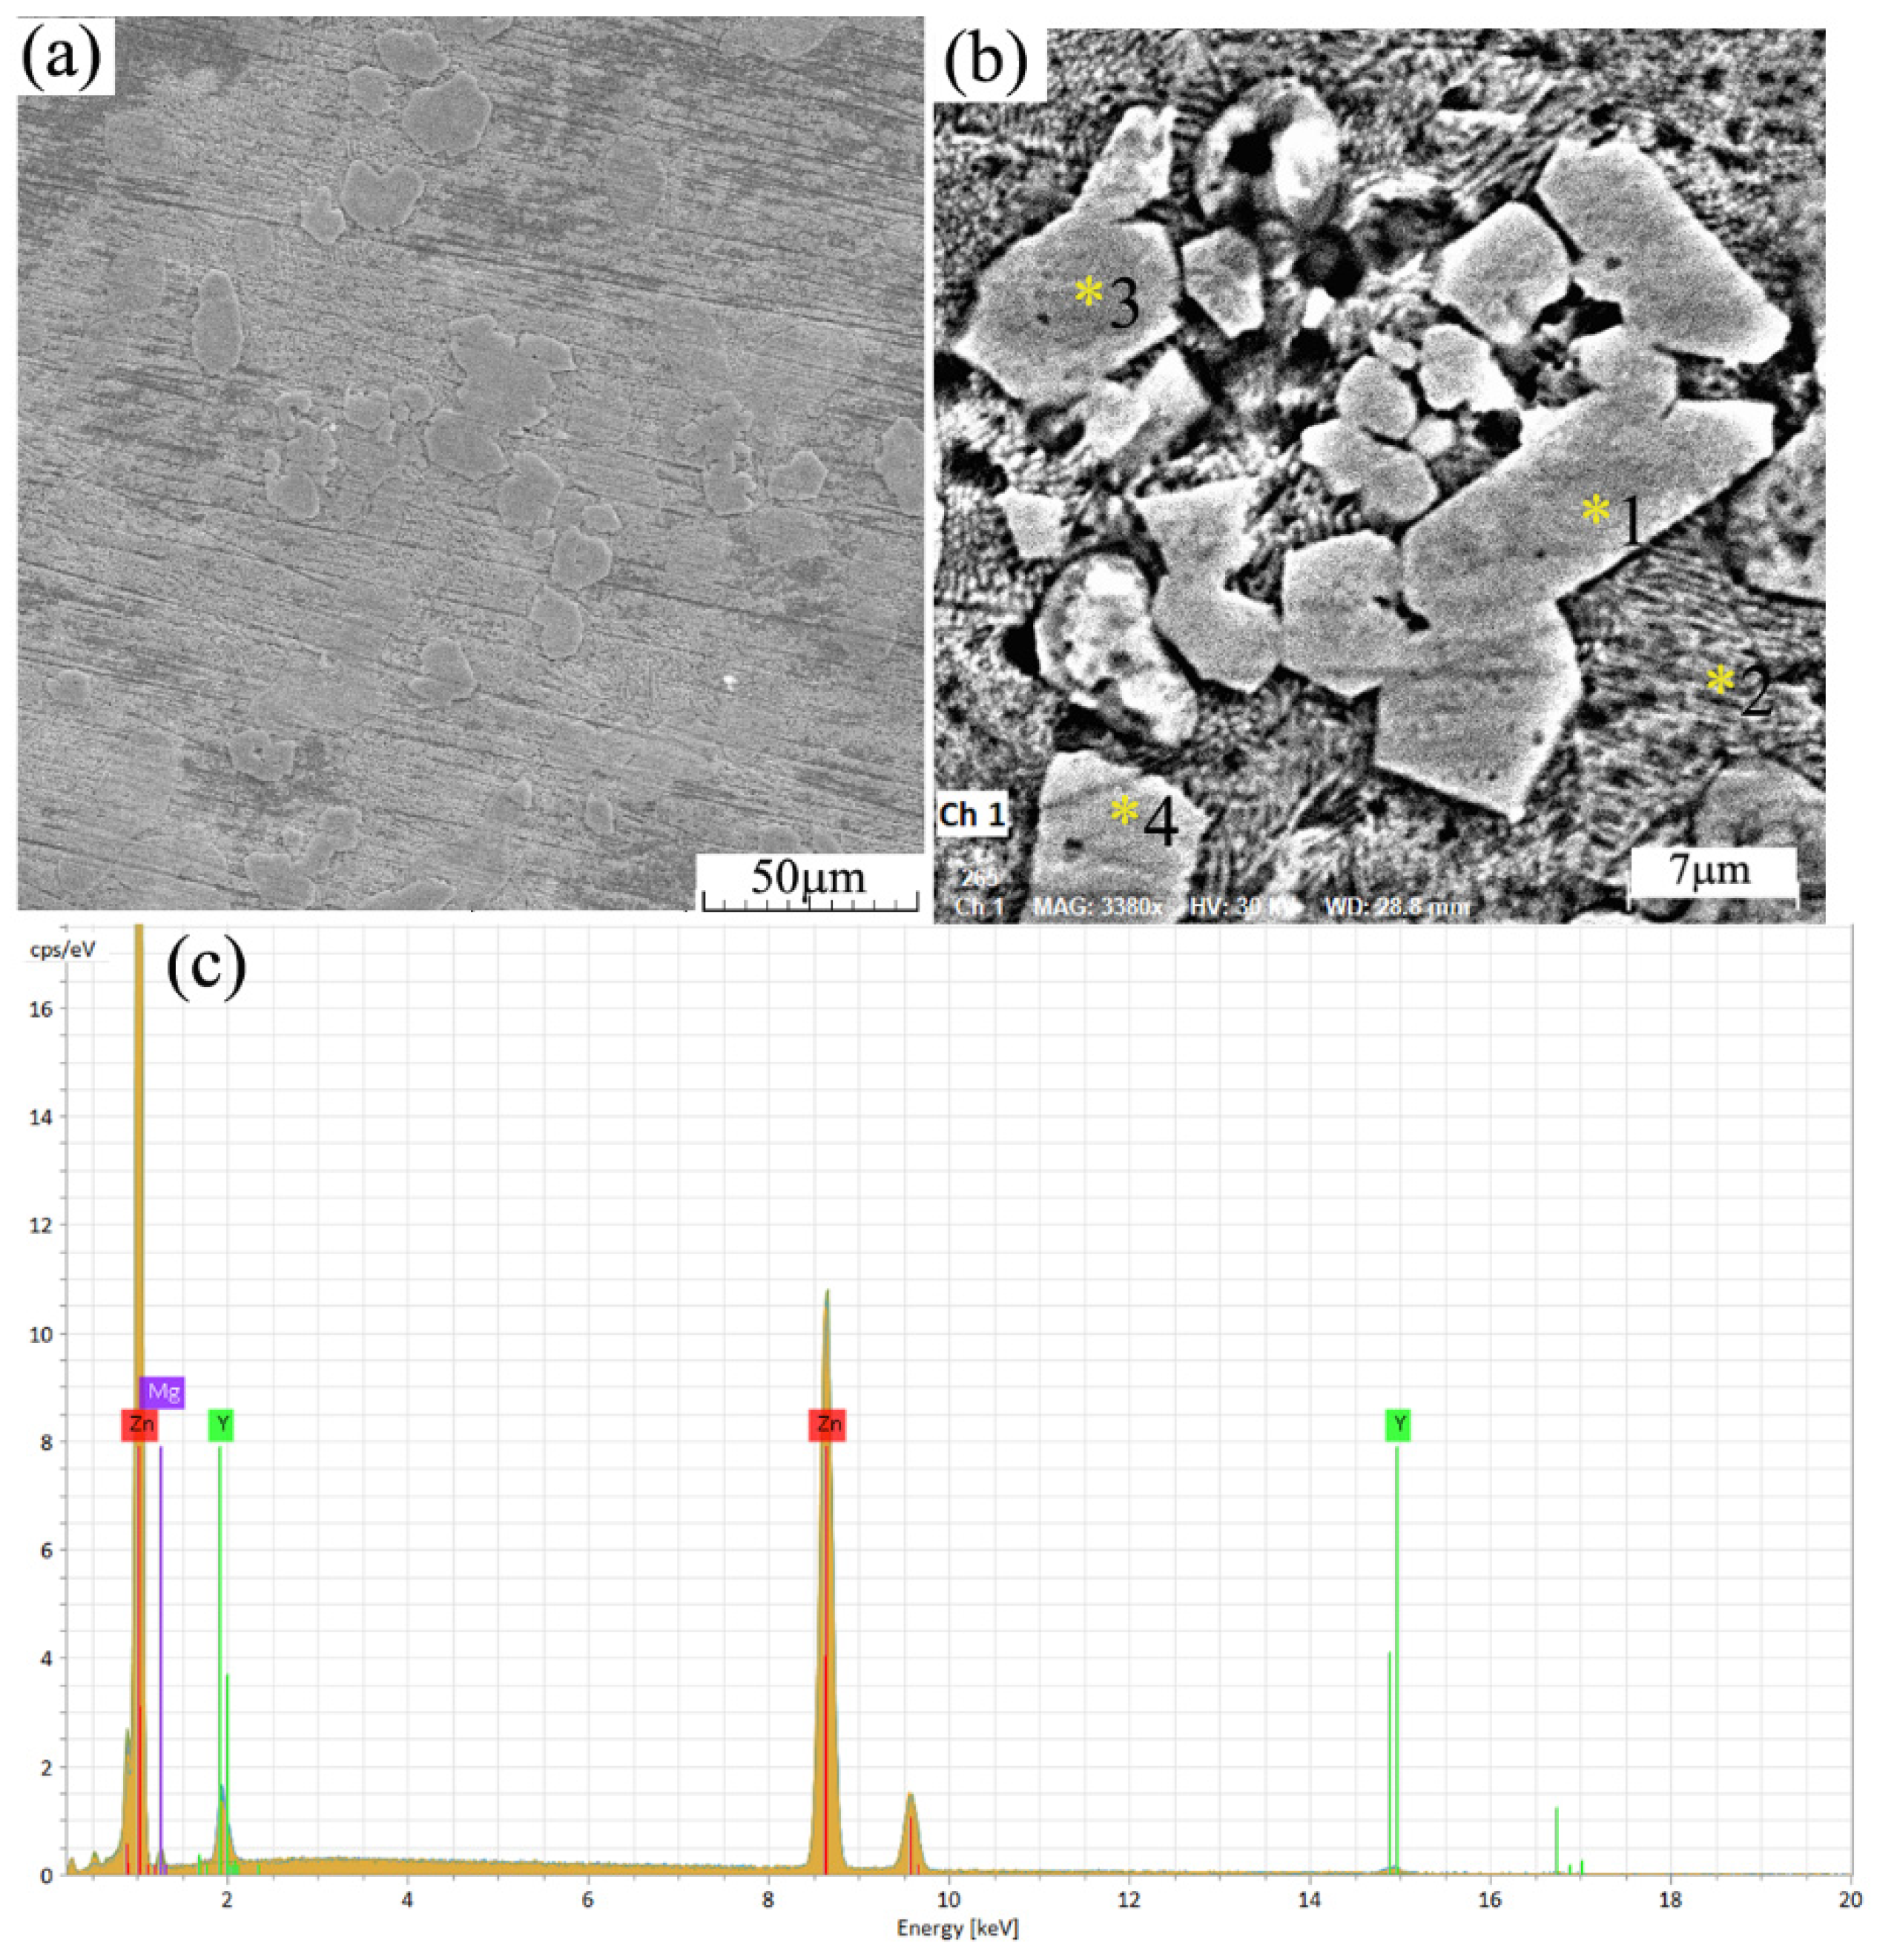
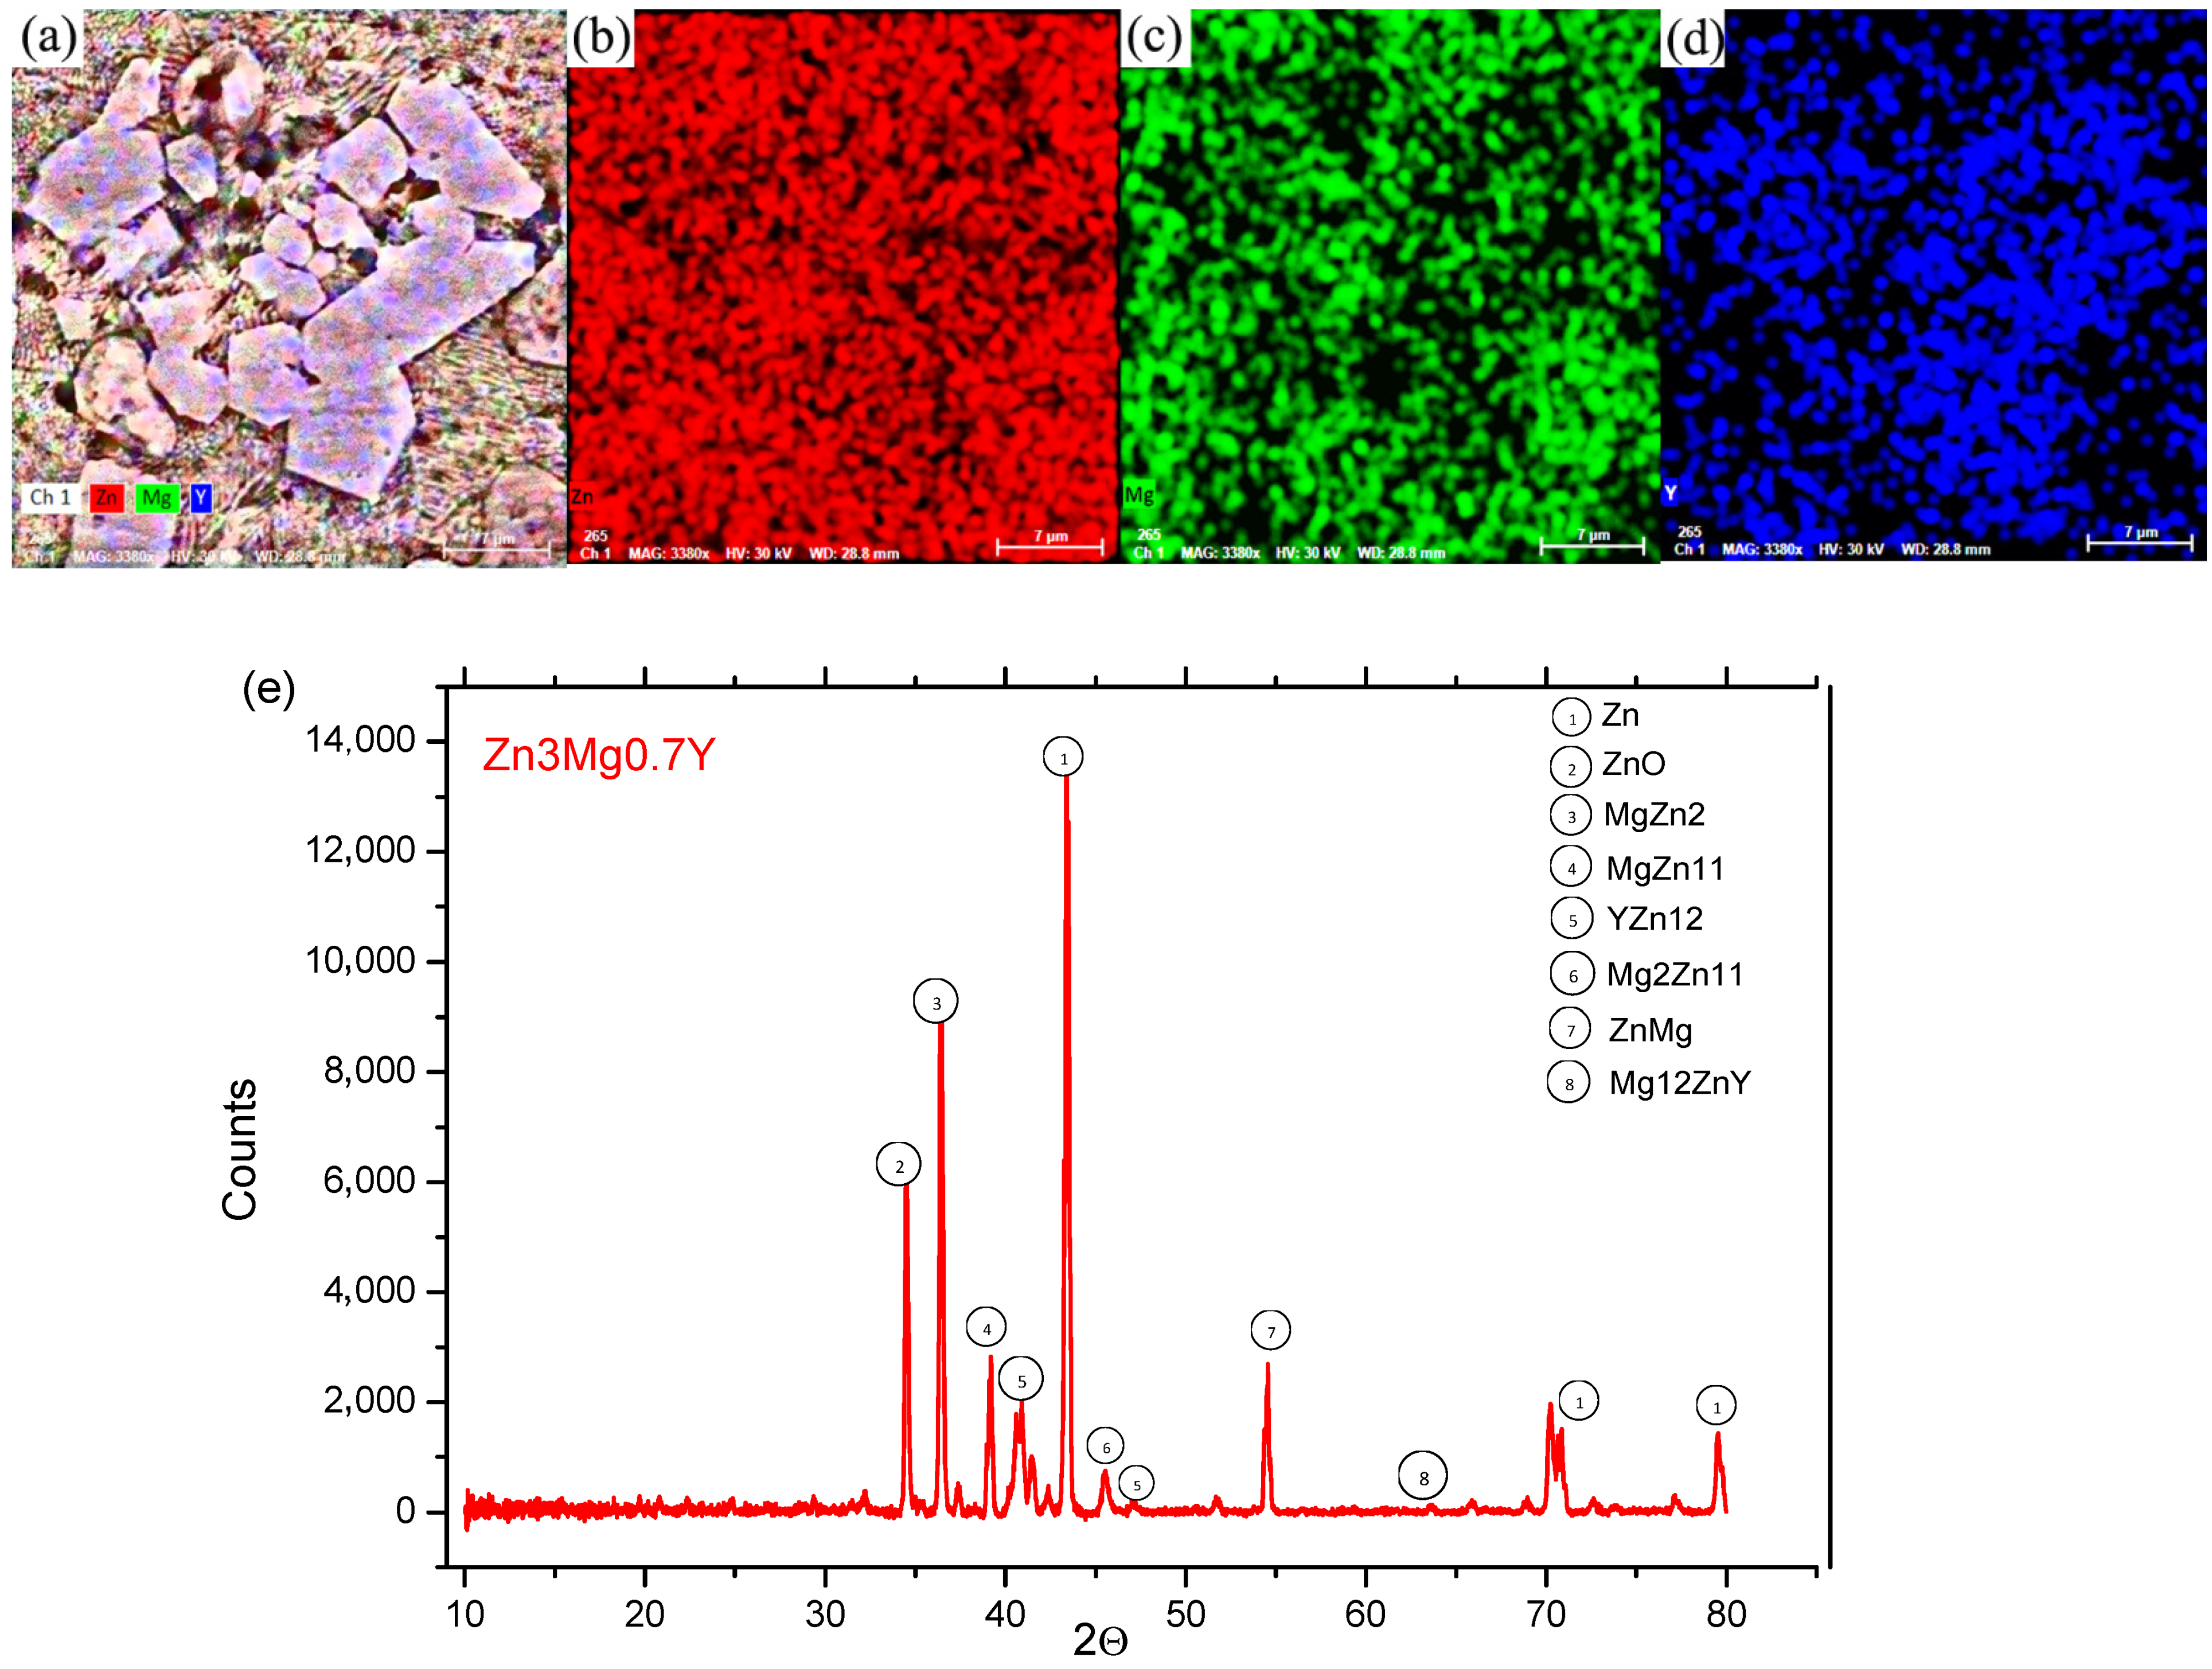
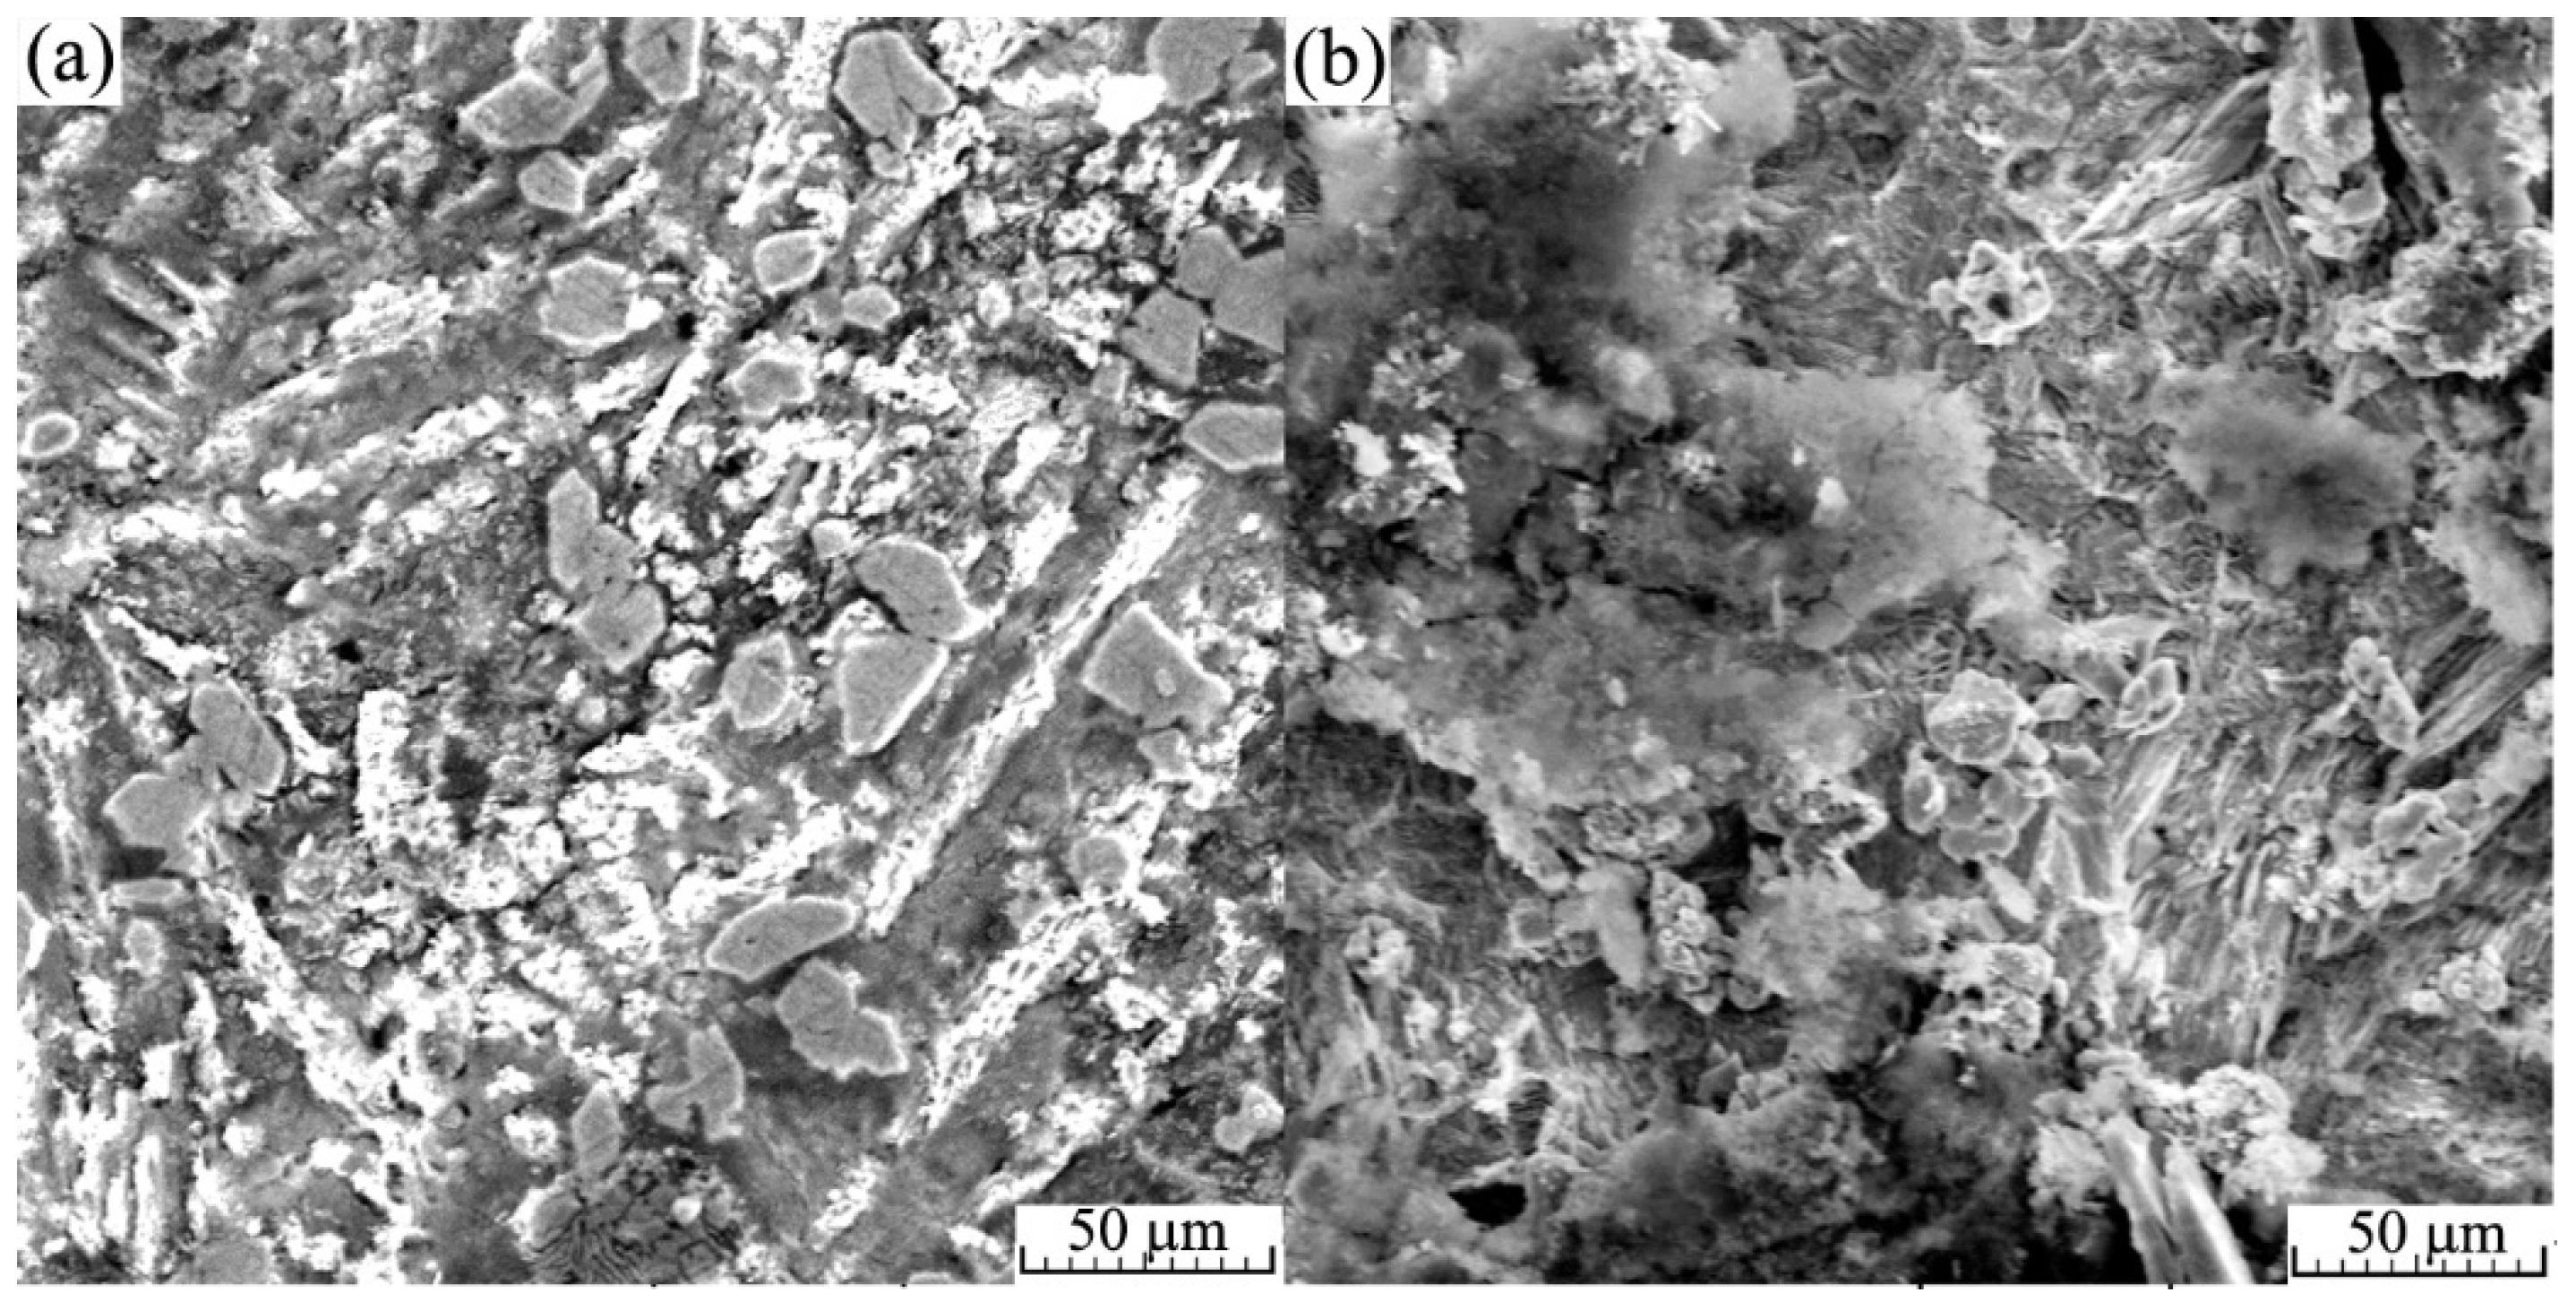
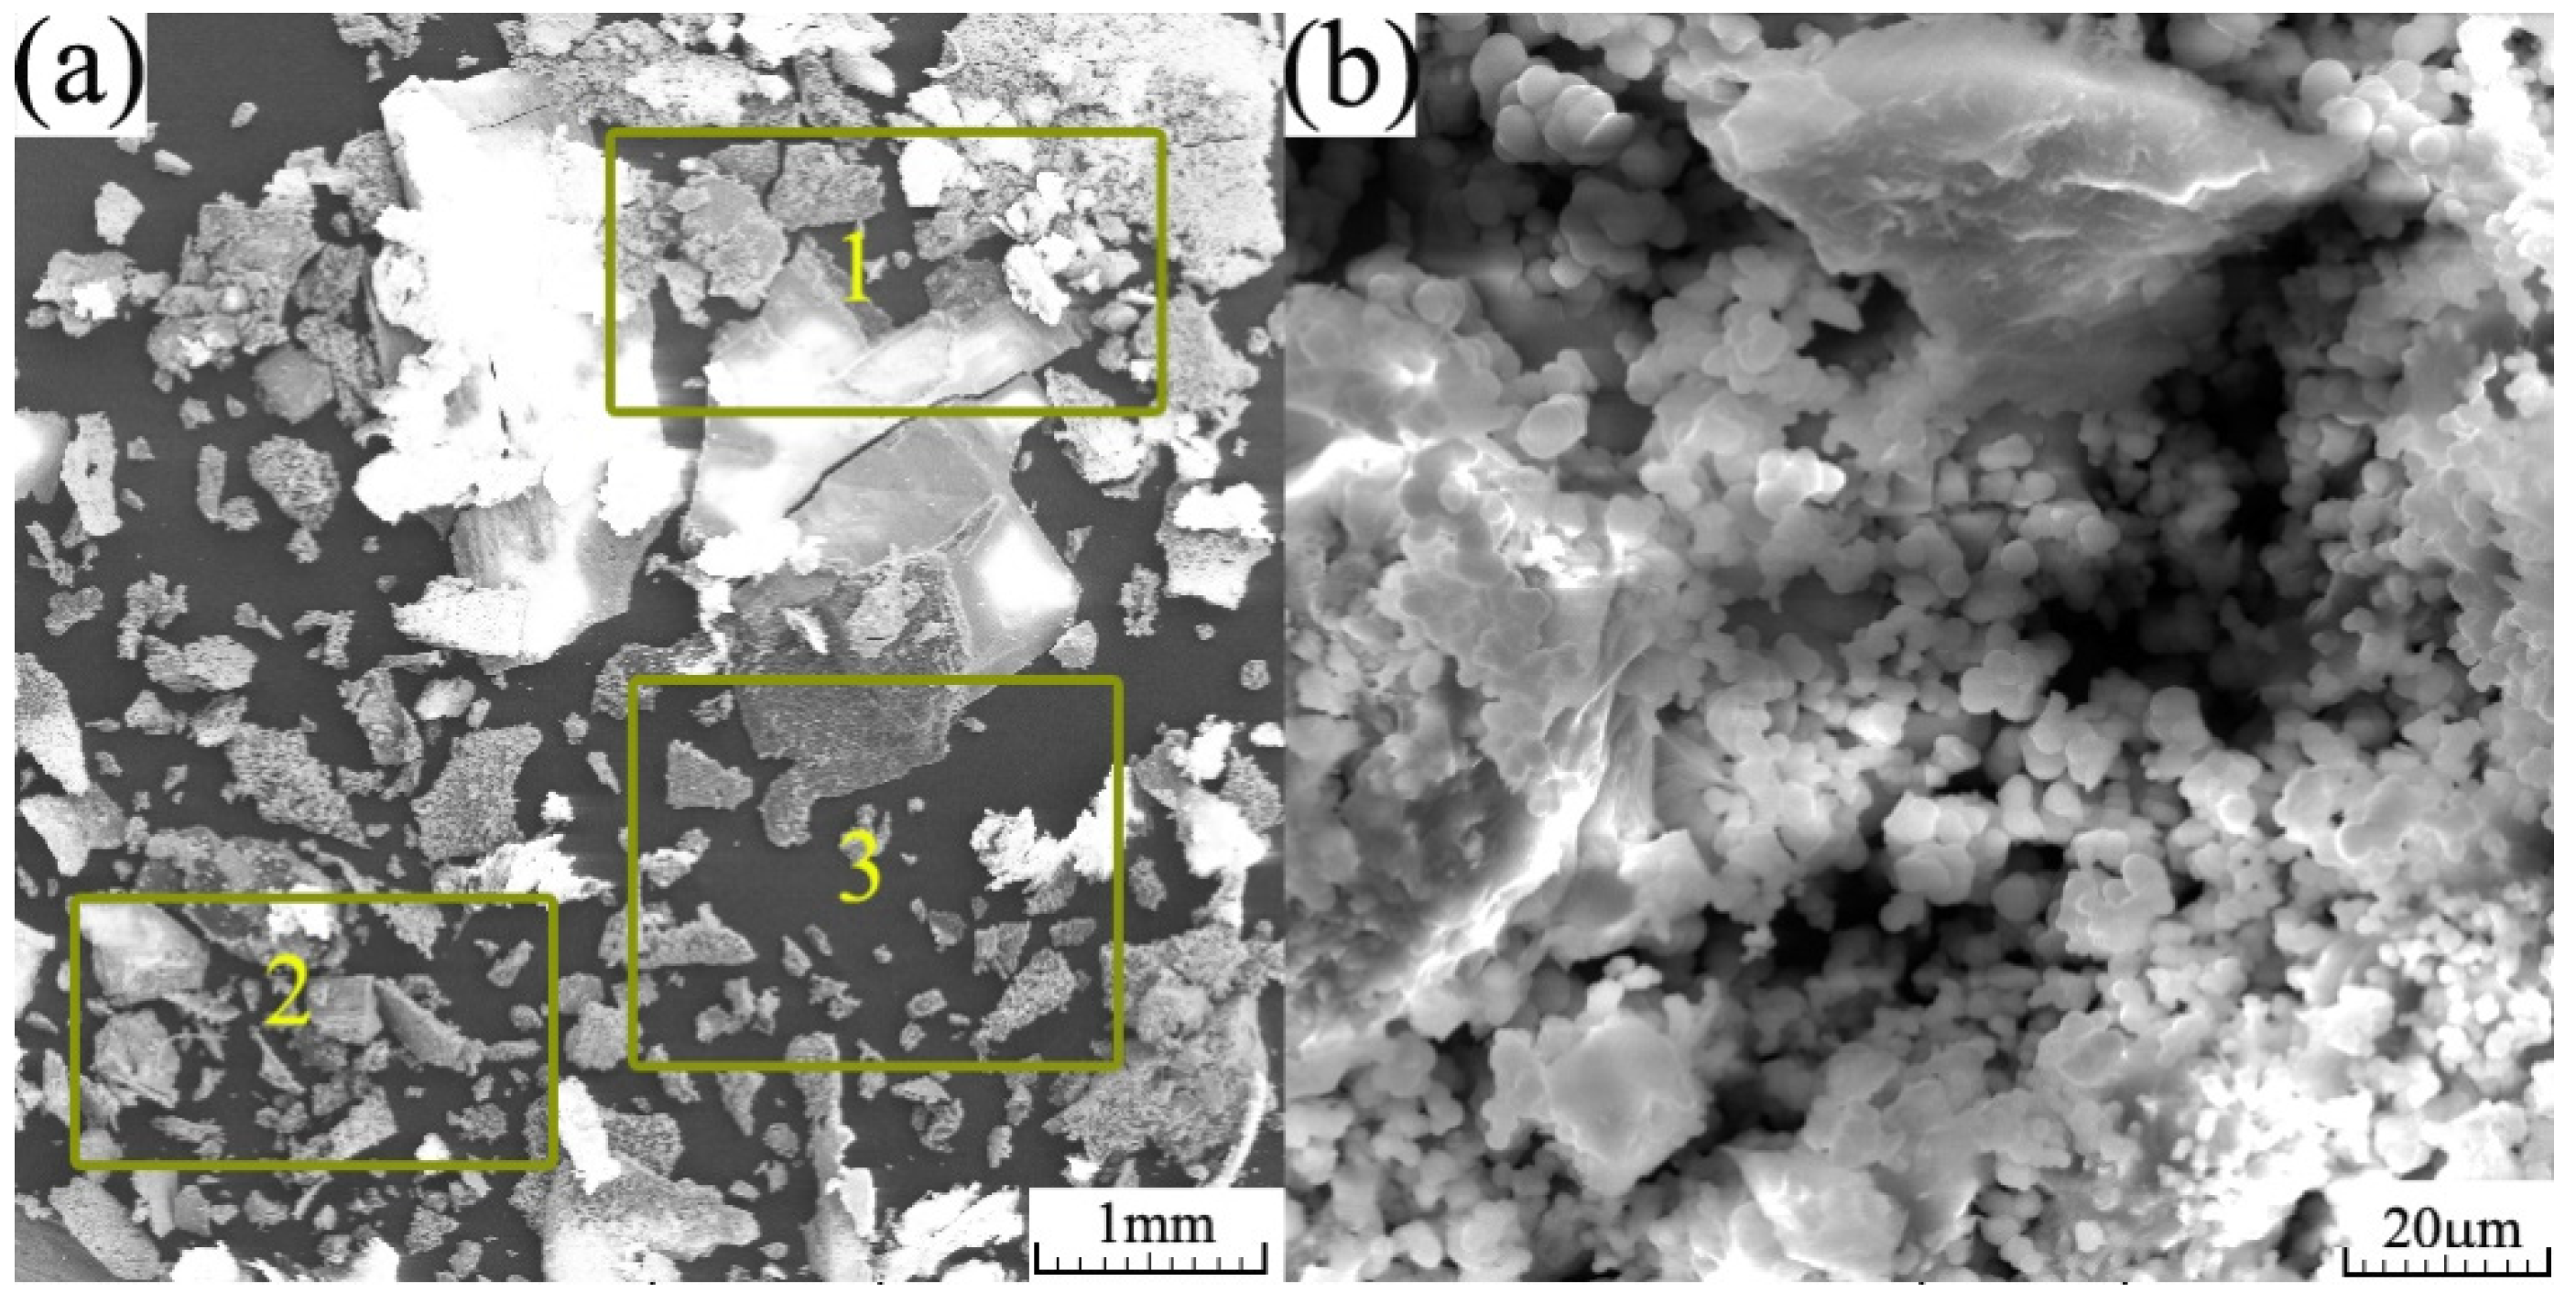
3.1. Chemical Composition Analysis and Microstructural Aspects

The experimental alloy Zn3Mg0.7Y was mechanically ground and polished, and chemical etching was performed in order to highlight the microstructure. The general aspects of the microstructure are given in Figure 2a. In Figure 2b, the microstructure of the Zn3Mg0.7Y alloy is presented after chemical etching. Structurally, a few different formations can be observed, and their chemical composition is presented in Table 1. The nature of the compounds is basically the same as Zn and Zn compounds (Mg2Zn11, Mg12ZnY and YZn12), as described and analyzed in a previous work through energy dispersive spectroscopy and X-ray diffraction [25].
In addition to reduced percentages of oxygen, which was removed from the results table, the main elements identified on the material were Zn, Mg and Y, as shown in Figure 2c. Quantitative results of chemical composition are given in Table 1 (mass and atomic percentages). The average chemical composition (on a 1 mm2 area, from five different determinations) was 3.03 wt% Mg and 0.7 wt% Y. In order to establish the most important components, we performed four determinations in the areas marked in Figure 2a. The compound analyzed in point 1 is a typical YZn12 compound (formula Zn24Y2) [26]. For point 2, the matrix of the material was analyzed, which consists of a solid solution of α-Zn with dissolved Mg. Point three and four also represent ZnY and ZnMgY compounds.
At the microscale, no structural defects, such as pores, cracks or voids, were identified after the material was re-melted five times. The experimental alloy was chemically homogeneous, without separations and agglomerations of undissolved elements.
Figure 3 shows the elemental mapping of chemical elemental components: all of them are in Figure 3a, and they are shown separately in Figure 3b–d, presenting the good chemical homogeneity of the material and highlighting the formation of ZnMg- and ZnY-based compounds. The XRD result for the Zn3Mg0.7Y alloy, as shown in Figure 3e, presented a main peak of α-Zn and compounds formed with Mg and Y. The intermetallic compound YZn12, as shown by point 1 in Table 1, was identified and confirmed on the XRD chart along with other compounds, such as MgZn2, MgZn11, ZnMg, Mg12ZnY and Mg2Zn11, as discussed and analyzed in [20].

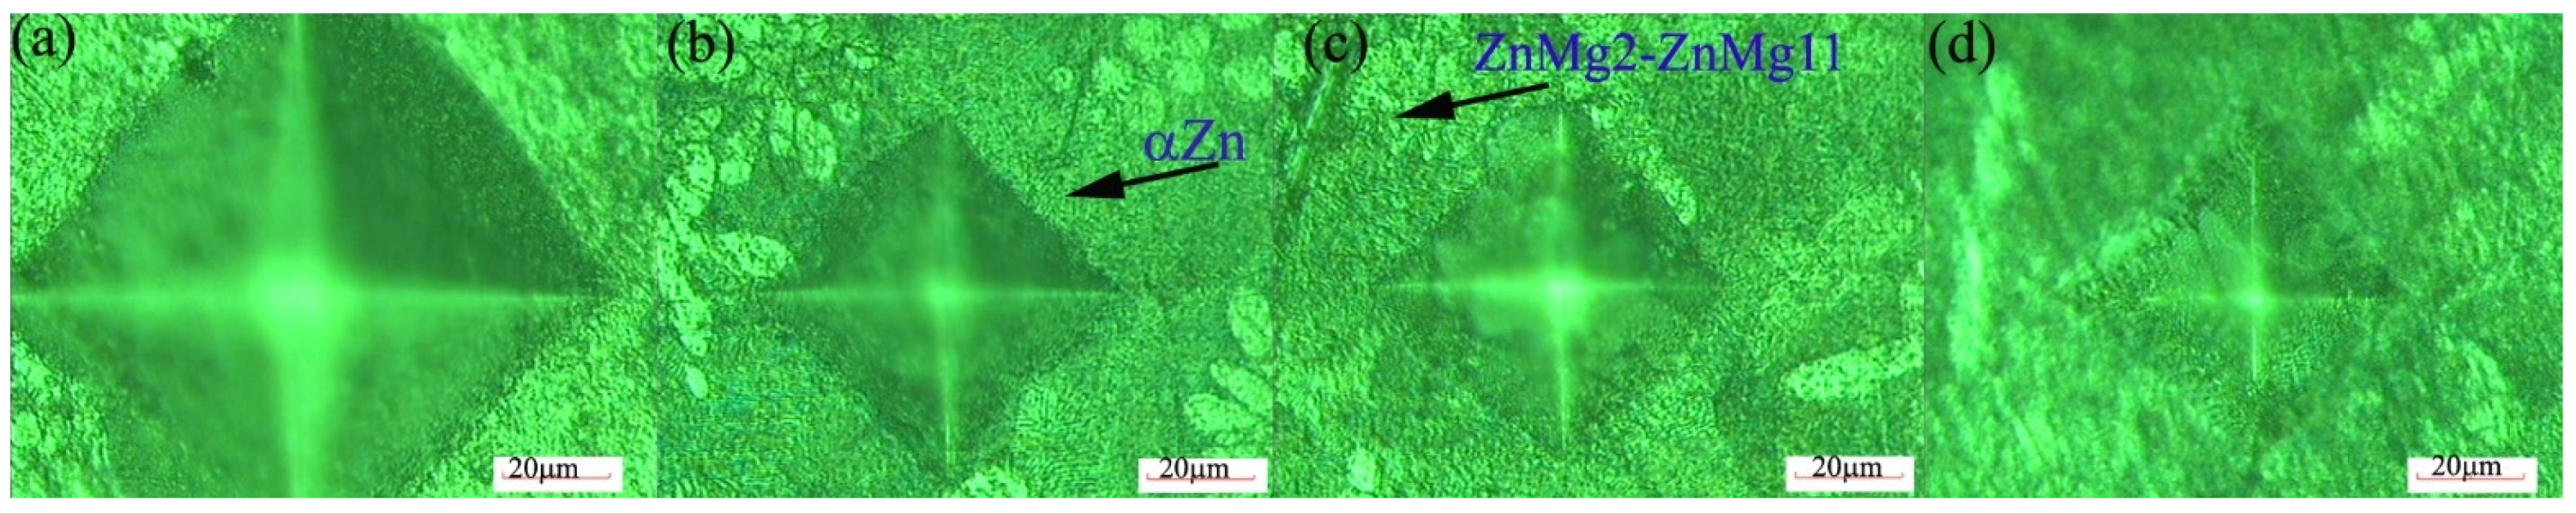
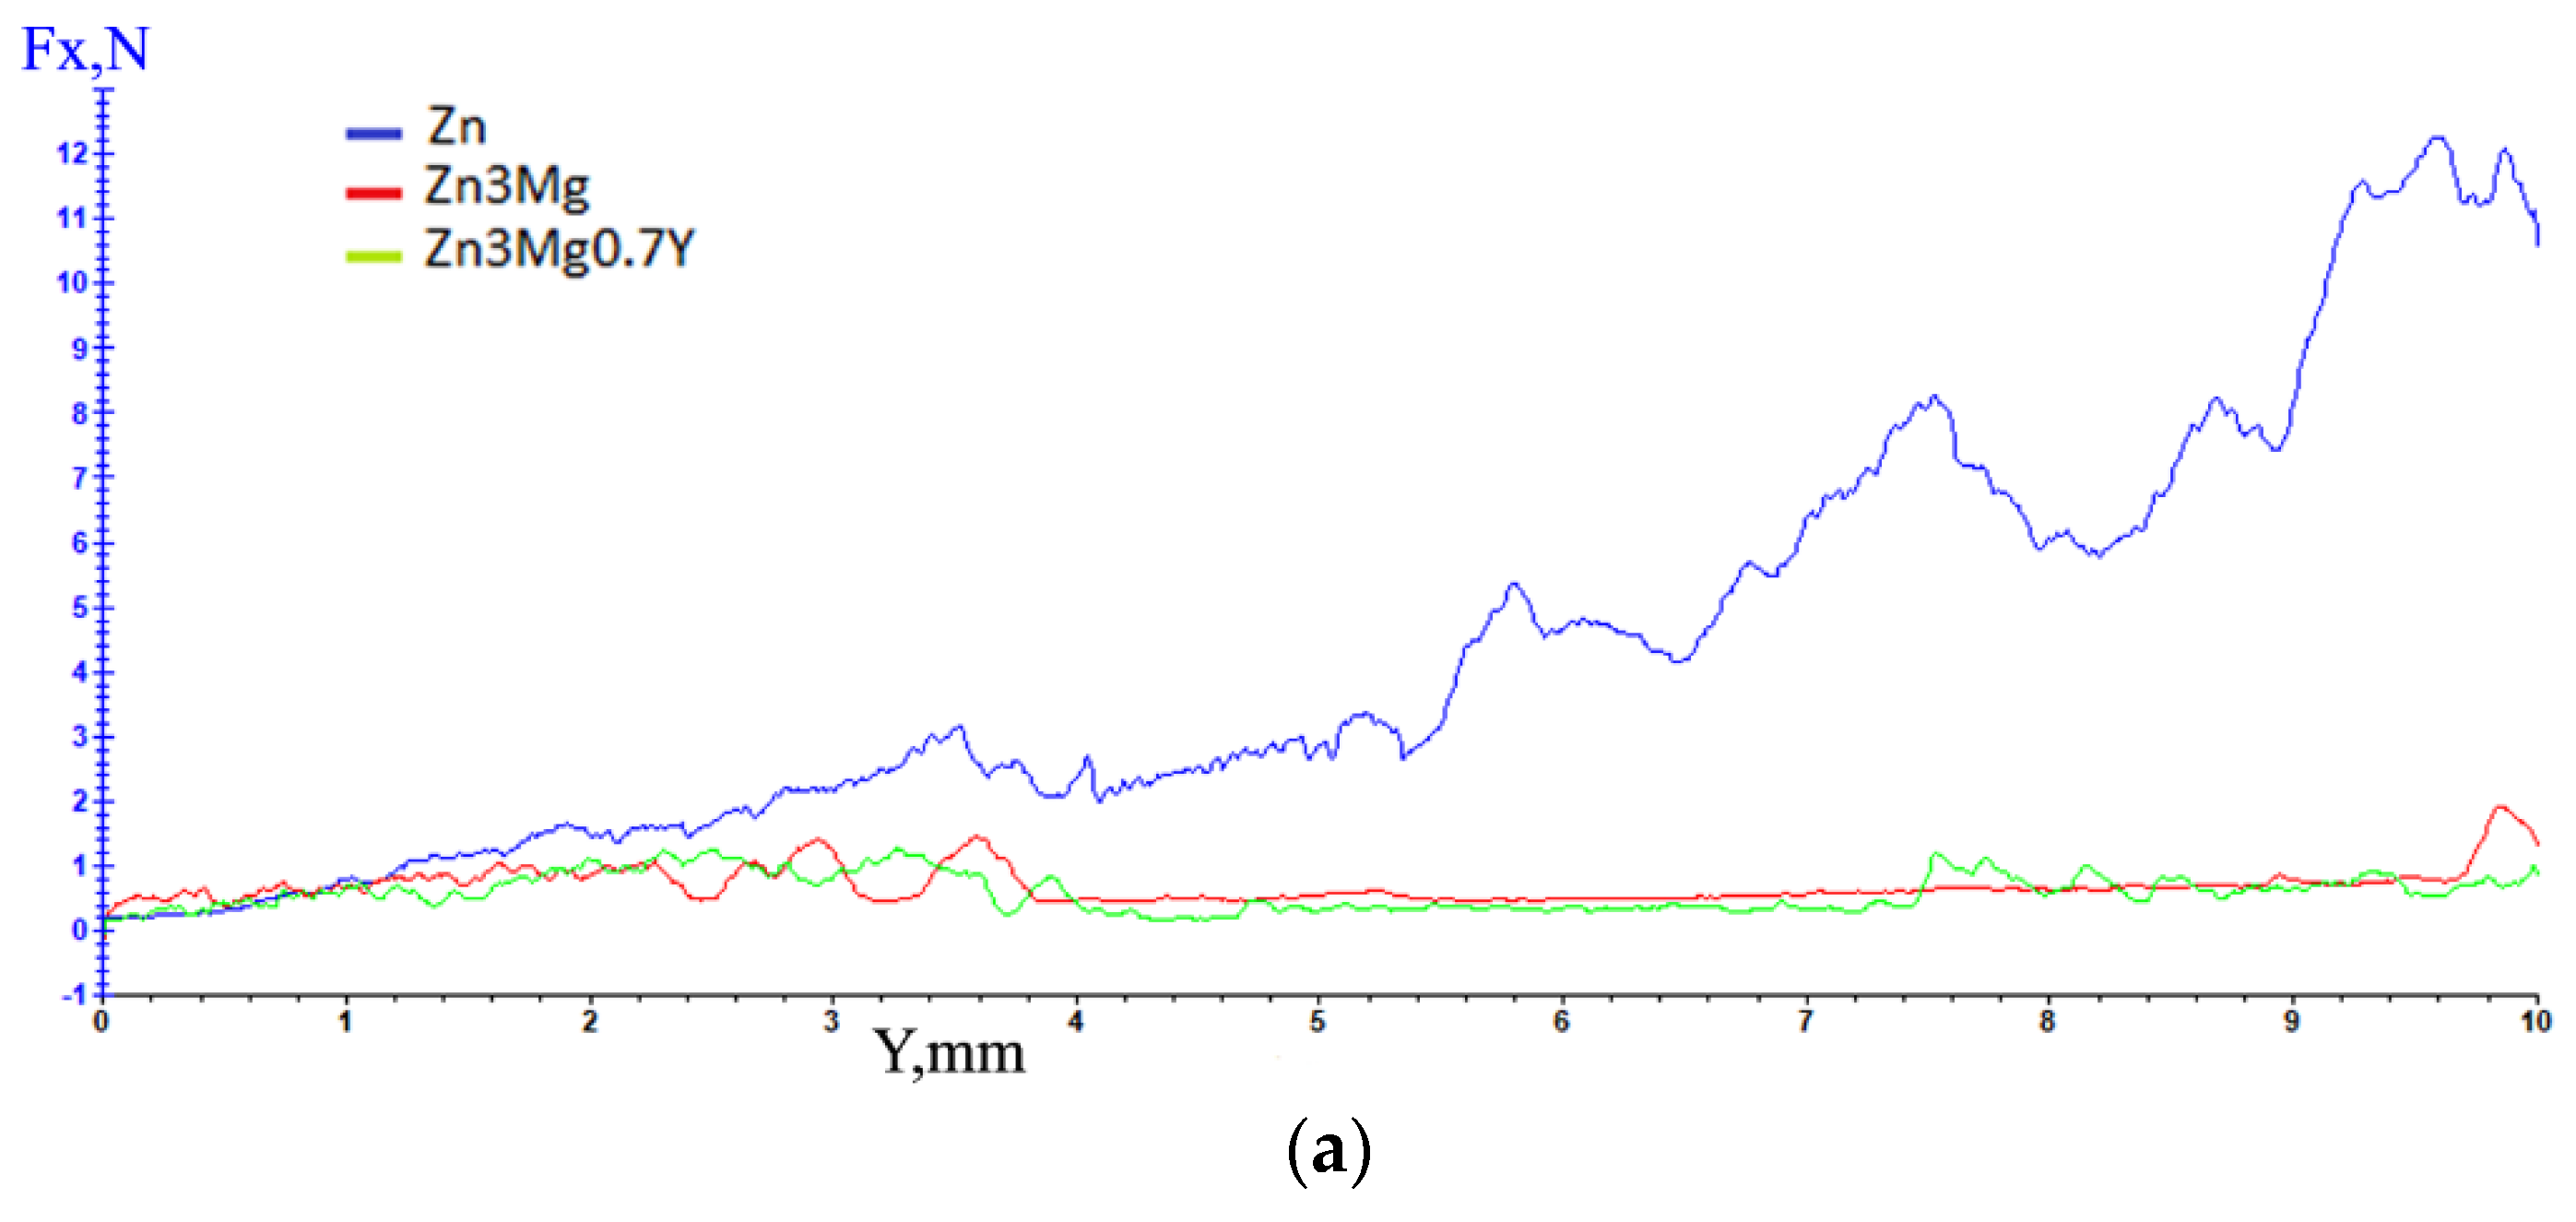
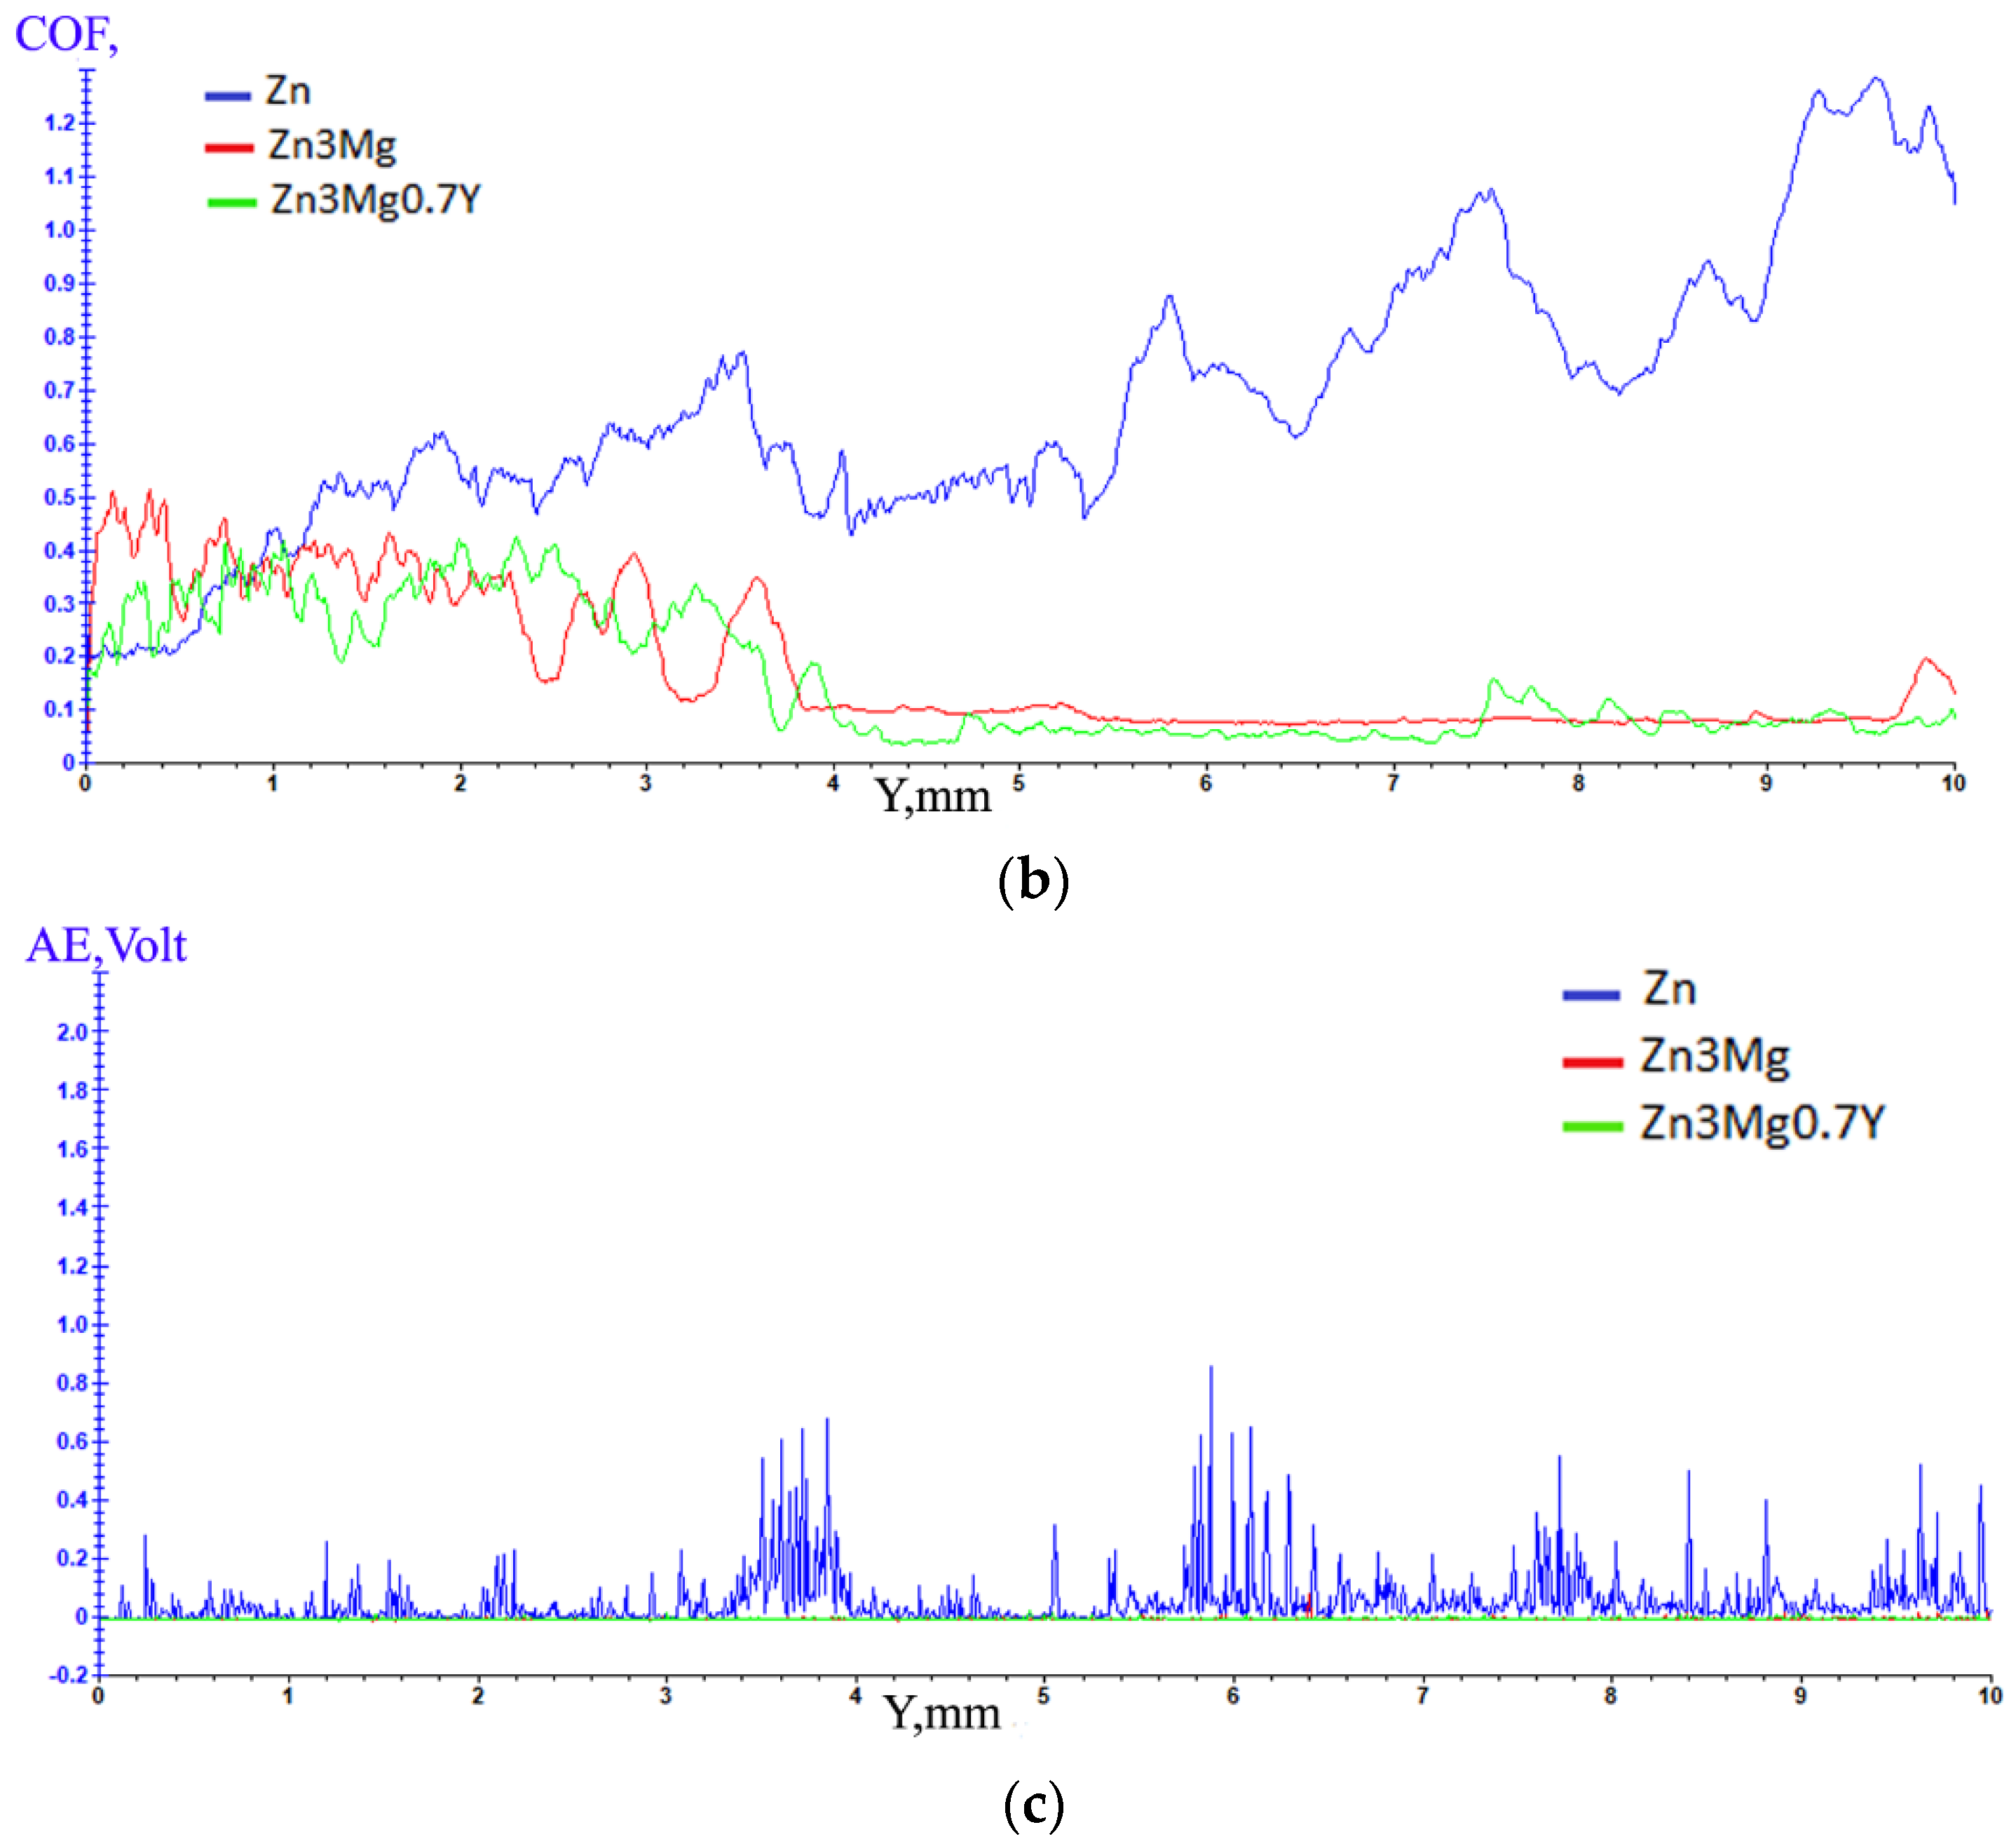
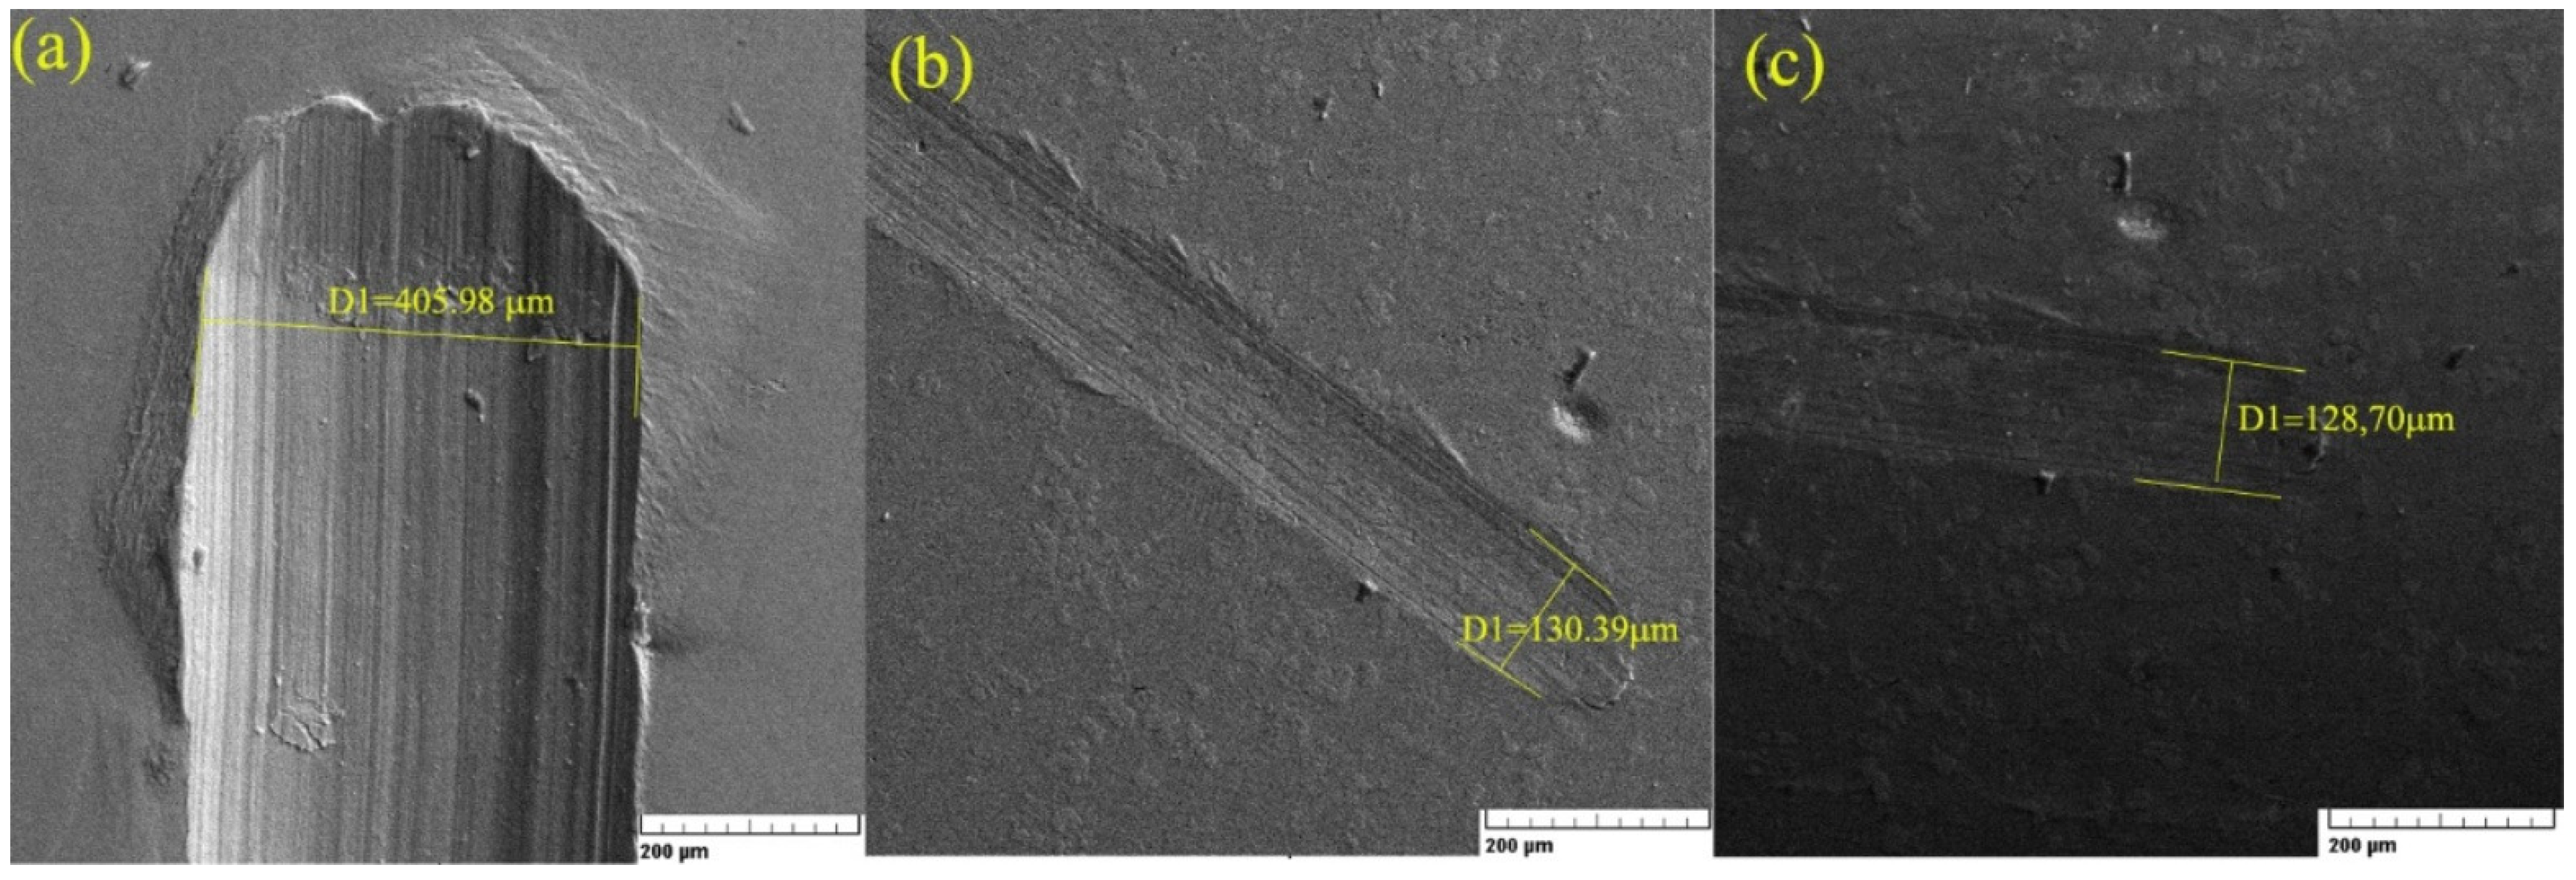
3.2. Microhardness and Microscratch Behavior of the Experimental Materials

The influence of the addition of Mg and Y elements on mechanical properties was obvious, first of all based on the differences between the indentor microhardness test traces, as shown in Figure 4a–d. The traces decreased in dimensions from Zn to ZnMg, and Zn3Mg0.7Y, based on the superior hardness of the compounds, formed between ZnMg and ZnY, while it did not form for pure Zn. The dimensional difference between the traces from Figure 4b,c was shown by the MgZn compounds (MgZn2, MgZn11) caught during the second test on the Zn3Mg alloy and explains the differences between the microhardness results in Table 2 (points 1 and 4).
The formation of ZnMg and ZnY compounds improved the microhardness of the pure Zn by more than two-fold. The contribution of Y and especially the YZn compounds was the increase in the microhardness of the material. Except two areas—probably with a lower content of ZnMg and ZnY compounds, points 1 and 4—all the results for Zn3Mg0.7Y material presented a higher hardness compared to the Zn3Mg alloy.
Li et al. [27] obtained (microalloyed with Al, Mn, Cu and Ag) a Vickers hardness of 51 ± 3.4 HV for Zn, and after alloying with Li, a value of 90 ± 6.9 HV. Yang et al. [28] also present an increase in the Vickers hardness of pure zinc with the addition of Ca and Cu from 32.12 HV to 71.83 HV Zn-1Ca-0.5Cu. Xivei Liu obtain the following values of microhardness: 93.71 HV for the Zn–1Mg–0.1Sr alloy, and 109.34 HV for the Zn–1Mg–0.5Sr alloy, which are higher than those of pure Zn, suggesting the effectiveness of alloying in improving its mechanical property [29]. Pachla et al. present Vickers hardness values for samples Zn0.5Mg, Zn1Mg and Zn1.5Mg after a hot extrusion process: 75 HV, 95HV and 115 HV, respectively [30,31].
The scratch test is regularly used for the assessment of the cohesive and adhesive strength of thin films and coatings. By default, its evaluation is based on the analysis of the depth–load–time record and the microscopic observation of residual scratch grooves [32]. In our case, we tested the materials in order to compare their behavior for similar reasons. In Figure 5, the scratch behavior of the samples is presented for Figure 5a Fx vs. Y (mm), Figure 5b COF vs. Y (mm) and Figure 5c AE vs. Y (mm). The quantitative results are given in Table 3. Both the force F and friction coefficient COF presented similar behaviors with higher values for pure Zn and similar variations for Zn3Mg and Zn3Mg0.7Y. Based on the behavior of pure Zn, the increase in Fx and COF values can be attributed to overlapping of the soft Zn matrix, especially on the first 4 μm of the scratch.
The visual analysis of the residual groove provides the most detailed description of the final damage of the surface (crack patterns, extent of plastic deformation, delamination, etc.), but it may be a time-consuming approach. Although the continuous recording of indenter penetration depth and applied load offers instantaneous information about the performance of the tested material, it may not provide a sufficient description of the sample’s deformation behavior [33]. Therefore, other complementary techniques for the description of the deformation response to scratch loading are desirable. The continuous recording of acoustic emissions (AE) generated during the test could be a possible solution. Especially the ability of the AE method to detect the very first and even subsurface failures of the material is of the utmost importance and otherwise inaccessible by standardly used techniques [34,35].
Figure 6 shows given SEM scratch stain images in Figure 6a pure Zn, Figure 6b Zn3Mg and Figure 6c Zn3Mg0.7Y. Different widths of the scratch stain were observed with a dimension three times bigger for pure Zn (~400 μm) compared to ZnMg (~130 μm) and ZnMgY (~125 μm). Overlapped material is observed in case of pure Zn and no scratch or voids are present at the edges of the scratch stain.
The soft nature of pure Zn increased the value of Fx (N) force necessary to scratch the material, and a higher value of the friction coefficient was obtained for pure zinc. The friction coefficient as 3.8 times higher for pure Zn compared with Zn3Mg and 4.32 times higher than that of the Zn3Mg0.7Y alloy.
The AE (acoustic emission) values were appropriate for Zn3Mg and Zn3Mg0.7Y alloys and at a low intensity compared to pure zinc, which presented high variations, as shown in Figure 5c, on different areas. The AE values were ten times smaller than those of pure Zn, which is in accordance with the SEM images of the scratch stains and variations of COF and Fx.

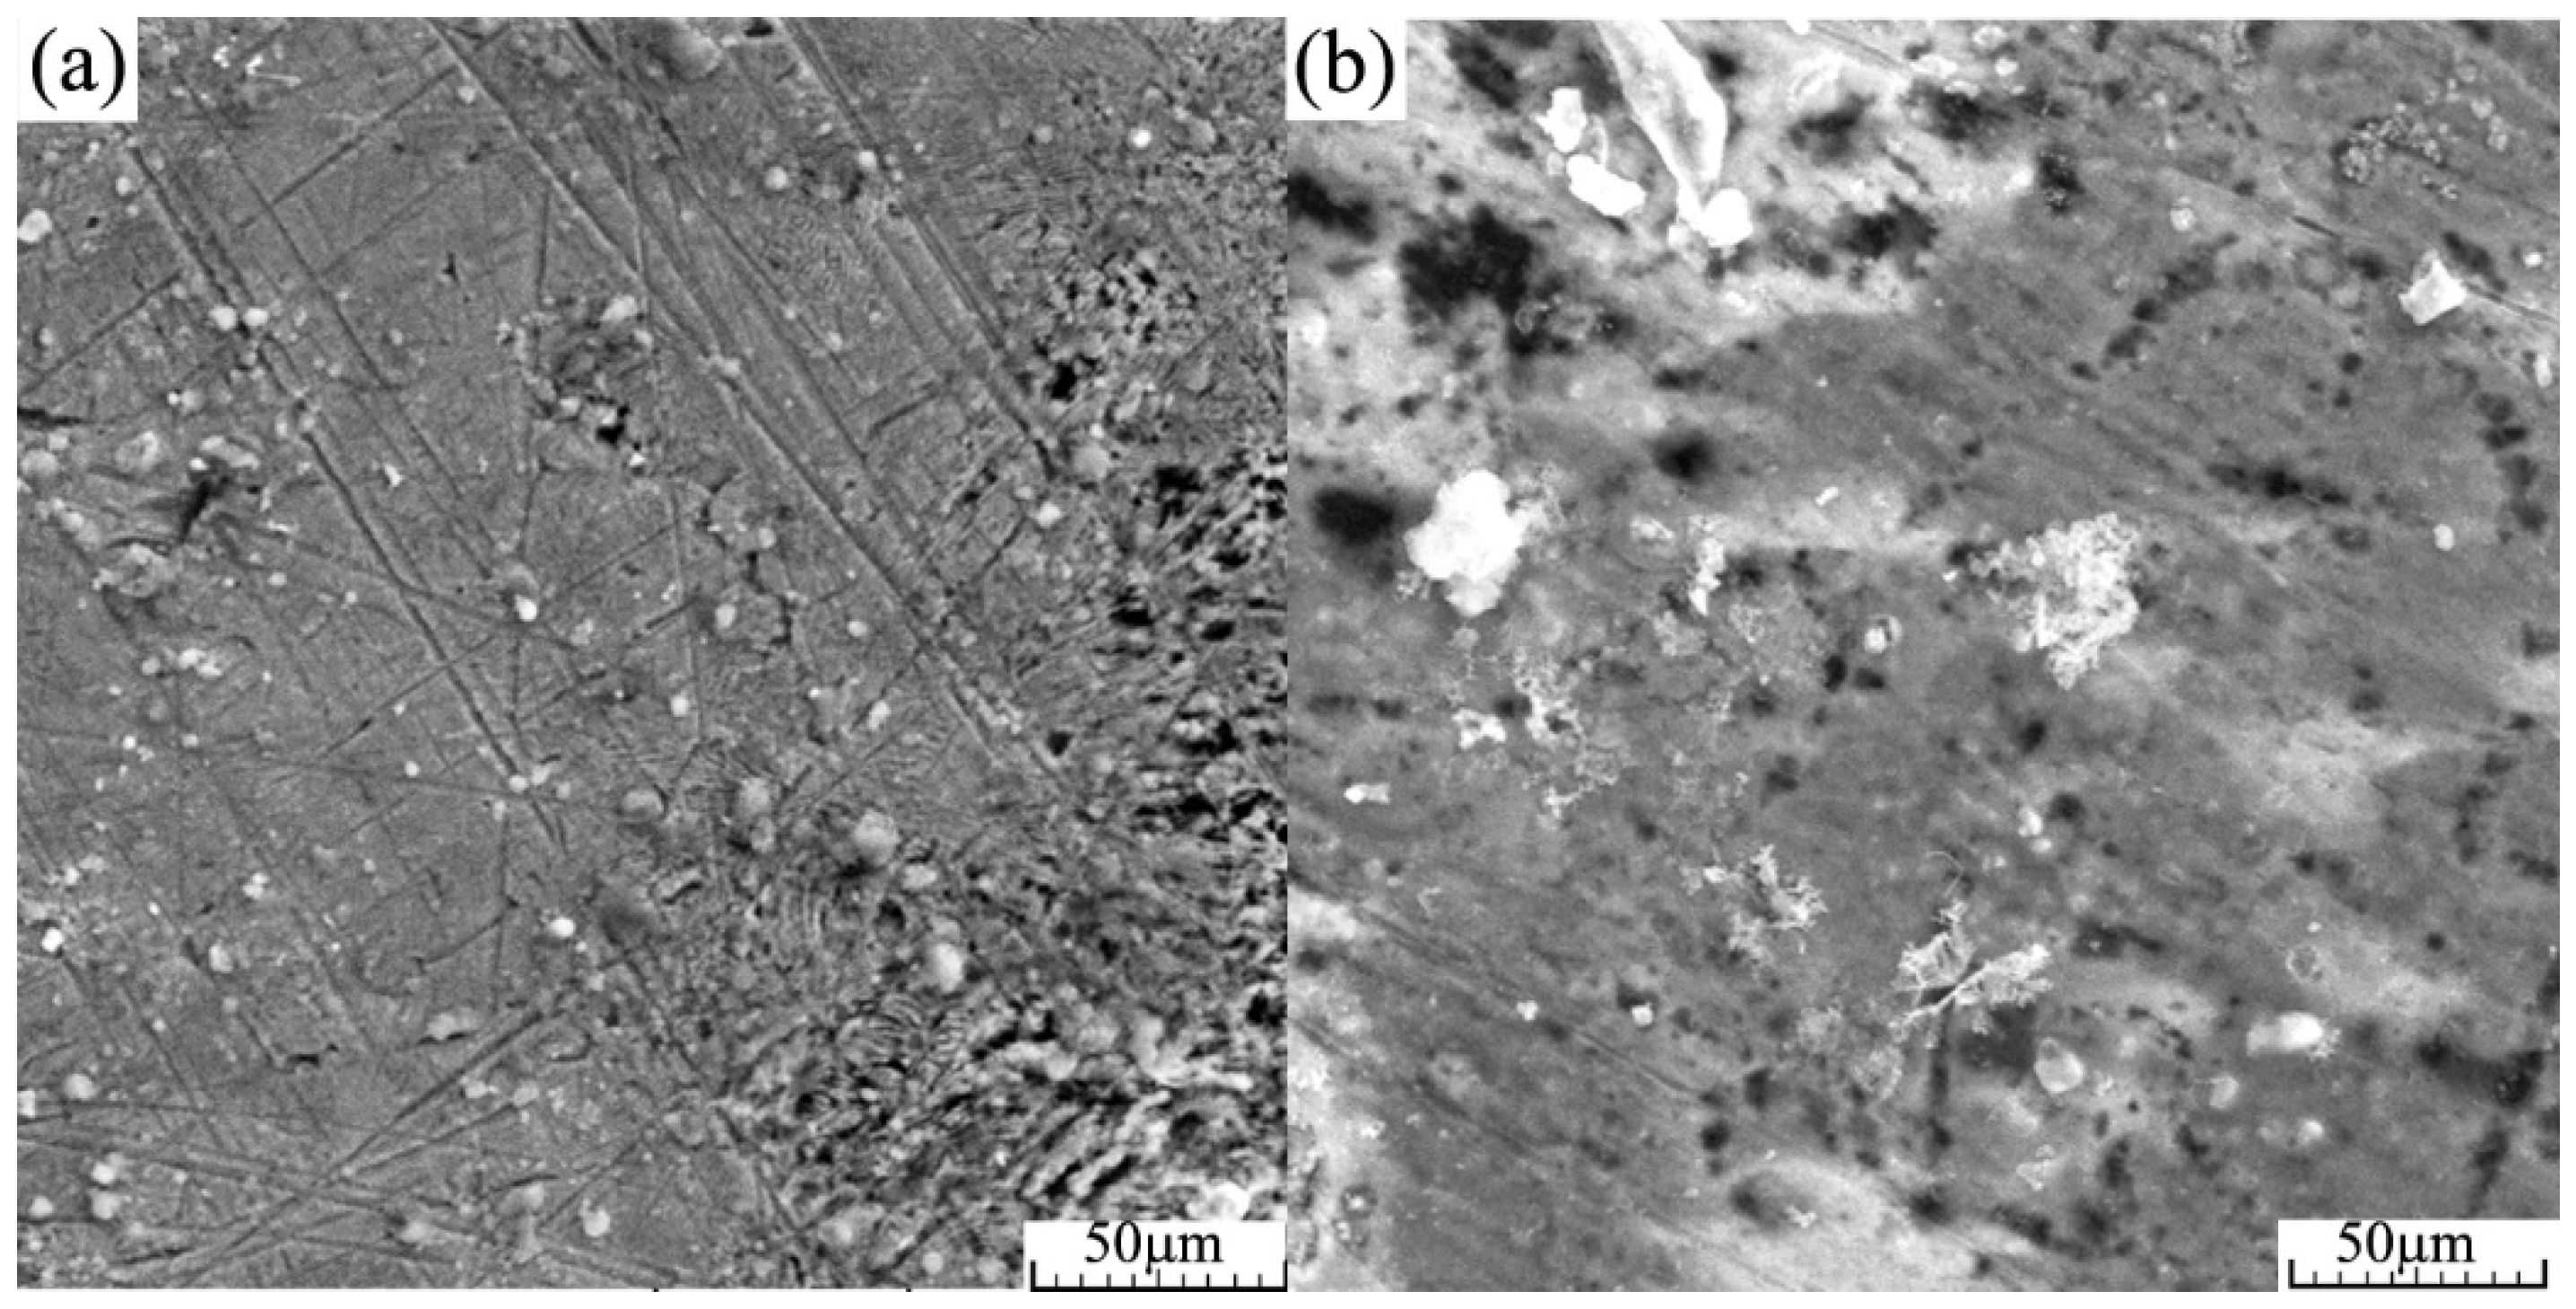
3.3. Electro-Corrosion Behavior of Zn, ZnMg and ZnMgY Materials in SBF Electrolyte

The corrosion potential, Ecorr = E (I = 0), is a measure of the corrosion tendency of a metal or alloy immersed in a given electrolytic medium (thermodynamic probability of corrosion). In fact, this is the potential value (measured in relation to the reference electrode—in this case, the saturated calomel electrode) where the anodic and cathodic reactions rates meet. Very high negative corrosion potential values indicate a very high tendency for zinc and zinc-based alloys to corrode. In the case of pure zinc, the increase in the negative value of the corrosion potential indicated a slight increase in the tendency of corrosion, probably caused by the increase in the surface of the sample due to corrosion (the surface was no longer flat but rough).
In the case of the Zn3Mg0.7Y alloy, the evolution of the corrosion potential indicated a slight tendency of passivation (very small), while for the Zn-Mg alloy, the variation was more complex.
The corrosion current and, directly related to it, the corrosion rate had different evolutions for the three alloys depending on the immersion time in SBF. Thus, in the case of pure zinc, the reaction rate increased appreciably with the storage time, which was also caused by the increase in the surface roughness corresponding to generalized corrosion (Figure 7). When calculating the corrosion rate, the initial plan surface was taken. The parameters of the instantaneous corrosion process evaluated by the Tafel method are presented in Table 4.
In the case of the Zn-Mg alloy, the corrosion rate was still high in the initial moments, this being probably due to the much higher reactivity of magnesium than that of zinc. After 8 days of immersion, the reaction rate increased, which is unlikely due to the roughness, but after 18 days of immersion, it decreased appreciably, reaching a value very close to the corrosion rate of pure zinc. This may be due to the prolonged immersion in the solution of this initial alloy in the solubilization of magnesium until total depletion on the surface and the subsequent corrosion of zinc. The deposition on the surface of the sample of some solid reaction products can be added to this, as in the case of zinc (Figure 7).
In Figure 8, for the sample maintained for 18 days in SBF, the cavities from which the magnesium dissolved can be observed.
In the case of the Zn3Mg0.7Y alloy test, the corrosion rate increased in the initial moments and after 18 days decreased appreciably. This behavior is due to the formation of a crust from insoluble solid reaction products, as can be seen in Figure 9.
Tafel slopes provide information on the reaction mechanism. In this case, the low value of the anodic slope indicated that the anodic reaction (Zn → Zn2 + + 2e) is the active reaction. As suggested by the higher cathodic slope, the corrosion process is under concentration polarization control. Activation control is determined by the rate of electron transfer from the anode to the cathode. In the presence of dissolved oxygen at the cathode, the following reaction takes place: ½O2 + H2O + 2e→ 2OH, followed by the reaction Zn2+ + 2OH = Zn (OH)2 [36].
All the linear polarization curves recorded for the three alloys after various storage periods in SBF had the general appearance shown in Figure 10a.
The curve has two distinct segments: a nonlinear segment at very low currents, denoted as the mixed potential domain, located around the corrosion potential, and a linear portion, starting from a threshold potential, Egc, corresponding to generalized corrosion. For potentials greater than Egc, the corrosion current increased in direct proportion to the overpotential applied to the metal and can be expressed by the following equation:
I(mA) = a.E(mV) + b
Unfortunately, for these systems, the polarization curves and, thus, the Evans diagram were very different from the classical curves, in which the two branches (anodic and cathodic) were symmetrical. Due to this, the values of the Tafel slopes highly depended on the way the data were processed, see Figure 10b, especially the size of the potential range around the chosen corrosion potential. The linear potentiometry parameters obtained are presented in Table 5. The corrosion current (icorr) values increase along with the increase from 2.28 µA, for Zn to 15.57 µA for Zn3Mg.7Y. The corrosion rate of Zn3Mg0.7Y is 83.38 mpy, higher than Zn and Zn3Mg. This is because of the non-homogeneous structure caused by the formation of new compounds with Y. The values of the constants a and b for the alloys studied as a function of the immersion time in the solution are presented in Table 6. In the last column of Table 6, the linear correlation coefficients for the respective straight sections are presented. The corrosion potential presented was evaluated by the Tafel method, from the linear polarization curves recorded at a sweep speed potential of 1 mV/s. Their values were comparable to those in Table 4, obtained by the same method from the curves recorded at a scan rate potential of 0.5 mV/s, being only slightly higher, but the increases were not significant.Unfortunately, for these systems, the polarization curves and, thus, the Evans diagram were very different from the classical curves, in which the two branches (anodic and cathodic) were symmetrical. Due to this, the values of the Tafel slopes highly depended on the way the data were processed, see Figure 10b, especially the size of the potential range around the chosen corrosion potential. The linear potentiometry parameters obtained are presented in Table 5. The corrosion current (icorr) values increase along with the increase from 2.28 µA, for Zn to 15.57 µA for Zn3Mg.7Y. The corrosion rate of Zn3Mg0.7Y is 83.38 mpy, higher than Zn and Zn3Mg. This is because of the non-homogeneous structure caused by the formation of new compounds with Y.
An order of variation of the corrosion potential could not be established either in the case of the same alloy or between the alloys, the differences being located in the limits of the experimental errors. The main metal in the alloy, in very large quantities, was zinc, and an average value of the average corrosion potential was determined: (Ecor)average = −1114 mV for dE/dt = 1 mV/s and (Ecor)average = −1086 mV for dE/dT = 0.5 mV/s.
The slope of the lines describing the influence of the overcurrent applied to the metal on the corrosion current, and implicitly on the corrosion rate, in the case of zinc increased with the increase in the intercept with the potential axis (b), which translated into a slight increase in the general corrosion process.
In the case of the Zn3Mg alloy, both the slope and the original cut decreased with the immersion time in the solution, thus marking a decrease in the corrosion rate over time. This is explained by the fact that in the initial period, magnesium dissolves first, which is the most electronegative metal.
In the case of the Zn3Mg0.7Y, there was no orderly variation for either the slope or the intercept at the origin. The cyclic voltammograms for the three alloys for various immersion intervals in SBF all had the same force as that shown in Figure 11.
For all curves, the linear current–voltage dependence started from a voltage value of −1000 mV. It was noticed that the return branch (cathodic curve) overlapped almost perfectly on the direct branch (anodic curve). This means that the generalized corrosion maintained by a large voltage value did not appreciably alter the active surface, nor did it produce passivation phenomena by the deposition of reaction products.
The electrochemical impedance spectroscopy data were processed with the SZSimpWin software, which uses the least nonlinear squares method to obtain the most appropriate values of the equivalent circuit elements tested. The parameters that best describe (fit) an equivalent circuit were obtained by minimizing the function χ2, defined as the sum of the squares of the residuals (the differences between the calculated values and the experimental values):
χ 2 = i = 0 n [ W i ( Z i ( ω i , p ) a i ) 2 + W i ( Z i ( ω i , p ) b i ) 2 ]
where n is the number of points and Wi is the weighting coefficients. A value of χ2 equal to 10−4 translates into a relative error of the measured current of 0.01, i.e., 1%.
For a certain equivalent circuit to be suitable for describing the physical condition of the alloy surface, the minimum value of χ2 is not sufficient, but the errors associated with each circuit element must be below 5%.
Taking into account these conditions, for the optimal fit of the experimental data, the circuits shown in Figure 12 were established.
The R (QR) circuit is suitable for describing a system in which a single reaction takes place on the surface of the alloy and corrosion is controlled entirely by the transfer of charges through the double-electric layer. In this circuit, Rs is the resistance of the solution between the electrode surface and the reference electrode, Rct is the opposite resistance to the charge transfer and CPE is a constant phase element introduced instead of the capacity of the double-electric layer (Cdl) for a better adjustment. This showed good experimental data. The introduction of this element was necessary due to the fact that the surface of the working electrode is not homogeneous and the electrical capacity is frequency dependent.
If for a capacitor the impedance is equal to ZC = 1/(jωC), in the case of the constant phase element, the impedance is evaluated in accordance with [6,7,8,9]:
Z C P E = 1 Q ( j ω ) n
where Q is a constant proportional to the active area (area exposed to corrosion), <Q> = Ω−1sn/cm2 ≡ S.sn/cm2, ω is the angular frequency (ω = 2πf; f = frequency of the applied alternating current), j is the imaginary number and j = (−1) ½. A consequence of this simple relationship is that the phase angle of the CPE is independent of frequency and has a value of (90°)n, which is also the reason that it is called a constant phase element. The values of the circuit elements for this equivalent circuit are shown in Table 7. The Nquist and Bode diagrams for Zn, ZnMg and ZnMMgY obtained are presented in Figure 13a–c.
This circuit satisfactorily describes the experimental data for zinc, and for the freshly ground surface and for samples immersed in SBF 8 or 18 days. The percentage errors for the circuit elements were approximately 1% and even lower, except for Q, where they were of the order of 3–4%, but located in the reliable range. It should be noted that in the case of zinc, the load transfer resistance (Rct) decreased appreciably with the immersion time in the solution, which increased the reaction rate, resulting in very good agreement with that found for the instantaneous corrosion rate evaluated in the linear polarization curve (Tafel method).
The exponent n, which gives an indication of the deviation from the ideality of the capacity of the double-electric layer, which also decreases with the immersion time, a decrease attributed to the increase in the degree of surface roughness due to corrosion was observed. This behavior also indicates that, although it is possible that insoluble reaction products, such as ZnO or (Zn5(OH)8Cl2·2H2O) (simonkolleit) [25], may form during storage in solution, they are probably porous and do not act as a barrier to the reaction.
In the case of the Zn-Mg alloy, the R (QR) circuit satisfactorily described the experimental data only for the freshly ground sample and for the sample maintained for 8 days in SBF, but here too the polarization resistance decreased and the corrosion rate increased. Moreover, the frequency exponent in the expression of the constant phase element showed unexpectedly low values, probably marking an appreciable deterioration of the alloy surface and maybe some local deposits.
In the case of Zn3Mg0.7Y, only the equivalent circuit could not be used for the test held for 8 days in solution. Analyzing the evolution of the constant Q as a function of immersion time, this varied randomly, with very large oscillations, both between different alloys and for the same alloy at different immersion times, this circuit element being more sensitive to experimental errors, exemplified by the percentage errors, between 3 and 5%, obtained when fitting the curve.
For the sample maintained for 18 days in SBF, the frequency exponent was very close to a value of 0.5, indicating the possibility of a diffusion phenomenon. As in the case of the other two alloys, some values close to 0.5 were encountered; we tried to use the second equivalent circuit, as shown in Figure 12, which contained a diffusion impedance. The values of the circuit elements, evaluated on the basis of the same experimental data, are presented in Table 8.
Comparing these values with the values of the parameters for the R (QR) circuit, it was found that they were very close, which is additional proof that these circuits also describe the same state.
The need to introduce a diffusion impedance, even in the absence of a film adsorbed or adhering to the surface of the metal, may seem at least risky. This can be explained by considering the existence of a local diffusion in a nanometer-sized film in the reaction zone on the metal surface [37]. Zinc is a very active metal in ionic media containing chlorine, with its surface suffering a generalized, uniform corrosion. Corrosion occurred in a single reaction, and the reaction products were soluble. There was a uniform concentration of ions and electrons in a nanometer-sized layer on the surface. The mobility of electrons is much higher than that of ions [38]. As the electrons became free in the system, the electric field relaxed rapidly, which led to a local charge neutrality, and the transport of the charge carriers was limited by diffusion through this overloaded nano-layer with charges. The values of the parameter χ2 indicated that the last two circuits (one is enough) described the experimental data much better, followed by those for the R circuit (QR).
In all cases, the immersion tests present a decrease in samples mass with corrosion compounds that pass from the material surface to electrolyte solution, values are gib = ven in Table 9. Using the follow densities: [g/cm2]: 7.13 for Zn, 6.52 for ZnMg and 6.45 for Zn3Mg0.7Y we calculate the corrosion rate of the material in SBF electrolyte based on formula: CR = CR = (8.76*10,000*mass loss)/(Total area*time*density) [mm/year] [39]. The differences between the cleaned and uncleaned sample are given by the instable compounds formed on the surface during immersion and that pass to solution after ultra-sonication of the samples.
The macro and micro aspects of the compounds passed from the alloy surface into the electrolytic solution are shown in Figure 14a and Figure 14b, respectively. Generally, small and large parts of the material can be observed. The larger parts are usually agglomerations of small round oxides, Figure 14b. At microscale, the minimum diameter measured using VegaTC software was around 75 μm and the maximum one at 1600 μm, with an average of 480 μm. At micro scale (analyze of the parts from Figure 14b) the minimum value measured was of 2 μm and the maximum of 5.07 μm and an average value of 3.29 μm (50 determinations) and a standard deviation of ±0.74.
As marked in Figure 14a, the chemical composition on different areas was analyzed and the quantitative results are given in Table 10.
All the products present a high amount of oxygen, mainly oxides passing from the material surface to electrolyte solution, and also chlorine and carbon (due to the formation of carbonates) based on the compounds identified.

4. Conclusions

The article presents the experimental results of a new alloy, Zn3Mg0.7Y, with possible applications in the field of biodegradable metallic elements. The conclusions can be summarized as follows:
  • A new alloy, ZnMgY, with a good structural and chemical homogeneity, was obtained using an induction furnace;
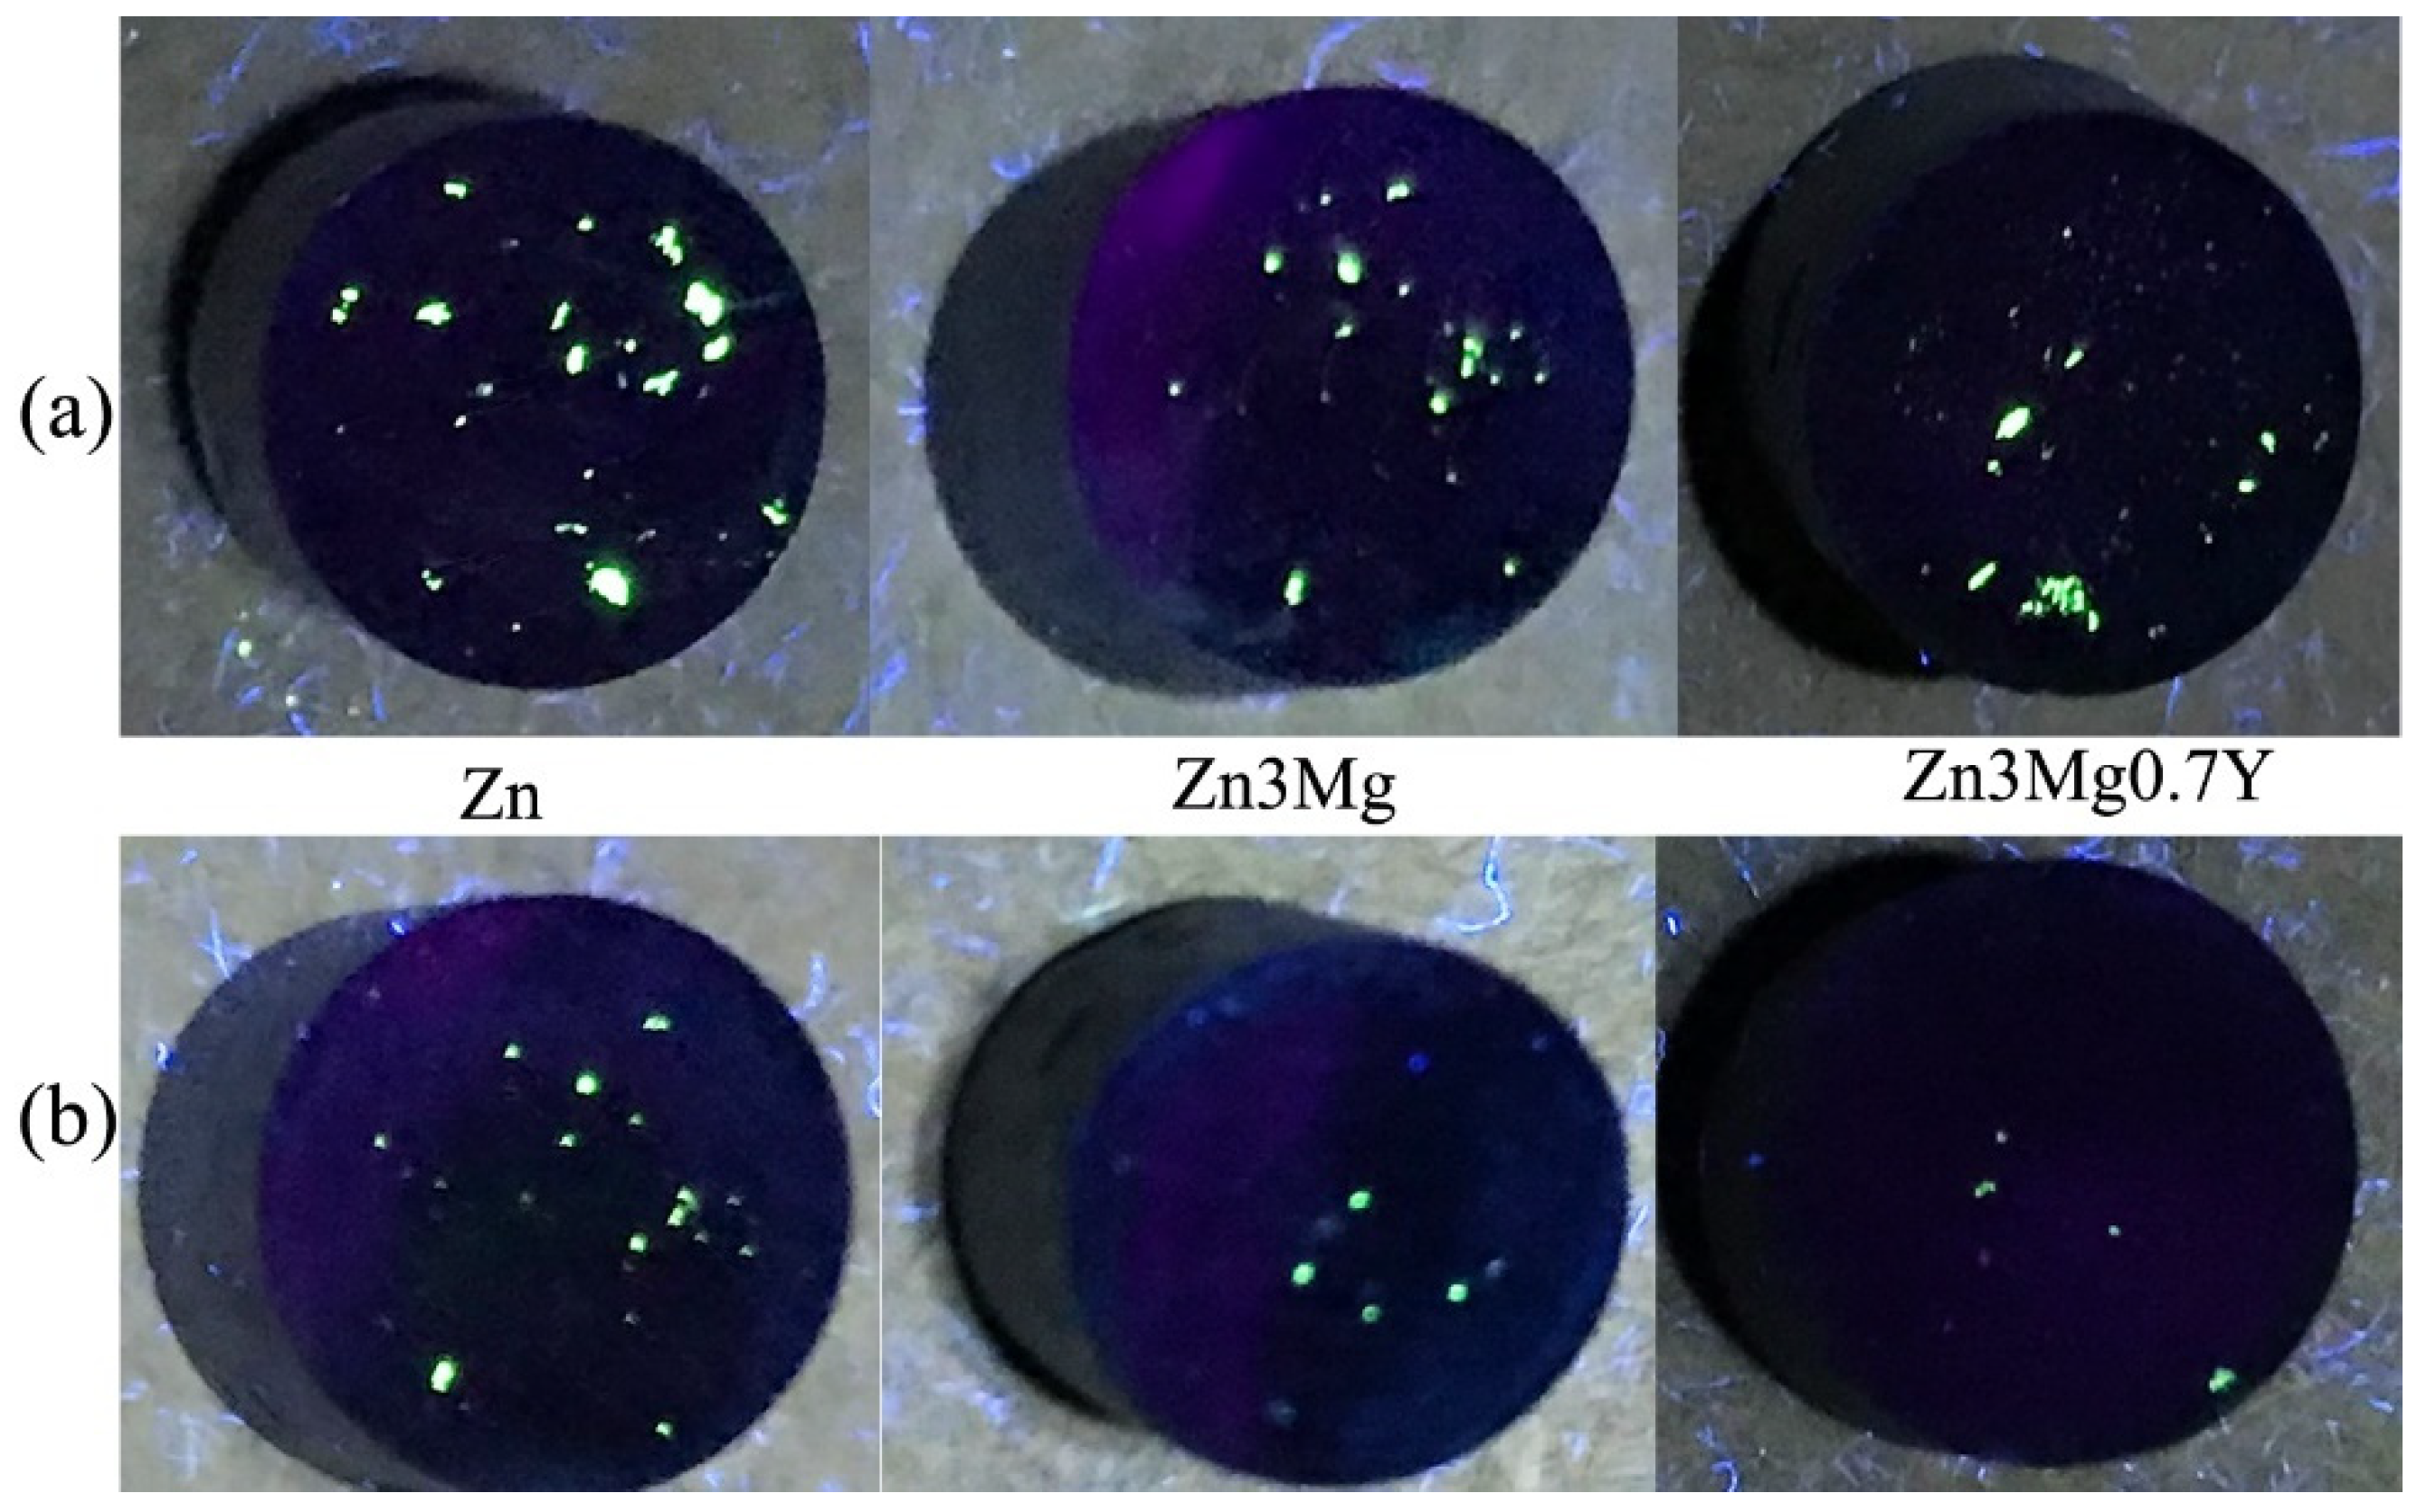
  • After five re-melting stages, no pores, voids or microscratches were observed through the penetrant liquid NDT method;
  • The main compounds of Zn3Mg0.7Y were determined, and their influence on mechanical properties compared to pure Zn and Zn3Mg alloys was evaluated;
  • An increase in microhardness was obvious with the addition of Mg and Y elements;
  • Fx and COF of the pure Zn were decreased with the addition of Mg and Y.
For all the curves, the linear current–voltage dependence started from a voltage value of −1000 mV. It was found that the return branch overlapped almost perfectly on the direct branch (anodic curve). This means that the generalized corrosion maintained by large voltage values did not appreciably alter the active surface, nor did it produce passivation phenomena by the deposition of reaction products.

Author Contributions

Conceptualization, C.P., R.C. and N.C.; Formal analysis, G.Z., A.-M.R., A.A.A., M.B. and N.I.; Funding acquisition, N.C.; Investigation, C.P., R.C., A.-M.R., M.C.I., A.A.A. and M.B.; Methodology, C.P., R.C., G.Z., A.-M.R., M.C.I. and N.I.; Project administration, N.C.; Resources, G.Z.; Software, M.B.; Supervision, N.C.; Validation, G.Z., A.-M.R., M.C.I. and N.I.; Visualization, N.I.; Writing—original draft, R.C. and N.C.; Writing—review and editing, A.-M.R. All authors have read and agreed to the published version of the manuscript.

Funding

This research was funded by publications grant of the TUIASI, project number GI/P2/2021.

Institutional Review Board Statement

Not applicable.

Informed Consent Statement

Not applicable.

Conflicts of Interest

The authors declare no conflict of interest.

References

  1. Shi, Z.-Z.; Gao, X.-X.; Zhang, H.-J.; Liu, X.-F.; Li, H.-Y.; Zhou, C.; Yin, Y.-X.; Wang, L.-N. Design biodegradable Zn alloys: Second phases and their significant influences on alloy properties. Bioact. Mater. 2020, 5, 210–218. [Google Scholar] [CrossRef] [PubMed]
  2. Liu, H.; Huang, H.; Zhang, Y.; Xu, Y.; Wang, C.; Sun, J.; Jiang, J.; Ma, A.; Xue, F.; Bai, J. Evolution of Mg–Zn second phases during ECAP at different processing temperatures and its impact on mechanical properties of Zn-1.6Mg (wt.%) alloys. J. Alloys Compd. 2019, 811, 151987. [Google Scholar] [CrossRef]
  3. Jain, D.; Pareek, S.; Agarwala, A.; Shrivastava, R.; Sassi, W.; Parida, S.K.; Behera, D. Effect of exposure time on corrosion behavior of zinc-alloy in simulated body fluid solution: Electrochemical and surface investigation. J. Mater. Res. Technol. 2021, 10, 738–751. [Google Scholar] [CrossRef]
  4. Xue, P.; Ma, M.; Li, Y.; Li, X.; Yuan, J.; Shi, G.; Wang, K.; Zhang, K. Microstructure, Mechanical Properties, and In Vitro Corrosion Behavior of Biodegradable Zn-1Fe-xMg Alloy. Materials 2020, 13, 4835. [Google Scholar] [CrossRef]
  5. Dong, H.; Lin, F.; Boccaccini, A.R.; Virtanen, S. Corrosion behavior of biodegradable metals in two different simulated physiological solutions: Comparison of Mg, Zn and Fe. Corros. Sci. 2021, 182, 109278. [Google Scholar] [CrossRef]
  6. Hermawan, H. Updates on the research and development of absorbable metals for biomedical applications. Prog. Biomater. 2018, 7, 93–110. [Google Scholar] [CrossRef] [Green Version]
  7. Witte, F.; Eliezer, A. Biodegradable Metals. In Degradation of Implant Materials; Eliaz, N., Ed.; Springer: New York, NY, USA, 2012; pp. 93–109. [Google Scholar]
  8. Pietrzak, W.S.; Eppley, B.L. Resorbable polymer fixation for craniomaxillofacial surgery: Development and engineering paradigms. J. Craniofac. Surg. 2000, 11, 575–585. [Google Scholar] [CrossRef]
  9. Im, S.H.; Jung, Y.; Kim, S.H. Current status and future direction of biodegraable metallic and polymeric vascular scaffolds for next-generation stents. Acta Biomater. 2017, 60, 3–22. [Google Scholar] [CrossRef]
  10. Bowen, P.K.; Drelich, J.; Goldman, J. Zinc exhibits ideal physiological corrosion behavior for bioabsorbable stents. Adv. Mater. 2013, 25, 2577–2582. [Google Scholar] [CrossRef]
  11. Purnama, A.; Hermawan, H.; Mantovani, D. Biodegradable metal stents: A focused review on materials and clinical studies. J. Biomater. Tissue Eng. 2014, 4, 868–874. [Google Scholar] [CrossRef]
  12. Li, H.; Zheng, Y.; Qin, L. Progress of biodegradable metals. Prog. Nat. Sci. Mater. Int. 2014, 24, 414–422. [Google Scholar] [CrossRef] [Green Version]
  13. Cheng, J.; Liu, B.; Wu, Y.H.; Zheng, Y.F. Comparative in vitro study on pure metals (Fe, Mn, Mg, Zn and W) as biodegradable metals. J. Mater. Sci. Technol. 2013, 29, 619–627. [Google Scholar] [CrossRef]
  14. Frederickson, C.J.; Koh, J.Y.; Bush, A.I. The neurobiology of zinc in health and disease. Nat. Rev. Neurosci. 2005, 6, 449–462. [Google Scholar] [CrossRef] [PubMed]
  15. Zheng, Y.F.; Gu, X.N.; Witte, F. Biodegradable metals. Mater. Sci. Eng. R 2014, 77, 1–34. [Google Scholar] [CrossRef]
  16. Liu, B.; Zheng, Y.F.; Ruan, L. In vitro investigation of Fe30Mn6Si shape memory alloy as potential biodegradable metallic material. Mater. Lett. 2011, 65, 540–543. [Google Scholar] [CrossRef]
  17. Haase, H.; Rink, L. Zinc Signaling. In Zinc in Human Health; Ios Press: Amsterdam, The Netherlands, 2011; Volume 76, pp. 94–117. [Google Scholar]
  18. García-Mintegui, C.; Córdoba, L.C.; Buxadera-Palomero, J.; Marquina, A.; Jiménez-Piqué, E.; Ginebra, M.-P.; Cortina, J.L.; Pegueroles, M. Zn-Mg and Zn-Cu alloys for stenting applications: From nanoscale mechanical characterization to in vitro degradation and biocompatibility. Bioact. Mater. 2021, 6, 4430–4446. [Google Scholar] [CrossRef]
  19. Vojtěch, D.; Kubásek, J.; Šerák, J.; Novák, P. Mechanical and corrosion properties of newly developed biodegradable Zn-based alloys for bone fixation. Acta Biomater. 2011, 7, 3515–3522. [Google Scholar] [CrossRef]
  20. Yao, C.Z.; Wang, Z.C.; Tay, S.L.; Zhu, T.P.; Gao, W. Effects of Mg on microstructure and corrosion properties of Zn–Mg alloy. J. Alloys Compd. 2014, 602, 101–107. [Google Scholar] [CrossRef]
  21. Baciu, E.R.; Cimpoesu, R.; Vitalariu, A.; Baciu, C.; Cimpoesu, N.; Sodor, A.; Zegan, G.; Murariu, A. Surface analysis of 3D (SLM) Co-Cr-W dental metallic materials. Appl. Sci. 2021, 11, 255. [Google Scholar] [CrossRef]
  22. Cimpoesu, R.; Vizureanu, P.; Stirbu, I.; Sodor, A.; Zegan, G.; Prelipceanu, M.; Cimpoesu, N.; Ioanid, N. Corrosion-Resistance Analysis of HA Layer Deposited through Electrophoresis on Ti4Al4Zr Metallic Substrate. Appl. Sci.-Basel 2021, 11, 4198. [Google Scholar] [CrossRef]
  23. Bejinariu, C.; Burduhos-Nergis, D.P.; Cimpoesu, N. Immersion Behavior of Carbon Steel, Phosphate Carbon Steel and Phosphate and Painted Carbon Steel in Saltwater. Materials 2021, 14, 188. [Google Scholar] [CrossRef] [PubMed]
  24. Cimpoesu, N.; Sandulache, F.; Istrate, B.; Cimpoesu, R.; Zegan, G. Electrochemical Behavior of Biodegradable FeMnSi-MgCa Alloy. Metals 2018, 8, 541. [Google Scholar] [CrossRef] [Green Version]
  25. Panaghie, C.; Cimpoesu, R.; Istrate, B.; Cimpoesu, N.; Bernevig, M.-A.; Zegan, G.; Roman, A.-M.; Chelariu, R.; Sodor, A. New Zn3Mg-xY Alloys: Characteristics, Microstructural Evolution and Corrosion Behavior. Materials 2021, 14, 2505. [Google Scholar] [CrossRef] [PubMed]
  26. Ma, S.-Y.; Liu, L.M.; Wang, S.Q. The microstructure, stability, and elastic properties of 14H long-period stacking-ordered phase in Mg–Zn–Y alloys: A first-principles study. J. Mater. Sci. 2014, 49, 737–748. [Google Scholar] [CrossRef]
  27. Li, L.; Jiao, H.; Liu, C.; Yang, L.; Suo, Y.; Zhang, R.; Liu, T.; Cui, J. Microstructures, mechanical properties and in vitro corrosion behavior of biodegradable Zn alloys microalloyed with Al, Mn, Cu, Ag and Li elements. J. Mater. Sci. Technol. 2021, 103, 244–260. [Google Scholar] [CrossRef]
  28. Yang, N.; Balasubramani, N.; Venezuela, J.; Almathami, S.; Wen, C.; Dargusch, M. The influence of Ca and Cu additions on the microstructure, mechanical and degradation properties of Zn–Ca–Cu alloys for absorbable wound closure device applications. Bioact. Mater. 2021, 6, 1436–1451. [Google Scholar] [CrossRef]
  29. Liu, X.; Sun, J.; Yang, Y.; Zhou, F.; Pu, Z.; Li, L.; Zheng, Y. Microstructure, mechanical properties, in vitro degradation behavior and hemocompatibility of novel Zn–Mg–Sr alloys as biodegradable metals. Mater. Lett. 2016, 162, 242–245. [Google Scholar] [CrossRef]
  30. Pachla, W.; Przybysz, S.; Jarzebska, A.; Bieda, M.; Sztwiertnia, K.; Kulczyk, M.; Skiba, J. Structural and mechanical aspects of hypoeutectic Zn–Mg binary alloys for biodegradable vascular stent applications. Bioact. Mater. 2021, 6, 26–44. [Google Scholar] [CrossRef]
  31. Watroba, M.; Mech, K.; Bednarezyk, W.; Kawalko, J.; Marciszko-Wiackowska, M.; Marzec, M.; Shepherd, D.E.T.; Bala, P. Long-term in vitro corrosion behavior of Zn-3Ag and Zn-3Ag-0.5Mg alloys considered for biodegradable implant applications. Mater. Des. 2021, 213, 110289. [Google Scholar] [CrossRef]
  32. Pinc, J.; Skolakova, A.; Vertat, P.; Duchon, J.; Kubasek, J.; Lejcek, P.; Vojtech, D.; Capek, J. Microstructure evolution and mechanical performance of ternary Zn-0.8Mg-0.2Sr (wt. %) alloy processed by equal-channel angular pressing. Mater. Sci. Eng. A 2021, 824, 141809. [Google Scholar] [CrossRef]
  33. Huang, T.; Liu, Z.; Wu, D.; Yu, H. Microstructure, mechanical properties, and biodegradation response of the grain-refined Zn alloys for potential medical materials. J. Mater. Res. Technol. 2021, 15, 226–240. [Google Scholar] [CrossRef]
  34. Vaclavek, L.; Tomastik, J.; Chmelickova, H.; Ctvrtlik, R. Benefits of use of acoustic emission in scratch testing. Acta Polytech. 2020, 27, 121–125. [Google Scholar] [CrossRef]
  35. Gallego, A.; Piotrkowski, R.; Ruzzante, J.; Cabo, A.; Garcia-Hernandez, M.T.; Castro, E. Acoustic Emission Technique to Assess Microfractures of Metallic Coatings with Scratch-Tests. PACS Reference: 43.35.Zc. 8. Available online: http://sea-acustica.es/fileadmin/publicaciones/Sevilla02_ult03012.pdf (accessed on 24 October 2021).
  36. Dambatta, M.S.; Izman, S.; Kurniawan, D.; Farahany, S.; Yahaya, B.; Hermawan, H. Influence of thermal treatment on microstructure, mechanical and degradation properties of Zn–3Mg alloy as potential biodegradable implant material. Mater. Des. 2015, 85, 431–437. [Google Scholar] [CrossRef]
  37. Song, J. Theory of Diffusion Impedance in Nanostructured Electrochemical Systems. Ph.D. Thesis, Massachusetts Institute of Technology, Cambridge, MA, USA, 2019. [Google Scholar]
  38. Lai, W.; Ciucci, F. Mathematical modeling of porous battery electrodes—Revisit of Newman’s model. Electrochim. Acta 2011, 56, 4369. [Google Scholar] [CrossRef]
  39. Roman, A.M.; Geantă, V.; Cimpoesu, R.; Munteanu, C.; Lohan, N.M.; Zegan, G.; Cernei, E.R.; Ionită, I.; Cimpoesu, N.; Ioanid, N. In-Vitro Analysis of FeMn-Si Smart Biodegradable Alloy. Materials 2022, 15, 568. [Google Scholar] [CrossRef]
Figure 1. NDT analysis of melted Zn, Zn3Mg and Zn3Mg0.7Y alloys: (a) first melt sand; (b) after five re-melts.
Applsci 12 02727 g001
Figure 2. Structural and chemical aspects of Zn3Mg0.7Y alloy: (a) SEM image at 500×; (b) SEM image at 2500×; (c) energy spectrum of the chemical elements identified on area (0.063 mm2) presented in the SEM image (a).
Applsci 12 02727 g002
Figure 3. (a) Elemental mapping of all components; (b) Zn element; (c) Mg element; (d) Y element; (e) XRD spectrum of Zn3Mg0.7Y.
Applsci 12 02727 g003
Figure 4. Optical microscopy of indented areas: (a) Zn; (b) and (c) ZnMg; (d) Zn3Mg0.7Y.
Applsci 12 02727 g004
Figure 5. Scratch behavior of the samples: (a) Fx vs. Y (mm); (b) COF vs. Y (mm); (c) AE vs. Y (mm).
Applsci 12 02727 g005aApplsci 12 02727 g005b
Figure 6. SEM scratch stain: (a) pure Zn; (b) Zn3Mg; (c) Zn3Mg0.7Y.
Applsci 12 02727 g006
Figure 7. The roughness evolution for the zinc sample after maintenance in SBF (500×).(a) generalized corrosion; (b) solid reaction products.
Applsci 12 02727 g007
Figure 8. The evolution of the Zn-Mg sample surface after maintenance in SBF (500×). (a) cavites; (b) solid reaction products.
Applsci 12 02727 g008
Figure 9. The surface evolution of the alloy sample after maintaining in SBF (500×). (a) insoluble solid reaction products; (b) solid reaction products.
Applsci 12 02727 g009
Figure 10. (a) The linear polarization curve for Zn with freshly ground surface in SBF, (b) Tafel slopes.
Applsci 12 02727 g010
Figure 11. Cyclic voltammogram for zinc with freshly ground surface in SBF; dE/dt = 10 mV/s.
Applsci 12 02727 g011
Figure 12. Equivalent circuits used for processing EIS data on the three alloys depending on the storage time.
Applsci 12 02727 g012
Figure 13. Nquist and Bode diagrams for Zn, ZnMg and ZnMMgY at: (a) 0 days; (b) 8 days; (c) 18 days.
Applsci 12 02727 g013
Figure 14. SEM images of compounds passed from Zn3Mg0.7Y in electrolyte solution after 18 days 25× in (a) and 1000× in (b).
Applsci 12 02727 g014
Table 1. Chemical composition determination of ZnMgY alloy.
Chemical
Composition
ZnMgY
wt%at%wt%at%wt%at%
General (1 mm2)96.393.33.06.30.70.5
Point 190.092.4--10.07.6
Point 298.295.41.84.6--
Point 391.093.2 8.96.7
Point 492.894.10.20.775.2
EDS detector
Abs error [%]
2.351.101.83
St. dev: Zn: ±1, Mg: ±0.1 and Y: ±0.05.
Table 2. Vickers microhardness values on cast samples.
MaterialPure Zn
(HV)
Zn3Mg
(HV)
Zn3Mg0.7Y
(HV)
Point 145.1118.0118.6
Point 250.7121.0126.7
Point 351.0129.3133.8
Point 448.0127.0120.1
Point 562.5125.7132.4
Average51.5124.2126.3
Table 3. Scratch resistance test results.
MaterialAverage Fx (N)Average AE (Volt)Average COF
Zn4.2300.0520.674
Zn3Mg0.6950.0050.177
Zn3Mg0.7Y0.5950.0040.156
Table 4. Instantaneous corrosion process parameters according to the immersion time of the alloys in SBF.
ParameterZnZn-3MgZn3Mg0.7Y
0 Days8 Days18 Days0 Days8 Days18 Days0 Days8 Days18 Days
E(I = 0), mV−1078−1.081−1105−1060−1079−1050−1106−1007−1086
jco r=, µA/cm2112549.1431.5735.0712.4618.6936.8717.73
vcorr, mm/Y0.29400.64271.31230.84320.92290.33290.49930.98470.4737
βa, mV/decade86.4356.0274.4755.6453.7949.4480.6167.3783.73
βc, mV/decade322.19185.09136.97222.22177.34251.21132.77221.15110.4
Table 5. Linear potentiometry parameters.
SampleEcor
(V)
icorr
(µA)
Vcorr
(mpy)
Zn1.052.288.58
Zn3Mg1.0713.3250.05
Zn3Mg0.7Y1.1315.5783.38
Table 6. Dependence of the corrosion current on the overcurrent applied to the alloy, at potentials higher than Egc.
AlloyTimeEcor
(mV)
Egc
(mV)
I(mA) = a.E(mV) + brL
a (mA/mv)b (mA)
Zn0 days−1121−9500.0083468.105710.997
8 days−1108−10000.0090139.112350.999
18 days−1136−10000.01008610.41500.999
Zn3Mg0 days1108−9500.01422513.919101.000
8 days−1101−9900.0099519.891281.000
18 days−1092−9950.0078006.957171.000
Zn3Mg0.7Y0 days−1106−10000.01556514.864691.000
8 days−1116−9900.0081978.092331.000
18 days−1137−10000.0095769.242290.997
Table 7. Circuit R(QR) element values.
AlloyImmersion Time103.χ2Rs
Ohm.cm2
104.Q
S.sn/cm2
nRct
Ohm.cm2
Zn0 days2.4027.890.3710.705920.4
8 days1.5247.932.6600.663269.6
18 days0.5636.471.5390.554218.2
Zn3Mg0 days5.0927.890.12450.597358.4
8 days0.8045.3630.1700.379171.9
18 days-----
Zn3Mg0.7Y0 days0.7625.930.40560.614535.1
8 days-----
18 days7.2827.715.9870.515220.3
Table 8. Values of circuit elements R (Q (RW)).
AlloyImmersion Time103 χ2Rs
Ohm.cm2
103 Q
S.sn/cm2
nRct
Ohm.cm2
W
S.s½/cm2
Zn0 days1.5228.223.3230.718867.90.008637
8 days1.1847.583.0040.643447.10.06193
18 days1.1535.921.8760.531205.90.04964
Zn3Mg0 days0.9029.510.07100.655291.40.05335
8 days0.8947.190.32500.636503.80.065730
18 days0.6825.770.16590.420455.20.008236
Zn3Mg0.7Y0 days0.6226.180.038320.620524.1 0.03609
8 days1.3532.460.24688.83728.750.008623
Table 9. Mass loss after 18 days of immersion in SBF electrolyte.
Material/AlloyInitial Mass
[g]
After Immersion (18 Days) [g]After Ultrasound Cleaning [g]Loss Mass During Immersion
[g]
Corrosion Rate
(CR)
[mm/Year]
Zn3.71533.70123.70010.00110.13
Zn3Mg4.22864.21044.20950.00090.23
Zn3Mg0.7Y2.59942.58832.58790.00040.12
Table 10. Chemical composition of the compounds from electrolyte solution.
Zn3Mg0.7Y AlloyZnMgYOCCl
wt%at%wt%at%wt%at%wt%at%wt%at%wt%at%
Area 158.324.60.70.80.90.324.642.3913.130.12.41.9
Area 250.319.90.50.60.40.129.447.6112.326.67.15.2
Area 355.822.10.80.80.50.125.641.4415.934.41.41.1
EDS detector error %1.50.30.11.00.20.1
C percentage values are strongly influenced by the double layered carbon tape used to fix the corrosion compounds for the SEM-EDS analysis.
Publisher’s Note: MDPI stays neutral with regard to jurisdictional claims in published maps and institutional affiliations.

