
Study on Mechanical Properties of Modified Polyurethane Concrete at Different Temperatures


1
School of Civil Engineering, Central South University, Changsha 410075, China
2
China Railway Development Investment Group Co., Ltd., Kunming 650118, China
3
Ningbo Roaby Technology Industrial Group Co., Ltd., Ningbo 315800, China
*
Author to whom correspondence should be addressed.
Appl. Sci. 2022, 12(6), 3184; https://0-doi-org.brum.beds.ac.uk/10.3390/app12063184
Submission received: 18 February 2022
/
Revised: 18 March 2022
/
Accepted: 19 March 2022
/
Published: 21 March 2022
(This article belongs to the Special Issue Road Materials and Sustainable Pavement Design)
Abstract
:The objective of the present research was to study the effect of temperature on the mechanical properties, failure mode and uniaxial compression constitutive relationship of a modified polyurethane concrete. A total of 24 cube and 27 prism specimens were fabricated, and the uniformity of the polyurethane concrete was checked. The compressive test, splitting tensile test and static uniaxial compression test were carried out at 0, 15, 40 and 60 °C. The failure mode, cube compressive strength, splitting tensile strength, axial compressive strength, elastic modulus and the compressive stress–strain curves of the modified polyurethane concrete were obtained. Based on the experimental results, a uniaxial compression constitutive model of the modified polyurethane concrete considering temperature characteristics was proposed. The results show that the elastic modulus, cubic compressive strength, splitting tensile strength and axial compressive strength of the modified polyurethane concrete decrease with the increase of temperature, and the peak strain and ultimate strain increase significantly. When the temperature rises from 0 to 60 °C, the cubic compressive strength, splitting tensile strength and axial compressive strength are decreased by 67.1%, 66.4% and 73.3%, respectively. The calculation results of the proposed constitutive model are in good agreement with the test results. The results are expected to guide the application of the modified polyurethane concrete in bridge deck pavement.
1. Introduction
Presently, asphalt concrete is the most used material for bridge deck pavement. However, during the service of the bridge, cracking, rutting and frost heave often occur on the bridge deck, which is paved with asphalt concrete. In the deck of the steel bridge, these damages provide paths for rapid transport in asphalt concrete of the aggressive agents, which will cause steel corrosion. The cost of bridge deck maintenance and repair in the United States reached $40 billion in 1990 [1]. Therefore, polyurethane concrete, a novel pavement material with good wear resistance, crack resistance and impermeability, was invented and applied in bridge pavement engineering. During the operation, the bridge bears the temperature action for a long time, and the highest temperature of the pavement reaches 60 °C. However, the mechanical properties of the polyurethane concrete under high- and low-temperature environments are not clear. Therefore, it is of great significance to study the temperature characteristics of polyurethane concrete for the design of bridge deck pavement and the safety evaluation of bridges.
Polyurethane is mainly used in coating designing, which mainly includes floor, anticorrosion of structure, sport surface, glass and roof [2]. In 1970, URETEK (Finland) developed polyurethane concrete for foundation reinforcement, structure reinforcement and pavement. In 2001, the United States apply URETEK’s polyurethane concrete to engineering, which verify the feasibility of polyurethane concrete for pavement [3]. Subsequently, many researchers studied the mix proportion and properties of polyurethane concrete. Martinelli et al. [4] developed a mixture of Portland cement and polyurethane whose plasticity was much higher than that of Portland cement, and the workability was similar to Portland cement. Polyurethane concrete has also been commonly applied in the rapid repair of pavement. Hussain et al. [5,6] confirmed that polyurethane concrete had good mechanical properties through the material’s mechanical test, and applied it to the concrete beam reinforcement. Through the bending test, it is proved that the flexural performance of the beam strengthened with polyurethane concrete was better than that of the ordinary concrete beam. Wang et al. [7] proposed a reasonable mix proportion of polyurethane concrete and verified the flexural and compressive properties of polyurethane concrete through experiments. Through scanning electron microscope observation, it was found that the bonding between polyurethane molecules and aggregate in polyurethane concrete was firm. Jiang et al. [8] proposed a kind of aqueous polyurethane concrete with good water resistance and verified its mechanical properties through experiments. It was also found that the material needs a different mass of water during solidifying at different temperatures. Hu et al. [9] studied the self-healing of polyurethane concrete. It was found that polyurethane concrete had self-healing ability through electron microscope scanning observation. Yang et al. [10] provided a method to evaluate the sensitivity of polyurethane concrete to determine whether this material is suitable for intelligent reinforcement material. Zhang et al. [11] strengthened concrete beams with polyurethane concrete and conducted bending tests on beams. The test results show that the strengthened beam has greater ultimate bearing capacity and stiffness. Gao et al. [12] studied the fatigue properties of polyurethane concrete for bridge deck pavement. It was found that polyurethane concrete has better fatigue performance than asphalt mixture through the test results. Ma et al. [13] found that ethylene-vinyl acetate could improve the resistance of polyurethane concrete under the freeze–thaw cycle and dry–wet cycle. Xu et al. [14] conducted a series of experimental studies including the bending test, shear test, splitting test and fatigue test on polyurethane concrete used for bridge deck pavement, and the mechanical properties of polyurethane concrete were evaluated. Jiang et al. [15] reported a polyurethane concrete filled with dolerite. The performance of this material was investigated by using the rutting test, freeze–thaw splitting test and low-temperature bending test. The results showed that the polyurethane concrete had good mechanical properties and durability. Jia et al. [16] obtained an elastic polyurethane concrete containing waste rubber particles. A linear elastic constitutive model of this material was proposed, and the microstate of polyurethane concrete at failure is observed by scanning electron microscope observation.
In China, polyurethane concrete has been applied in bridge engineering, such as bridge reinforcement and bridge deck pavement. In Harbin, an old bridge was strengthened with polyurethane concrete, and its flexural capacity and stiffness were improved [17]. In Ningbo, Roaby company had developed an ECO (Ecology Conservation Optimization) modified polyurethane concrete, which had good durability, cohesive strength with steel, early strength property and workability. Presently, it has been applied to a large number of bridges in China [18]. In summary, the current research studies mainly focus on the proportion, basic mechanical properties, linear elastic constitutive model and fatigue performance of polyurethane concrete. The complete stress–strain relationship of other concretes, such as ultrahigh-performance concrete, recycled aggregate concrete and fiber reinforced concrete under uniaxial compression has been widely studied [19,20,21,22]. Some researchers also began to focus on the effect of temperature on the mechanical properties of concrete [23,24,25]. However, there is no reported research on the complete stress–strain relationship of the polyurethane concrete under uniaxial compression and the effect of temperature on the mechanical properties of polyurethane concrete.
In the present study, cube and prism specimens of the modified polyurethane concrete were fabricated, and the compressive test, splitting tensile test and uniaxial compression test were performed under different temperatures. The change rules of cubic compressive strength, splitting tensile strength, axial compressive strength, elastic modulus and peak strain of the modified polyurethane concrete in a temperature-dependent context were explored, and the conversion relations of the three strengths were established. A temperature-dependent uniaxial compression constitutive model of modified polyurethane concrete was proposed. The calculation results of the constitutive model were compared with the experimental results, and the accuracy of the proposed model was verified. The results are expected to provide the basis for the application of modified polyurethane concrete in bridge deck pavement.
2. Experimental Program
2.1. Test Specimens
2.1.1. Mix Design
The main ingredients of modified polyurethane concrete adopted in the experiment were aggregates, modified polyurethane binder (multiple groups of thermosetting polymer materials) and admixtures. The admixtures, which were composed of toluene diisocyanate trimer and hexamethylene diisocyanate trimer, could promote the solidification of modified polyurethane concrete. Aggregates include coarse aggregate and fine aggregate rich in silica, which was mixed according to the maximum density curve. The coarse aggregate was continuously graded natural gravel and machine-made sand with round and flat particles and without acute angle. The fine aggregate was continuously graded natural river sand. All the raw materials required for the experiment were provided by Roaby company (Ningbo, China). The mix proportion of the concrete specimens was designed according to the strength grade of C60 (characteristic strength of 60 MPa). The sand–binder ratio, the ratio of modified polyurethane to aggregate in modified polyurethane concrete, obtained through a large number of experiments, was 15% to 17%. The mix proportions of the modified polyurethane concrete are shown in Table 1 and Figure 1.
2.1.2. Specimen Preparation
Modified polyurethane concrete specimens were cube specimens with a side length of 150 mm and prism specimens with a size of 150 mm × 150 mm × 300 mm. All the specimens were batched and prepared in the laboratory. The preparations of these specimens were divided into three steps. Firstly, the coarse and fine aggregates were screened and weighed. Then aggregates and other raw materials were mixed and transported to a high-speed mixer (Figure 2a), where mixed pastes were produced after 2 min of mixing. Next, after the raw materials were sufficiently mixed, we poured the mixed pastes into cube and prism molds and then vibrated and compacted them on the concrete shaking table (Figure 2b). The excess mixture was removed, and the surface was leveled by using a scraper (Figure 2c,d), and the specimens were de-molded after 3 h, at indoor temperature (15 °C). Finally, all specimens were cured at an indoor temperature for 28 days after numbering. The equipment used in the pouring process of specimens is shown in Figure 2. The modified polyurethane concrete specimens are shown in Figure 3.
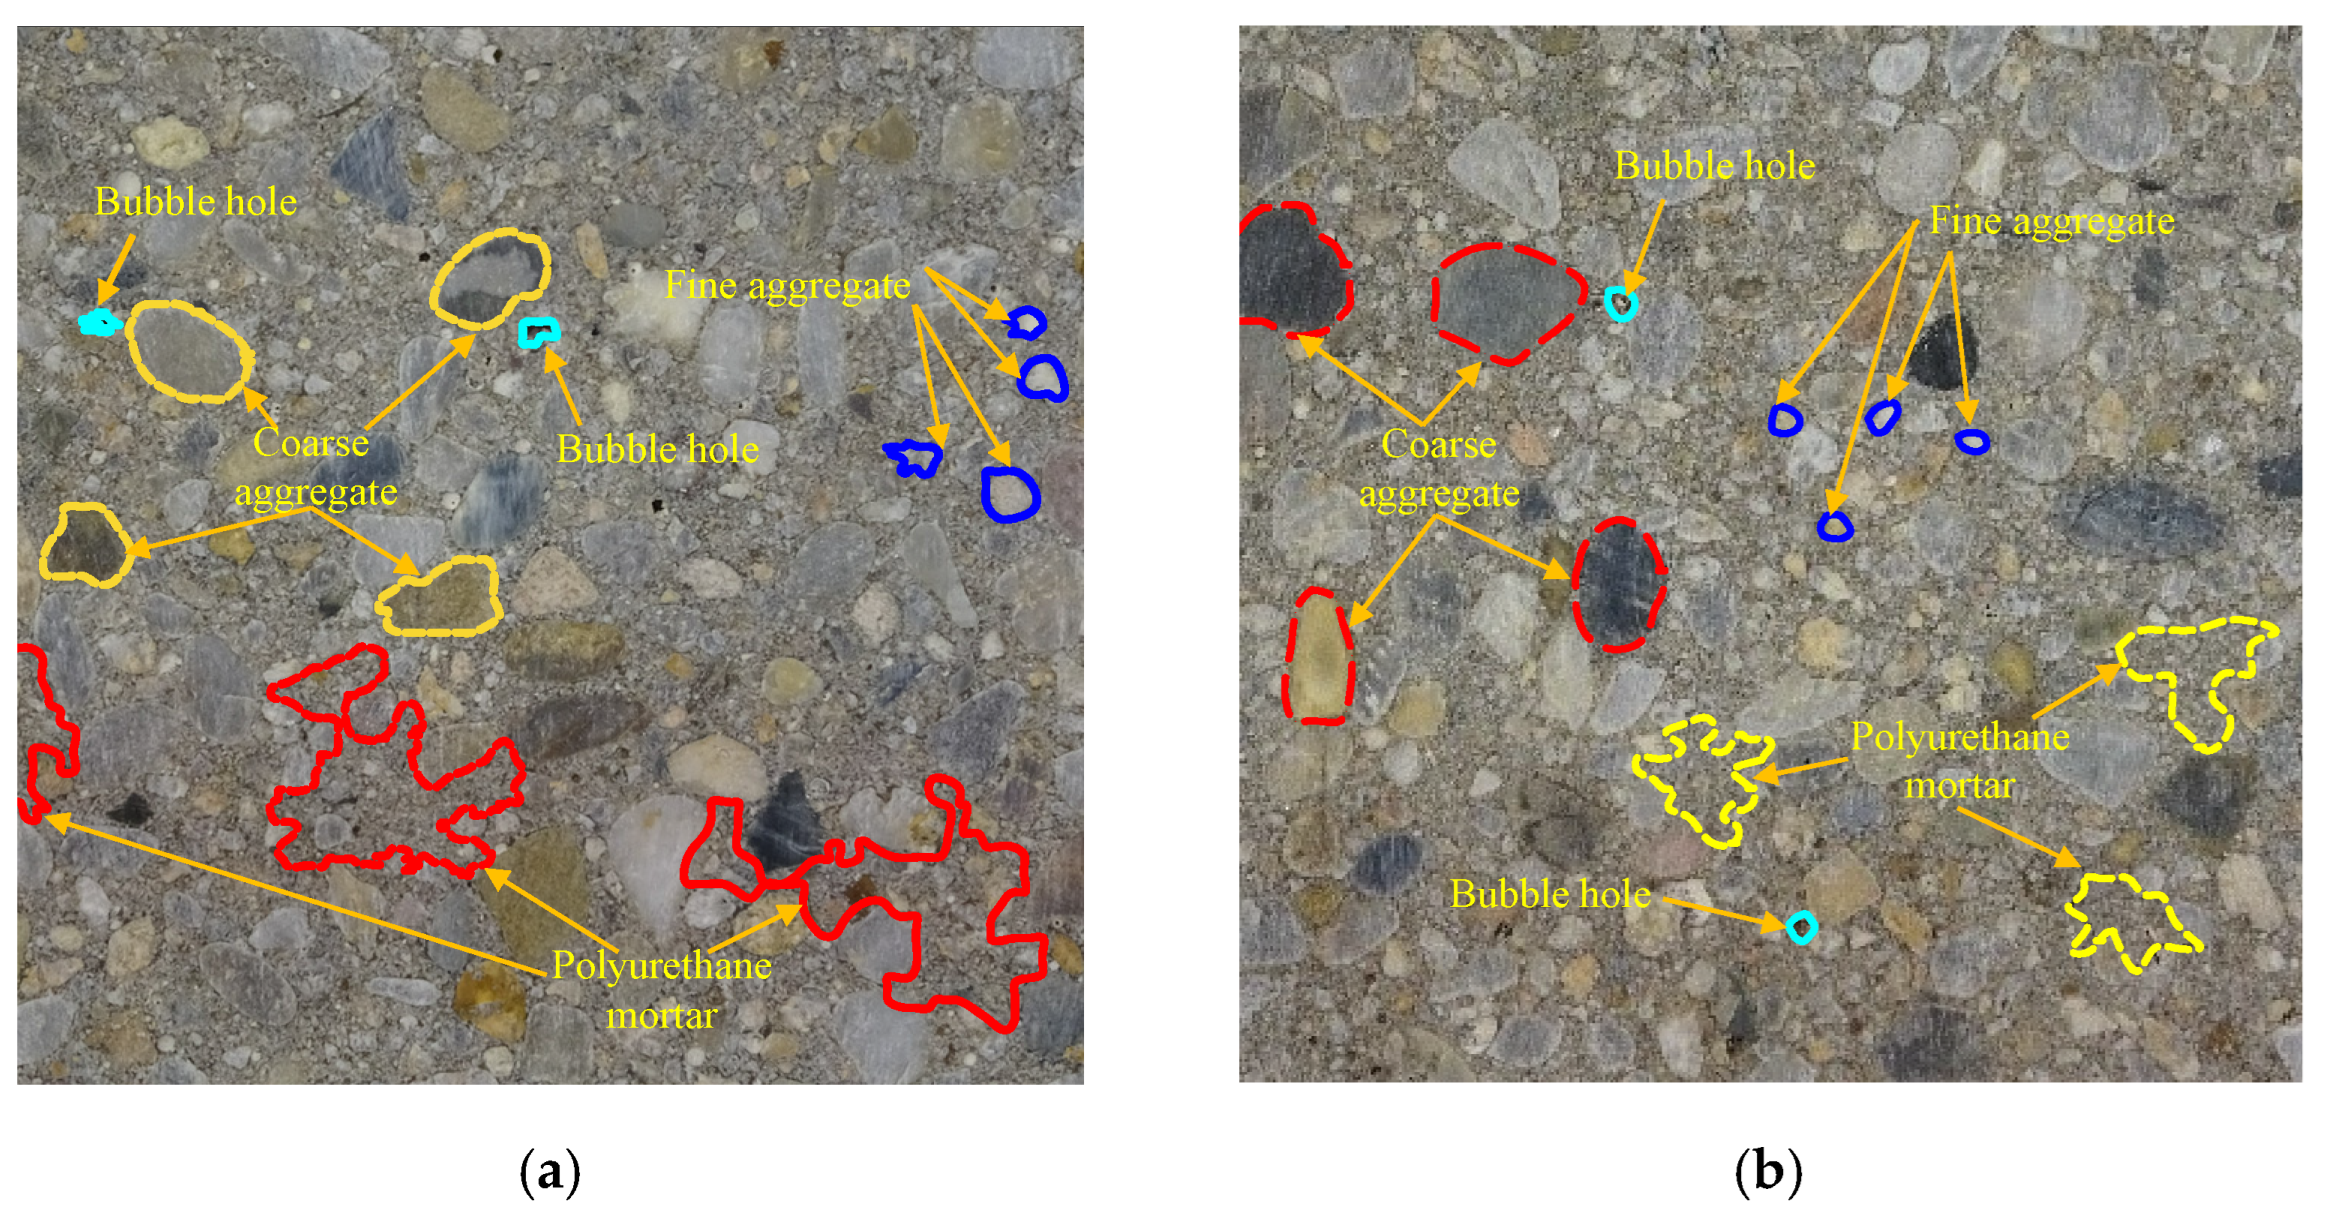
After the concrete curing, to check whether the materials were evenly mixed, three specimens were randomly selected for cross-section water-cutting. The selected specimens were cut into slices with a thickness of 5–8 mm along the section of 150 mm × 150 mm, and the combination of aggregate and modified polyurethane was observed (Figure 4). It can be seen from Figure 4 that the materials are evenly mixed, without aggregate accumulation and honeycomb holes. There are a few bubbles on the cutting surface, but they will not affect the overall performance of the modified polyurethane concrete specimens.
2.2. Experimental Setup and Loading Procedure
To study the influence of temperature on the mechanical properties of modified polyurethane concrete, experiments were performed at temperatures of 0, 15, 40 and 60 °C, respectively. All the experiments were carried out in accordance with the GB/T 50081-2019 (China’s Ministry of Housing and Urban–Rural Construction 2019) [26]. Under each temperature condition, a total of twelve specimens were tested. Two groups of cube specimens and two groups of prism specimens were designed, and each group consists of three identical specimens. One group of cube specimens for the compression experiment and the other for the splitting tensile experiment, while one group of prism specimens was used to measure the axial compressive strength and the other group was used to measure the compressive elastic modulus. To control the temperature, the specimens were heated or cooled in an environmental box with constant temperature and humidity. The constant temperature range of the environmental box was −40 to 150 °C, as shown in Figure 5. The strain gauges were attached to the specimens before specimens were put into the environmental box. All specimens were placed in the environment box with the corresponding temperature for 6 h before loading. After taking out a single specimen, the test loading time shall be less than 3 min. If the loading time is too long, the temperature variations could affect the experiment results.
Modified polyurethane concrete specimens that were subjected to a compressive test were loaded through a microcomputer-controlled electrohydraulic servo testing machine with a capacity of 2500 kN. The loading was controlled by force at a rate of 13,500 N/s following the code (GB/T 50081-2019) [26]. During the entire loading process, a data-acquisition system was used to synchronously monitor the load, strain and displacement data. Two quenched and tempered steel plates (with a size of 50 cm × 50 cm × 2 cm) were placed between the platens and specimen ends. For the static uniaxial compressive elastic modulus test, in order to measure the compressive strain of the specimen, three resistance strain gauges with a gauge distance of 100 mm were attached to the front face of the specimens along the loading direction. Figure 6 and Figure 7 present the schematic diagram of the compression test setup. Prior to the test, preloading shall be carried out. The purpose of preloading was to check whether the testing setup and the instruments were operating normally or not. The channel of the measurement system was monitored, and it was ensured that specimens were properly balanced. The gap between the loading equipment and the samples was eliminated.
An experimental tooling fixture was manufactured to conduct the splitting tensile test of modified polyurethane concrete specimens. The experimental tooling fixture was equipped with a steel arc pad with a radius of 75 mm and a length greater than the specimen size. The experimental tooling fixture was placed between the pressure plates and the cube specimens. The modified polyurethane concrete cube specimens that conducted the splitting tensile test were loaded in a universal testing machine with a capacity of 1000 kN (Figure 8). Specimens for splitting tensile tests should be continuously and evenly loaded without any impact, and the loading rate was controlled by applying vertical forces of 1350 N/s.
3. Experimental Results and Discussion
3.1. Failure Mode
3.1.1. Cube Specimens
For the cube compression test, the crack development process of all cube specimens is similar before failure. With the load increasing, many micro-cracks, white, distributed in a grid shape, appeared in the middle of specimens. Afterward, the micro-cracks gradually extended to the top corners of the specimens. With the load continuing to increase, the shape of the specimens changed significantly, but there was no spalling concrete on the surface. When approaching failure, a higher number of cracks appeared on the surface of the specimens, and the crack width increased. The crack was caused by the interface debonding between modified polyurethane binder and aggregate and the damage of aggregate. At this time, a few micro-cracks disappeared, and this was due to the viscosity of the modified polyurethane binder.
The failure modes of specimens are different at different temperatures. At the temperature of 0 °C, the specimens made a loud bang when it failed. A large area of concrete fell off on the side of the specimens, and the damaged specimens were conical, as shown in Figure 9a. The failure mode was similar to that of ordinary concrete. At 15, 40 and 60 °C, the specimens also made sounds during damage, but the sounds decreased with the increase of temperature. This phenomenon might be caused by the softening of modified polyurethane at high temperatures. Although the specimens had oblique cracks, there was no spalling concrete, as shown in Figure 9b–d.
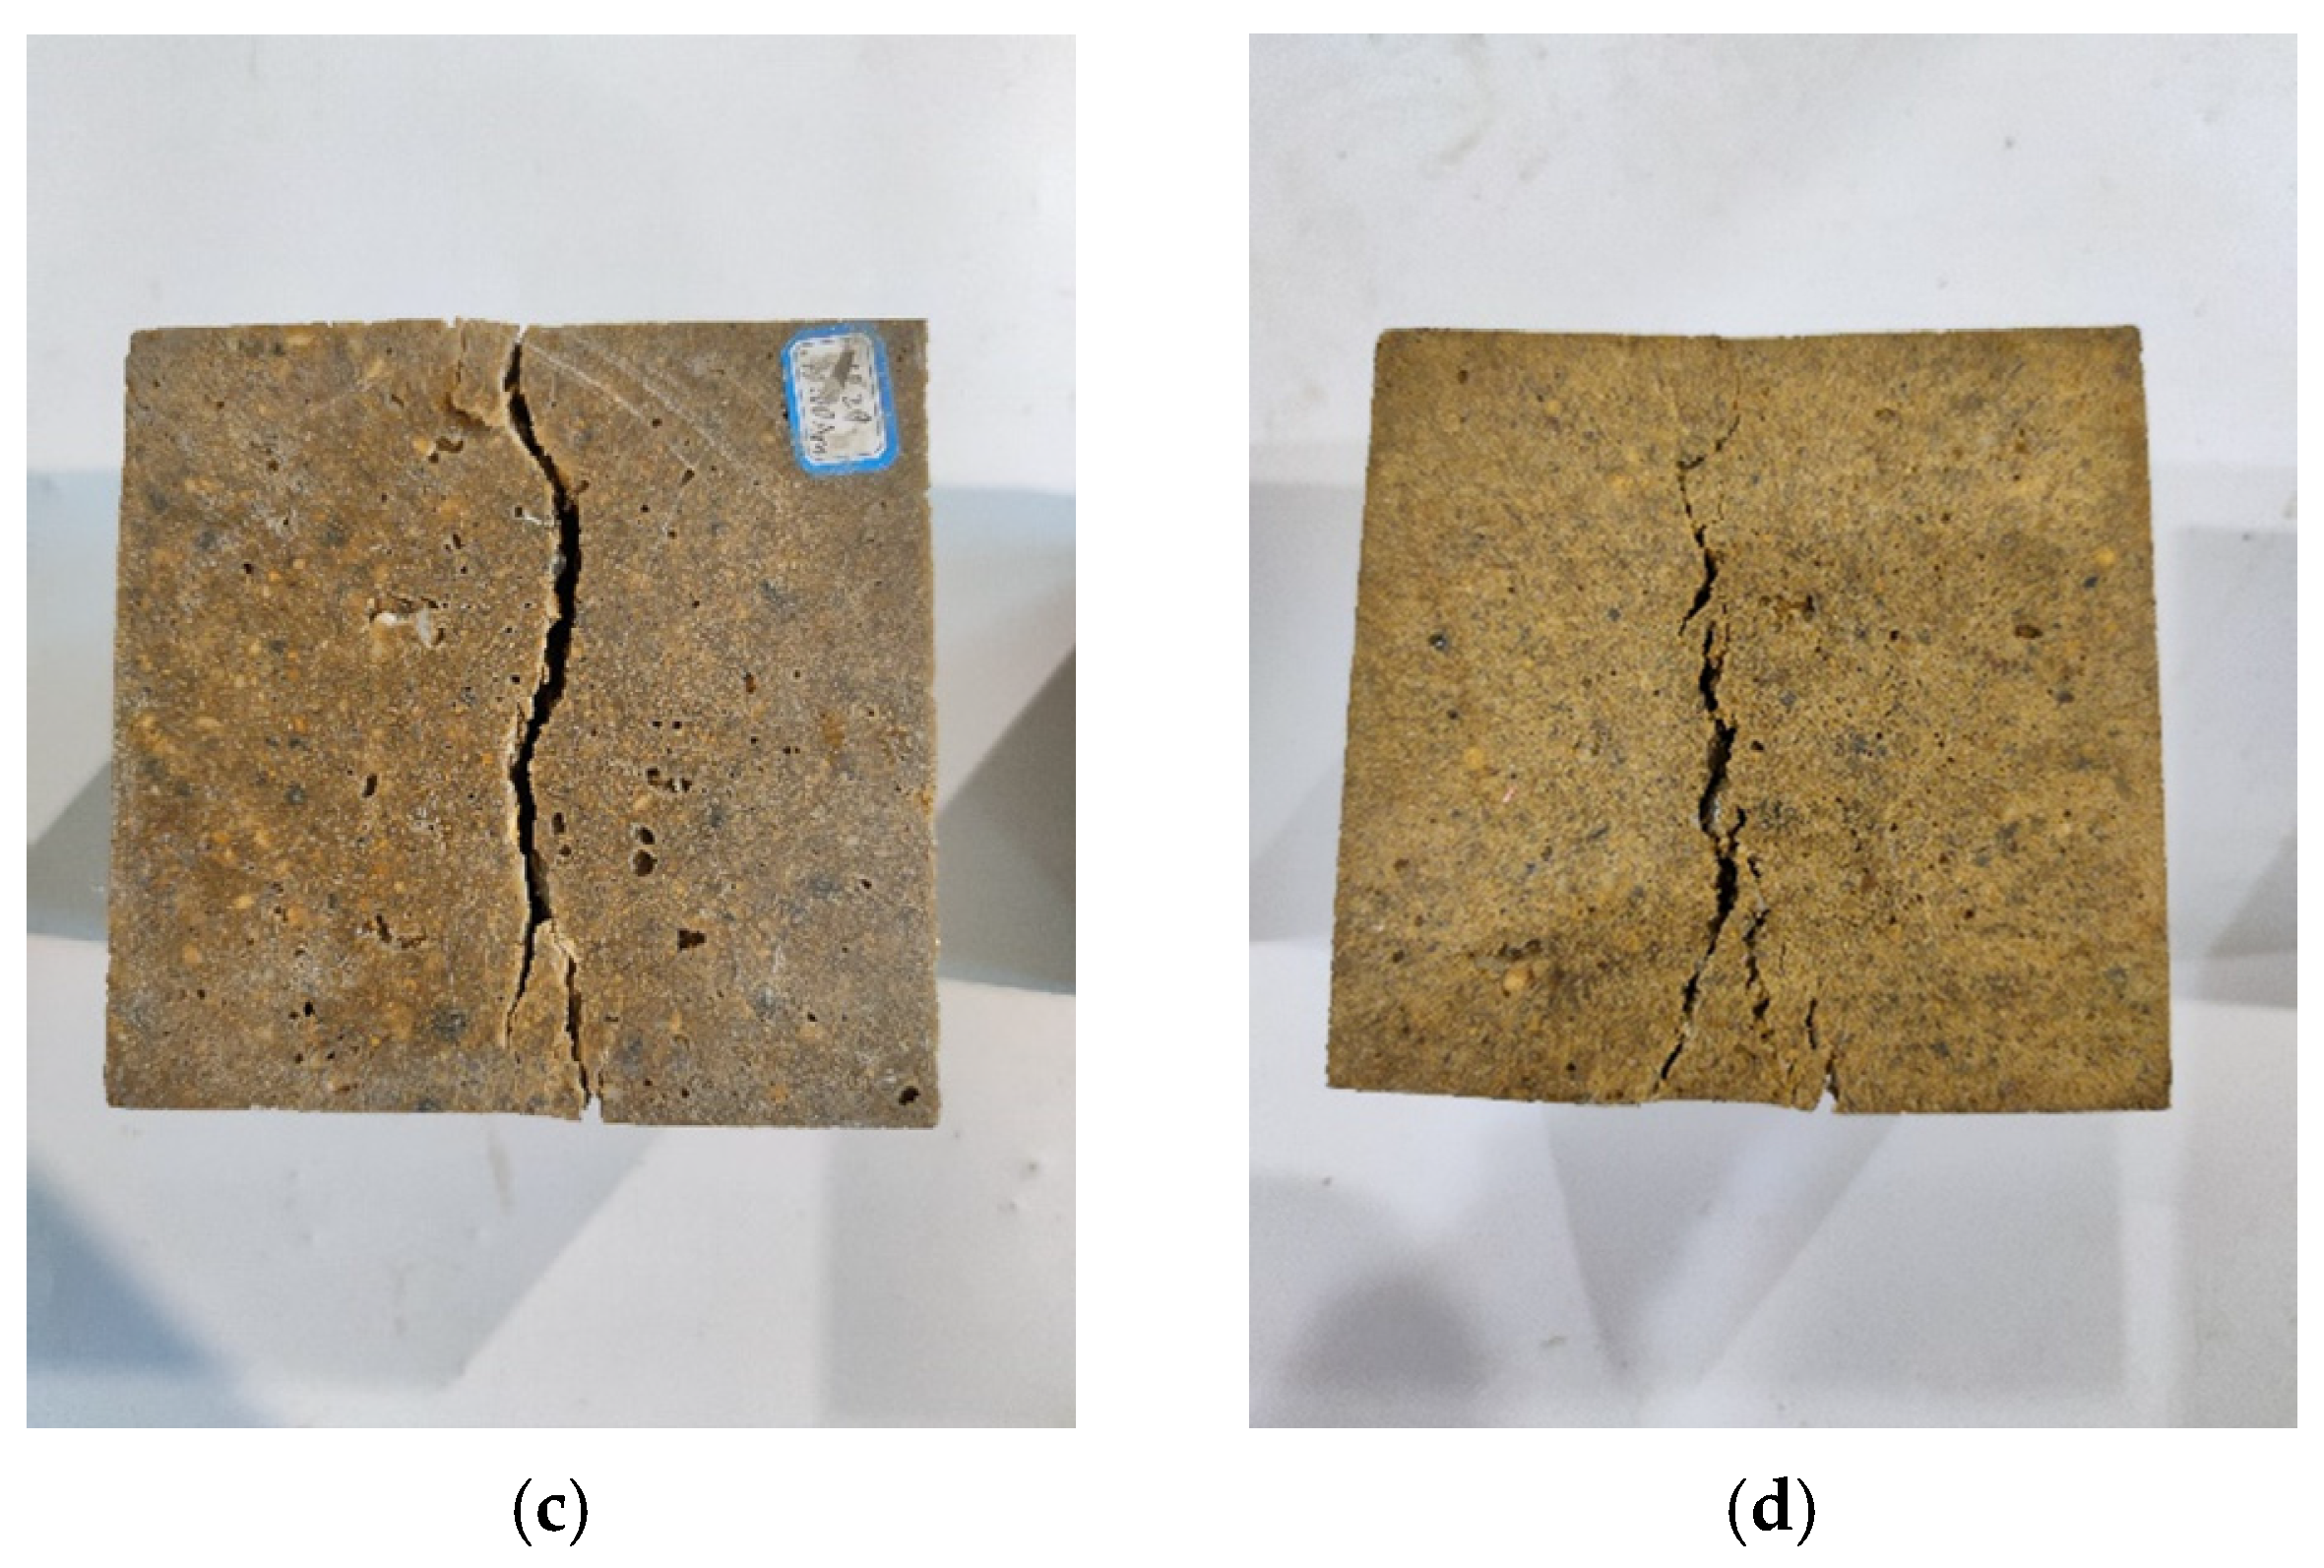
Figure 10 shows the failure modes of the specimens of the splitting tensile test at different temperatures (0, 15, 40 and 60 °C). The failure modes of the specimens at different temperatures were almost similar. The main cracks appeared between the upper and lower loading points and destroyed the specimens. When the temperature was 0 and 15 °C, the main cracks were straight lines. When the temperature was 40 and 60 °C, the main cracks were curves. Finally, the specimens were split into roughly equal halves, which was a typical brittle failure. At failure, the specimens all made sounds which decreased with the increase of temperature. Figure 11 showed the fracture surfaces of one specimen. The polyurethane mortar, coarse aggregate and binder were damaged, as shown in Figure 11. This phenomenon showed that the cohesive force between aggregate and binder is strong.
3.1.2. Prism Specimens
At the beginning of loading, the surface of specimens had no obvious change. With the increase of load, some micro-cracks appeared rapidly on the surface. When approaching the ultimate capacity, the specimens rustled. Meanwhile, the width and length of micro-cracks increased, and the micro-cracks gradually formed an oblique main crack. Finally, the specimens failed.
The compression failure modes of prism specimens are shown in Figure 12. The specimens at 0 °C showed serious failure, as shown in Figure 12a. The specimens made loud sounds at failure, and several diagonal or longitudinal cracks appeared. There was spalling concrete on the surface of the specimens. The sounds decreased at failure when the temperature was 15 °C. The major diagonal cracks penetrated through the specimens; this was a typical kind of shear slip failure mode, as shown in Figure 12b. With the temperature rising, the sounds at failure decreased; the main cracks were difficult to identify. At 40 and 60 °C, micro-cracks were distributed on the diagonal of the surface of specimens and did not penetrate through the specimens. The volume in the middle of the specimen expanded at failure.
3.2. Cubic Compressive Strength and Splitting Tensile Strength
In order to obtain the cube compressive strength and splitting tensile strength at different temperatures, the ultimate capacity of specimens is transformed into a strength value. The cubic compressive strength and the splitting tensile strength are calculated as follows:
where fcu and ft are cubic compressive strength and splitting tensile strength (MPa), respectively. F is the failure load of the specimen. S is the bearing area or splitting tension area of the experiment specimen (mm2). The calculation result is accurate to 0.01 MPa.
At different temperatures, the average value of the ultimate strength of specimens is taken as the strength value, and the dispersion degree of material strength is characterized by standard deviation and dispersion coefficient. Table 2 shows the average value of ultimate capacity, the average value of ultimate strength, standard deviation and dispersion coefficient of the specimens.
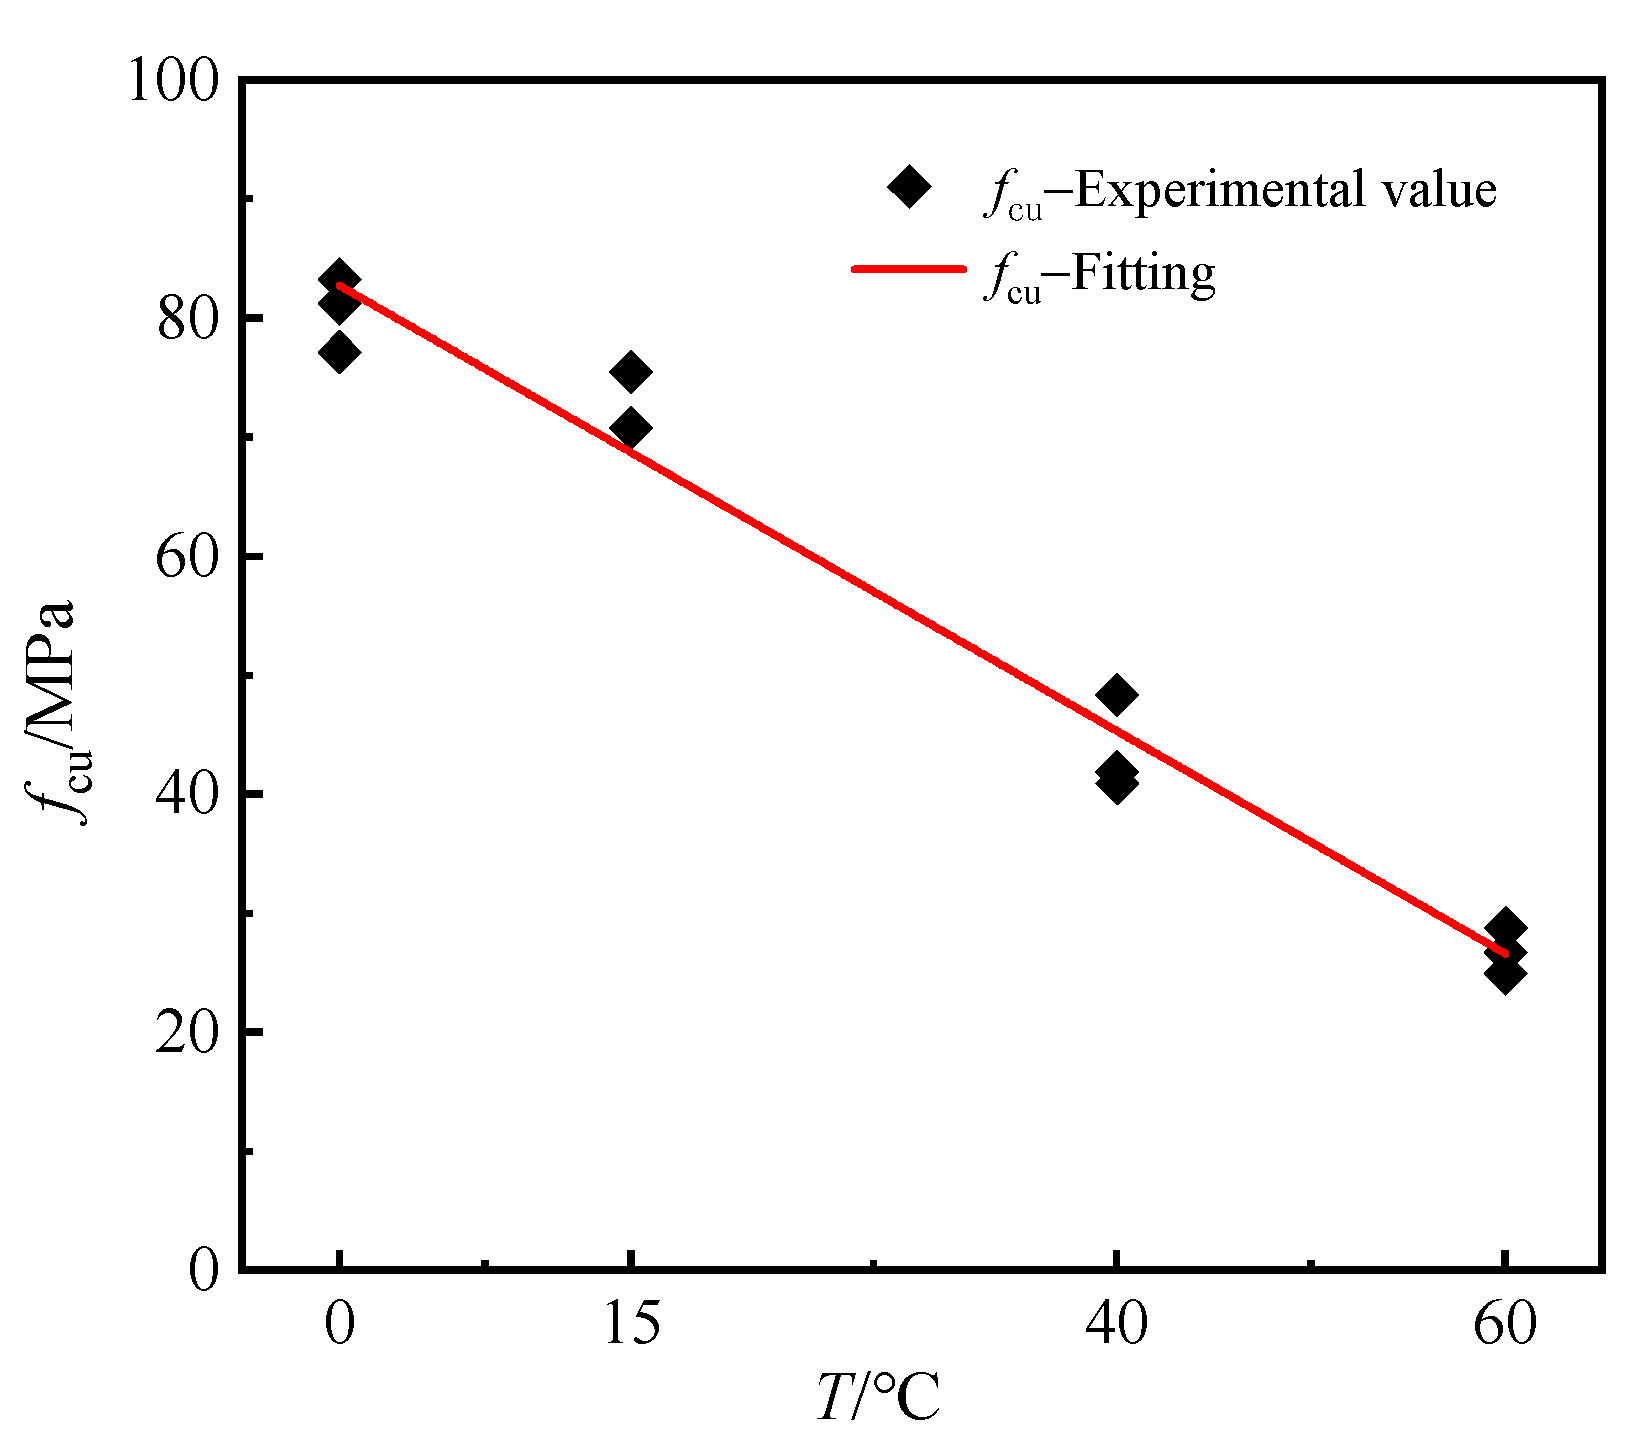
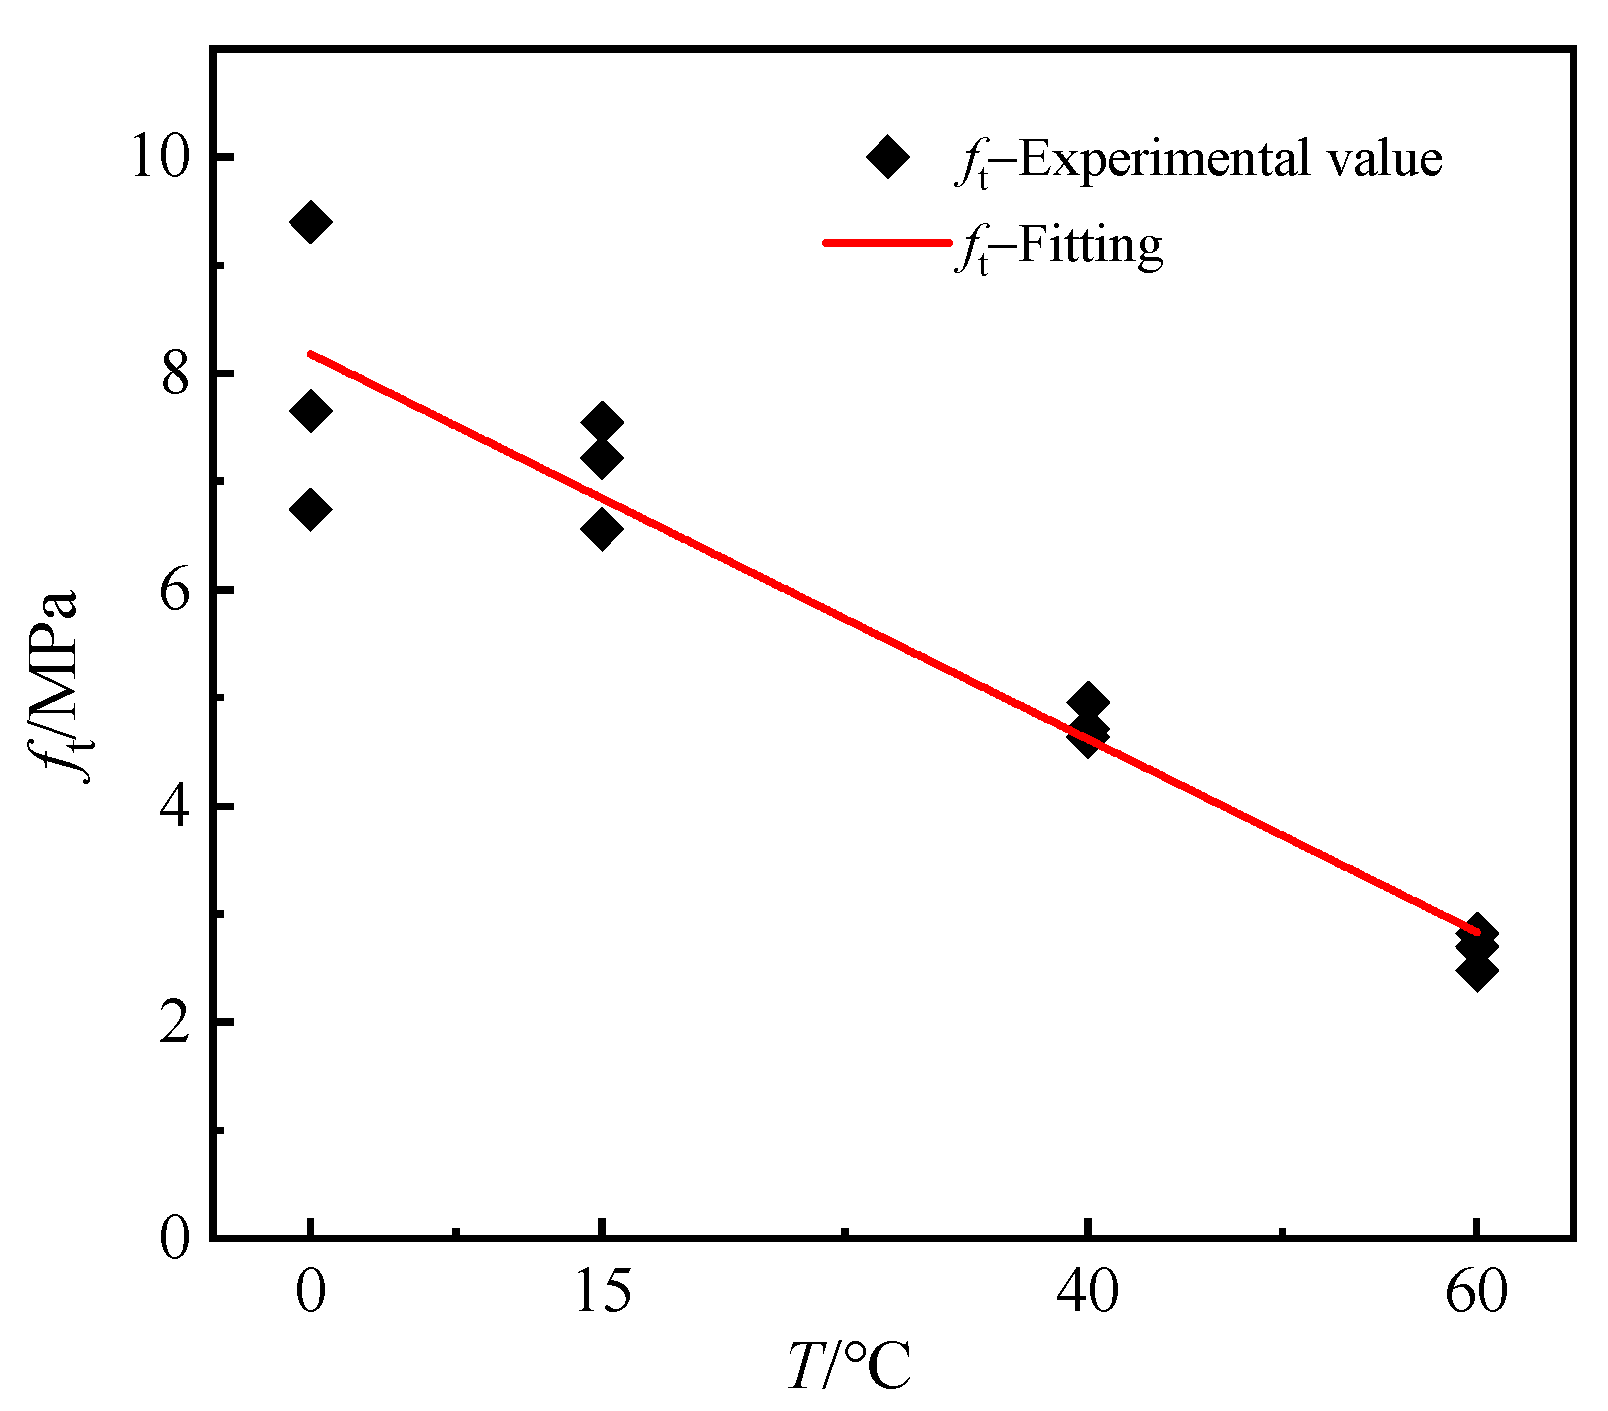
Figure 13 shows the cubic compressive strength of the specimens at different temperatures. With the temperature increasing, the cubic compressive strength of the specimens decreased significantly. When the temperature is 15, 40 and 60 °C, the cubic compressive strength decreases by 7.4%, 46.0% and 67.1%, respectively. As shown in Figure 14, the splitting tensile strength at different temperatures is obtained. When the temperature is 15, 40 and 60 °C, the splitting tensile strength decreases by 10.3%, 39.8% and 66.3%, respectively. At different temperatures, the ratios of splitting tensile strength to cubic compressive strength (ft/fcu) are close. The ratio ranged from 9.8% to 11.0%. The average ratio of splitting tensile strength to cubic compressive strength is 10.1%.
3.3. Axial Compressive Strength
The value of the axial compressive strength (fc,t) was calculated in Equation (1). Figure 15 shows the axial compressive strength of modified polyurethane concrete at different temperatures. With the temperature increasing, the axial compressive strength of modified polyurethane concrete decreases obviously. At 15, 40 and 60 °C, the axial compressive strength decreases by 25.0%, 49.7% and 73.4%, respectively. With the temperature increasing, there is a great difference in the decline range of the axial compressive strength and cubic compressive strength, which causes a difference in the ratio of axial compressive strength and cubic compressive strength (fc,t/fcu). As shown in Figure 16, the ratio is between 0.8 and 1. The average value of the ratio of modified polyurethane concrete is about 0.89, which is obviously greater than the ratio of ordinary concrete.
Considering the influence of temperature, the temperature parameter is introduced. Using the data in Figure 15, the calculation expression for axial compressive strength and temperature is obtained by regression analysis, as follows:
where t is the environmental temperature, the indoor temperature is T0 = 15 °C, and fc,t and fc,T are the axial compressive strength of modified polyurethane concrete at temperature t and temperature T0. R2 is the correlation coefficient, and R2 = 0.99.
3.4. Peak Strain
Figure 17 shows the trend of peak strain with the temperature of modified polyurethane concrete. At 0, 15, 40 and 60 °C, the peak strain is 11.02 × 10³ με, 17.29 × 10³ με, 19.85 × 10³ με and 28.21 × 10³ με, respectively. When the temperature is 15, 40 and 60 °C, the peak strain increases by 56.9%, 80.1% and 156.0%, respectively. With the temperature increasing, the peak strain, εc,t, increases rapidly, which is due to the softening of the polyurethane binder at a high temperature. Due to the difference in coefficient of thermal expansion between aggregate and polyurethane binder, there is large tensile stress in the specimen. In addition, the tensile stress leads to micro-cracks. With the temperature increasing, the axial compressive strength decreases, and the peak strain increases.
Using the data in Figure 17, the calculation expression for peak strain and temperature is obtained by regression analysis, which is accomplished as follows:
where εc,t and εc,T are the peak strain of modified polyurethane concrete with temperature t and temperature T0, and R2 = 0.99.
3.5. Elastic Modulus
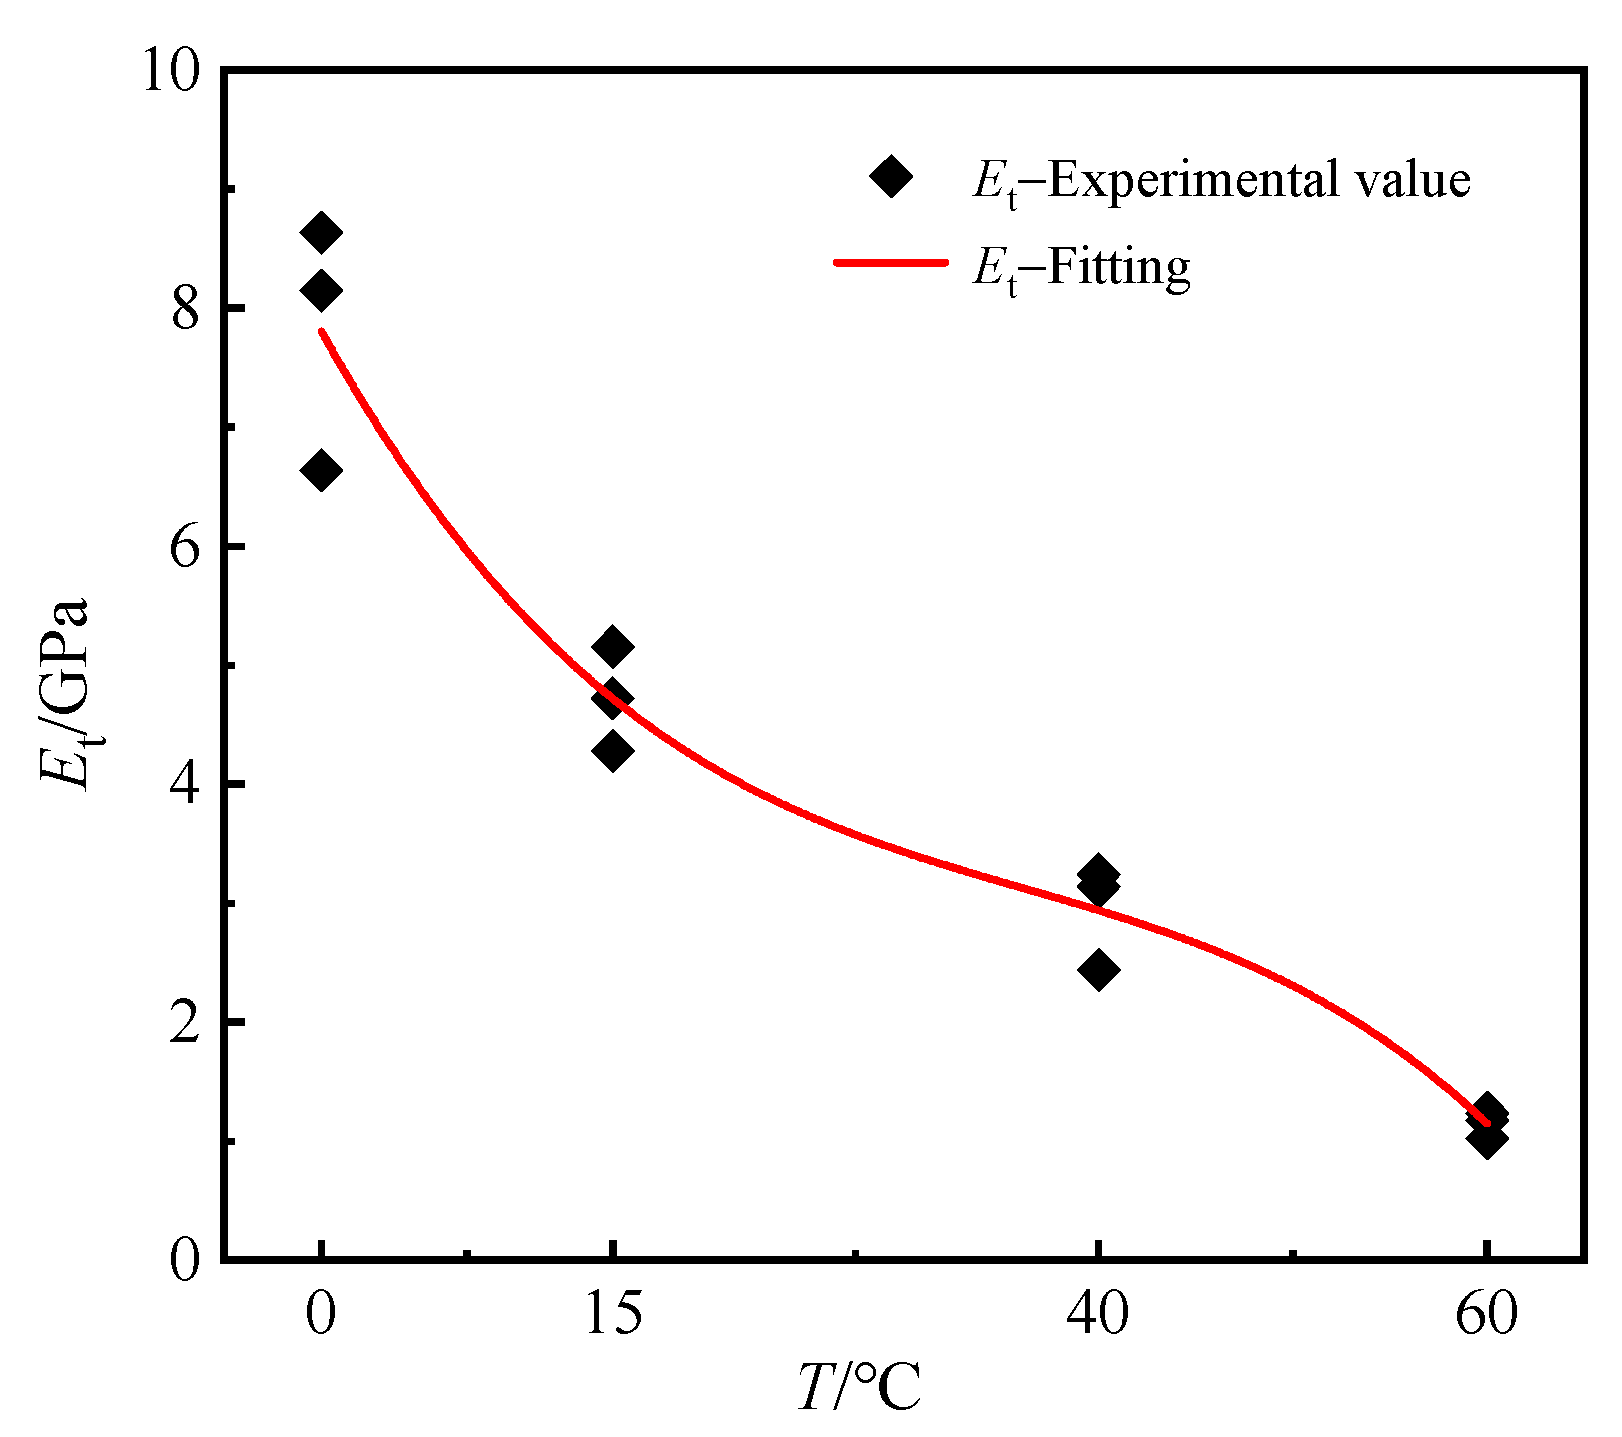
Figure 18 shows the variation of initial elastic modulus with the temperature of modified polyurethane concrete. The initial elastic modulus is the secant value between stress 0.5 and stress fc,t/3 in the stress–strain curve. As shown in Figure 18, the elastic modulus of modified polyurethane concrete decreases with the temperature increasing. At 0, 15, 40 and 60 °C, the value of the initial elastic modulus is 7805.95, 4719.46, 2940.53 and 1147.10 MPa, respectively. At 15, 40 and 60 °C, the initial modulus of elasticity decreases by 39.5%, 62.3% and 85.3%, which shows that the softening phenomenon of the modified polyurethane concrete binder is obvious at a high temperature.
Using the data in Figure 18, we can obtain the calculation expression for the elastic modulus and temperature by regression analysis, as follows:
where Et and ET are the initial moduli of elasticity of modified polyurethane concrete at temperature t and temperature T0, and R2 = 0.99.
4. Uniaxial Compression Constitutive Model
The uniaxial compressive constitutive model of the modified polyurethane concrete with temperature effect is fitted by using the compressive stress–strain relationship of concrete in the China code (GB 50010-2010) [27]. The stress–strain curve, including ascending portion and descending portion, is obtained through a fitting. The calculation expression is as follows:
where ε and σ are the stress and strain; fp and εp are the peak stress and peak strain; x = ε/εp; y = σ/fp; and A and B are shape parameters, which are related to the ascending portion and descending portion of the stress–strain curve.
By normalizing the stress–strain curves of the experiment, the dimensionless stress–strain curves at different temperatures are obtained, as shown in Figure 19. In this paper, the effect of temperature on shape parameters A and B are considered. Through regression analysis of the dimensionless stress–strain curves, the shape parameters at different temperatures are obtained. Furthermore, the variation law of shape parameters with temperature can be obtained, as shown in Figure 20. The value ranges of the shape parameter A and B are 2 ≤ A ≤ 6 and 1 ≤ B ≤ 5. As the temperature increases, the shape parameters first decrease and then increase. The shape parameter is the smallest at 40 °C. In conclusion, the larger the value of A, the smaller the slope of the ascending portion of the curve, and the smaller the value of B, the flatter the descending portion of the curve. The calculation expression between temperature and shape parameters can be established as follows:
To sum up, Equations (2), (3), (6) and (7) are combined to represent the constitutive model of the stress–strain curves. Based on the constitutive model, the stress–strain curves of modified polyurethane concrete at different temperatures are obtained and are compared with the experimental results, as shown in Figure 21. The ascending portion of calculation curves overlaps well with that of experimental curves. In the descending portion, the calculation curves and experimental curves come close to overlapping. The calculation curves are in good agreement with the experimental curves. It can provide a reference for engineering and further research of the polyurethane concrete constitutive model.
5. Conclusions
In this research, the cube compressive test, splitting tensile test and uniaxial compression test of modified polyurethane concrete specimens were performed at different temperatures. The failure mode, cube compressive strength, splitting tensile strength, axial compressive strength, elastic modulus and the compressive stress–strain curves of the modified polyurethane concrete were obtained. The influence of temperature on the mechanical properties of modified polyurethane concrete was analyzed. A uniaxial compression constitutive model considering the temperature effect was established. Based on the research results, the following conclusions can be drawn:
(1) The failure mode of modified polyurethane concrete is significantly affected by temperature. In the cube compressive test and uniaxial compression test, specimens are brittle failure at low temperature and plastic failure at high temperature. With the temperature increasing, the maximum crack width of the specimen at failure decreases, the crack propagation speed is slower and the integrity of the specimens are better after failure. In the splitting tensile test, the main cracks are straight lines at low temperatures and curves at high temperatures.
(2) The temperature has a significant effect on the mechanical properties of modified polyurethane concrete. With the increase of temperature, the cubic compressive strength, split tensile strength, axial compressive strength and elastic modulus decrease, and the peak strain increases. The temperature has a slight impact on the ratio of splitting tensile strength to cubic compressive strength. The ratios of axial compressive strengths to cube compressive strengths are quite different at different temperatures.
(3) A constitutive model of modified polyurethane concrete under uniaxial compression considering the influence of temperature was established, and reasonable agreement was found to exist between the constitutive model calculation results and the experimental results. The experimental results provide material parameters for the finite element analysis of modified polyurethane concrete bridge deck pavement. The proposed constitutive model can accurately describe the mechanical properties of modified polyurethane concrete at different temperatures, which can provide a theoretical basis for the structural design and numerical analysis of modified polyurethane concrete. Meanwhile, it provides a test basis for the influence of the coupling effect of temperature and load on the modified polyurethane concrete bridge deck pavement.
Author Contributions
Conceptualization, X.H.; methodology, J.L., F.F. and W.W.; validation, F.F. and W.W.; formal analysis, F.F.; writing—original draft preparation, J.L.; writing—review and editing, J.L. and W.W.; supervision, X.H.; project administration, F.F. and S.X.; funding acquisition, X.H. All authors have read and agreed to the published version of the manuscript.
Funding
This research is substantially funded by the National Natural Science Foundation of China (No. 51925808) and the Science and Technology Research and Development Plan of China Railway Development and Investment Group Co., Ltd. (No. 2021-Category B-04).
Institutional Review Board Statement
Not applicable.
Informed Consent Statement
Not applicable.
Data Availability Statement
Not applicable.
Conflicts of Interest
The authors declare no conflict of interest.
References
- Nelsen, T. Performance of Concrete Bridge Deck Surface Treatments; Brigham Young University: Provo, UT, USA, 2005. [Google Scholar]
- Howarth, G. Polyurethanes, polyurethane dispersions and polyureas: Past, present and future. Surf. Coat. Int. Part B Coat. Trans. 2003, 86, 111–118. [Google Scholar] [CrossRef]
- Aleis, K.A.; LaBarca, I.K. Evaluation of the URETEK Method® of Pavement Lifting; Wisconsin Department of Transportation: Madison, WI, USA, 2007; pp. 1–30. [Google Scholar]
- Martinelli, A.E.; Melo, D.M.A.; Lima, F.M.; Bezerra, U.T.; Marinho, E.P.; Henrique, D.M. Addition of polyurethane to portland cement. Mater. Sci. Forum. 2005, 498–499, 401–406. [Google Scholar] [CrossRef]
- Hussain, H.K.; Zhang, L.Z.; Liu, G.W. An experimental study on strengthening reinforced concrete T-beams using new material poly-urethane-cement (PUC). Constr. Build. Mater. 2013, 40, 104–117. [Google Scholar] [CrossRef]
- Hussain, H.K.; Liu, G.W.; Yong, Y.W. Experimental study to investigate mechanical properties of new material polyurethane–cement composite (PUC). Constr. Build. Mater. 2014, 50, 200–208. [Google Scholar] [CrossRef]
- Wang, H.; Liu, H.; Zhuang, C. Study on the Polyurethane Concrete for the Rapid Repairment of Highway Pavement. Appl. Mech. Mater. 2012, 193–194, 762–769. [Google Scholar] [CrossRef]
- Jiang, K.; Su, Q.; Bai, H.; Feng, X. Researching on the Mechanic Properties of Early-Strength Polyurethane Concrete and its Affecting Factors. Appl. Mech. Mater. 2014, 518, 225–230. [Google Scholar] [CrossRef]
- Hu, Z.; Hu, X.; Cheng, W.; Zhao, Y.; Wu, M. Performance optimization of one-component polyurethane healing agent for self-healing concrete. Constr. Build. Mater. 2018, 179, 151–159. [Google Scholar] [CrossRef]
- Yang, N.; Zhang, K.; Sun, Q. Dispersion and Pressure Sensitivity of Carbon Nanofiber-Reinforced Polyurethane Cement. Appl. Sci. 2018, 8, 2375. [Google Scholar] [CrossRef] [Green Version]
- Zhang, K.; Sun, Q. Experimental Study of Reinforced Concrete T-Beams Strengthened with a Composite of Prestressed Steel Wire Ropes Embedded in Polyurethane Cement (PSWR–PUC). Int. J. Civ. Eng. 2017, 16, 1109–1123. [Google Scholar] [CrossRef]
- Gao, H.; Sun, Q. Study on Fatigue Test and Life Prediction of Polyurethane Cement Composite (PUC) under High or Low Temperature Conditions. Adv. Mater. Sci. Eng. 2020, 2020, 1–14. [Google Scholar] [CrossRef] [Green Version]
- Ma, W.; Zhao, Z.; Guo, S.; Zhao, Y.; Wu, Z.; Yang, C. Performance Evaluation of the Polyurethane-Based Composites Prepared with Recycled Polymer Concrete Aggregate. Materials 2020, 13, 616. [Google Scholar] [CrossRef] [PubMed] [Green Version]
- Xu, S.; Xu, M.; Zhang, Y.; Guo, Y.; Peng, G.; Xu, Y. An Indoor Laboratory Simulation and Evaluation on the Aging Resistance of Polyether Polyurethane Concrete for Bridge Deck Pavement. Front. Mater. 2020, 7, 7. [Google Scholar] [CrossRef]
- Jiang, Z.; Tang, C.; Yang, J.; You, Y.; Lv, Z. A lab study to develop polyurethane concrete for bridge deck pavement. Int. J. Pavement Eng. 2020, 995, 1–9. [Google Scholar] [CrossRef]
- Jia, Z.; Jia, D.; Sun, Q.; Wang, Y.; Ding, H. Preparation and Mechanical-Fatigue Properties of Elastic Polyurethane Concrete Composites. Materials 2021, 14, 3839. [Google Scholar] [CrossRef]
- Kexin, Z.; Quansheng, S. Strengthening of a Reinforced Concrete Bridge with Polyurethane-cement Composite (PUC). Open Civ. Eng. J. 2016, 10, 768–781. [Google Scholar] [CrossRef]
- Xu, B.; Xu, S.; Lv, J.; Peng, Q. Development and application of polymer concrete application in Bridge Engineering. Build. Decor. Mater. World 2021, 2021, 89–92. (In Chinese) [Google Scholar]
- Tipka, M.; Vašková, J. Testing of Concrete and Fibre Reinforced Concrete in Uniaxial Tension. Adv. Mater. Res. 2015, 1106, 49–52. [Google Scholar] [CrossRef]
- Wu, Z.; Shi, C.; He, W.; Wang, D. Uniaxial Compression Behavior of Ultra-High Performance Concrete with Hybrid Steel Fiber. J. Mater. Civ. Eng. 2016, 28, 06016017. [Google Scholar] [CrossRef]
- Xiao, J.; Zhang, K.; Akbarnezhad, A. Variability of stress-strain relationship for recycled aggregate concrete under uniaxial compression loading. J. Clean. Prod. 2018, 181, 753–771. [Google Scholar] [CrossRef]
- Deng, M.; Pan, J.; Liang, X. Uniaxial Compressive Test of High Ductile Fiber-Reinforced Concrete and Damage Constitutive Model. Adv. Civ. Eng. 2018, 2018, 1–12. [Google Scholar] [CrossRef] [Green Version]
- Guo, Z. Mechanical Properties of Concrete Materials and Structural Member at Room Temperature and High Temperature; Tsinghua University Press: Beijing, China, 2006. [Google Scholar]
- Chen, G.M.; He, Y.H.; Yang, H.; Chen, J.F.; Guo, Y.C. Compressive behavior of steel fiber reinforced recycled aggregateconcrete after exposure to elevated temperatures. Constr. Build. Mater. 2014, 71, 1–15. [Google Scholar] [CrossRef] [Green Version]
- Saridemir, M.; Severcan, M.H.; Ciflikli, M.; Celikten, S.; Ozcan, F.; Atis, C.D. The influence of elevated temperature on strength and microstructure of high strength concrete containing ground pumice and metakaolin. Constr. Build. Mater. 2016, 124, 244–257. [Google Scholar] [CrossRef]
- GB/T 50081-2019; Standard for Test Methods of Concrete Physical and Mechanical Properties. Ministry of Housing and Urban Rural Development of the People’s Republic of China: Beijing, China, 2019.
- GB50010-2010; Code for Design of Concrete Structures. Ministry of Housing and Urban Rural Development of the People’s Republic of China: Beijing, China, 2010.
Figure 1.
Classification of sand grains based on particle sizes.

Figure 2.
Equipment used in the pouring process of specimens. (a) Concrete mixer. (b) Concrete shaking table. (c) Cube specimen after pouring. (d) Prismatic specimen after pouring.
Figure 2.
Equipment used in the pouring process of specimens. (a) Concrete mixer. (b) Concrete shaking table. (c) Cube specimen after pouring. (d) Prismatic specimen after pouring.


Figure 3.
Experiment specimens. (a) Cube specimens. (b) Prismatic specimens.

Figure 4.
Section of experiment specimen. (a) Concrete slice I. (b) Concrete slice II.

Figure 5.
Constant temperature box.

Figure 6.
Loading diagram of cube compressive experiment. (a) Test setup. (b) Schematic diagram.

Figure 7.
Loading diagram of prism compressive experiment. (a) Test setup. (b) Schematic diagram (unit: mm).
Figure 7.
Loading diagram of prism compressive experiment. (a) Test setup. (b) Schematic diagram (unit: mm).

Figure 8.
Loading diagram of cube splitting tensile experiment. (a) Test setup. (b) Schematic diagram.
Figure 8.
Loading diagram of cube splitting tensile experiment. (a) Test setup. (b) Schematic diagram.

Figure 9.
Compression failure modes of cube specimens. (a) 0 °C. (b) 15 °C. (c) 40 °C. (d) 60 °C.

Figure 10.
Failure mode of specimens of splitting tensile test. (a) 0 °C. (b) 15 °C. (c) 40 °C. (d) 60 °C.
Figure 10.
Failure mode of specimens of splitting tensile test. (a) 0 °C. (b) 15 °C. (c) 40 °C. (d) 60 °C.


Figure 11.
Fracture surfaces. (a) Fracture surfaces I. (b) Fracture surfaces II.

Figure 12.
Compression failure modes of prism specimens. (a) 0 °C. (b) 15 °C. (c) 40 °C. (d) 60 °C.

Figure 13.
Relationship between compressive strength and temperature.

Figure 14.
Relationship between splitting tensile strength and temperature.

Figure 15.
Relationship between prism compressive strength and temperature.

Figure 16.
Relationship between fc,t/fcu and temperature.

Figure 17.
Relationship between peak strain and temperature.

Figure 18.
Relationship between elastic modulus and temperature.

Figure 19.
Dimensionless stress–strain curve.

Figure 20.
The relation between the temperature T and the shape parameter A, B. (a) Fitting of shape parameter A. (b) Fitting of shape parameter B.
Figure 20.
The relation between the temperature T and the shape parameter A, B. (a) Fitting of shape parameter A. (b) Fitting of shape parameter B.

Figure 21.
Comparison of constitutive model with experimental results.


Table 1.
Mix proportion of modified polyurethane concrete.
| Composition | Particle Size D (mm) | Mass Fraction | Fineness Modulus | Apparent Density (kg/m3) |
|---|---|---|---|---|
| Coarse aggregate | 10 mm ≥ D > 4.75 mm | 29.6% | 3.4 | 2600 |
| Fine aggregate | D < 4.75 mm | 54.9% | 2.5 | 2580 |
| Modified polyurethane | / | 15.3% | / | / |
| admixture | / | 0.2% | / | / |
Table 2.
Strength values of the specimens.
| Experimental Project | Temperature | Average Value of Ultimate Capacity (kN) | Average Value of Ultimate Strength (MPa) | Standard Deviation | COV |
|---|---|---|---|---|---|
| Cubic compressive strength | 0 °C | 1791.47 | 79.62 | 2.58 | 0.03 |
| 15 °C | 1618.5 | 71.93 | 2.00 | 0.03 | |
| 40 °C | 966.87 | 42.97 | 3.09 | 0.07 | |
| 60 °C | 589.27 | 26.19 | 1.48 | 0.06 | |
| Split tensile strength | 0 °C | 280.07 | 7.93 | 1.10 | 0.14 |
| 15 °C | 251.1 | 7.11 | 0.41 | 0.06 | |
| 40 °C | 168.47 | 4.77 | 0.14 | 0.03 | |
| 60 °C | 94.2 | 2.67 | 0.14 | 0.05 | |
| Axial compressive strength | 0 °C | 1713.03 | 78.52 | 4.81 | 0.06 |
| 15 °C | 1324.6 | 58.87 | 0.63 | 0.01 | |
| 40 °C | 888.63 | 39.50 | 2.36 | 0.06 | |
| 60 °C | 470.47 | 20.91 | 0.60 | 0.03 |
Publisher’s Note: MDPI stays neutral with regard to jurisdictional claims in published maps and institutional affiliations. |
© 2022 by the authors. Licensee MDPI, Basel, Switzerland. This article is an open access article distributed under the terms and conditions of the Creative Commons Attribution (CC BY) license (https://creativecommons.org/licenses/by/4.0/).
Share and Cite
MDPI and ACS Style
Lei, J.; Feng, F.; Xu, S.; Wen, W.; He, X. Study on Mechanical Properties of Modified Polyurethane Concrete at Different Temperatures. Appl. Sci. 2022, 12, 3184. https://0-doi-org.brum.beds.ac.uk/10.3390/app12063184
AMA Style
Lei J, Feng F, Xu S, Wen W, He X. Study on Mechanical Properties of Modified Polyurethane Concrete at Different Temperatures. Applied Sciences. 2022; 12(6):3184. https://0-doi-org.brum.beds.ac.uk/10.3390/app12063184
Chicago/Turabian StyleLei, Jianhua, Fan Feng, Shu Xu, Weibin Wen, and Xuhui He. 2022. "Study on Mechanical Properties of Modified Polyurethane Concrete at Different Temperatures" Applied Sciences 12, no. 6: 3184. https://0-doi-org.brum.beds.ac.uk/10.3390/app12063184
Note that from the first issue of 2016, this journal uses article numbers instead of page numbers. See further details here.