
On the Reliability of CNNs in Clinical Practice: A Computer-Aided Diagnosis System Case Study


1
Department of Mathematics and Computer Science, University of Cagliari, Via Ospedale 72, 09124 Cagliari, Italy
2
Department of Electrical and Electronic Engineering, University of Cagliari, Piazza d’Armi, 09123 Cagliari, Italy
*
Authors to whom correspondence should be addressed.
Appl. Sci. 2022, 12(7), 3269; https://0-doi-org.brum.beds.ac.uk/10.3390/app12073269
Submission received: 14 February 2022
/
Revised: 17 March 2022
/
Accepted: 21 March 2022
/
Published: 23 March 2022
(This article belongs to the Special Issue Recent Advances in Biomedical Image Processing)
Abstract
:Leukocytes classification is essential to assess their number and status since they are the body’s first defence against infection and disease. Automation of the process can reduce the laborious manual process of review and diagnosis by operators and has been the subject of study for at least two decades. Most computer-aided systems exploit convolutional neural networks for classification purposes without any intermediate step to produce an accurate classification. This work explores the current limitations of deep learning-based methods applied to medical blood smear data. In particular, we consider leukocyte analysis oriented towards leukaemia prediction as a case study. In particular, we aim to demonstrate that a single classification step can undoubtedly lead to incorrect predictions or, worse, to correct predictions obtained with wrong indicators provided by the images. By generating new synthetic leukocyte data, it is possible to demonstrate that the inclusion of a fine-grained method, such as detection or segmentation, before classification is essential to allow the network to understand the adequate information on individual white blood cells correctly. The effectiveness of this study is thoroughly analysed and quantified through a series of experiments on a public data set of blood smears taken under a microscope. Experimental results show that residual networks perform statistically better in this scenario, even though they make correct predictions with incorrect information.
1. Introduction
The last decade has seen remarkable Deep Neural Network (DNN) advancements in dealing with large-scale and challenging machine learning problems. Among the commonly used DNNs, the Convolutional Neural Network (CNN) is the most used in the computer vision (CV) field due to its efficiency in image detection [1], segmentation [2,3], recognition and classification [4,5].
Their outstanding performance in many fields mainly causes the rise of CNNs. For example, several works adapted them to different tasks, from medical [6], to remote sensing [7], to surveillance [8] and also at different stages of processes that can range from pre-processing [9] to classification [10].
For these reasons and results, CNNs are considered state of the art for many tasks. This can be seen from the number of articles published in recent years that exploit CNNs, either pre-trained or fine-tuned for a specific task.
In fact, in the literature, there are more than 17,000 articles (source Scopus, accessed on 13 November 2021) for the keywords “neural AND networks AND ((fine AND tuning) OR (transfer AND learning))”. As can been from Figure 1, the first articles (less than one per year) starting from the end of the 1960s are related to the classical Artificial Neural Networks (ANNs), which undergo a substantial rise after the advent of CNNs and in particular with the appearance of the most famous architectures: AlexNet [4] and VGG Nets [5].
However, this outstanding success has also led to a “dangerous” trend. It is pretty common to choose CNNs to have a more outstanding guarantee of success in terms of performance and publication; manuscripts that exploit CNNs, even those with little novelty, are generally preferred and more cited than manuscripts using traditional methods.
In addition, the way of approaching CV tasks has changed radically. In fact, in many cases, authors immediately focus on a deep learning tool without even doing proper preliminary analysis and, worse, without doing a posthoc analysis to understand if the approach used is feasible to the task under consideration.
The dangerous tendency mentioned above refers to the superficiality that authors often have when approaching a task. For example, in the medical field, the outcome is crucial, but relying solely and totally on the potential of CNN without a proper analysis of the output results does not guarantee correctness. Conversely, for example, using class activation maps for visual explanation [11,12] would validate the method’s feasibility in clinical practice.
In addition, it appears that, when dealing with CNN, a typical preliminary analysis of the input data/images or pros and cons is often neglected, even if different limitations of CNNs have been observed [13,14,15,16]. One of such limitations is mainly related to the use of CNNs for image classification that requires fixed-size input images due to the inclusion of fully-connected layers [17]. This issue has commonly been addressed by simply resizing the images to match the CNN’s input size requirement (squared size, typically 227 × 227). This step is often underestimated and instead is very important if the analysis must focus on fine-grained details and should be approached with great caution with large and non-squared images. Indeed, with the resizing process, many details can be lost, and it could compromise the shapes of the objects.
This aspect also characterises the use case for peripheral blood smear (PBS) slide analysis we focus on in this work, which is very important for monitoring cell population and potential diseases. In particular, the size and morphology of the leukocytes can indicate the presence of several diseases, including severe ones such as leukaemia. For this reason, losing their detail in the resizing procedure could induce classification errors. Consequently, the primary purpose of this work is to explore the limitations of the leukaemia prediction systems entirely based on CNNs.
In order to provide a reliable and efficient approach that overcomes the disadvantages associated with manual inspection, several computer-aided diagnosis (CAD) systems have recently been proposed for this task [18,19,20]. Specifically, in recent works [21,22,23] the task of leukemic image classification has been addressed with success (e.g., Reference [21] achieved 100% accuracy), performing the image classification directly on the original images, without any image segregation process. However, despite the outstanding results, this approach seems too fragile for two main reasons. First of all, it was validated on a minimal data set. Secondly, the images used are not challenging and, above all, not representative of real application cases. Indeed, one might wonder, how did CNNs arrive at the final diagnosis? How could they behave with more complex images?
In order to assess the level of reliability of such a diagnosis, in this work, we investigated the performance of different CNN architectures on the classification of a specific type of leukaemia called acute lymphoblastic leukaemia (ALL), which is characterised by an overproduction of immature lymphocytes into the bloodstream.
We first repeat the experiments conducted by other authors in the literature [21,22,23] also using additional metrics and class activation maps for visual explanations [12]. Subsequently, we simulate a more realistic scenario using synthetic images created ad-hoc from the original healthy ones, adding several healthy leukocytes, to analyse the behaviour of CNNs when stressed on more complex images. Thus, the main contribution of this work is a detailed evaluation of the strengths and weaknesses of existing classification systems in order to provide valuable suggestions/guidelines for the creation of reliable CNN-based or, in general, CAD systems that can be employed in clinical practice. Therefore, this work does not aim to create a new image classification system that outperforms state-of-the-art methods.
The rest of the manuscript is organised as follows. Section 2 provides some preliminary knowledge on the analysis of PBS and discusses some state-of-the-art methods related to the classification of leukocytes. In Section 3 we present the used real data set, the creation of synthetic images, the used CNN architectures and the experimental setup. Section 4 presents and discusses the obtained results, and finally, in Section 5 we draw the findings and directions for future works.
2. Background and Related Works
This section describes the medical background related to the task at hand and the related works proposing CAD systems to address such a task.
2.1. Medical Background
Haematology and blood smear analysis fields have attracted the attention of researchers in the medical field over the years. In the context of PBS analysis supported by information technology tools, three main targets have been exploited [24]: malaria detection, leukaemia diagnosis and blood cells classification. The solutions proposed can vary according to the addressed task and considering that a PBS generally includes three main types of blood cells: thrombocytes, erythrocytes (RBC) and leukocytes (WBC). For example, from a medical point of view, the diagnosis of leukaemia requires one or more hematochemical analyses and correct history of the subject, with further confirmation by a bone marrow examination [25]. In general, there are four main groups of leukaemia: acute lymphoblastic leukaemia (ALL), acute myeloid leukaemia (AML), chronic lymphocytic leukaemia (CLL) and chronic myeloid leukaemia (CML), as well as some less common types [26]. Each type of leukaemia affects a different type of blood cells that, in all cases, are overproduced by the bone marrow and released into the peripheral circulation when still immature [26]. Although the diagnosis could be long and tedious depending on the stage, the identification could be made much more immediately. Referring to the object of this study, indeed, the National Cancer Institute (NCI) has outlined some criteria for identifying the ALL, including age, the presence of related diseases, and the white blood cell count (WBCC) [27]. Moreover, the World Health Organisation (WHO) considers morphology and other complementary tests and molecular biology essential for the integrated diagnosis of ALL [28]. For these reasons, timely and accurate identification and diagnosis are crucial for effective disease management [29].
As previously said in Section 1, this article discusses a particular case study involving leukocytes analysis geared toward predicting the type of leukaemia called acute lymphoblastic leukaemia. ALL is one of two leukaemias that affect lymphoid cells, which would develop into lymphocytes, and require in-depth analysis of blood leukocytes [30,31]. More specifically, it is characterised by the development, in the bone marrow, of large numbers of immature lymphocytes, called lymphoblasts. They are then released prematurely into the bloodstream [26].
2.2. Related Works
Several CAD systems have been proposed for the analysis of blood smear images to support either the disease identification as early as possible or to perform an automatic diagnosis. CAD systems for PBS image analysis typically consist of four main steps: image pre-processing, segmentation or detection, feature extraction and classification. Obviously not all the CAD systems exploit all the mentioned steps. This depends on the type of analysis performed and also on the type and quality of the used images. For example, the pre-processing step may not be necessary in most cases given that the images captured by new digital microscopes are of excellent quality. At the same time, methods devoted to cell counting do not need feature extraction and classification. Thus, the used pipelines are heavily influenced by the medical problem they deal with and the task they are designed for.
Furthermore, some steps may be repeated more times inside a single pipeline in order to address specific issues related to the images under investigation or to perform a hierarchical analysis. To give an example, multiple segmentation steps can be used or combined with detection steps to deal with adjacent or clustered cells [32,33,34]. In addition, multiple segmentation or multiple classification steps might be performed to identify cells and their sub-types or separate their components. As a general rule, the more fine-grained the analysis step to be performed, the greater the need for intermediate processing steps between the input data and the output results.
The visual difference between mature lymphocytes and lymphoblasts is very subtle, as shown in Figure 2b, and distinguishing them is very complex even for trained experts. The complexity of such a task was also highlighted by the recent C-NMC [35] challenge, where few authors achieved an F1-score value higher than 90%, even though the provided data set is extensive, with high-quality images presenting a single WBC centred and manually segmented.
Considering that typically a whole PBS contains a considerable number of leukocytes, the analysis has always been approached with methods involving at least two steps: one dedicated to leukocyte detection/segmentation [36,37] and one dedicated to leukocyte classification [20,38].
In some cases the first step has been simplified, dedicating it to the detection of all cell types [24,39,40,41] and leaving the separation into the various sub-types and lymphoblasts to the classification step.
On the other hand, other authors have simplified the classification step into just two types (leukocytes vs. lymphoblasts or even lymphocytes and lymphoblasts) by inserting intermediate steps for cataloguing WBC to improve the final accuracy [19,42].
However, several authors recently tried to avoid complex segmentation methods involving intense computations. In particular, they performed the classification task directly on the original images exploiting different CNN architectures [21,22,23]. The reported results are outstanding, achieving even 100% [21] accuracy on the well-known ALL-IDB1 data set (for more details on the data set, see Section 3.1). This approach takes advantage of the fact that ALL causes an overproduction of lymphoblasts in the PBS, which facilitates and influences the classification process.
Several important considerations should be made up to this point. First, we must remember that the CNN-based approach works with resolutions lower than pixels. Therefore, as previously introduced in Section 1, a considerable amount of information is lost. Second, distinguishing between mature lymphocytes and lymphoblasts at this resolution level is almost impossible. Third and consequently, a classification system based on the original images can at most predict the overproduction of leukocytes rather than leukaemia, considering that leukocytes are indistinguishable from the lymphoblasts. The overproduction of leukocytes in the PBS is a more common condition known as leukocytosis, which is not necessarily related to leukaemia but also to viral infections, stress, allergies and more.
Table 1 summarises the approaches presented in this section. In bold, we emphasise approaches based on direct whole-image classification. As can be seen, most of the work has focused on classifying WBC types and classifying leukaemia by processing single cell images.
On the other hand, works in [21,22,23,42] have addressed leukaemia classification with whole-image classification-based approaches. They are emphasized in bold in the table. The first three directly classify the image as leukemic or not, while the latter exploited a hybrid approach based on a fine-tuning strategy performed on a combination of images from different data sets.
As previously introduced (see Section 2.1, leukaemia affecting lymphoid cells, such as ALL, require in-depth analysis of lymphocytes to provide a reliable prediction.
In particular, the approach proposed by Vogado et al. [23] seemed promising in this regard. Indeed, the authors showed the results of their methods on crops of the original images containing different lymphoblasts. However, again, it must be said that this classification can at best predict a leukocytosis condition as ALL needs fine-grained analysis on leukocyte [26,30,31,43,44]. In other words: correctly predicting the image label, in this case, does not mean you have correctly identified leukaemia.
3. Experimental Setup
This section describes the materials and methods used to perform the investigation mentioned above by first illustrating the used real and synthetic data sets and then the CNNs architectures and the experimental setup.
3.1. Materials
We used the Acute Lymphoblastic Leukaemia Image Database (ALL-IDB) [45], proposed for ALL detection. It is a well-known benchmark data set regarding leukemic image analysis.
3.1.1. Data Set
The ALL-IDB comprises images belonging to healthy individuals and patients affected by ALL. The PBSs were collected at the M. Tettamanti Research Centre for Childhood Leukaemia and Haematological Diseases, Monza, Italy. The images were digitised with a single light laboratory microscope but coupled with two different digital cameras: an Olympus Optical C2500L and a Canon PowerShot G5. This acquisition leads to different variations in colour and brightness. Furthermore, different magnification levels, ranging from 300 to 500, were used during the acquisition process, introducing further challenges due to differences in scale and cell sizes. The data set consists of two versions named ALL-IDB1 and ALL-IDB2. The former contains the original images in JPG format with 24-bit colour depth. It is also the most challenging version since the contained images present a variable number of cells and different clusters. The number of PBS images in this version is 108, labelled by experts as 59 healthy and 49 ALL cases. ALL-IDB2 version instead is a collection of single WBC extracted from the previous version. It contains 260 images, and each has a single centred leukocyte, 50% of which are lymphoblasts. Since we were interested in emphasising direct image-based approaches for leukaemia classification, in this work, we used the ALL-IDB1 version for the CNN training and testing process. In contrast, we used the ALL-IDB2 version to create synthetic images that reproduced the cell number and distribution of leukemic PBS but without lymphoblasts. For this purpose, we exploited the pixel-wise ground truth in the form of a binary mask for ALL-IDB2 provided here (ALL-IDB2 masks, accessed on 13 November 2021), in order to extract the foreground that contained the WBC only.
3.1.2. Synthetic Images
As previously mentioned, the main goal of this work was to evaluate the effectiveness of the direct image classification approach proposed by other authors, which in our opinion was too sensitive to the coarse-grained details, such as the number and distribution of leukocytes, rather than to fine-grained details such as cell textures and shapes. To this aim, for each original ALL-IDB image belonging to the healthy class, we created different synthetic versions, adding other healthy leukocytes belonging to ALL-IDB2. Several approaches have been proposed for creating synthetic images, and most of them are based on DNN and, in particular, on Generative Adversarial Networks (GANs) [46,47]. Despite the great success of GANs, they do not have an encoder, which makes them difficult to train, and at the same time, it is not easy to force their equivalence to the desired factors. This means that one cannot have complete control over the type and features of images they produce as output. Instead, we aimed to produce images with specific features to be used as an additional testing set. For this reason, we used a relatively simple approach for image synthesis based on cut and paste, also called a “smart augmentation” process [46]. Firstly, we built a GUI that allowed us to select the locations where the synthetic leukocytes could be placed inside the original ALL-IDB1 images. In order to create the synthetic images without visually altering the original cells, we manually selected the plasma regions (where no cells were present) of appropriate sizes as candidate positions for placing the cells. Thus, the final number of cells artificially added to the original image was strictly related to the nature of the image itself; the higher the number of appropriate plasma regions, the higher the number of added cells. In addition, a bounding box (BB) was drawn for each candidate position (see Figure 3a) in order to define the size of the cell that it could accommodate. Then, given that our aim was to create synthetic images with leukocytosis but without leukaemia, we selected and computed the size of all the healthy cells in ALL-IDB2, from now on called candidate WBC. Then, to create a synthetic image from an original one, we performed the following steps to add a single WBC for each candidate position:
- We selected the ith candidate position and its relative bounding box;
- We filtered the candidate WBC by preserving the ones whose sizes are ≤ the bounding box size;
- We randomly extracted a single WBC among the filtered WBC;
- We transformed the selected WBC with random rotations (multiples of 90 degrees), horizontal and vertical flipping (note that the size and appearance of the WBC remain unaltered);
- We placed the WBC in the candidate position by simply replacing the original image content with the foreground region of the binary mask;
- We applied an average filter of size 3 × 3 along the new WBC borders to better blend it into the original image.
Figure 3.
Example of synthetic image creation process. (a) Original ALL-IDB1 images and the BB manually selected as candidate positions for applying other leukocytes. (b) Synthetic image was created by exploiting the previous BB and the healthy WBC belonging to ALL-IDB2.
Figure 3.
Example of synthetic image creation process. (a) Original ALL-IDB1 images and the BB manually selected as candidate positions for applying other leukocytes. (b) Synthetic image was created by exploiting the previous BB and the healthy WBC belonging to ALL-IDB2.

The final results of such an additive process are shown in Figure 3b, where the final number of added WBC is 39.
3.2. Methods
In order to repeat the experiments conducted by other authors in the literature [21,22,23] for direct PBS image classification, several CNN architectures were used. They can be mainly categorised into plain, residual, inception and lightweight networks. Plain networks are very simple since they present just direct connections and are also the earliest CNN architectures. The employed CNNs belonging to this category are AlexNet [4], the VGG-16 and the VGG-19 [5]. They are very similar and differ mostly in the number of layers, 8, 16 and 19, respectively. Residual networks are typically much deeper, but being based on residual learning, they are easier to optimise [48]. We employed ResNet-18, ResNet-50 and ResNet-101, which present 18, 50 and 101 layers, respectively. Inception networks are those based on the inception layer. We employed GoogLeNet [49] and Inception-v3 [50], which differ in the number of layers, 100 and 140 for GoogLeNet and Inception-V3, respectively, but also because the latter exploits a few additional layer types. Lightweight networks are lighter networks specifically designed for mobile devices with minimal computing power and real-time executions. We employed ShuffleNet [51] and MobileNet-v2 [52], which present 50 and 28 layers, respectively. The CNNs were all pre-trained on a well-known natural image data set (ImageNet [53]). Thus, they could not be directly used for classification, but they had to be adapted, by transfer learning, for the new classification problem. Here it was done following an established procedure [54] that consisted of preserving all the pre-trained CNN layers and replacing the final one to match the number of classes of the new classification task.
3.3. Setup
In order to reproduce the same experiments reported in the literature by [21,22,23], we split the ALL-IDB1 data set into three parts, namely the training, validation and testing set, with 70%, 20% and 10% of images, respectively. In order to favour reproducibility and preserve the same partitions for all the experiments that we carried out, the images were selected in lexicographic order. In addition, we used a stratified sampling procedure to keep the splits almost balanced. In this way the testing set presented 5 and 6 healthy and ALL images, respectively. Finally, the images are resized to match the input size requirements of the CNNs. The training process was run using the ADAM solver for 50 epochs, with a starting learning rate of and learn rate decay of every 10 epochs. During training we used the cross entropy loss function and the best model for evaluation was chosen based on the lowest validation loss value (the minimum observed values were between and ).
Since the number of training images was limited and no image augmentation procedures were used, in order to avoid over-fitting, the regularisation factor L2 was set to . All the experiments were conducted on the same machine that presented the following configuration: Intel(R) Core(TM) i9-8950HK @ 2.90 GHz CPU with 32 GB RAM and NVIDIA GTX1050 Ti 4 GB GPU. Finally, the classification performance was evaluated by using five common metrics, Accuracy (A), Precision (P), Recall (R), Specificity (S) and F1-score (F1), which are computed as follows:
where (True Positive) indicates the number of images correctly classified as positives, (False Positive) provides the number of negative images wrongly classified as positives, (True Negative) indicates the number of images correctly classified as negatives and (False Negative) gives the number of positive images wrongly classified as negatives. Furthermore, to provide a visual explanation for the decisions made by the CNN-based models, making them more transparent, we used the Gradient-weighted Class Activation Mapping (Grad-CAM) algorithm [12]. This produced a coarse localisation map that highlighted the important regions in the image used for predicting a specific concept.
4. Experimental Results
We first evaluated the classification performance of the investigated CNNs on the original test set obtained from ALL-IDB1 and then on the synthetic images produced by us.
4.1. Evaluation on Real Images
Table 2 reports the results obtained when testing on real images and, as it can be observed, all the tested networks reported 100% performance in every calculated metric, apart from AlexNet that reached only 72.73% of accuracy. Considering the excellent classification results obtained by the networks without any explicit information on the WBC, we further investigated which features led to such results. Consequently, we computed and represented the related activation through the Grad-CAM algorithm. In particular, we reported examples of activation calculated on all the test set images. For the sake of brevity, we reported the activation maps for the ResNet-50 only, which achieved the best results in the previous test.
Remembering that, from a clinical point of view, the correct prediction of ALL is strongly influenced by the condition of leukocytes [29], we expect that CNNs also exploit such indicators to perform the predictions. Thus, we use the healthy features of WBC to predict the healthy case and those of lymphoblasts for the ALL case. As can be seen in Figure 4, the explanations for the healthy class could be considered correct. Indeed, even if the activation areas are much bigger than the WBC areas and the WBC are not centred in the maximum activation values, this could be considered an expected behaviour for the correct classification of healthy leukocytes and the correct status grading. However, Figure 5 reports several issues on the ALL images. Specifically, let us consider the three images composed of two WBC. Figure 5a–c depict how ResNet-50 considers only one WBC in the first one and completely ignores both WBC in the remaining two. Moreover, it gives much more importance to the RBC that are not meaningful in the leukaemia diagnosis. Moreover, the situation in Figure 5d,e is even more critical because the network tends to consider only a small portion of the WBC included in the images, ignoring the majority of them.
These critical classification issues lead us to further investigations. In particular, at first glance, it seems that the networks tend to consider the WBC as meaningful only when they are alone, as represented in the healthy images in Figure 4. On the other hand, the WBC are almost ignored when the networks classify the ALL class. This situation leads to the correct classification results, as demonstrated in Table 2. However, it is not acceptable if we want to use such a system in a real environment, where the number of classes is not limited to two (healthy and not healthy).
4.2. Evaluation on Synthetic Images
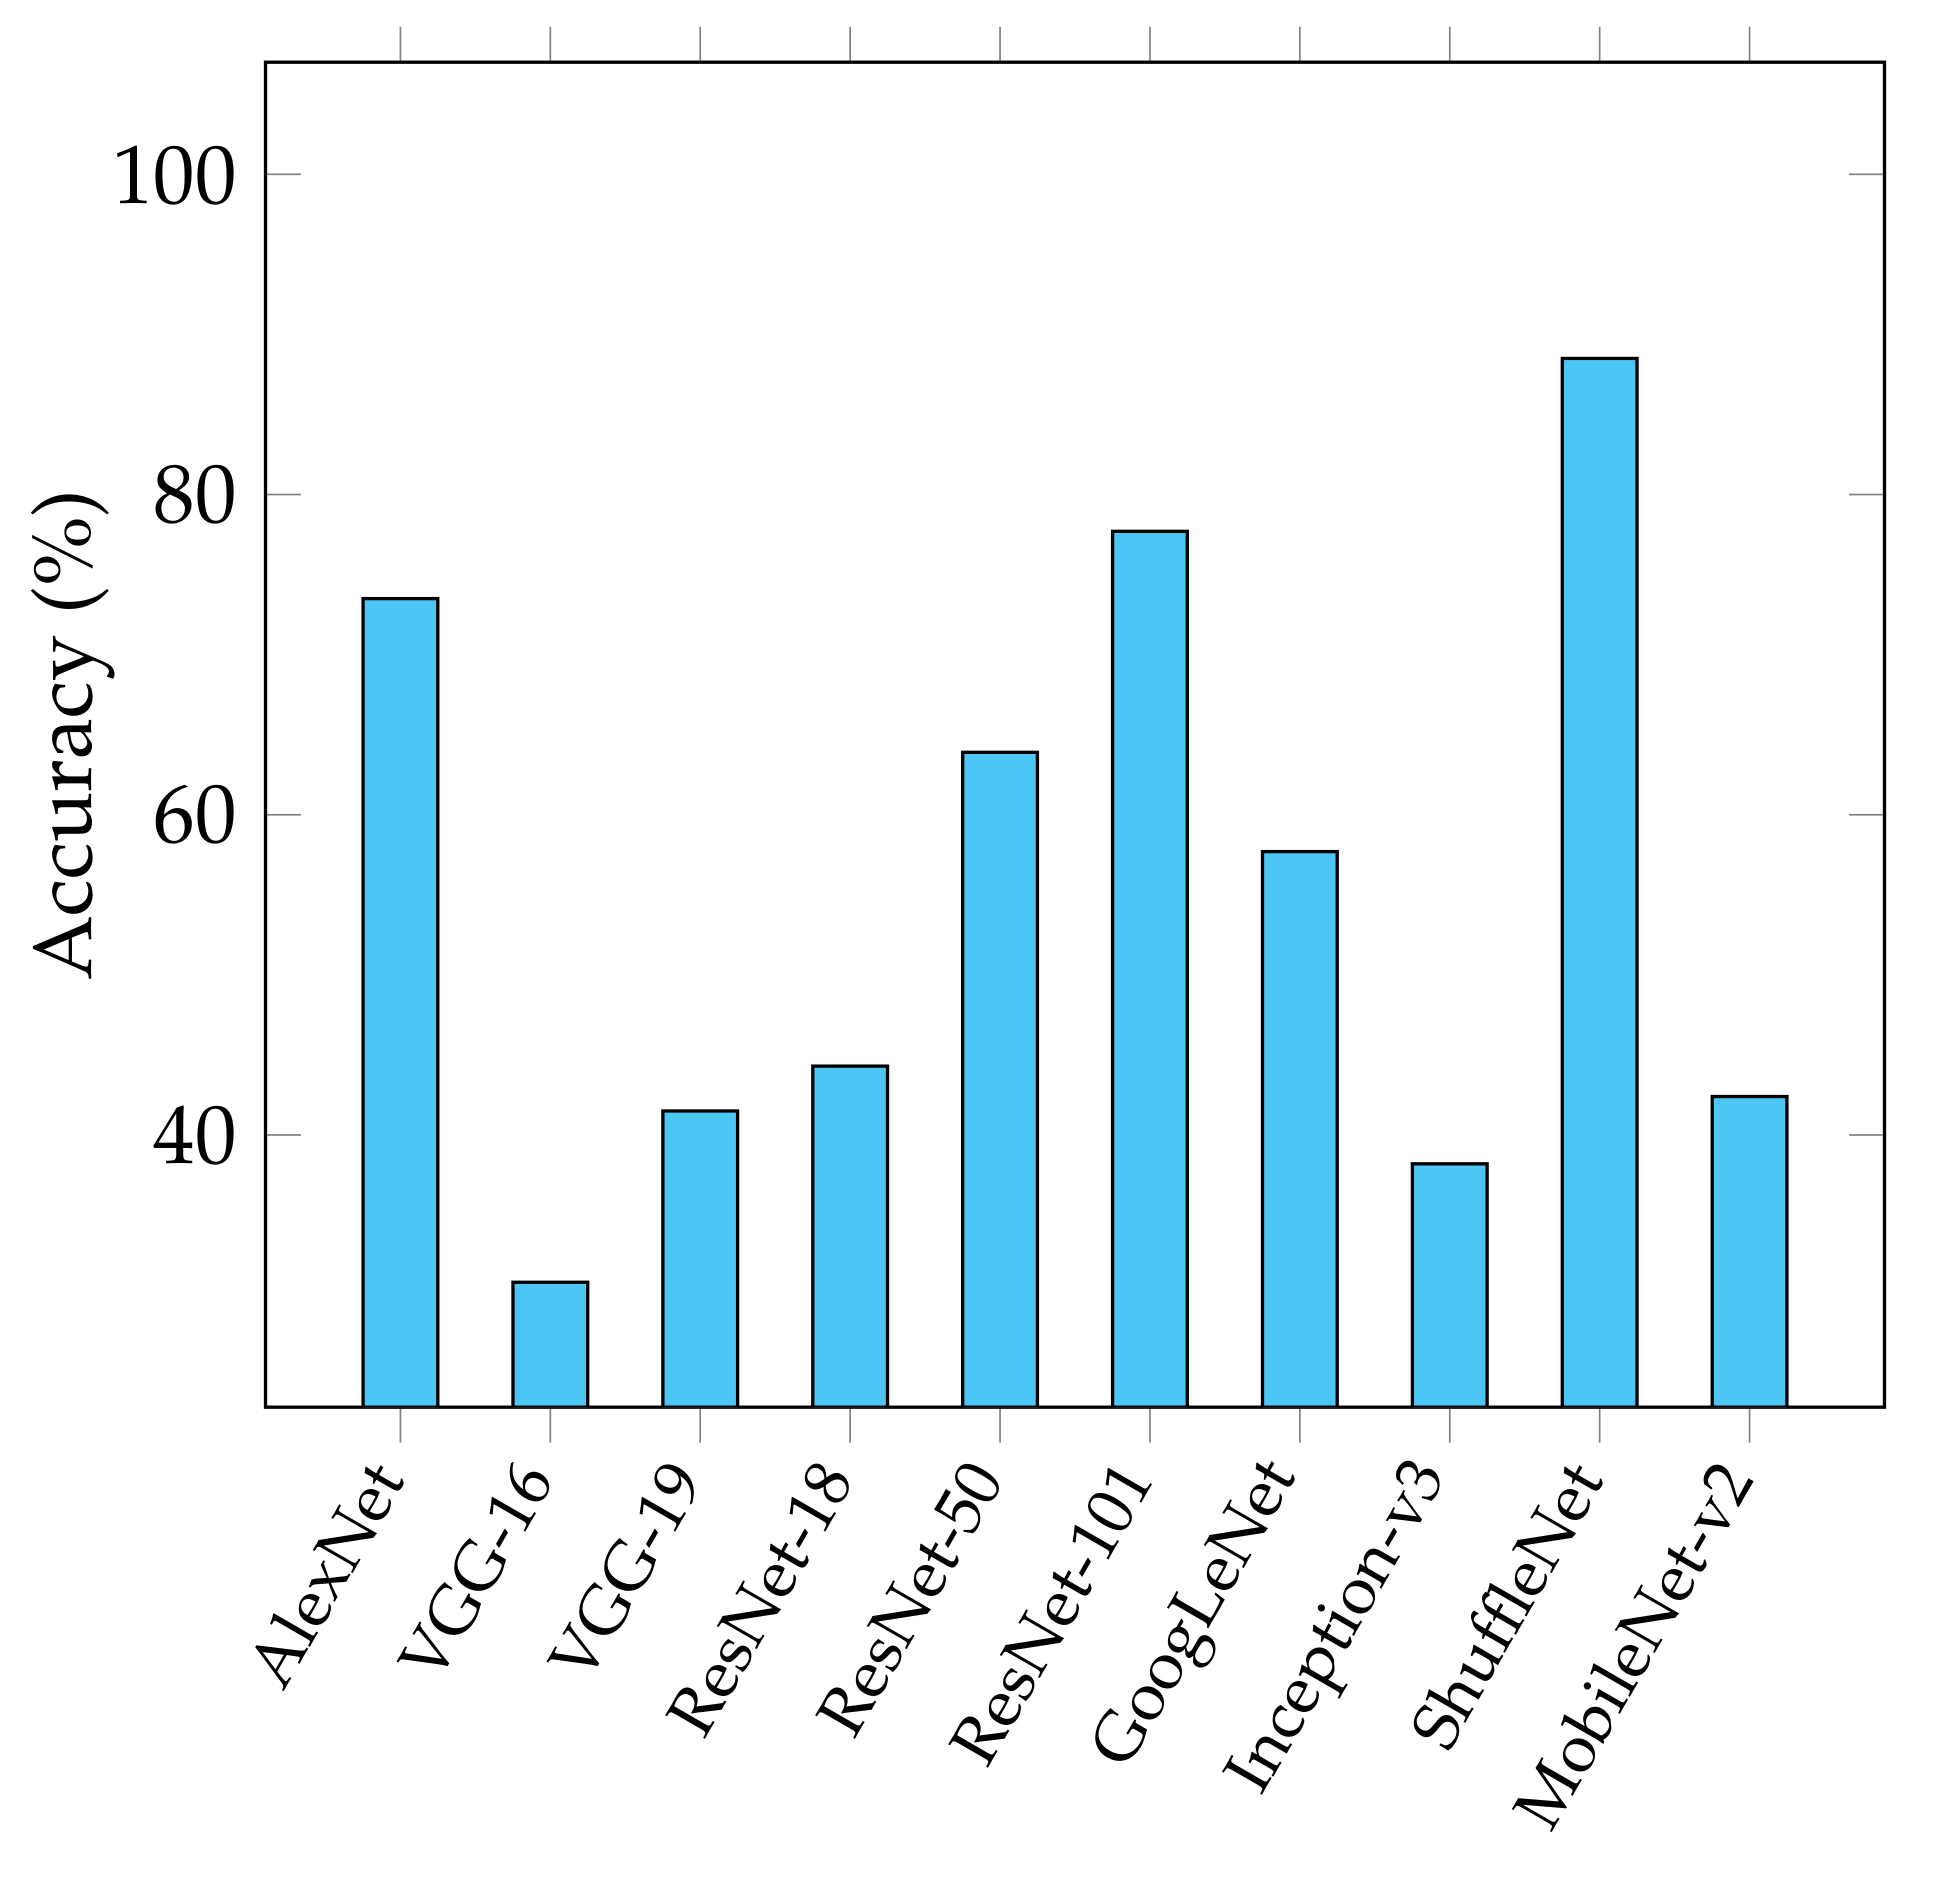
To better investigate the reasons that brought the CNN to produce such results, we developed a data set of synthetic images, as reported in Section 3.1.2, by adding healthy WBC to the original healthy ALL-IDB1 test images (six samples) in all the candidate positions. It must be noted that in this case, the number of cells added is different for each image. This data set is used as an additional testing set for the CNN models fine-tuned with the original ALL-IDB1 training set images. The results of such test are reported in Figure 6 and, as it can be observed, the performance degrades for all the tested CNN architectures.
In order to understand under what circumstances the networks start to misclassify, we performed an in-depth investigation by selecting a portion of the previous synthetic data set, where the maximum number of added cells is 20. This value was chosen based on the limit of the image with the lowest number of candidate positions. Then we split this synthetic data set into 20 sub-sets, each one containing the synthetic images presenting the same number of images but with an increasing number of added WBC. That is to say: imgSynt1 contains images with one additional WBC, imgSynt2 contains images with two additional WBC, until the last one, imgSynt20 which contains 20 additional WBC. This experiment aims to verify if progressively adding healthy WBC to the original test images can affect the CNNs’ predictive ability.
This trend is completely confirmed for the majority of the networks exploited. As reported in Figure 7, three networks start to misclassify quite early, breaking the 100% results obtained on the original test sets. Indeed, VGG-16 and VGG-19 reached 63.6% and 78.8% accuracy after five additions, as indicated by the magenta line. GoogLeNet followed the same scheme starting from eight additions, while MobileNet-v2 from ten and Inception-v3 from fourteen. Finally, ShuffleNet performance began to degrade from the seventeenth addition. In this scenario, the only networks not affected by degradation are the residual networks ResNet-50 and ResNet-101, showing strong robustness based on the obtained accuracy. In Figure 8, we reported the activations computed on the synthetic images in order to analyse the behaviour on the same images when varying the number of cells. For the sake of brevity, we reported the activation maps for the ResNet-50 only and for the imgSynt10, imgSynt15, and imgSynt20.
Even in this case, the CNNs do not give relevance to the features of WBC, but the classification score is entirely based on features that are not generally useful to predict the presence of leukaemia from blood images. In particular, it can be noted that the activations change with the addition of more WBC, although the changes are not linked to the number but mostly the position of the new cells.
4.3. Discussion
The obtained results emphasise that the approaches based on direct whole image classification are not applicable in clinical practice. Indeed, we demonstrated how CNNs behave with more complex images, also answering the questions above. This was done by varying the number of cells in the image, so we did not even have to insert additional pathologies and change the problem from binary to multi-class. So what is expected is that by adding additional complexities present in daily laboratory testing, the failures may be even greater. Instead, it is not easy to determine why the CNNs could provide correct results in real test images, especially because the activation maps do not seem to focus on precise indicators for all images. In fact, it is very likely that in binary problems like this one, the CNNs manage to find very different indicators from those actually used by pathologists to provide the diagnosis but which would prove unusable in real cases.
Certainly, our analysis presents some limitations since it has been performed on a single use case and on a single data set, but it can provide valuable suggestions/guidelines for the creation of reliable CNN-based CAD systems that can be employed in clinical practice. In particular, when dealing with CNN, a preliminary analysis of the input data/images must always be performed. In particular, CNNs for image classification require fixed-size input images due to the inclusion of fully-connected layers [17], and if the input data are not processed correctly, they can be significantly altered (e.g., the cells or tissue form factor and size) or some important details can be lost (e.g., the presence of vacuoles or nucleolus).
A further preliminary analysis must be performed for the task at hand, both depending on the type of analysis performed and the type and quality of the used images, to design an appropriate pipeline to handle all the encountered issues. In particular, for the considered case study, which could be considered a fine-grained task, a preliminary detection or segmentation step, before classification, is essential to allow the network to understand the adequate information on individual WBC correctly. More generally, the more fine-grained the analysis step to be performed, the greater the need for intermediate processing steps between the input data and the output results.
5. Conclusions
In this work, we investigated direct image classification methods based on CNNs. Such methods exploit whole images, without intermediate steps, to classify or predict the subject depicted in the target images. In the case study, the target images show peripheral blood images of healthy or leukaemia patients; thus, the outcome is crucial. The performed analysis demonstrated that this case study is completely dependent on the correct induction of the most appropriate features related to leukaemia detection and evaluation for proper classification. The synthetic test sets produced in this work emphasised how the CNNs fail entirely in the correct individuation of the most suitable feature for leukaemia prediction. Consequently, it is not possible to totally rely on the potential of CNN without a proper analysis; in the case study and, we believe, in many other cases, the intermediate step of the analysis process is fundamental to reduce uncertainty and improve accuracy. Even if performed on a single use case and a single data set, we provided valuable suggestions/guidelines for creating reliable CNN-based CAD systems that can be employed in clinical practice. A further improvement for this specific use case could be analysing synthetic images created by adding specific WBC sub-types and even lymphoblasts to extract a more visual explanation of the CNNs’ response.
Author Contributions
Conceptualisation, A.L. and L.P.; Methodology, A.L. and L.P.; Investigation, A.L. and L.P.; software, A.L. and L.P.; writing—original draft, A.L. and L.P.; writing—review and editing, A.L. and L.P. All authors have read and agreed to the published version of the manuscript.
Funding
This research received no external funding.
Institutional Review Board Statement
Not applicable.
Informed Consent Statement
Not applicable.
Data Availability Statement
The segmented masks of ALL-IDB used in this work are available at the following GitHub repository. Every evaluated image, with its related gradCAM computation is available at the following GitHub repository.
Conflicts of Interest
The authors declare no conflict of interest.
Abbreviations
The following abbreviations are used in this manuscript:
| PBS | Peripheral Blood Smear |
| RBC | Red Blood Cells |
| WBC | White Blood Cells |
| ALL | Acute Lymphoblastic Leukaemia |
| AML | Acute Myeloid Leukaemia |
| CLL | Chronic Lymphocytic Leukaemia |
| CML | Chronic Myeloid Leukaemia |
| CAD | Computer-Aided Diagnosis |
| ALL-IDB | Acute Lymphoblastic Leukaemia Image Database |
| BB | Bounding Boxes |
| CNN | Convolutional Neural Network |
| TP | True Positive |
| TN | True Negative |
| FN | False Negative |
| FP | False Positive |
| A | Accuracy |
| P | Precision |
| R | Recall |
| S | Specificity |
| F1 | F1-score |
References
- Zhao, Z.; Zheng, P.; Xu, S.; Wu, X. Object Detection with Deep Learning: A Review. IEEE Trans. Neural Netw. Learn. Syst. 2019, 30, 3212–3232. [Google Scholar] [CrossRef] [PubMed] [Green Version]
- Chen, L.C.; Papandreou, G.; Kokkinos, I.; Murphy, K.; Yuille, A.L. Deeplab: Semantic image segmentation with deep convolutional nets, atrous convolution, and fully connected crfs. IEEE Trans. Pattern Anal. Mach. Intell. 2017, 40, 834–848. [Google Scholar] [CrossRef] [PubMed] [Green Version]
- Ronneberger, O.; Fischer, P.; Brox, T. U-net: Convolutional networks for biomedical image segmentation. In Proceedings of the International Conference on Medical Image Computing and Computer-Assisted Intervention, Munich, Germany, 5–9 October 2015; pp. 234–241. [Google Scholar]
- Krizhevsky, A.; Sutskever, I.; Hinton, G.E. ImageNet Classification with Deep Convolutional Neural Networks. In Proceedings of the 25th International Conference on Neural Information Processing Systems-NIPS’12, Lake Tahoe, NV, USA, 3–6 December 2012; Volume 1, pp. 1097–1105. [Google Scholar]
- Simonyan, K.; Zisserman, A. Very Deep Convolutional Networks for Large-Scale Image Recognition. In Proceedings of the 3rd International Conference on Learning Representations, ICLR 2015, San Diego, CA, USA, 7–9 May 2015. [Google Scholar]
- Litjens, G.; Kooi, T.; Bejnordi, B.E.; Setio, A.A.A.; Ciompi, F.; Ghafoorian, M.; Van Der Laak, J.A.; Van Ginneken, B.; Sánchez, C.I. A survey on deep learning in medical image analysis. Med Image Anal. 2017, 42, 60–88. [Google Scholar] [CrossRef] [PubMed] [Green Version]
- Wang, Y.; Zhang, W.; Gao, R.; Jin, Z.; Wang, X. Recent advances in the application of deep learning methods to forestry. Wood Sci. Technol. 2021, 55, 1171–1202. [Google Scholar] [CrossRef]
- Sindagi, V.A.; Patel, V.M. A survey of recent advances in CNN-based single image crowd counting and density estimation. Pattern Recognit. Lett. 2018, 107, 3–16. [Google Scholar] [CrossRef] [Green Version]
- Mishra, D.; Chaudhury, S.; Sarkar, M.; Soin, A.S. Ultrasound image enhancement using structure oriented adversarial network. IEEE Signal Process. Lett. 2018, 25, 1349–1353. [Google Scholar] [CrossRef]
- Qin, F.; Gao, N.; Peng, Y.; Wu, Z.; Shen, S.; Grudtsin, A. Fine-grained leukocyte classification with deep residual learning for microscopic images. Comput. Methods Programs Biomed. 2018, 162, 243–252. [Google Scholar] [CrossRef]
- Zhou, B.; Khosla, A.; Lapedriza, À.; Oliva, A.; Torralba, A. Learning Deep Features for Discriminative Localization. In Proceedings of the 2016 IEEE Conference on Computer Vision and Pattern Recognition, CVPR 2016, Las Vegas, NV, USA, 27–30 June 2016; pp. 2921–2929. [Google Scholar]
- Selvaraju, R.R.; Cogswell, M.; Das, A.; Vedantam, R.; Parikh, D.; Batra, D. Grad-CAM: Visual Explanations from Deep Networks via Gradient-Based Localization. In Proceedings of the IEEE International Conference on Computer Vision, ICCV 2017, Venice, Italy, 22–29 October 2017; pp. 618–626. [Google Scholar]
- Zheng, Y.; Huang, J.; Chen, T.; Ou, Y.; Zhou, W. Transfer of Learning in the Convolutional Neural Networks on Classifying Geometric Shapes Based on Local or Global Invariants. Front. Comput. Neurosci. 2021, 15, 1–13. [Google Scholar] [CrossRef]
- Ward, C.M.; Harguess, J.; Crabb, B.; Parameswaran, S. Image quality assessment for determining efficacy and limitations of Super-Resolution Convolutional Neural Network (SRCNN). In Applications of Digital Image Processing XL; International Society for Optics and Photonics: San Diego, CA, USA, 2017; Volume 10396, p. 1039605. [Google Scholar]
- Biesseck, B.J.G.; Junior, E.R.A.; Nascimento, E.R. Exploring the Limitations of the Convolutional Neural Networks on Binary Tests Selection for Local Features. In Proceedings of the 14th International Joint Conference on Computer Vision, Imaging and Computer Graphics Theory and Applications, VISIGRAPP 2019, Volume 4: VISAPP, Prague, Czech Republic, 25–27 February 2019; Trémeau, A., Farinella, G.M., Braz, J., Eds.; pp. 261–271. [Google Scholar]
- Xu, Y.; Vaziri-Pashkam, M. Limits to visual representational correspondence between convolutional neural networks and the human brain. Nat. Commun. 2021, 12, 1–16. [Google Scholar] [CrossRef]
- Sabottke, C.F.; Spieler, B.M. The Effect of Image Resolution on Deep Learning in Radiography. Radiol. Artif. Intell. 2020, 2, e190015. [Google Scholar] [CrossRef]
- Genovese, A.; Hosseini, M.S.; Piuri, V.; Plataniotis, K.N.; Scotti, F. Acute lymphoblastic leukemia detection based on adaptive unsharpening and deep learning. In Proceedings of the ICASSP, IEEE International Conference on Acoustics, Speech and Signal Processings, Toronto, ON, Canada, 6–11 June 2021; pp. 1205–1209. [Google Scholar] [CrossRef]
- Matek, C.; Schwarz, S.; Spiekermann, K.; Marr, C. Human-level recognition of blast cells in acute myeloid leukaemia with convolutional neural networks. Nat. Mach. Intell. 2019, 1, 538–544. [Google Scholar] [CrossRef]
- Khandekar, R.; Shastry, P.; Jaishankar, S.; Faust, O.; Sampathila, N. Automated blast cell detection for Acute Lymphoblastic Leukemia diagnosis. Biomed. Signal Process. Control 2021, 68, 102690. [Google Scholar] [CrossRef]
- Anilkumar, K.; Manoj, V.; Sagi, T. Automated detection of Leukemia by Pretrained Deep Neural Networks and Transfer Learning: A comparison. Med. Eng. Phys. 2021, 98, 8–19. [Google Scholar] [CrossRef] [PubMed]
- Das, P.; Meher, S. An efficient deep Convolutional Neural Network based detection and classification of Acute Lymphoblastic Leukemia. Expert Syst. Appl. 2021, 183, 115311. [Google Scholar] [CrossRef]
- Vogado, L.; Veras, R.; Aires, K.; Araújo, F.; Silva, R.; Ponti, M.; Tavares, J. Diagnosis of leukaemia in blood slides based on a fine-tuned and highly generalisable deep learning model. Sensors 2021, 21, 2989. [Google Scholar] [CrossRef] [PubMed]
- Al-qudah, R.; Suen, C.Y. Improving blood cells classification in peripheral blood smears using enhanced incremental training. Comput. Biol. Med. 2021, 131, 104265. [Google Scholar] [CrossRef]
- Kalbani, N.A.; Weitzman, S.; Abdelhaleem, M.; Carcao, M.; Abla, O. Acute lymphoblastic leukemia presenting with gross hematuria. Paediatr. Child Health 2007, 12, 573–574. [Google Scholar] [CrossRef] [Green Version]
- National Cancer Institute. Leukemia. 2021. Available online: https://www.cancer.gov/types/leukemia/hp (accessed on 11 June 2021).
- Smith, M.; Arthur, D.; Camitta, B.; Carroll, A.J.; Crist, W.; Gaynon, P.; Gelber, R.; Heerema, N.; Korn, E.L.; Link, M.; et al. Uniform approach to risk classification and treatment assignment for children with acute lymphoblastic leukemia. J. Clin. Oncol. 1996, 14, 18–24. [Google Scholar] [CrossRef]
- Merino, A.; Boldú, L.; Ermens, A. Acute myeloid leukaemia: How to combine multiple tools. Int. J. Lab. Hematol. 2018, 40, 109–119. [Google Scholar] [CrossRef] [Green Version]
- Miranda-Filho, A.; Piñeros, M.; Ferlay, J.; Soerjomataram, I.; Monnereau, A.; Bray, F. Epidemiological patterns of leukaemia in 184 countries: A population-based study. Lancet Haematol. 2018, 5, e14–e24. [Google Scholar] [CrossRef]
- Medicine, Y. Diagnosing Leukemia. Available online: https://www.yalemedicine.org/conditions/leukemia-diagnosis (accessed on 1 March 2022).
- National Cancer Institute. Adult Acute Lymphoblastic Leukemia Treatment. Available online: https://www.cancer.gov/types/leukemia/patient/adult-all-treatment-pdq (accessed on 1 March 2022).
- Alomari, Y.M.; Sheikh Abdullah, S.N.H.; Zaharatul Azma, R.; Omar, K. Automatic detection and quantification of WBCs and RBCs using iterative structured circle detection algorithm. Comput. Math. Methods Med. 2014, 2014, 1–17. [Google Scholar] [CrossRef] [Green Version]
- Ruberto, C.D.; Loddo, A.; Putzu, L. A leucocytes count system from blood smear images Segmentation and counting of white blood cells based on learning by sampling. Mach. Vis. Appl. 2016, 27, 1151–1160. [Google Scholar] [CrossRef]
- Mahmood, N.H.; Lim, P.C.; Mazalan, S.M.; Razak, M.A.A. Blood cells extraction using color based segmentation technique. Int. J. Life Sci. Biotechnol. Pharma Res. 2013, 2, 2250–3137. [Google Scholar]
- Gupta, A.; Gupta, R. ISBI 2019 C-NMC Challenge: Classification in Cancer Cell Imaging; Springer Nature: Singapore, 2019. [Google Scholar]
- Ruberto, C.D.; Loddo, A.; Putzu, L. Detection of red and white blood cells from microscopic blood images using a region proposal approach. Comput. Biol. Med. 2020, 116, 103530. [Google Scholar] [CrossRef] [PubMed]
- Shafique, S.; Tehsin, S. Acute Lymphoblastic Leukemia Detection and Classification of Its Subtypes Using Pretrained Deep Convolutional Neural Networks. Technol. Cancer Res. Treat. 2018, 17, 1533033818802789. [Google Scholar] [CrossRef] [PubMed] [Green Version]
- Semerjian, S.; Khong, Y.F.; Mirzaei, S. White Blood Cells Classification Using Built-in Customizable Trained Convolutional Neural Network. In Proceedings of the 2021 International Conference on Emerging Smart Computing and Informatics (ESCI), Pune, India, 5–7 March 2021; pp. 357–362. [Google Scholar]
- Huang, P.; Wang, J.; Zhang, J.; Shen, Y.; Liu, C.; Song, W.; Wu, S.; Zuo, Y.; Lu, Z.; Li, D. Attention-Aware Residual Network Based Manifold Learning for White Blood Cells Classification. IEEE J. Biomed. Health Inf. 2020, 25, 1206–1214. [Google Scholar] [CrossRef]
- Toğaçar, M.; Ergen, B.; Cömert, Z. Classification of white blood cells using deep features obtained from Convolutional Neural Network models based on the combination of feature selection methods. Appl. Soft Comput. J. 2020, 97, 106810. [Google Scholar] [CrossRef]
- Yao, X.; Sun, K.; Bu, X.; Zhao, C.; Jin, Y. Classification of white blood cells using weighted optimized deformable convolutional neural networks. Artif. Cells Nanomed. Biotechnol. 2021, 49, 147–155. [Google Scholar] [CrossRef]
- Thanh, T.T.P.; Pham, G.N.; Park, J.H.; Moon, K.S.; Lee, S.H.; Kwon, K.R. Acute leukemia classification using convolution neural network in clinical decision support system. CS IT Conf. Proc. 2017, 7, 49–53. [Google Scholar]
- Cancer Treatment Centers of America. Types of Leukemia. 2021. Available online: https://www.cancercenter.com/cancer-types/leukemia/types (accessed on 11 June 2021).
- Institute, N.C. Childhood Acute Lymphoblastic Leukemia Treatment. Available online: https://www.cancer.gov/types/leukemia/patient/child-all-treatment-pdq (accessed on 16 November 2021).
- Labati, R.D.; Piuri, V.; Scotti, F. All-IDB: The acute lymphoblastic leukemia image database for image processing. In Proceedings of the IEEE ICIP International Conference on Image Processing, Brussels, Belgium, 11–14 September 2011; pp. 2045–2048. [Google Scholar]
- Nikolenko, S. Synthetic Data for Deep Learning; Springer International Publishing AG: New York, NY, USA, 2021; Volume 174. [Google Scholar]
- Meharban, M.; Sabu, M.; Krishnan, S. Introduction to Medical Image Synthesis Using Deep Learning:A Review. In Proceedings of the 2021 7th International Conference on Advanced Computing and Communication Systems, ICACCS 2021, Coimbatore, India, 19–20 March 2021; pp. 414–419. [Google Scholar] [CrossRef]
- He, K.; Zhang, X.; Ren, S.; Sun, J. Deep Residual Learning for Image Recognition. In Proceedings of the 2016 IEEE Conference on Computer Vision and Pattern Recognition (CVPR), Las Vegas, NV, USA, 26 June–1 July 2016; pp. 770–778. [Google Scholar] [CrossRef] [Green Version]
- Szegedy, C.; Liu, W.; Jia, Y.; Sermanet, P.; Reed, S.; Anguelov, D.; Erhan, D.; Vanhoucke, V.; Rabinovich, A. Going deeper with convolutions. In Proceedings of the 2015 IEEE Conference on Computer Vision and Pattern Recognition (CVPR), Boston, MA, USA, 7–12 June 2015; pp. 1–9. [Google Scholar] [CrossRef] [Green Version]
- Szegedy, C.; Vanhoucke, V.; Ioffe, S.; Shlens, J.; Wojna, Z. Rethinking the Inception Architecture for Computer Vision. In Proceedings of the 2016 IEEE Conference on Computer Vision and Pattern Recognition (CVPR), Las Vegas, NV, USA, 26 June–1 July 2016; pp. 2818–2826. [Google Scholar] [CrossRef] [Green Version]
- Zhang, X.; Zhou, X.; Lin, M.; Sun, J. ShuffleNet: An Extremely Efficient Convolutional Neural Network for Mobile Devices. In Proceedings of the 2018 IEEE Conference on Computer Vision and Pattern Recognition, CVPR 2018, Salt Lake City, UT, USA, 18–22 June 2018; pp. 6848–6856. [Google Scholar]
- Sandler, M.; Howard, A.G.; Zhu, M.; Zhmoginov, A.; Chen, L. MobileNetV2: Inverted Residuals and Linear Bottlenecks. In Proceedings of the 2018 IEEE Conference on Computer Vision and Pattern Recognition, CVPR 2018, Salt Lake City, UT, USA, 18–22 June 2018; pp. 4510–4520. [Google Scholar]
- Deng, J.; Dong, W.; Socher, R.; Li, L.J.; Li, K.; Li, F.-F. Imagenet: A large-scale hierarchical image database. In Proceedings of the Computer Vision and Pattern Recognition (CVPR), Miami, FL, USA, 20–25 June 2009; pp. 248–255. [Google Scholar]
- Shin, H.; Roth, H.R.; Gao, M.; Lu, L.; Xu, Z.; Nogues, I.; Yao, J.; Mollura, D.; Summers, R.M. Deep Convolutional Neural Networks for Computer-Aided Detection: CNN Architectures, Dataset Characteristics and Transfer Learning. IEEE Trans. Med Imaging 2016, 35, 1285–1298. [Google Scholar] [CrossRef] [Green Version]
Figure 1.
Number of documents per year related to the use of neural networks for fine-tuning or transfer learning, source Scopus.
Figure 1.
Number of documents per year related to the use of neural networks for fine-tuning or transfer learning, source Scopus.

Figure 2.
Example of the whole PBS image and the single cropped WBC. (a) Original PBS image was acquired from a healthy subject (source ALL-IDB1). (b) From the left, two lymphoblasts and two lymphocytes (source ALL-IDB2).
Figure 2.
Example of the whole PBS image and the single cropped WBC. (a) Original PBS image was acquired from a healthy subject (source ALL-IDB1). (b) From the left, two lymphoblasts and two lymphocytes (source ALL-IDB2).

Figure 4.
Visual Grad-CAM explanations for ResNet-50 exploited on the original test set images belonging to the healthy category. (a) Image n. 34 (b) Image n. 43 (c) Image n. 47 (d) Image n. 71 (e) Image n. 72 (f) Image n. 74.
Figure 4.
Visual Grad-CAM explanations for ResNet-50 exploited on the original test set images belonging to the healthy category. (a) Image n. 34 (b) Image n. 43 (c) Image n. 47 (d) Image n. 71 (e) Image n. 72 (f) Image n. 74.

Figure 5.
Visual Grad-CAM explanations for ResNet-50 exploited on the original test set images belonging to the ALL category. (a) Image n. 31 (b) Image n. 32 (c) Image n. 33 (d) Image n. 48 (e) Image n. 49.
Figure 5.
Visual Grad-CAM explanations for ResNet-50 exploited on the original test set images belonging to the ALL category. (a) Image n. 31 (b) Image n. 32 (c) Image n. 33 (d) Image n. 48 (e) Image n. 49.

Figure 6.
Classification accuracy obtained by the different CNNs adopted in the synthetic data set.

Figure 7.
CNNs’ accuracy trend when increasing the number of WBC inside the image. In particular, the x-axis values start with imgSynt1 that represent the synthetic test set with one WBC added and terminate with imgSynt20, composed of twenty WBC added.
Figure 7.
CNNs’ accuracy trend when increasing the number of WBC inside the image. In particular, the x-axis values start with imgSynt1 that represent the synthetic test set with one WBC added and terminate with imgSynt20, composed of twenty WBC added.

Figure 8.
Visual Grad-CAM explanations for ResNet-50 exploited on different synthetic test sets. From top to bottom, examples of images belonging to imgSynt10, imgSynt15, and imgSynt20. Im stands for image, and S stands for set. (a) Im: 34, S: 10 (b) Im: 43, S: 10 (c) Im: 47, S: 10 (d) Im: 71, S: 10 (e) Im: 72, S: 10 (f) Im: 74, S: 10 (g) Im: 34, S: 15 (h) Im: 43, S: 15 (i) Im: 47, S: 15 (j) Im: 71, S: 15 (k) Im: 72, S: 15 (l) Im: 74, S: 15 (m) Im: 34, S: 20 (n) Im: 43, S: 20 (o) Im: 47, S: 20 (p) Im: 71, S: 20 (q) Im: 72, S: 20 (r) Im: 74, S: 20.


Table 1.
Overview of existing works in this field with key insights from the proposed methods.
| Method | Work | Task | Approach |
|---|---|---|---|
| Det/seg | [20] | WBC detection | detection from entire images |
| [36] | WBC detection | two-steps approach | |
| [39] | WBC detection + classification | detection from entire images | |
| [38] | WBC segmentation + classification | work on single WBC | |
| Classification only | [40] | WBC types classification | single WBC approach |
| [41] | WBC types classification | single WBC approach | |
| [24] | Blood cells classification | work on single cells | |
| [19] | WBC types classification | single WBC analysis | |
| [37] | ALL classification | work on single WBC | |
| [42] | ALL classification | entire image | |
| [21] | ALL classification | entire image | |
| [22] | ALL classification | entire image | |
| [23] | ALL classification | entire image with fine-tuning |
Table 2.
CNN performance obtained with the original ALL-IDB1 test set.
| Network | Acc (%) | Pre (%) | Rec (%) | Spe (%) | F1 (%) |
|---|---|---|---|---|---|
| AlexNet | 72.73 | 83.33 | 71.43 | 75.00 | 76.92 |
| VGG-16 | 100.00 | 100.00 | 100.00 | 100.00 | 100.00 |
| VGG-19 | 100.00 | 100.00 | 100.00 | 100.00 | 100.00 |
| ResNet-18 | 100.00 | 100.00 | 100.00 | 100.00 | 100.00 |
| ResNet-50 | 100.00 | 100.00 | 100.00 | 100.00 | 100.00 |
| ResNet-101 | 100.00 | 100.00 | 100.00 | 100.00 | 100.00 |
| GoogLeNet | 100.00 | 100.00 | 100.00 | 100.00 | 100.00 |
| Inception-v3 | 100.00 | 100.00 | 100.00 | 100.00 | 100.00 |
| ShuffleNet | 100.00 | 100.00 | 100.00 | 100.00 | 100.00 |
| MobileNet-v2 | 100.00 | 100.00 | 100.00 | 100.00 | 100.00 |
Publisher’s Note: MDPI stays neutral with regard to jurisdictional claims in published maps and institutional affiliations. |
© 2022 by the authors. Licensee MDPI, Basel, Switzerland. This article is an open access article distributed under the terms and conditions of the Creative Commons Attribution (CC BY) license (https://creativecommons.org/licenses/by/4.0/).
Share and Cite
MDPI and ACS Style
Loddo, A.; Putzu, L. On the Reliability of CNNs in Clinical Practice: A Computer-Aided Diagnosis System Case Study. Appl. Sci. 2022, 12, 3269. https://0-doi-org.brum.beds.ac.uk/10.3390/app12073269
AMA Style
Loddo A, Putzu L. On the Reliability of CNNs in Clinical Practice: A Computer-Aided Diagnosis System Case Study. Applied Sciences. 2022; 12(7):3269. https://0-doi-org.brum.beds.ac.uk/10.3390/app12073269
Chicago/Turabian StyleLoddo, Andrea, and Lorenzo Putzu. 2022. "On the Reliability of CNNs in Clinical Practice: A Computer-Aided Diagnosis System Case Study" Applied Sciences 12, no. 7: 3269. https://0-doi-org.brum.beds.ac.uk/10.3390/app12073269
Note that from the first issue of 2016, this journal uses article numbers instead of page numbers. See further details here.