Article

Efficient Diagnosis of Autism with Optimized Machine Learning Models: An Experimental Analysis on Genetic and Personal Characteristic Datasets

by
Maraheb Alsuliman
1,* and
Heyam H. Al-Baity
2
1
IT Department, College of Computing and Informatics, Saudi Electronic University, Riyadh 11673, Saudi Arabia
2
IT Department, College of Computer and Information Sciences, King Saud University, Riyadh 11543, Saudi Arabia
*
Author to whom correspondence should be addressed.
Submission received: 8 March 2022 / Revised: 31 March 2022 / Accepted: 5 April 2022 / Published: 10 April 2022
(This article belongs to the Special Issue Intelligent Computing for Big Data)

Abstract

:
Early diagnosis of autism is extremely beneficial for patients. Traditional diagnosis approaches have been unable to diagnose autism in a fast and accurate way; rather, there are multiple factors that can be related to identifying the autism disorder. The gene expression (GE) of individuals may be one of these factors, in addition to personal and behavioral characteristics (PBC). Machine learning (ML) based on PBC and GE data analytics emphasizes the need to develop accurate prediction models. The quality of prediction relies on the accuracy of the ML model. To improve the accuracy of prediction, optimized feature selection algorithms are applied to solve the high dimensionality problem of the datasets used. Comparing different optimized feature selection methods using bio-inspired algorithms over different types of data can allow for the most accurate model to be identified. Therefore, in this paper, we investigated enhancing the classification process of autism spectrum disorder using 16 proposed optimized ML models (GWO-NB, GWO-SVM, GWO-KNN, GWO-DT, FPA-NB, FPA-KNN, FPA-SVM, FPA-DT, BA-NB, BA-SVM, BA-KNN, BA-DT, ABC-NB, ABC-SVM, ABV-KNN, and ABC-DT). Four bio-inspired algorithms namely, Gray Wolf Optimization (GWO), Flower Pollination Algorithm (FPA), Bat Algorithms (BA), and Artificial Bee Colony (ABC), were employed for optimizing the wrapper feature selection method in order to select the most informative features and to increase the accuracy of the classification models. Five evaluation metrics were used to evaluate the performance of the proposed models: accuracy, F1 score, precision, recall, and area under the curve (AUC). The obtained results demonstrated that the proposed models achieved a good performance as expected, with accuracies of 99.66% and 99.34% obtained by the GWO-SVM model on the PBC and GE datasets, respectively.

1. Introduction

Autism spectrum disorder (ASD) is a neurological developmental disorder. It affects how people connect and interact with others and how they behave and learn [1]. The symptoms and signs appear when a child is very young. It is a lifelong condition and cannot be cured. Today, ASD is one of the fastest-growing developmental disorders, resulting in many problems, such as school problems related to successful learning, psychological stress within the family, and social isolation. However, early diagnosis can help the family take preliminary and effective steps to ensure the normal life of the patient. It can help providers of healthcare and families of patients by affording the effective therapy and treatment required, thereby reducing the costs associated with delayed diagnosis. On the other hand, many factors can be used to detect ASD cases, including personal and behavioral characteristics, genetic, brain images, and family history. Notwithstanding its genetic causes, ASD is mainly diagnosed utilizing personal and behavioral indicators that are tested in traditional clinical examinations by different specialists during regular visits. However, these traditional clinical methods, which primarily depend on the clinician, are time consuming and cumbersome. Currently, with computer power and big data generated by hospitals such as clinical data, gene expression profiles, and medical imaging, ASD can be automatically predicted and diagnosed in its early stages by using predictive models that use big data sets with ML algorithms, which can improve the life quality of patients and families as well as reduce the financial costs.
The personal and behavioral characteristics (PBC) and the gene expression (GE) data are the most available and valuable resources for machine learning (ML) algorithms seeking to discover new and hidden patterns of data to help in ASD prediction, thus helping families to take early steps for treatment. Nevertheless, the high dimensionality of these data makes the prediction process challenging. The feature selection (FS) mechanism can help in reducing the high dimensionality of such datasets, increasing the speed of the classification process, decreasing the cost, and improving the accuracy of the prediction models by selecting the most effective features.
Feature selection algorithms [2] aim to choose the most significant features to solve the prediction problems. In general, there are three common types of FS algorithm: filter, wrapper, and hybrid. Due to the potential benefits that can be achieved from automatic ASD classification, research in this field has recently gained much attention. Several methods have been proposed to solve the problem of predicting ASD. However, it is still an open problem and further improvement can be achieved.
Bio-inspired algorithms are one of the techniques that can be integrated into the wrapper feature selection method to search globally for the optimal feature subset and improve prediction accuracy [3]. They can be classified as a type of Nature-inspired Computation algorithms that rely on the inspiration of the biological evolution of nature to provide new optimization techniques. A number of researchers have adopted bio-inspired techniques for dealing with the high dimensionality of features, and they have shown high results in improving the diagnosis process of many diseases such as cancer [4]. However, there are few studies in research on ASD prediction using optimized FS algorithms and further investigation in this field is needed. To the best of our knowledge, this is the first study to deal with this problem using four bio-inspired algorithms (GWO, FPA, BA, and ABC). In addition, this is the first study that employed the CNN deep learning approach for ASD GE and PBC datasets.
This work aims to enhance the accuracy of early prediction of ASD and the classification performance when dealing with high-dimensional datasets by developing a ML predictive model that is based on an optimized feature selection method using bio-inspired algorithms. This can be accomplished by conducting a comparative empirical study using four bio-inspired algorithms incorporated in four ML algorithms on two ASD datatypes, PBC and GE. Thus, this work proposes 16 optimized ML models named GWO-NB, GWO-SVM, GWO-KNN, GWO-DT, FPA-NB, FPA-KNN, FPA-SVM, FPA-DT, BA-NB, BA-SVM, BA-KNN, BA-DT, ABC-NB, ABC-SVM, ABV-KNN, and ABC-DT. This work is going to answer the following research questions:
  • Is the proposed bio-inspired-based wrapper feature selection method able to enhance the accuracy results of ML classifiers in ASD prediction?
  • Which one of the proposed 16 optimized models will give the best performance in ASD prediction in terms of accuracy and on which dataset?
  • What is the type of dataset (PBC and GE) that will give the best accuracy result for predicting ASD?
  • Will the deep learning approach give better results in the ASD prediction problem on PBC and GE datasets compared to the proposed bio-inspired-based wrapper feature selection method?
The rest of this paper is organized as follows: Section II describes the background; Section III is about related work; Section IV presents the materials and methodology of our work; Section V discusses the experimental results; and, finally, Section VI concludes the paper and shows some of our future work.

2. Background

2.1. Personal and Behavioral Characteristics (PBC)

At clinical diagnosis, clinicians use questionnaires and behavioral observation to collect personal and behavioral information based on the Manual of Mental Disorders (DSM-5) criteria, which include two main symptoms. The first symptom is a chronic deficiency in social communication and social engagement through various contexts. The second symptom is minimal and repeated behavior patterns, desires, and behaviors. Personal and behavioral data generally include tens of attributes (high dimensionality) that can be classified into personal information (such as age, ethnicity, and born with jaundice) and behavioral screening questions (such as “Do ASD patients often hear small sounds when others do not?” or “Is it difficult to hold the attention of ASD patients?”) [5].

2.2. Gene Expression Profile (GE)

Gene expression is the mechanism by which the information stored in the gene is used to guide the assembly of the protein molecules. DNA microarray technology has become an effective way of tracking gene expression levels within the organism for biologists [6]. This technique helps researchers to assess the expression levels of a set of genes. Gene expression data usually comprise a wide range of genes and a small number of samples (high dimensionality). In medical fields, microarray technology is most widely used to find out what reasons and how to cure illnesses. Researchers have found that often the cause of some diseases, such as ASD, may be DNA mutations. It is well known that certain disorders are caused by the mutation of certain known genes. There is however, no particular form of mutation that causes all disorders. Therefore, the microarray gene expression analysis is used to identify and diagnose common genes mutations. Analysis of GE data is the method of identifying the helpful genes in the diagnosis.

2.3. Classification Algorithms

In our work, we used four different classification algorithms to analyze the datasets: support vector machine (SVM), decision tree (DT), Naïve Bayes (NB), and k-nearest neighbor (KNN) algorithms.
SVM [7] is one of the classification algorithms, and classifies two data types: linear and nonlinear.
First, the training dataset is converted into a higher dimension using nonlinear mapping. Next, it looks for linear separating hyperplanes (which are decision boundaries that help classify the data points) in the new dimension and splits the data based on the class. The optimal hyperplane [7] separates data points into classes that can be specified based on margin and support vectors. Support vectors are identified as the closest points of each class to the margin line. The NB classifier is based on Bayes’ theorem and is a probabilistic classifier. The presumption of conditional independence underpins this classifier. This implies that the values of the attributes for each class mark are effectively conditionally independent of one another. Despite this basic assumption, Naïve Bayes has been successfully applied to a variety of real-world data circumstances [8]. KNN is a simple, easy-to-implement supervised machine learning algorithm that can be used to solve both classification and regression problems. It is based on the similarity measure to classify the new cases by calculating the distance measured from the trained available cases. In DT, the data are visualized using a tree structure, which is represented as sequences and consequences using the decision tree. The root node is at the top of the tree, while the internal nodes are where the attributes are tested. The result of the test is represented by the “branch”. Finally, leaf nodes are nodes that have no further branching and indicate the class label of all previous decisions.

2.4. Feature Selection (FS)

Feature selection, as a data preprocessing technique, has been shown to be effective and efficient in preparing high-dimensional data for ML problems. The objectives of the selection of features include the development of simpler and more comprehensible models, the improvement of ML efficiency, and the preparation of clean and understandable data. The recent proliferation of large data has posed some major challenges and opportunities for feature selection algorithms [9]. The most common feature selection techniques are as follows: The filter approach, where the typical features are ranked via specific criteria. Features are then identified with the highest ratings then used as inputs for the wrapping or classification process [8,10]. On the other hand, the definition of the wrapper method requires the use of learning strategies to choose the optimum function subset to be used in the classification process. Usually, the wrapper method uses nature-inspired computational algorithms (NICs) to direct the search process by choosing the optimum feature subsets. The third approach is hybrid, which uses both filter and wrapper approaches. Based on [11], feature selection is a difficult task due to the need for searching over a large space, which is impossible in some applications that have large features and small samples. This problem can be solved using NIC algorithms that are able to search globally and can be utilized to solve the feature selection problem.

2.5. Nature-Inspired Computation (NIC)

NIC [12] refers to algorithms that imitate or optimize the behavior of natural and biological systems to solve problems in order to overcome or optimize the limitations of certain algorithms. All these algorithms share two characteristics: natural phenomena are replicated and modelled. NIC algorithms can be categorized into four types: swarm intelligence, bio-inspired, physics and chemistry, and other algorithms [13].

2.6. Bio-Inspired Algorithms

This is an emerging approach, focused on the inspiration of the biological evolution of nature, to develop new competing techniques. Bio-inspired optimization algorithms have demonstrated greater performance in a variety of disciplines, including disease diagnosis, by using the wrapper technique to high-dimensional datasets for feature selection. Algorithms for bio-inspired optimization are usually classified into three categories. Some of the well-known bio-inspired algorithms are described in the following section and are shown in Figure 1.

2.7. Grey Wolf Optimization (GWO)

GWO algorithm is a recent algorithm proposed in 2014 [14]. This algorithm mimics the social behavior of grey wolves while searching and hunting for the prey. Normally, the wolves live in a pack with a group size of 5 to 12. The wolves are guided by three leaders, namely, alpha, beta, and delta wolves. The alpha wolf is responsible for making the decision, the beta wolf helps the alpha wolf in decision-making or pack activity, while the delta wolf submits to the alpha and beta, and dominates the omega wolves.

2.8. Bat Algorithms (BA)

This is one of the newest micro-bat algorithms, naturally inspired, utilizing echolocation behavior to locate their prey. To measure size, echolocation is used by bats. Therefore, in order to pick the booty (solution), they randomly migrate to particular locations at a given velocity and at a set frequency. Among the best solutions, the solution is selected and created through the use of random walking [15].

2.9. Flower Pollination Algorithms (FPA)

The flower pollination algorithm, one of the newest optimization algorithms, is inspired by the action of flower pollination. Crop pollination strategies in nature include two primary types: cross-pollination and self-pollination [16]. Some birds act as global pollinators in cross-pollination, passing pollen to the flowers of more distant plants. On the other hand, pollen is spread by the wind and only among adjacent flowers in the same plant during self-pollination. The FPA is therefore established by mapping the two types of cross-pollination and self-pollination into global pollination operators and local pollination operators. Due to the merits of fundamental principles, few parameters, and ease of operation, the FPA has attracted considerable interest.

2.10. Artificial Bee Colony (ABC)

This is an organic algorithm inspired essentially by the behavior of bees in the search for good sources of food. The ABC algorithm consists of three classes of bees: employed bees, onlooker bees, and scout bees. The employed bees find a source of food as well as exchange information of the source of food with the employed bees in the hive who are waiting for dancing. The onlooker bees choose a good source of food from the discovered food. The bees that choose the food sources at random are known as scout bees. Any bees that do not change their food source become scout bees [17].

3. Related Work

There are many well-known ASD datasets that have been widely used in the relevant literature. These datasets can be classified into three types: personal and behavioral characteristics datasets (PBC), gene expression datasets (GE), and MRI mages datasets. It has been noticed that most previous works that handled ASD prediction either used ML or DL methods. There are some studies that used ML to perform classification without incorporating any of the feature selection algorithms presented in Table 1, and others that used simple feature selection algorithms before classification presented in Table 2. Nevertheless, there are very limited studies that used optimization algorithms in order to enhance the selection process of optimal features before the classification step, which are presented in Table 3. On the other hand, there are a few studies that employed the DL approach to predict ASD using GE and MRI images, and we reviewed few of them in Table 4.
Accordingly, the proposed taxonomy of our review of literature is divided into two main subsections. First, ASD prediction using the ML approach, which includes studies without FS methods, studies with FS methods, and studies with optimized FS methods using bio-inspired algorithms, using three dataset types (PBC, GE, and MRI images). Second, ASD prediction using the DL approach.

3.1. ASD Prediction Using ML Approach

3.1.1. ASD Prediction Using ML without FS Methods

Bhawana et al. [18] tried to diagnose ASD by applying ML techniques on the personal and behavioral dataset. The k nearest neighbor (KNN), support vector machine (SVM), linear regression (LR), Naïve Bayes (NB), and linear discriminant analysis (LDA) algorithms have used in the classification. The result of the implementation shows that the LDA algorithm had the best result of 72.2% and was the most accurate compared with the other algorithms.
Likewise, Erkan et al. [5] developed an autism prediction model to classify ASD data. They used the KNN, SVM, and random forest (RF) ML classifiers. They performed their models for the clinical diagnosis of ASD of all ages on the basis of personal and behavioral characteristics. The results obtained indicate that the RF and SVM methods provided a high classification performance.
Furthermore, Devika et al. [19] focused on the development of some classification models using ML algorithms such as RF and LR algorithms, and the KNN algorithm with two datasets—adults and toddler. KNN has a higher accuracy score of 69.2% compared to the other two algorithms that are calculated in the experimental results which were 68% for LR and 67% for RF.
Hana et al. [20] used an existing dataset to implement a variety of ML methods. The aim was to test the accuracy of various approaches for abetter evaluation, and then to develop a model that would be used to predict children’s autism. This was achieved by applying a standard autism test for infants, based on personal and behavioral assessments and widely used by psychologists and pediatricians to diagnose autism. The dataset contains 292 instances of children with 21 attributes. The RF and Support Vector Classifier (SVC) ML classifiers were applied, and the result was not satisfying—the highest accuracy was about 62%.
This study by Dong Hoon Oh et al. [21] used a gene expression profile to predict ASD. In this study, they used the published microarray data (GSE26415) from the Gene Expression Omnibus database, which included 21 young adults with ASD and 21 unaffected controls. SVM, K-NN, and LDA classifiers were used to assess the predictive model. The highest performance was for SVM and KNN.
In addition, supervised ML techniques were used by V. Pream et al. [22] to construct a model to diagnose ASD by classifying the genes that underlie this disease. To explore the results, they used SVM and DT. To validate the predictive results, a 10-fold cross-validation method was used. They found that, compared to SVM, the DT classifier performed better, with an accuracy of 94%.
Similarly, Muhammad Asif et al. in [23] developed a machine learning-based methodology for the identification of some disease genes, including ASD. They applied different ML classifiers such as NB, SVM, and RF. The results show RF had the highest accuracy with 80%.
The study by Gajendra et al. [24] shows that brain markers can be used for identifying ASD. The research focused on MRIs of children’s (3–4 years) brains and achieved a high-grade success of 95% with an RF classifier. In addition, they showed that the growth of the autistic brain significantly decreases after the age of 3 years.

3.1.2. ASD Prediction Using ML with FS Methods

Shanthi et al. [25] compared several FS algorithms to classify ASD. They performed two experiments. First, with all features, they calculated the accuracy of the random tree (RT) classification algorithm and the result was 95.1%. Second, to improve the efficacy of the RT classifier, they used chi-square, correlation feature selection (CFS), bagged tree feature selector (BT), recursive feature elimination (RFE), subset evaluation, and information gain (IG). The optimal selection of each feature selection algorithm was assisted by a 10-fold cross-validation RT classification algorithm. The results show that the BT model with the RT classifier had a high accuracy of 95.7% compared with 95.2% for REF.
Muhammad et al. [26] analyzed four ASD datasets for toddler, child, adolescent, and adult. They applied different feature selection algorithms on ASD datasets such as relief feature, IG, and CS, and relief feature outperformed the others. They also used some classification techniques and the sequential minimal optimization (SMO) algorithm worked best for the detection of ASD cases for all of the ASD datasets. A 10-fold cross-validation method also was used to assess the datasets.
This study by Noura Samy et al. [27] used IG filter with three ML classifiers. They used gene expressing profiles to compere the performance of ML classifiers such as decision tree (DT), KNN, and NB after applied IG filter. The results showed that the Naïve Bayes had an accuracy of 86.67%, while the accuracy was 83% for KNN and 53% for DT.
Yan Jin et al. [28] proposed an SVM-based classification system that used brain images to classify 6-month-old infants at high risk for ASD. Two feature selection algorithms were performed. First, a t-test and followed by the LASSO logistic regression. LASSO logistic regression is a widely used feature selection algorithm that can pick a parsimonious collection of features from a wide range of potential candidates to improve the classification accuracy. It only maintains the most discriminatory features, thus discarding the obsolete ones. The outcome achieved an accuracy of 76%.
The purpose of a study by Gajendra et al. [29] was to solve high-dimensional and heterogeneous dataset problems like the Autism Brain Imaging Data Exchange (ABIDE) dataset. Previous works on the ABIDE dataset have reported accuracies less than 60%. In their study, they investigated the predictive power of MRI in ASD utilizing three classifiers: RF, SVM, and gradient boosting machine (GBM). They used RFE for the feature selection technique and the results showed that the classification accuracy could reach 60%.

3.1.3. ASD Prediction Using ML with Optimized FS Methods

There was only one study that used bio inspired algorithms on this data type. Vaishali et al. [3] tried to use the Firefly feature selection algorithm to improve ASD classification by providing a minimum set of features. The dataset contains 21 features, which makes it a high dimensional dataset. They used firefly feature selection algorithm with these classifiers (NB, SVM, and KNN) with 10-fold cross-validation, and they compared the accuracy before and after applying feature selection. The results show that the firefly feature selection algorithm selected 10 feature subsets among the 21 features in the dataset as optimum and the SVM classifier provided the highest score with 97.5%.
Hameed et al. [30] tried to improve the accuracy of the gene classification for ASD by using ML with geometric binary particle swarm optimization (GBPSO), which is one type of bio-inspired algorithm. They used different filters to reduce features to be 9454 features (genes). Then, they used statistical filters, which were as follows: the two-sample t-test (TT), the group correlation of features (COR) and the Wilcoxon rank sum test (WRS). The last step was choosing genes by using a GBPSO-SVM wrapper-based algorithm along with the used filters. The advantage of using this algorithm is because GBPSO starts with a random number of selected genes and searches in each iteration for the appropriate subset of genes. Then, 10-fold cross-validation with the SVM classifier was used to test the output of each candidate subset. The GBPSO algorithm contributed to the choice of an optimal subset of genes, offering the highest accuracy of classification. The combined gene subset selected by the GBPSO-SVM algorithm has been able to increase the accuracy of the classification to reach 92.1%.
Similarly, Tomasz et al. [31] tried to enhance the ASD prediction by using the optimal feature (genes) subsets in the classification algorithm. They used genetic algorithms (GA) and RF in the role of final gene selection. The most important genes selected by each method was used as the input features to the SVM and RF classifiers, cooperating in an ensemble. The final result of the classification was generated by RF and was about 87%.
Chen et al. [32] used the brain images dataset that contains 126 ASD samples and 126 typically developing (TD) samples to detect ASD. Three ML algorithms were implemented in this study to perform a binary classification (ASD vs. TD) using rsfMRI data. First, they used SVM in combination with particle swarm optimization (PSO) for feature selection (PSO-SVM). Second, SVM with recursive feature elimination (RFE-SVM) was used, and thirdly was RF. The diagnostic classification obtained a high accuracy of 91% with RF.

3.2. ASD Prediction Using DL Approach

This study by Noura Samy et al. [27] proposed the IG/DBN model to diagnose ASD. They used DBN based on a Gaussian–Bernoulli Restricted Boltzmann Machine (GBRBM) as a classifier that employs deep learning for ASD classification. The IG filter was used as a gene selector to remove irrelevant genes, and to select the most relevant genes. They used a GE dataset that contains 30 samples and 43,931 features. The proposed model obtained a high accuracy of 98.64%.
Rajat et al. [33] used the published ABIDE dataset, which includes a collection of structural (T1w) and functional (rsfMRI) brain images aggregated across 29 institutions. It includes 1028 participants diagnosed with autism. They explored various transformations that retain the maximum spatial resolution by summarizing the temporal dimension of the rsfMRI data, thus enabling the creation of a full three-dimensional convolutional neural network (3D-CNN) on the ABIDE dataset. They also used the SVM algorithm on the same data set and obtained the highest efficiency at 63%.
Nicha et al. [34] tested six different neural network methods for incorporating phenotypic data such as gender and age, with rsfMRI to classify ASD. They tested the proposed models by using ABIDE. The best model was combining the baseline model directly with raw phenotypic data, and 70.1% accuracy was achieved for ASD classification.
From Table 1, it has been noticed that most of the previous studies applied ML classifiers without using any FS algorithms to build ASD predictive models. Some of these models achieved good result. In addition, there are five studies that have used simple FS with ML algorithms on two data types (PBC and MRI images) [25,26,27,28,29], and the MRI image-based models failed to achieve a high performance compared to the PBC data type. On the other hand, there was limited research on optimizing FS methods using bio-inspired evolutionary algorithms to improve ASD prediction in the literature. Some of these algorithms achieved good results, as follows:
Binary Firefly improved the accuracy to reach 97.9% in [3] with 10 selected features out of 21. GBPSO enhanced the accuracy percentage to 92.1% in [30] with 200 selected features out of 9454. PSO also enhanced the accuracy to reach 91% on an MRI image dataset [32].
From the aforementioned previous studies, we noticed the following:
  • Two methods used for predicting ASD: ML and DL.
  • Multiple ASD datasets such PBC, GE, and IMR brain images are widely used for ASD diagnosis.
  • The 10-fold cross-validation was the most used for dataset partitioning.
  • Bio-inspired algorithms proved their ability to enhance ASD prediction in three types of datasets.
  • MRI brain datasets, compared with the two other datasets types, did not show a high performance in ASD prediction when using ML or DL approaches.
The investigation of optimized feature selection methods using bio-inspired algorithms is limited in the existing ASD research and it has not been well addressed so far in this field. GA [31], PSO [30], and Firefly [3] were the only three bio-inspired algorithms that examined ASD prediction. Over the past few years, there have been some new bio-inspired algorithms that have been developed and used to improve feature selection to solve the high dimensionality problem, especially for disease prediction such as cancer. There are a lot of studies that handled cancer prediction using gene expression profiles and bio-inspired algorithms with ML, such as the bat algorithm (BA), flower pollination algorithm (FPA), grey wolf optimization (GWO), and artificial bee colony (ABC). In [35], a new model was built to predict prostate cancer by using BA with KNN, and it reached a high accuracy 100% and the selected features (genes) were 6 from 500. In [14], GWO with a DT classifier was used to predict Leukemia cancer, they it 100% accuracy. In [36], ABC with NB classification was used to predict Leukemia cancer, which reached 98.68% accuracy with 12 selected features (genes). FPA with SVM was used for breast cancer classification using GE data, and the result was 80.11% accuracy [16].
Therefore, in this study, we aimed to conduct a comparative study and evaluate different bio-inspired-based feature selection algorithms (BA, FPA, GWO, and ABC), which have not been previously applied to ASD prediction, using four ML classifiers (NB, KNN, SVM, and DT), as they are the most widely used algorithms in the literature and showed a good performance in ASD classification on both PBC and GE datasets. To the best of our knowledge, this is the first work to investigate and perform a comparative study on different bio-inspired-based feature selection algorithms for early ASD prediction using PBC and GE datasets.
As the used PBC dataset has been already used in previous work by Vaishali et al. [3] with ML classifiers (NB, KNN, and SVM) and the GE dataset has been used by Noura Samy et al. [27] with ML classifiers (NB, DT, and KNN) and DBN that gave good accuracy results, we used the same classifiers (NB, KNN, SVM, and DT) combined with the proposed optimized wrapper feature selection methods based on GWO, FPA, BA, and ABC for comparison purposes.

4. Materials and Methods

4.1. Anaconda Environment

Anaconda [37] is a simple, open-source platform that helps data scientists interpret their datasets and discover hidden patterns through a number of sophisticated libraries. It is written in the Python language. It is also supported by Linux, MacOS, and Microsoft Windows operating systems and can use Python and R programming languages. In this work, we used Python. Anaconda provides different platforms, which all have specific features. The Jupyter notebook is an interactive notebook computing environment and was used in this project. In addition, the main Python libraries, including NumPy, Pandas, and Scikitlearn, were used.

4.2. Dataset Overview

4.2.1. PBC Dataset

We have obtained the publicly published PBC dataset from UCI (University of California, Irvine), which was compiled by Dr. Fadi Fayez [38]. The data were collected from many countries throughout the world through surveys on a mobile application called “ASD Tests”, which can be found in [39]. The data were collected in accordance with the relevant guidelines and regulations. The PBC dataset consists of 292 samples and 20 features used for our training process, and the “class name” feature was used for storing the ASD diagnosis result. The ten features numbered from 11 to 20 were related to personal information, and the other ten features from 1 to 10 consisted of screening questions related to behavior.

4.2.2. GE Dataset

The used GE dataset is publicly available on the National Center for Biotechnology Information (NCBI) [40] and is collected in accordance with the relevant guidelines and regulations. It represents gene expression data for 30 samples with 43,931 features (genes). Classes are divided into 15 ASD and 15 non-ASD.

4.3. Data Preprocessing

4.3.1. PBC Dataset

Data preprocessing entails several steps for the PBC dataset. In order to apply ML algorithms that process the numeric data type, we had to apply the numeric transformation rule to preprocess the four personal string attributes, “gender”, “ethnicity”, “country of residence”, and “who is completing the test”, and three binary attributes (with the yes/no answer), “born with jaundice”, and “family member with pervasive developmental disorder (PDD)”. The attributes of the screening questions were not altered by this rule, as the values were 0 and 1.

4.3.2. GE Dataset

In the GE dataset, we switched the columns and rows as the original dataset was laid out in the opposite way: the attributes were displayed in rows and instances in columns. This step is important as the Pandas library in the Anaconda platform deals with data row by row, where each row represents one sample information.

4.4. Proposed Predictive Models

According to [3], the dimensionality of the used datasets was high (43,931 genes in the GE dataset and 20 features in the PBC) and this may affect the achievement of the classification algorithms. The goal of this work is to enhance the performance of the ML prediction models in terms of accuracy. This goal can be achieved by optimizing the feature selection method using different bio-inspired algorithms.
In this work, we used four bio-inspired algorithms (grey wolf optimizer, flower pollination algorithm, bat algorithm, and artificial bee colony) with four ML classifiers (NB, KNN, DT, and SVM). To our knowledge, these four bio-inspired algorithms have not yet been examined for ASD classification. As we mentioned previously in the related work, we tried to investigate and compare the performance of two bio-inspired optimization algorithms (FPA and GWO) that are considered newer than two well-known algorithms (BA and ABC), which have proven their ability to enhance diseases classification such as cancer when dealing with a high dimensionality dataset like GE. These algorithms are compared in terms of search efficiency and robustness for finding the optimal feature subset for the classification process.
Therefore, we developed 16 optimized predictive models as follows: GWO-NB, GWO-KNN, GWO-SVM, GWO-DT, FPA-NB, FPA-KNN, FPA-SVM, FPA-DT, BA-NB, BA-KNN, BA-SVM, BA-DT, ABC-NB, ABC-KNN, ABC-SVM, and ABC-DT. Figure 2 presents the general framework of the proposed model.
As illustrated in Figure 2, the main framework of the proposed model consisted of two main phases: the feature selection phase and the classification phase.

4.4.1. The Feature Selection Phase

In the beginning, we used the wrapper selection method for feature selection, and we optimized its performance by incorporating it into it the bio-inspired algorithms (GWO, BA, FPA, and ABC). This phase starts with a population of the candidate solutions (PBC or GE features). Next, the candidate solutions were evaluated using objective function (wrapper subset evaluator). The objective function aims to evaluate each solution according to the used fitness function, which depends on the ML classifier (SVM in our case) in order to get the classification accuracy of each solution. Therefore, from the candidate solutions, the solutions with the highest accuracy were selected as the optimal feature subset. The resulting optimal feature subset in this phase was used in the second phase, which is the classification phase. The main parameter settings that were used in this work of the four wrapper methods were the number of solutions (N) = 10 and the number of iterations (i) = 20.

4.4.2. The Classification Phase

The final optimal features, which were the output of the first phase will be used to evaluate the classifiers. In this phase, the classifier was trained using the training dataset with optimal features, and the testing dataset was employed to test the performance of the classifier. This work adopted the 10-fold cross-validation, and the final classification was made based on the average. The classification results were evaluated using the five evaluation metric. In this research, the LinearSVC (C = 1) from sklearn library was applied for performance evaluation in both objective function and final classification that used SVM. For the NB classification algorithm we used the GaussianNB from sklearn library for the evaluation and analysis. For the NB classifier, we used the GaussianNB from sklearn library and we adopted the KNeighborsClassifier (k = 5), and we utilized the DecisionTreeClassifier with an entropy value from the sklearn library for evaluating the performance.

5. Implementation and Results
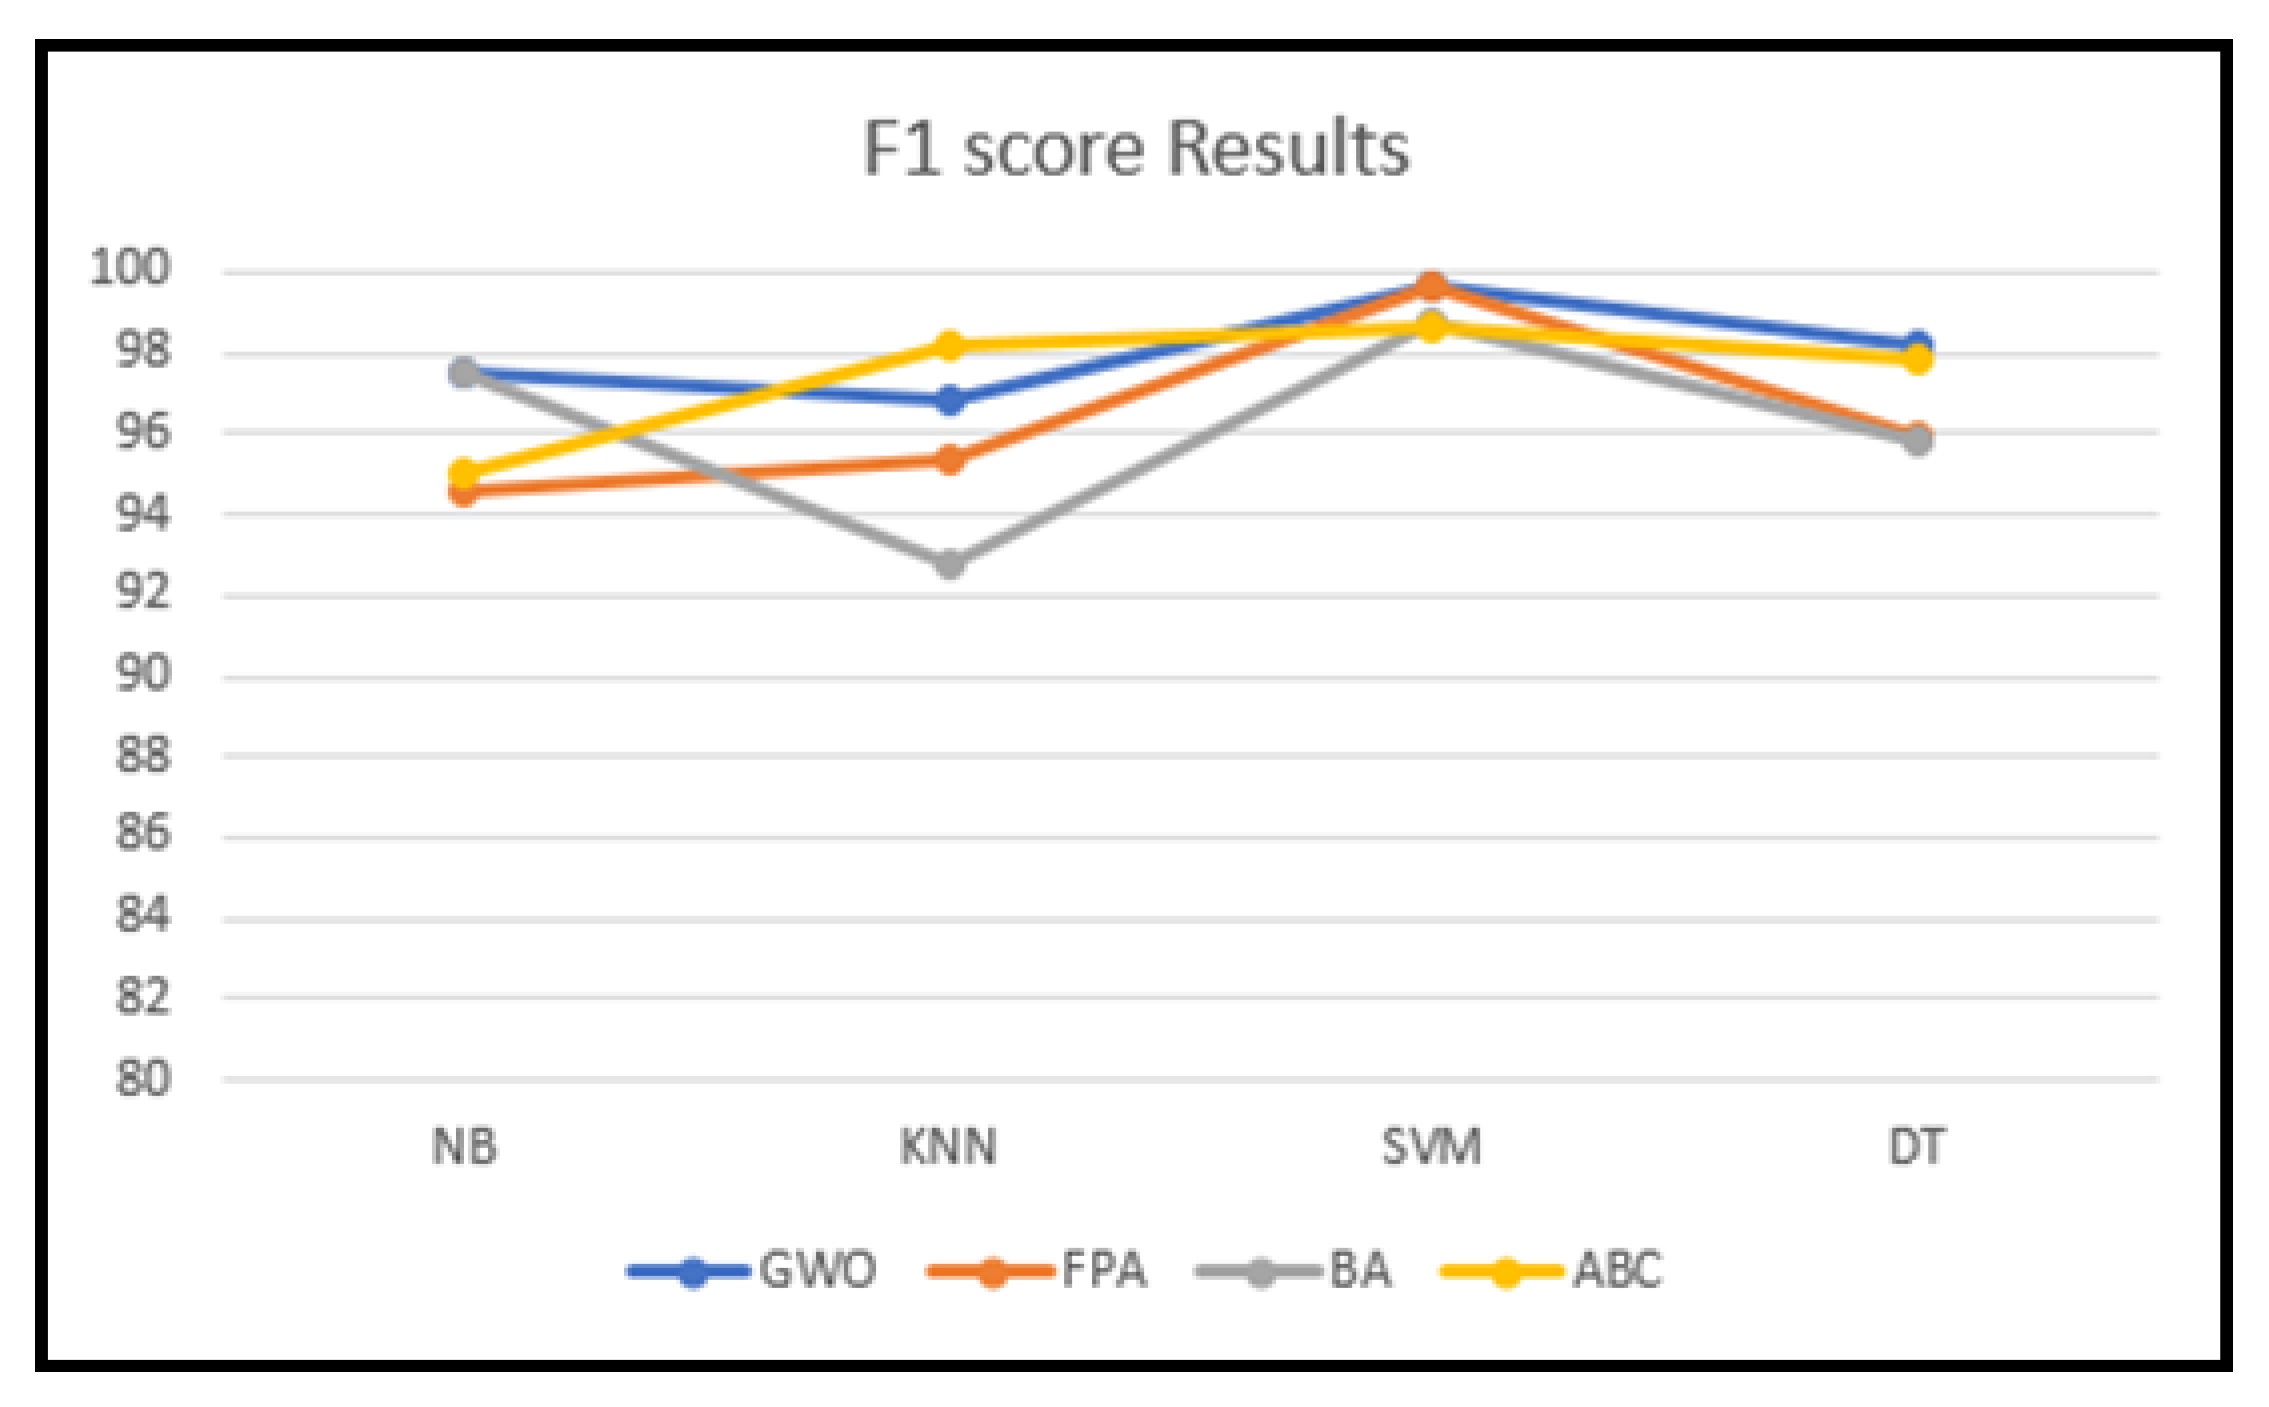
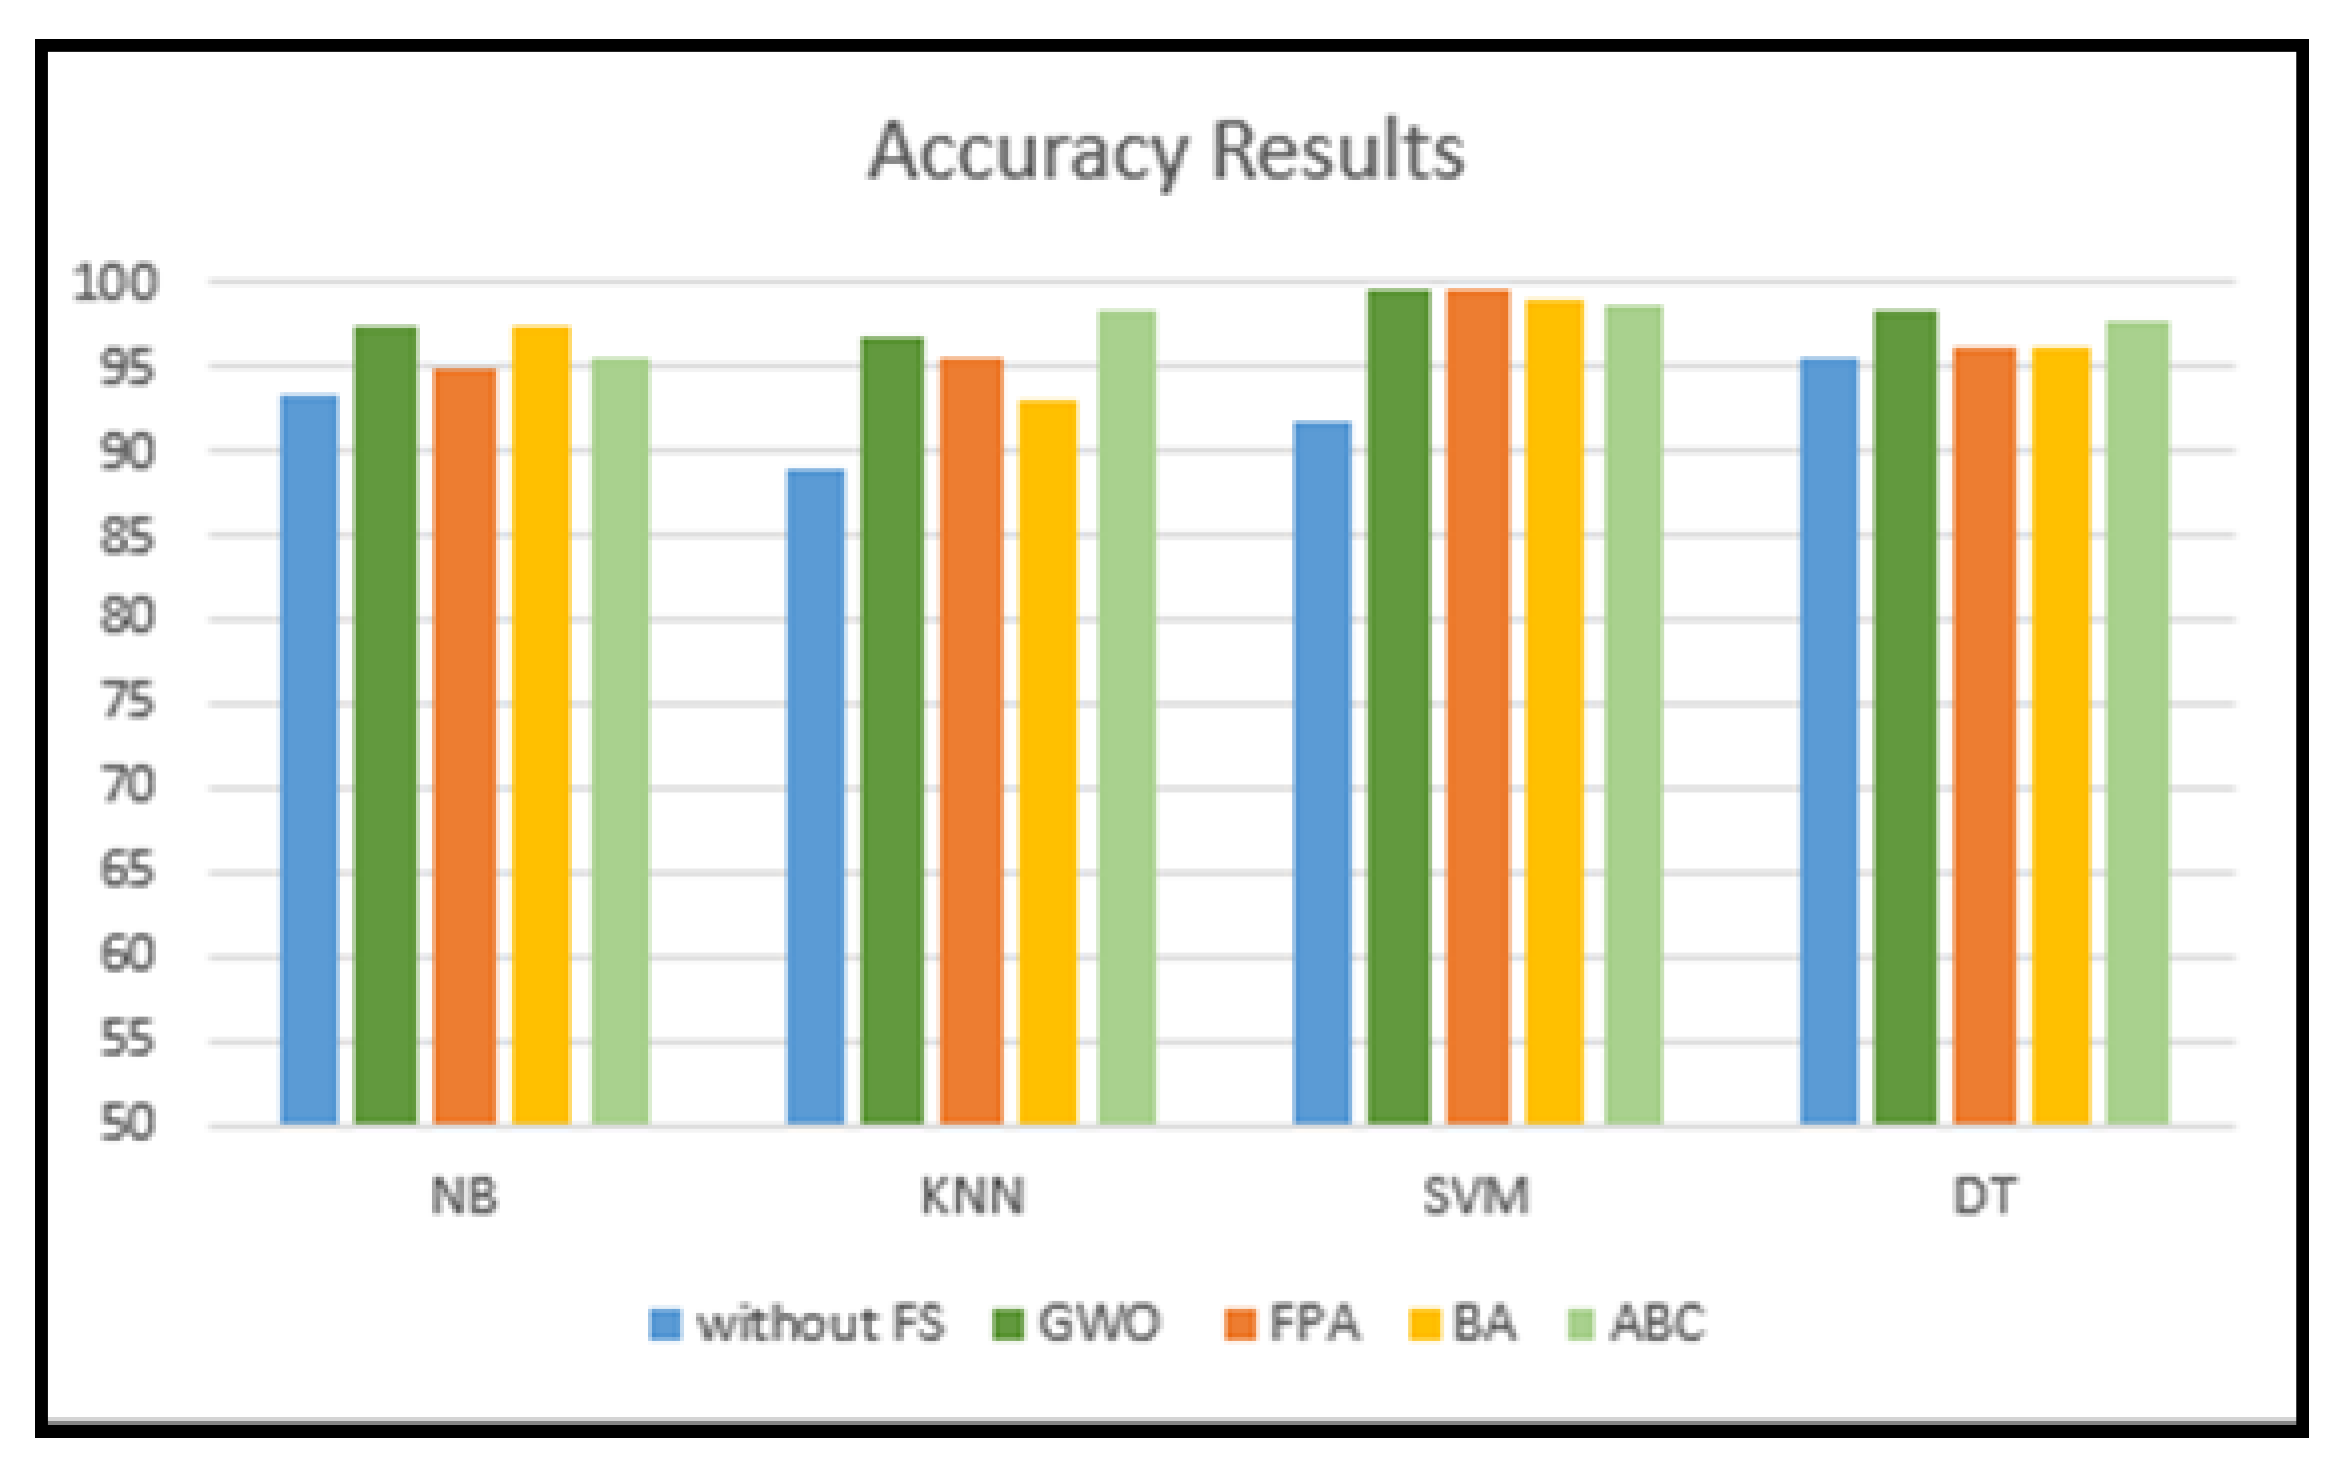
In this work we conducted three experiments. In the first experiment, we applied the four predictive classifiers (NB, KNN, SVM, and DT) without using the optimized wrapper selection method for the sake of comparison. In the second experiment, we evaluated the performance of the 16 proposed models and compared the obtained results with the first experiment and previous works [3,27]. In the third experiment, we employed the CNN deep learning approach to compare its results with the proposed models.

5.1. Experiment 1

For the sake of comparison and to investigate the advantage of using the optimized wrapper selection methods based on bio-inspired algorithms, we conducted the first experiment in which we used the four classical ML classifiers (NB, KNN, SVM, and DT) with the two datasets (PBC and GE) for ASD prediction without using the optimized wrapper selection method.
Table 5 presents the results of the four classifiers on the two datasets. As we can see from the table, the DT classifier achieved the highest accuracy with the PBC dataset. For the GE dataset, we noticed that the highest accuracy was 86.6% obtained by DT.
Therefore, we can see that using ML classifiers without any FS methods for the GE dataset did not give an efficient ASD prediction compared to the PBC dataset due to its high dimensionality. It has also been noticed that the accuracy of KNN was relatively low, especially when compared to other classification algorithms for all datasets.

5.2. Experiment 2

In this experiment, we investigated the impact of incorporating the optimized wrapper feature selection method based on the bio-inspired algorithms (GWO, FPA, BA, and ABC) into the used predictive classifiers (NB, KNN, SVM, and DT) using two datasets (PBC and GE). Table 6 presents the obtained results of the proposed models.
Regarding the PBC dataset, Figure 3 shows the obtained accuracy results for the proposed models. It can be seen from Table 6 and Figure 3 that the GWO-SVM and GWO-DT models gave the highest accuracy results of 99.66% and 98.29%, respectively, compared to the GWO-NB model (97.58%), followed by the GWO-KNN model (96.89%). The FPA-SVM model achieved the highest accuracy of 99.56% compared with the FPA-DT model (96.21%) and the FPA-KNN (95.52%), while the lowest accuracy was obtained by the FPA-NB model (94.88%). On the other hand, the BA-based wrapper models gave the highest accuracy with the BA-SVM (98.97%) and BA-NB models (97.60%) compared to the BA-DT model (96.22%), followed by the BA-KNN model (93.14%). For ABC-based wrapper models, the ABC-SVM model gave the highest accuracy (98.63%) compared with the ABC-KNN model (98.27%) and the ABC-DT (97.73%). The ABC-NB model gave the lowest accuracy of 95.54%.According to the obtained results, GWO-SVM had the best classification performance on the PBC dataset compared to the remaining classifiers.
Regarding the GE dataset, Figure 4 shows the accuracy results of the proposed models. GWO-SVM had the highest accuracy of 99.34% compared to the GWO-DT model (80.0%), followed by the GWO-KNN (63.34%) and GWO-NB models (63.33%). As for the FPA-based models, the FPA-SVM model gave the highest accuracy (96.67%) compared with the FPA-DT model (76.66%) and the FPA-NB (70.0%). The FPA-KNN model had the lowest accuracy of 60.0%. On the other hand, the BA-based models gave the highest accuracy with the SVM-BA model (97.34%) compared to the BA-DT model (89.99%), followed by the BA-NB model (63.33%), and BA-KNN gave the lowest accuracy of 56.66%. For ABC-based models, the ABC-SVM model gave the highest accuracy (96.66%) compared with the ABC-DT model (93.33%) and ABC-NB (56.66%), while the lowest accuracy was 53.33% for the ABC-KNN model.
According to the obtained results, GWO-SVM had the best classification performance on the GE dataset compared to the remaining classifiers. In general, we can say that the proposed models achieved a good predictive performance on the two datasets. For the PBC dataset, the SVM and DT classifiers had a better performance with the four optimized wrapper methods. GWO-SVM and FPA-SVM were the best models with highest accuracies of 99.66% and 99.56%, respectively. As for the GE dataset, the SVM classifier was better with the four optimized wrapper methods than the other classifiers. GWO-SVM and BA-SVM were the best models with the highest accuracies of 99.34% and 97.43%, respectively.
Figure 5 presents the F1 score results of the 16 proposed models on PBC dataset. The SVM classifier gave the highest results with the GWO, FPA, BA, and ABC-based models (99.67%, 99.65%, 98.78%, and 98.61%, respectively) compared to the other classifiers. On the other hand, the BA-KNN model gave the lowest result (92.82%).
Figure 6 presents the F1 score results of the 16 proposed models on the GE dataset. The SVM classifier gave the highest results with GWO, FPA, BA, and ABC-based models (96.0%, 97.14%, 97.33%, and 96.0%, respectively) compared to the other classifiers. On the other hand, the BA-NB model gave the lowest result (43.33%).
Figure 7 shows the graphical representation of the ROC curves for all four classifiers in each wrapper selection method on the PBC dataset. In the ROC curves of the GWO-based wrapper models the SVM curve covers more areas, followed by DT and then NB and KNN (99.69%, 98.27%, 97.57%, and 96.88%, respectively). In the ROC curves of the FPA-based wrapper models, the SVM curve covered more areas, followed by DT and then KNN and NB (99.66%, 96.16%, 95.54%, and 94.87%, respectively). In the ROC curves of BA-based wrapper models the SVM curve covers more areas, followed by the NB and then the DT and KNN (99.0%, 97.57%, 96.11%, and 93.09%, respectively). In the ROC curves of ABC-based wrapper models the SVM curve covers more areas, followed by the KNN and then the DT and NB (98.66%, 98.28%, 97.92%, and 95.42%, respectively).
Figure 8 shows the AUC results for all four classifiers in each wrapper selection method in the GE dataset. In the ROC curves of the GWO-based wrapper models, the SVM curve covers more areas, followed by DT, and then KNN and NB (99.33%, 85.0%, 62.5%, and 60.0%, respectively). In the ROC curves of FPA-based wrapper models, the SVM curve covered more areas, followed by DT, and then NB and KNN (96.67%, 72.5%, 61.0%, and 60.0%, respectively). In the ROC curves of the BA-based wrapper models, the SVM curve covered more areas, followed by DT, and then NB and KNN (97.34%, 92.0%, 57.5%, and 55.0%, respectively) In the ROC curves of the ABC-based wrapper models the SVM curve covers more areas, followed by KNN, and then DT and NB (96.67%, 96.67%, 52.5%, and 52.5%, respectively).
The precision results in the PBC dataset were the best in GWO-SVM and FPA-SVM, while GWO-SVM and ABC-SVM returned the best results in the GE dataset. Moreover, GWO-SVM and BA-SVM gave the best recall results in the PBC dataset, while GWO-KNN, FPA-KNN, FPA-SVM, BA-KNN, and ABC-KNN returned the best results in the GE dataset with 100%.
Furthermore, Table 7 shows the number of selected features in each model for two datasets. For the PBC dataset, the BA-based wrapper model obtained the minimum number of features compared to the other models. For the GE dataset, the GWO-based wrapper model obtained the minimum number of genes compared to other models. Therefore, this was reflected in the ability of the GWO-SVM, FPA-SVM, BA-SVM, and ABC-SVM models to gain the highest accuracy results. In general, all algorithms succeeded in reducing the high dimensionality of our datasets.

5.2.1. Comparison between Experiment 1 and Experiment 2

In this section, we compare the results of the first experiment, which used all of the features of the datasets along with Experiment 2, which selected the most informative subset of the features using the proposed wrapper selection method.
According to Figure 9 and Figure 10, and Table 6 and Table 7, we observed the following: From Figure 9, we can see that all classifiers’ accuracies were enhanced after using the GWO, FPA, BA, and ABC-based wrapper methods. The best model that obtained the best accuracy on the PBC dataset was GWO-SVM (99.66%) in Experiment 2, while the DT classifier gave the highest accuracy of 95.5% in Experiment 1.
On other hand, Figure 10 shows that all classifiers’ accuracies were enhanced after using the GWO, FPA, BA, and ABC-based wrapper methods on the GE dataset. The best accuracy achieved in Experiment 2 was 99.34% for GWO-SVM, while the best accuracy obtained in Experiment 1 was 86.6% for the DT classifier.
Moreover, the size of the features was reduced to 6 after using GWO for the PBC dataset and 15,392 for the GE dataset. Regarding AUC, F1score, precision, and recall, they were also enhanced after using the GWO, FPA, BA, and ABC-based wrapper selection methods for the two datasets.

5.2.2. Comparison between the Proposed Models and Previous Work

In this part, we compare the results of the previous work in the literature, which used the Firefly feature selection algorithm with SVM classifier (FA-SVM) on the PBC dataset [3] and IG filter with a deep belief network algorithm for classification (DBN-IG) on the GE dataset [27], with the four best obtained results of the proposed models, which selected the most informative subset of features.
According to results for the PBC dataset from Table 7 and Table 8, we observed that the four proposed models gave better accuracy of results compared with previous work [3], and the GWO-SVM model had the highest accuracy with 99.66%. Moreover, the size of the features in the proposed models was reduced to 4 by the BA-based wrapper model and 6 by the GWO-based wrapper model, rather than 10 by FA-based wrapper model [3]. Based on the results of the GE dataset from Table 7 and Table 9, we observed that the GWO-SVM proposed model enhanced the accuracy to 99.34% compared with the accuracy of the previous work [27], which was 98.64%.
To sum up, the experimental results showed the effectiveness of incorporating the optimized wrapper feature selection based on bio-inspired algorithms (GWO, FPA, BA, and ABC) into the four predictive classifiers (NB, KNN, SVM, and DT) in terms of the accuracy of ASD prediction for the PBC dataset and GE dataset.

5.2.3. Comparison between the Proposed Models and the DL Based Model

In this section, we compared the highest results of the 16 proposed models with the CNN model that was employed for ASD classification. According to the obtained results, for the PBC dataset from Table 10, we observed that the GWO-SVM gave better accuracy results of 99.66% compared to the CNN model (98.64). This can be attributed to the small size of the PBC dataset.
Based on the results of the GE dataset from Table 10, we observed that the CNN model achieved better accuracy of 99.98% compared to the accuracy obtained by GWO-SVM, which was 99.34%.

6. Conclusions and Future Work

Several different ML algorithms that can be used for ASD detection; however, some of them are unnecessarily time-consuming and prone to human error, and thus by the time the disease is detected, the patient may already be in the stage of ASD that is difficult to deal with. The challenge is to implement an automatic, fast, and accurate model for early ASD detection.
This project aims to assess the ability of optimizing the wrapper FS method based on bio-inspired algorithms (GWO, FPA, BA, and ABC) to enhance the prediction accuracy of 16 ML models (GWO-NB, GWO-KNN, GWO-SVM, GWO-DT, FPA-NB, FPA-KNN, FPA-SVM, FPA-DT, BA-NB, BA-KNN, BA-SVM, BA-DT, ABC-NB, ABC-KNN, ABC-SVM, and ABC-DT). The optimized wrapper FS methods were thus implemented with four different ML classifiers, NB, KNN, SVM, and DT. All of the algorithms were evaluated on two datasets and were compared with the results for the original classifiers.
The experimental results showed the effectiveness of the proposed models in terms of the prediction accuracy of ASD, especially when we used the GE dataset. Generally, the models produced a good accuracy with both the PBC and GE datasets. Among all 16 models, GWO-SVM obtained the highest accuracy overall for both the PBC and GE datasets. In addition, the DL-based model achieved better accuracy results with big datasets such as GE rather than the PBC dataset. The main limitations faced in this work were the significant computation time when the number of features was large, as well as the large amount of memory and more powerful processor.
In the future, the aim is to compare these algorithms based on bio-inspired algorithms with deep learning approaches for ASD prediction after obtaining more patient samples. Moreover, the combination between two dataset types with the same samples may provide more accurate results. Hybrid feature selection may also be used as a future approach, as it combines the advantages of both filter and wrapper algorithms.

Author Contributions

M.A. developed the model and performed the experiments. H.H.A.-B. verified the analytical methods. All authors conceived the study and H.H.A.-B. was in charge of overall direction and planning. All authors have read and agreed to the published version of the manuscript.

Funding

This research received no external funding.

Informed Consent Statement

Not Applicable.

Data Availability Statement

The two analyzed datasets during the current study are publicly published. The GE dataset is available in the National Center for Biotechnology Information (NCBI) repository, https://0-www-ncbi-nlm-nih-gov.brum.beds.ac.uk/ (accessed on 7 March 2022), and the PBC dataset is available in the Center for Machine Learning and Intelligent Systems repository, https://archive.ics.uci.edu/ (accessed on 7 March 2022).

Acknowledgments

The authors would like to acknowledge the Researchers Supporting Project Number (RSP-2021/287), King Saud University, Riyadh, Saudi Arabia for their support in this work.

Conflicts of Interest

The authors declare no conflict of interest.

Abbreviations

AbbreviationDefinition
ASDAutism spectrum disorder
MLMachine learning
DLDeep learning
GEGene expression
PBCPersonal and behavioral characteristics
GWOGray wolf optimization
FPAFlower pollination algorithm
BABat algorithms
ABCArtificial bee colony
AUCArea under the curve
SVMSupport vector machine
DTDecision tree
NBNaïve Bayes
KNNK-nearest neighbor
FSFeature selection
NICNature-inspired computation
UCIUniversity of California, Irvine
LRLinear regression
LDALinear discriminant analysis
RFRandom forest
SVCSupport vector classifier
RTRandom tree
CFSCorrelation feature selection
BTBagged tree feature selector
REFRecursive feature elimination
IGInformation gain
SMOSequential minimal optimization
ABIDEAutism brain imaging data exchange dataset
GBMGradient boosting machine
GBPSOGeometric binary particle swarm optimization
WRSWilcoxon rank sum test
PSOParticle swarm optimization
RFERecursive feature elimination
PDDPervasive developmental disorder

References

  1. Hirvikoski, T.; Mittendorfer-Rutz, E.; Boman, M.; Larsson, H.; Lichtenstein, P.; Bölte, S. Premature mortality in autism spectrum disorder. Br. J. Psychiatry 2016, 208, 232–238. [Google Scholar] [CrossRef] [PubMed] [Green Version]
  2. Bolón-Canedo, V.; Sánchez-Maroño, N.; Alonso-Betanzos, A. Feature selection for high-dimensional data. Prog. Artif. Intell. 2016, 5, 65–75. [Google Scholar] [CrossRef]
  3. Vaishali, R.; Sasikala, R. A machine learning based approach to classify autism with optimum behavior sets. Int. J. Eng. Technol. 2018, 7, 1–6. [Google Scholar] [CrossRef]
  4. Al-Baity, H.H.; Al-Mutlaq, N. A New Optimized Wrapper Gene Selection Method for Breast Cancer Prediction. Comput. Mater. Contin. 2021, 67, 3089–3106. [Google Scholar] [CrossRef]
  5. Erkan, U.; Thanh, D. Autism Spectrum Disorder Detection with Machine Learning Methods. Curr. Psychiatry Rev. 2019, 15, 297–308. [Google Scholar] [CrossRef]
  6. Raza, K. Analysis of Microarray Data Using Artificial Intelligence Based Techniques; IGI Global: Hershey, PA, USA, 2016; pp. 216–239. [Google Scholar]
  7. Suthaharan, S. Machine Learning Models and Algorithms for Big Data Classification: Thinking with Examples for Effective Learning; Springer: New York, NY, USA, 2015; p. 36. [Google Scholar]
  8. Almugren, N.; Alshamlan, H. A Survey on Hybrid Feature Selection Methods in Microarray Gene Expression Data for Cancer Classification. IEEE Access 2019, 7, 78533–78548. [Google Scholar] [CrossRef]
  9. Li, J.; Cheng, K.; Wang, S.; Morstatter, F.; Trevino, R.P.; Tang, J.; Liu, H. Feature Selection: A Data Perspective. ACM Comput. Surv. 2017, 50, 94:1–94:45. [Google Scholar] [CrossRef] [Green Version]
  10. Lazar, C.; Taminau, J.; Meganck, S.; Steenhoff, D.; Coletta, A.; Molter, C.; de Schaetzen, V.; Duque, R.; Bersini, H.; Nowe, A. A survey on filter techniques for feature selection in gene expression microarray analysis. IEEE/ACM Trans. Comput. Biol. Bioinform. 2012, 9, 1106–1119. [Google Scholar] [CrossRef]
  11. Sheikhpour, R.; Sarram, M.A.; Sheikhpour, R. Particle swarm optimization for bandwidth determination and feature selection of kernel density estimation based classifiers in diagnosis of breast cancer. Appl. Soft Comput. 2016, 40, 113–131. [Google Scholar] [CrossRef]
  12. Fan, X.; Sayers, W.; Zhang, S.; Han, Z.; Ren, L.; Chizari, H. Review and Classification of Bio-inspired Algorithms and Their Applications. J. Bionic Eng. 2020, 17, 611–631. [Google Scholar] [CrossRef]
  13. Fister, I., Jr.; Yang, X.-S.; Fister, I.; Brest, J.; Fister, D. A Brief Review of Nature-Inspired Algorithms for Optimization. Elektrotehniski Vestn./Electrotech. Rev. 2013, 80, 116–122. [Google Scholar]
  14. Applying Grey Wolf Optimizer-Based Decision Tree Classifer for Cancer Classification on Gene Expression Data | IEEE Conference Publication | IEEE Xplore. Available online: https://0-ieeexplore-ieee-org.brum.beds.ac.uk/document/7365818 (accessed on 17 April 2021).
  15. Yang, X.-S. A New Metaheuristic Bat-Inspired Algorithm. In Nature Inspired Cooperative Strategies for Optimization (NICSO 2010); González, J.R., Pelta, D.A., Cruz, C., Terrazas, G., Krasnogor, N., Eds.; Springer: Berlin/Heidelberg, Germany, 2010; pp. 65–74. [Google Scholar]
  16. Dankolo, N.; Radzi, N.; Sallehuddin, R.; Mustaffa, N. Hybrid Flower Pollination Algorithm and Support Vector Machine for Breast Cancer Classification. J. Technol. Manag. Bus. 2018, 5, 1. [Google Scholar] [CrossRef] [Green Version]
  17. A Simple and Efficient Artificial Bee Colony Algorithm. Math. Probl. Eng. 2013, 2013, 526315. Available online: https://www.hindawi.com/jour-nals/mpe/2013/526315/ (accessed on 3 December 2020).
  18. Tyagi, B.; Mishra, R.; Bajpai, N. Machine Learning Techniques to Predict Autism Spectrum Disorder. In Proceedings of the 2018 IEEE Punecon, Pune, India, 30 November–2 December 2018; pp. 1–5. [Google Scholar] [CrossRef]
  19. Chinnaiyan, R. Optimized Machine Learning Classification Approaches for Prediction of Autism Spectrum Disorder. Ann. Autism. Dev. Disord. 2020, 1, 1–6. [Google Scholar]
  20. ALARIFI, H.S.; YOUNG, G.S. Using multiple machine learning algorithms to predict autism in children. In Proceedings of the International Conference on Artificial Intelligence (ICAI). The Steering Committee of The World Congress in Computer Science, Computer Engineering and Applied Computing (WorldComp), Las Vegas, NV, USA, 30 July–2 August 2018; pp. 464–467. [Google Scholar]
  21. Oh, D.H.; Kim, I.B.; Kim, S.H.; Ahn, D.H. Predicting Autism Spectrum Disorder Using Blood-based Gene Expression Signatures and Machine Learning. Clin. Psychopharmacol. Neurosci. 2017, 15, 47–52. [Google Scholar] [CrossRef]
  22. Sudha, V.P.; Vijaya, M.S. Machine Learning-Based Model for Identification of Syndromic Autism Spectrum Disorder. In Integrated Intelligent Computing, Communication and Security; Krishna, A.N., Srikantaiah, K.C., Naveena, C., Eds.; Springer: Singapore, 2019; Volume 771, pp. 141–148. [Google Scholar]
  23. Asif, M.; Martiniano, H.F.M.C.M.; Vicente, A.M.; Couto, F.M. Identifying disease genes using machine learning and gene functional similarities, assessed through Gene Ontology. PLoS ONE 2018, 13, e0208626. [Google Scholar] [CrossRef] [Green Version]
  24. Katuwal, G.J.; Cahill, N.D.; Baum, S.A.; Michael, A.M. The predictive power of structural MRI in Autism diagnosis. In Proceedings of the 2015 37th Annual International Conference of the IEEE Engineering in Medicine and Biology Society (EMBC), Milan, Italy, 25–29 August 2015; pp. 4270–4273. [Google Scholar] [CrossRef]
  25. Selvaraj, S.; Palanisamy, P.; Parveen, S. Monisha. Autism Spectrum Disorder Prediction Using Machine Learning Algorithms. In Computational Vision and Bio-Inspired Computing; Smys, S., Tavares, J.M.R.S., Balas, V.E., Iliyasu, A.M., Eds.; Springer International Publishing: Cham, Switzerland, 2020; Volume 1108, pp. 496–503. [Google Scholar]
  26. Hossain, M.D.; Kabir, M.A.; Anwar, A.; Islam, M.Z. Detecting Autism Spectrum Disorder using Machine Learning. arXiv 2020, arXiv:2009.14499. [Google Scholar]
  27. Samy, N.; Fathalla, R.; Belal, N.A.; Badawy, O. Classification of Autism Gene Expression Data Using Deep Learning. Intelligent Data Communication Technologies and Internet of Things 2019, 583–596. [Google Scholar]
  28. Jin, Y.; Wee, C.Y.; Shi, F.; Thung, K.H.; Ni, D.; Yap, P.T.; Shen, D. Identification of infants at high-risk for autism spectrum disorder using multiparameter multiscale white matter connectivity networks. Hum. Brain Mapp. 2015, 36, 4880–4896. [Google Scholar] [CrossRef] [Green Version]
  29. Katuwal, G.J. Machine Learning Based Autism Detection Using Brain Imaging; Rochester Institute of Technology: Rochester, NY, USA, 2017. [Google Scholar]
  30. Hameed, S.S.; Hassan, R.; Muhammad, F.F. Selection and classification of gene expression in autism disorder: Use of a combination of statistical filters and a GBPSO-SVM algorithm. PLoS ONE 2017, 12, e0187371. [Google Scholar] [CrossRef] [Green Version]
  31. Latkowski, T.; Osowski, S. Developing Gene Classifier System for Autism Recognition. In Advances in Computational Intelligence; Springer: Cham, Switzerland, 2015; pp. 3–14. [Google Scholar] [CrossRef]
  32. Chen, C.P.; Keown, C.L.; Jahedi, A.; Nair, A.; Pflieger, M.E.; Bailey, B.A.; Müller, R.A. Diagnostic classification of intrinsic functional connectivity highlights somatosensory, default mode, and visual regions in autism. NeuroImage Clin. 2015, 8, 238–245. [Google Scholar] [CrossRef] [PubMed] [Green Version]
  33. Thomas, R.M.; Gallo, S.; Cerliani, L.; Zhutovsky, P.; El-Gazzar, A.; van Wingen, G. Classifying Autism Spectrum Disorder Using the Temporal Statistics of Resting-State Functional MRI Data With 3D Convolutional Neural Networks. Front. Psychiatry 2020, 11, 440. [Google Scholar] [CrossRef] [PubMed]
  34. Dvornek, N.C.; Ventola, P.; Duncan, J.S. Combining phenotypic and resting-state fMRI data for autism classification with recurrent neural networks. In Proceedings of the 2018 IEEE 15th International Symposium on Biomedical Imaging (ISBI 2018), Washington, DC, USA, 4–7 April 2018; pp. 725–728. [Google Scholar] [CrossRef]
  35. Dashtban, M.; Balafar, M.; Suravajhala, P. Gene selection for tumor classification using a novel bio-inspired multi-objective approach. Genomics 2018, 110, 10–17. [Google Scholar] [CrossRef] [PubMed]
  36. Musheer, R.; Verma, C.K.; Srivastava, N. Dimension reduction methods for microarray data: A review. AIMS Bioeng. 2017, 4, 179–197. [Google Scholar] [CrossRef]
  37. Introduction to Data Science: A Python Approach to Concepts, Techniques and Applications. 2017. Available online: https://www.worldcat.org/title/introduction-to-data-science-a-python-approach-to-concepts-techniques-and-applications/oclc/986740318 (accessed on 17 April 2021).
  38. UCI Machine Learning Repository: Autistic Spectrum Disorder Screening Data for Children Data Set. Available online: https://archive.ics.uci.edu/ml/datasets/Autistic+Spectrum+Disorder+Screening+Data+for+Children++ (accessed on 2 December 2020).
  39. ASD. Autism Spectrum Disorder Tests App. Available online: http://www.asdtests.com/ (accessed on 2 December 2020).
  40. National Center for Biotechnology Information. Available online: https://0-www-ncbi-nlm-nih-gov.brum.beds.ac.uk/ (accessed on 18 November 2020).
Figure 1. Bio-inspired algorithms.
Applsci 12 03812 g001
Figure 2. The general framework of the proposed models.
Applsci 12 03812 g002
Figure 3. Comparison of accuracy between proposed models on PBC dataset.
Applsci 12 03812 g003
Figure 4. Comparison of accuracy between proposed models on the GE dataset.
Applsci 12 03812 g004
Figure 5. Comparison of F1 score results between proposed models on PBC dataset.
Applsci 12 03812 g005
Figure 6. Comparison of F1 score results between proposed models on the GE dataset.
Applsci 12 03812 g006
Figure 7. ROC curves of the proposed models on the GE dataset.
Applsci 12 03812 g007
Figure 8. ROC curves of the proposed models on the PBC dataset.
Applsci 12 03812 g008
Figure 9. Comparison of accuracy between Experiment 1 and Experiment 2 on the PBC dataset.
Applsci 12 03812 g009
Figure 10. Comparison of accuracy between Experiment 1 and Experiment 2 on GE dataset.
Applsci 12 03812 g010
Table 1. ASD prediction using ML without FS.
Data TypeRefML ClassifierClassification Accuracy
PBC[18]KNN
LR
SVM
LDA
NB
67.5%
72%
70.5%
72.2%
70.7%
[5]K-NN
SVM
RF
86.8%
90.9%
99.5%
[19]K-NN
LR
RF
69.2%
68.60%
67.78%
[20]RF
SVC
55%
62%
GE[21]SVM
K-NN
LDA
93.7%
93.8%
68.8%
[22]DT
SVM
98%
96%
[23]RF80%
MRI Images[24]RF59%
Table 2. ASD prediction using ML with simple FS.
Data TypeRefFSML ClassifierClassification Accuracy
PBC[25]Chi Square
RFE
CFS
IG
BT
RT94.9%
95.2%
93.5%
95.1%
95.7%
[26]Relief AttributeSMO100%
GE[27]IGDT
K-NN
NB
53.3%
83.3%
86.67%
MRI Images[28]t-test filter
LASSO logistic regression
SVM76%
[29]RFERF60%
Table 3. ASD prediction using ML with optimized FS.
Data TypeRefFSML ClassifierClassification Accuracy
PBC[3]Binary FireflyNB
SVM
K-NN
95.55%
97.95%
93.84%
GE[30](TT)+
(COR)+
(WRS)+
GBPSO
SVM92.1%
[31]GARF87%
MRI Images[32]PSOSVM
RF
81%
91%
Table 4. ASD prediction using DL.
Data TypeRefML ClassifierClassification Accuracy
GE[27]DBN98.64%
MRI Images[33]CNN63%
[34]RNN70.1%
Table 5. First Experiment Results.
Data TypePBCGE
Eva. MetrixAccF1-ScorePrecisionRecallAUCAccF1-ScorePrecisionRecallAUC
NB93.4993.094.093.093.5266.764.073.067.067.0
KNN89.0389.089.089.090.056.6657.077.057.059.9
SVM91.792.092.092.092.280.080.082.080.080.3
DT95.596.096.096.095.986.687.087.087.088.1
Table 6. Second Experiment Results.
Data TypePBCGE
Grey Wolf Optimization
AUCRecallPrecisionF1-ScoreAccAUCRecallPrecisionF1-ScoreAcc
NB97.5897.4897.8997.1497.5763.3443.046.6645.060.0
KNN96.8996.7997.2396.4296.8863.3372.058.3310062.5
SVM99.6699.6799.3310099.6999.3496.010092.6699.33
DT98.2998.1698.5497.8598.2780.083.3381.6695.085.0
Flower Pollination Algorithm
NB94.8894.6194.5695.0494.8770.059.6661.6660.061.0
KNN95.5295.3395.1095.7695.5460.070.3356.6610060.0
SVM99.5699.6599.3310099.6696.6797.1495.010096.67
DT96.2195.9897.1095.096.1676.6669.3368.3375.072.5
Bat Algorithm
NB97.6097.5098.6196.4797.5763.3343.3350.040.057.5
KNN93.1492.8293.6392.8593.0956.6668.3353.3310055.0
SVM98.9798.7898.0110099.097.4397.3397.3397.3397.34
DT96.2295.8397.7594.2296.1189.9991.6693.3395.092.0
Artificial Bee Colony
NB95.5495.0297.9092.8595.4256.6648.3355.045.052.5
KNN98.2798.2297.9098.5798.2853.3366.6751.6610052.5
SVM98.6398.6198.0899.2898.6696.6696.010093.3396.67
DT97.7397.8998.0697.8597.9293.3394.6691.6610092.5
Table 7. Final optimal features.
Data TypeBefore
Optimized
FS
After Optimized FS
Algorithm
GWOFPABAABC
PBC20613412
GE43,93115,39221,71421,55621,469
Table 8. Comparison between the proposed models and previous work [3] on the PBC dataset.
Previous Work [3]Proposed Models
FA-SVMGWO-SVMFPA-SVMBA-SVMABC-SVM
Accuracy97.95%99.66%99.5%98.9%98.63%
Table 9. Comparison between the proposed models and previous work [27] on the GE dataset.
Previous Work [27]Proposed Models
DBN-IGGWO-SVMFPA-SVMBA-SVMABC-SVM
Accuracy98.64%99.34%96.6%97.4%96.66%
Table 10. Comparison between the proposed models and the DL-based model.
PBCGE
CNNGWO-SVMCNNGWO-SVM
Accuracy98.64%99.66%99.98%99.34%
Publisher’s Note: MDPI stays neutral with regard to jurisdictional claims in published maps and institutional affiliations.

