
Metal Release Mechanism and Electrochemical Properties of Lix(Ni1/3Mn1/3Co1/3)O2

Department of Chemistry, University of Iowa, Iowa City, IA 52240, USA
*
Author to whom correspondence should be addressed.
Appl. Sci. 2022, 12(8), 4065; https://0-doi-org.brum.beds.ac.uk/10.3390/app12084065
Submission received: 20 February 2022
/
Revised: 1 April 2022
/
Accepted: 11 April 2022
/
Published: 18 April 2022
(This article belongs to the Special Issue Complex Oxides: Freestanding, Interfaces, and Tunnel Junctions)
Abstract
:Complex metal oxides (CMOs) are used broadly in applications including electroreactive forms found in lithium-ion battery technology. Computational chemistry can provide unique information about how the properties of CMO cathode materials change in response to changes in stoichiometry, for example, changes of the lithium (Li) content during the charge–discharge cycle of the battery. However, this is difficult to measure experimentally due to the small cross-sectional area of the cations. Outside of operational conditions, the Li content can influence the transformations of the CMO when exposed to the environment. For example, metal release from CMOs in aqueous settings has been identified as a cross-cutting mechanism important to CMO degradation. Computational studies investigating metal release from CMOs show that the thermodynamics depend on the oxidation states of lattice cations, which is expected to vary with the lithium content. In this work, computational studies track changes in metal release trends as a function of Li content in Lix(Ni1/3Mn1/3Co1/3)O2 (NMC). The resulting dataset is used to construct a random forest tree (RFT) machine learning (ML) model. A modeling challenge in delithiation studies is the large configurational space to sample. Through investigating multiple configurations at each lithium fraction, we find structural features associated with favorable energies to chemically guide the identification of relevant structures and adequately predict voltage values.

1. Introduction
The technological advance from single use alkaline batteries to rechargeable Li-ion batteries is beneficial in terms of sustainability [1,2]. The cathodes used in Li-ion batteries are typically made from complex metal oxides (CMOs). The prototypical cathode material is LiCoO2 (LCO) of the delafossite structure type, and is found in a wide range of electrical devices, including cellphones, computers and cars [3]. Recently, there has been a surge in the production of electronic devices, resulting in an increased amount of cathode material being generated [3]. While the Li-ion battery lasts for multiple charge cycles, eventually the material degrades and loses function. Unfortunately, there are not sufficient incentives in place to dispose of these materials properly, nor are there cost-effective ways to enable recycling [4]. Thus, the spent and disposed LCO (and related CMO cathode materials) can ultimately be exposed to the environment [3]. One additional concern is the that average life expectancy of newer electronic devices has decreased over the years and this contributes to the amount of disposed cathode material [3].
The sustainability of LCO can be viewed through two considerations. Firstly, cobalt is not Earth abundant, which makes it a very expensive transition metal (that also happens to be sourced in countries of political instability) [5]. Secondly, when exposed to aqueous settings, Co can leach out of LCO to form aqueous cations that have been shown to be toxic to aquatic organisms [6,7]. This has led to research investigating new transition metal compositions that reduce the amount of cobalt needed for a functional cathode in Li-ion battery technology. The development of Li(Ni1/3Mn1/3Co1/3)O2 (NMC) is an improved cathode material where Ni and Mn are more abundant, reducing the cost to make this material. Another benefit of this composition is that charge cycling is improved, allowing the material to last longer [1,8].
As with LCO, NMC also undergoes partial dissolution in aqueous conditions. It has been shown that equistoichiometric NMC releases metal cations in amounts ranking Ni > Co > Mn. The released cobalt poses the most significant adverse biological impact, as its release from the NMC is shown to kill the model organisms daphnid and schwenella [6,9]. In our previous work, a combined computational chemistry and thermodynamics methodology was established, capturing the salient trends of the experimental studies and used to investigate Ni-rich and Mn-rich compositions of NMC. This work found that the oxidation state of transition metals plays key role on metal release [10,11,12,13]. When equal amounts of Ni, Mn, and Co are present in NMC, the charge balance dictates the nominal oxidation states to be 2+, 3+, and 4+, respectively. In the case of Ni-rich NMC, Ni is taking the place of Co3+ and Mn4+, as verified through electronic structure calculations. As a result, some of the Ni in Ni-rich NMC oxidizes to maintain a charge balanced structure. Ni then forms stronger bonds with lattice oxygen, increasing the stability of Ni in the CMO and hindering metal release in water. The opposite effect was seen for Mn-rich compositions where some of the Mn (present and particularly stable as Mn4+ in the octahedral environment of equistoichiometric NMC) reduced to form Mn2+. In another work, this dissolution model examined different sized supercells of LiCoO2 to determine the threshold of metal release under given pH conditions, providing a better understanding of why these materials do not fully dissolve [13]. This model also examined metal release trends influenced by the strength of anions present in the lattice and metal connectivity, gaining further insights into the features governing release favorability [14]. An additional governing factor that was observed when investigating metal release from newly proposed formulations of ternary CMOs was the spin paring in the lattice where formulations that have poor anti-ferromagnetic spin coupling of the surface metals lead to a more favorable metal release [15]. In summary, our previous work conducted in close collaboration with experimentalists demonstrates the success of the modeling methodology to capture experimentally observed trends in metal release and the ability to connect the energetic trends to governing chemical properties, such as the oxidation states of transition metals in the CMOs.
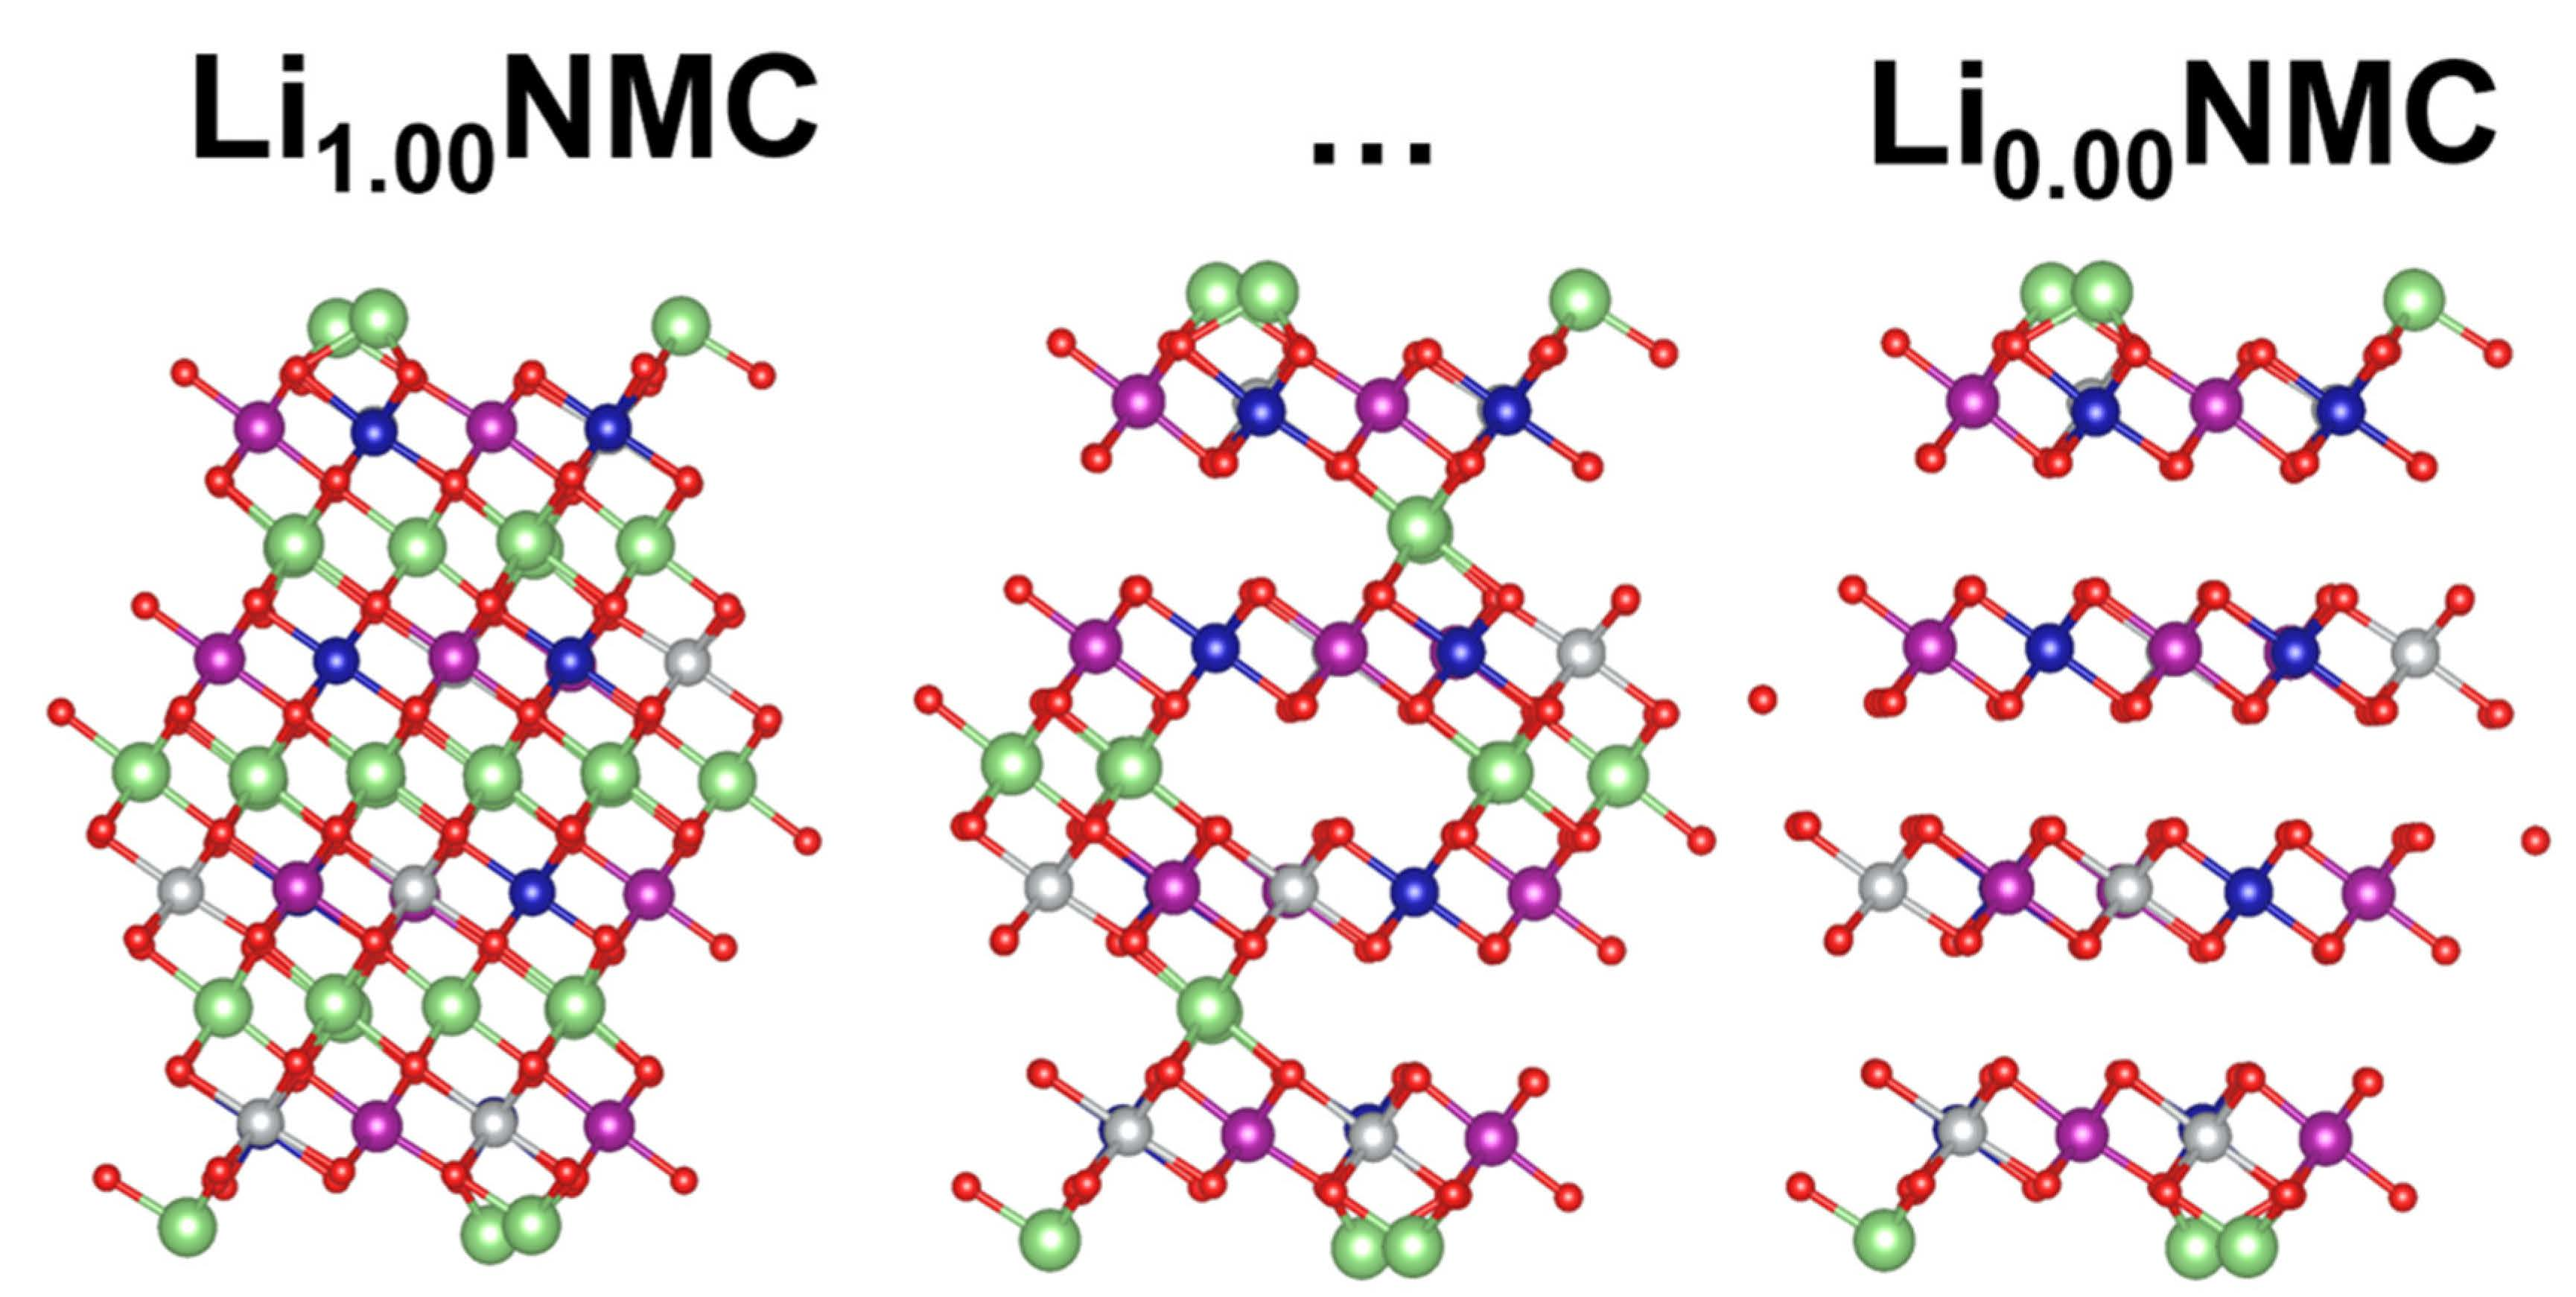
In all the previous computational studies of metal release from CMOs, a fully lithiated stoichiometry was considered [10,11,12,13,15]. We refer to the fractional content of Li in the CMO as Lix, and for the remainder of the paper use “NMC” to denote the equistoichiometric material with variable Li content as Lix(Ni1/3Mn1/3Co1/3)O2. A side view ball-and-stick representation of NMC is shown in the computational methods section, which also shows the Li intercalation layers interspacing the transition metal oxide layers in the delafossite structure. To better relate to realistic materials, it is important for the modeling work to capture that ideal Li content that is hardly, if not ever, achieved. This component should be considered for CMO reactivity, such as metal release, because: (1) The operation of the Li-ion battery is redox driven, and changes in Lix alter the oxidation states of the lattice transition metals. The metal oxidation state has been shown to be a thermodynamic driving force for metal release and relates broadly to CMO stability and reactivity. (2) Batteries can be disposed of at any given charge state, which means the CMOs present in electronic waste exhibit variable Lix. (3) Finally, experimental techniques cannot easily quantify Lix due to its small size in dissolution studies. However, synthesis conditions are known to lead to variations in Lix [6,10].
Metal release is a cross-cutting mechanism that has importance and implications beyond environmental and biological impacts. For example, the standard synthesis procedure for CMOs includes conditions where relative humidity can cause metal release and Li loss, leading to decreased cathode functionality [16,17]. Limited experimental research has been conducted at the electrode level due to the sensitivity of measurements required to detect Li in the lattice [18]. This is an excellent avenue for modeling due to its atomistic control of the structure where we can remove individual Li atoms to see how transition metal oxidation states and release values change.
In considering variable Lix, it is expected that removal of a Li atom from the inner layers of NMC is accompanied by the oxidation of a lattice transition metal. Equistoichiometric NMC has oxidative events that occur in thirds of the Li fractions where Ni2+/Ni3+ is over the Li fractions Li1.00→Li0.66 followed by Ni3+/Ni4+ over the next third and finally Co3+/Co4+ [19]. To understand how Li content relates to cathode functionality, we follow on previous computational approaches to calculate redox potentials for transition metals and voltage profiles [12,20,21,22,23,24,25].
The details of the calculation of the lithium intercalation voltage, V, are given in Equation (1). Equation (1) uses the calculated total energies (E) of (NMC) at two different farctional values (a and b, where a > b) of x, referred to as LiaNMC and LibNMC. The numerator can be interpreted as the change in energy for removing some number of Li atoms from NMC. E(Li(s)) is the energy of a single bulk metal Li atom, which is multiplied by the number of Li atoms removed between the two structures, represented by (a − b). The quantity (a − b), thus, also represents the compensating number of electrons involved in the delithiation, which appears in the denominator multiplied by Faraday’s constant:
Previous modeling studies detailing the voltage profile of cathode materials typically use small (<6 Li atom) single metal oxide bulk structures where the removal of a single Li atom results in a 16.67% vacancy. A more realistic, but computationally more prohibitive, approach uses a bulk supercell involving more Li atom sites, allowing for model geometries with different/lower vacancy densities. However, this introduces multiple unique ways (configurations) to remove Li for a given Lix. Previous studies that looked at the voltage profile do not sample all configurations, nor discuss the selection of configurations. Typically, a non-exhaustive subset of possible configurations are tested and the one with the lowest energy is used in the voltage calculations. The exploration of the full configurational space would result in large datasets. For such large datasets, efforts to associate calculated trends with underlying reactivity descriptors tend to require machine learning algorithms [26,27].
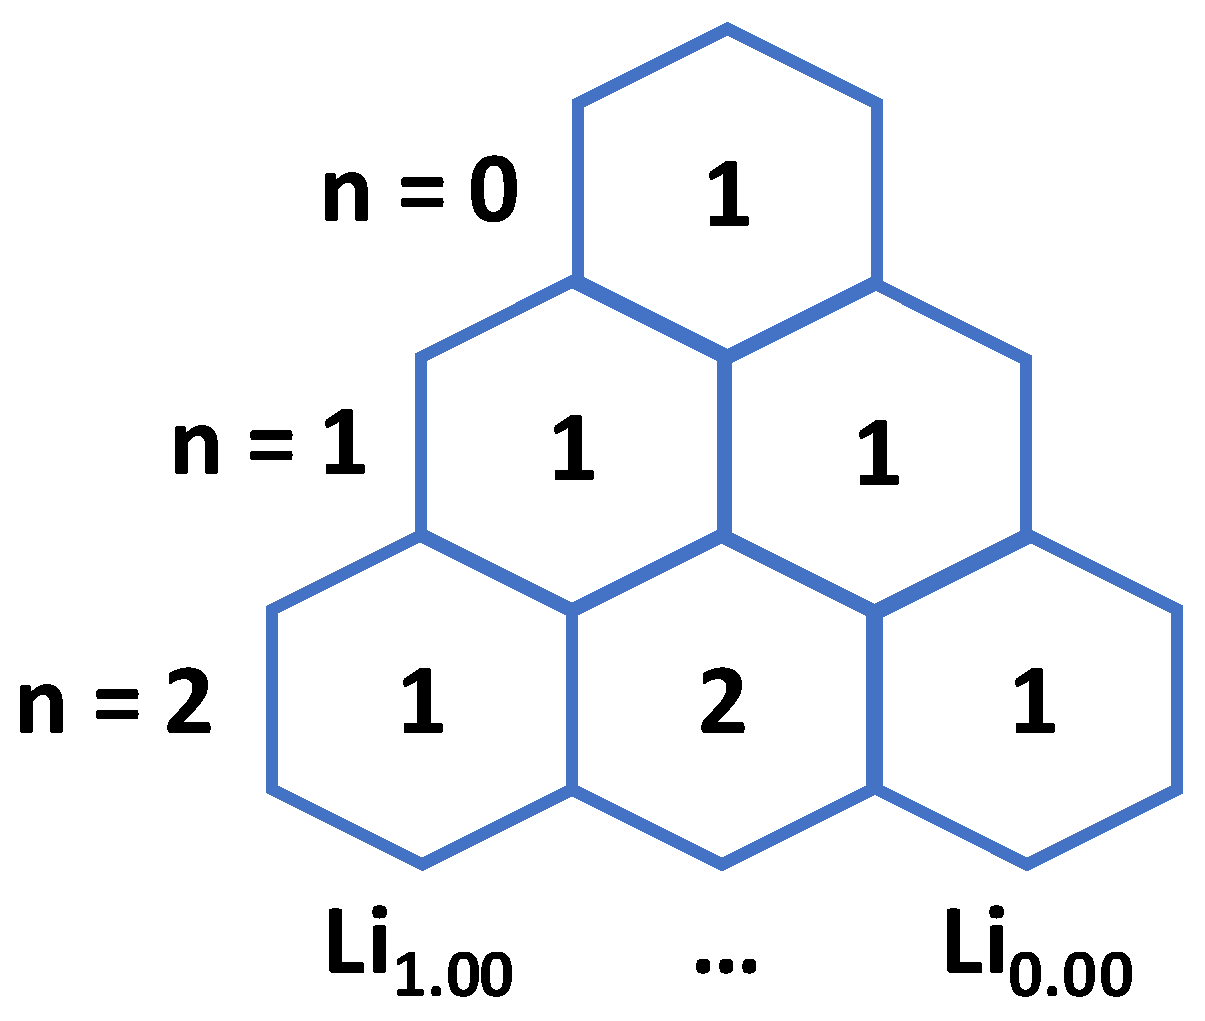
The total number of possible configurations for modeling the charge cycle of a material with n lithium sites follows Pascal’s triangle. Using Figure 1 as an example: The rows give the total number of lithium atoms in the fully lithiated structure, starting with 0, and the sum of the rows give the total number of lithium configurations over a charge cycle. For a material with zero lithium atoms, the Li fraction cannot be changed, so there is only one configuration. For a material with one lithium atom, the structure can either be fully lithiated or delithiated; thus, there is one possible configuration for each. Given 2n scaling, a structure with two Li atoms has four total configurations. Figure 1 also shows how the configurational space is the largest when approaching Li0.50 where this is an even number of Li and vacancy sites allowing for the most rearrangement. When the total number of Li atoms is sufficiently large, it is not feasible to compute all possible configurations. For example, in this study, the NMC surface supercell employed has 18 Li atoms in the fully occupied intercalation layers, which gives a total of 262,144 possible Li configurations. Of course, this mathematical framework does not consider the local chemical environment. To form a chemically guided approach to predicting the most stable Li configurations for a given Li faction, it is first necessary to obtain energetic information (from computational chemistry) for an adequate sampling of the configuration space. From that information, it may be possible to identify key descriptors (aspects of geometry or electronic structure that govern energetic trends) such that a reduced sampling can capture the relevant configurations.
In addition to Lix, it is also important to consider the energy barrier, Eb, for the Li diffusion in the CMO. The values of Eb are computationally tractable, and there are two known pathways in the delafossite structure [20,28,29,30,31,32,33]. At higher lithium concentrations, the octahedral site mechanism is taken, forcing lithium to pass between two oxygen atoms. Once lithium vacancies are present, a lower energy path is available where lithium can move around the oxygen atom by tetrahedral site hopping [8]. The diffusion pathway has been shown to play a key role in determining the recharge rate of the cathode. In the present study, the values of the diffusion energy barriers are used to interpret relative energies and energy ranges calculated in the configurational space of NMC structures with varying Lix.
This study investigates the role the charge state (via the Li content) and configuration (via the Li arrangement in the lattice) on the stability of NMC materials. The process of metal release from NMC under aqueous conditions is ubiquitous across environmental, synthetic, and other CMO processes, and has been shown to depend intimately on the oxidation states of the lattice metal cations. As Li content will also tune the oxidation states of metals in NMC, metal release is selected to further explore how Lix then influences transformations in the oxide. We employ the density functional theory (DFT) + Solvent Ion model used in our previous metal release studies to compute metal release favorability and connect trends in energy to changes in the layer spacings and transition metal electronic structures. The supercell surface slab model used here has many lithium sites, resulting in a large possible number of configurations for the intermediate values of Lix. The resulting large dataset can then train a ML model. NMC is the material used in this study as it has been studied thoroughly and can be used to track how the incongruent release behavior of Ni, Mn, and Co shifts across Li fractions.
2. Computational Methods
DFT calculations for the bulk and surface structures were run using the open-source software, Quantum ESPRESSO [34], with the ultrasoft GBRV pseudopotential set [35] using a plane wave cutoff of 40 Ry for the wavefunction and 320 Ry for the charge density. The bulk NMC cell is a √3 × √3 R30° modification of a hexagonal LCO primitive cell, as used in our previous NMC study [12]. To obtain a structural model that can accommodate a range of Lix values, the lattice constant a was multiplied in-plane by 2 to obtain a 2√3 × √3 supercell, which has 3 O−Li−O inner-layers with 6 Li in each layer for a total of 18 Li. Experimental delithiation studies report that below Li0.45, significant structural changes in delafossite NMC occur, such as proton insertion [2,36,37] and metal displacement [38,39]. Exploratory calculations carried out below this threshold also indicated structural instability. In this study, we focused on the range Li1.00→Li0.44 for surface and metal release modeling. The bulk calculations were converged with respect to energy with a k-point grid of 6 × 6 × 2, folded down to 2 × 6 × 1 in the surface calculations. Full geometry optimizations were carried out until the forces were within 5 meV/atom. For the bulk system, atomic positions and lattice constants were optimized. The bulk optimized geometry was used as the basis for the construction of slab models, which obey inversion symmetry. Slab optimizations allowed for the full relaxation of all atomic positions, and all metal release calculations maintained the inversion symmetry of the slab.
The exposure of NMC to water and subsequent metal release followed the pathway depicted in Figure 2. When cleaved from the bulk, NMC is Li terminated, as shown in Figure 2a, and labeled as NMCLi-term. Upon exposure to water, Li is much more favorable as a Li+ cation, resulting in exchange of Li/H on the surface [9]. This results in a hydroxylated termination, as confirmed using ab initio thermodynamics of the isostructural LCO surface and extrapolated to NMC, as shown in Figure 2b, and labeled as NMCH-term [9]. Figure 2b,c depicts the release of an M−OH unit (from each side of the symmetric slab), which was found to be the preferred leaving group from the cathode surface in previous computational studies [3,9,10,11,12,15]. The resulting slab with the M−OH vacancy was labeled as NMCM-OH vacancy.
In this study, we used the DFT + Solvent Ion model approach to calculate the energy of metal release. This allows the partitioning of the overall metal release into elementary steps, such that certain terms can be calculated purely from DFT calculations. Other elementary steps describing the aqueous chemistry were separated and the associated energies were obtained from other sources, as detailed in Ref [12]. As our focus in this study was on how Lix influences metal release, our calculations started from the Li-terminated surface and thus captured the changes in variable Lix. Overall, the change in energy for the pathway depicted in going from Figure 2a,c can be expressed as:
Equation (2) follows Hess’s law of computing reaction energy differences as the sum of product energies minus the sum of reactant energy, with the factor of ½ considering the removal of 2 M-OH units related by symmetry. This approach is derived from the work of Rong and Kolpak, which details this method further [40]. Here, DFT was used to calculate the total energies of all product and reactant terms in Equation (2). The DFT total energies were converted to free energies based on zero-point energy corrections and vibrational contributions to the free energy, as detailed elsewhere [41].
The dataset of ΔG1 values obtained in this study covered the range of Lix for x = 1.00, 0.89, 0.78, 0.67, 0.56, 0.44. This dataset was well suited to then build a random forest tree (RFT) machine learning model. RFT models are a collection of decision trees that individually categorize input values, in our case, ΔG1, based on descriptors to find relationships between similar release values. RFT averages the predictions of the individual decision trees, which are corrected for any bias that may arise in a single tree. We implemented the RFT model from the “sci-kit learn” library and provide an optimization of the RFT model in the Supplementary Materials (Figure S1), where we determined how many trees and layers should be implemented. To predict ΔG1 values, we tabulated structural descriptors from the (de)lithiated surfaces, before introducing the M-OH vacancy, related to the oxidation state and magnetic moments of the surface metals. RFT can provide importance values to the descriptors, ranking which features play a larger role in controlling ΔG1. Using these importance values, we were able to reduce the number of descriptors and consider transferability between different materials; the optimization of the RFT model and descriptor selection are in the Supplementary Materials (Figure S2). The descriptors that were chosen for this model include three parameters of the vacancy site metal: the bond valance sum (BV_vac), magnetic moment (ρs) and number of valance electrons (Charge_vac) and another descriptor that considers the spin paring in the lattice, which is the sum of the magnetic moments of the six neighboring metals to the vacancy site, (Σρs).
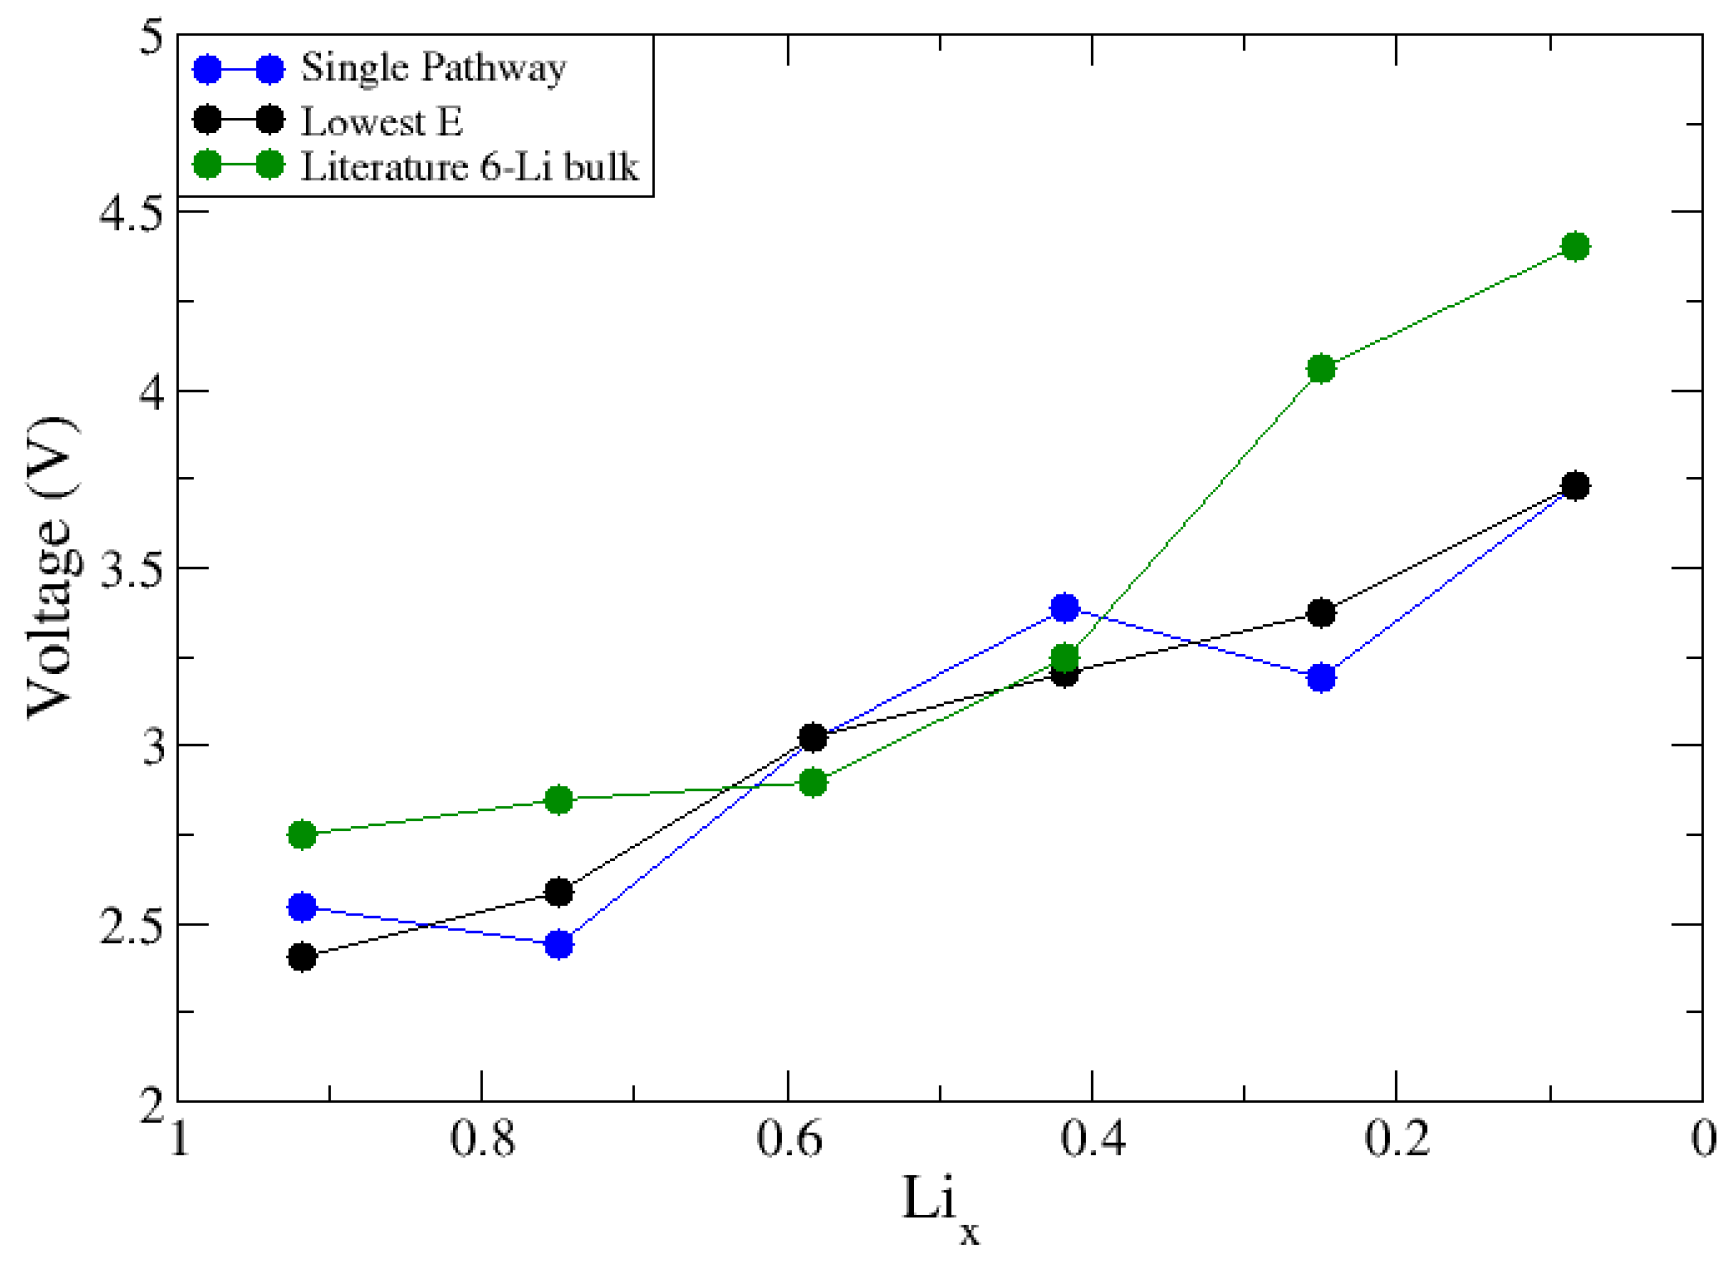
We first considered a small bulk structure with 6 Li atoms. A total of 6 Li atoms resulted in 64 total configurations that could be modeled and could calculate the intercalation voltage in 2 ways: (1) a single pathway where Li is removed from the previously delithiated structure or (2) sample all the configurations to find the lowest energy arrangement at each value of Lix. Shown in Figure 3 are the voltage curves for the 6 Li atom bulk structure using the 2 approaches, including the results of a published computational study using a 6 lithium atom structure for comparison [1]. Approach 1 involved removing an individual Li atom and using that vacancy structure to generate the next Li vacancy in a stepwise fashion. As shown in Figure 3, this leads to non-monotonic changes in the voltage curve. Ideally, we wanted to reproduce cyclic voltammetry measurements, which show monotonic increases in potential as the materials are oxidized [1,2,19,42], leading us into the results of approach 2. For approach 2, only the lowest energy configuration at each lithium fraction was used, which yields a monotonic voltage curve. Knowing this, to approach the 18-lithium atom supercell surface model, we needed to optimize a range of configurations at each lithium fraction to find the lowest energy configurations. To generate these delithiated structures, a python code was used to generate a list of all possible ways to remove Li atoms from the fully lithiated surface. At each lithium fraction, 30 configurations were randomly selected and optimized. By comparing similarities in the most energetically favorable structures, we sought to provide a further insight into how to better select delithiated structures a priori to reduce the number of configurations required for the adequate sampling of these larger sized systems across the charge cycle.
Using DFT, we calculated the range in total energy for different configurations at a given value of Lix, referred to as ΔE. To aid in the interpretation of ΔE, we tracked the locations of Li atoms throughout the slab using a radial distribution approach adapted from other computational work [24]. The distribution function is given below in Equation (3), where the radial distribution function (RDF) value, g, is equal to the probability of finding a select pair of atoms, Li—Li, at distance r-r′, where r and r′ are the coordinates of Lii and Lij, respectively. V is the volume of the cell and N − 1 is the total number of atoms minus one as to not self-count the Li atom with which we compared other Li atoms.
We took the average radial distribution function value of Li–Li for the five most favorable and most unfavorable configurations to connect patterns in distribution to thermodynamic stability. The difference between distribution of Li in the less favorable structures, g1, and distribution in favorable structures, g2, was divided by the g value of the ideal lithiation state, g′, to find the percent change in the Li distribution, %Δg, shown in Equation (4). Negative values indicate the favorable structures have more disperse lithium than the thermodynamically less favorable configurations.
3. Results and Discussion
3.1. Metal Release
The values of ΔG1 are reported in Table 1 for the five lowest energy structures at each Lix along with the standard deviation (σ) values. It was also useful to track changes in ΔG1, referred to as Δ(ΔG1). For this analysis, we reference the values of ΔG1 and Lix = 1.00 for a given metal to zero.
The ΔG1 values for all metals show an initial decrease from Lix = 1.00 to Lix = 0.88, a driving force favoring metal release. This initial change in ΔG1 is reflected in the values of Δ(ΔG1) for Lix = 0.88, shown in Figure 4, and is the greatest in the case of Ni (−1.13), followed by Co (−0.58), then Mn (−0.33). This ranking can be linked to the initial oxidation states in pristine NMC with Lix = 1.00. Specifically, in pristine NMC, Ni, Mn and Co are present in the oxidation states 2+, 4+, and 3+, respectively. The initial decrease in Lix destabilizes the lattice and causes Ni, the metal that has the lowest oxidation state (and, thus, the weakest interaction with lattice oxygen), to have the largest Δ(ΔG1) value. As Lix is further decreased, the values of ΔG1 gradually increase as the metal oxidation states increase in response to the loss of Li, resulting in stronger M−O interactions in the lattice. σ increases, moving towards Li0.50, where there are the greatest number of possible lithium configurations that could be tested and, thus, the largest range of voltage values.
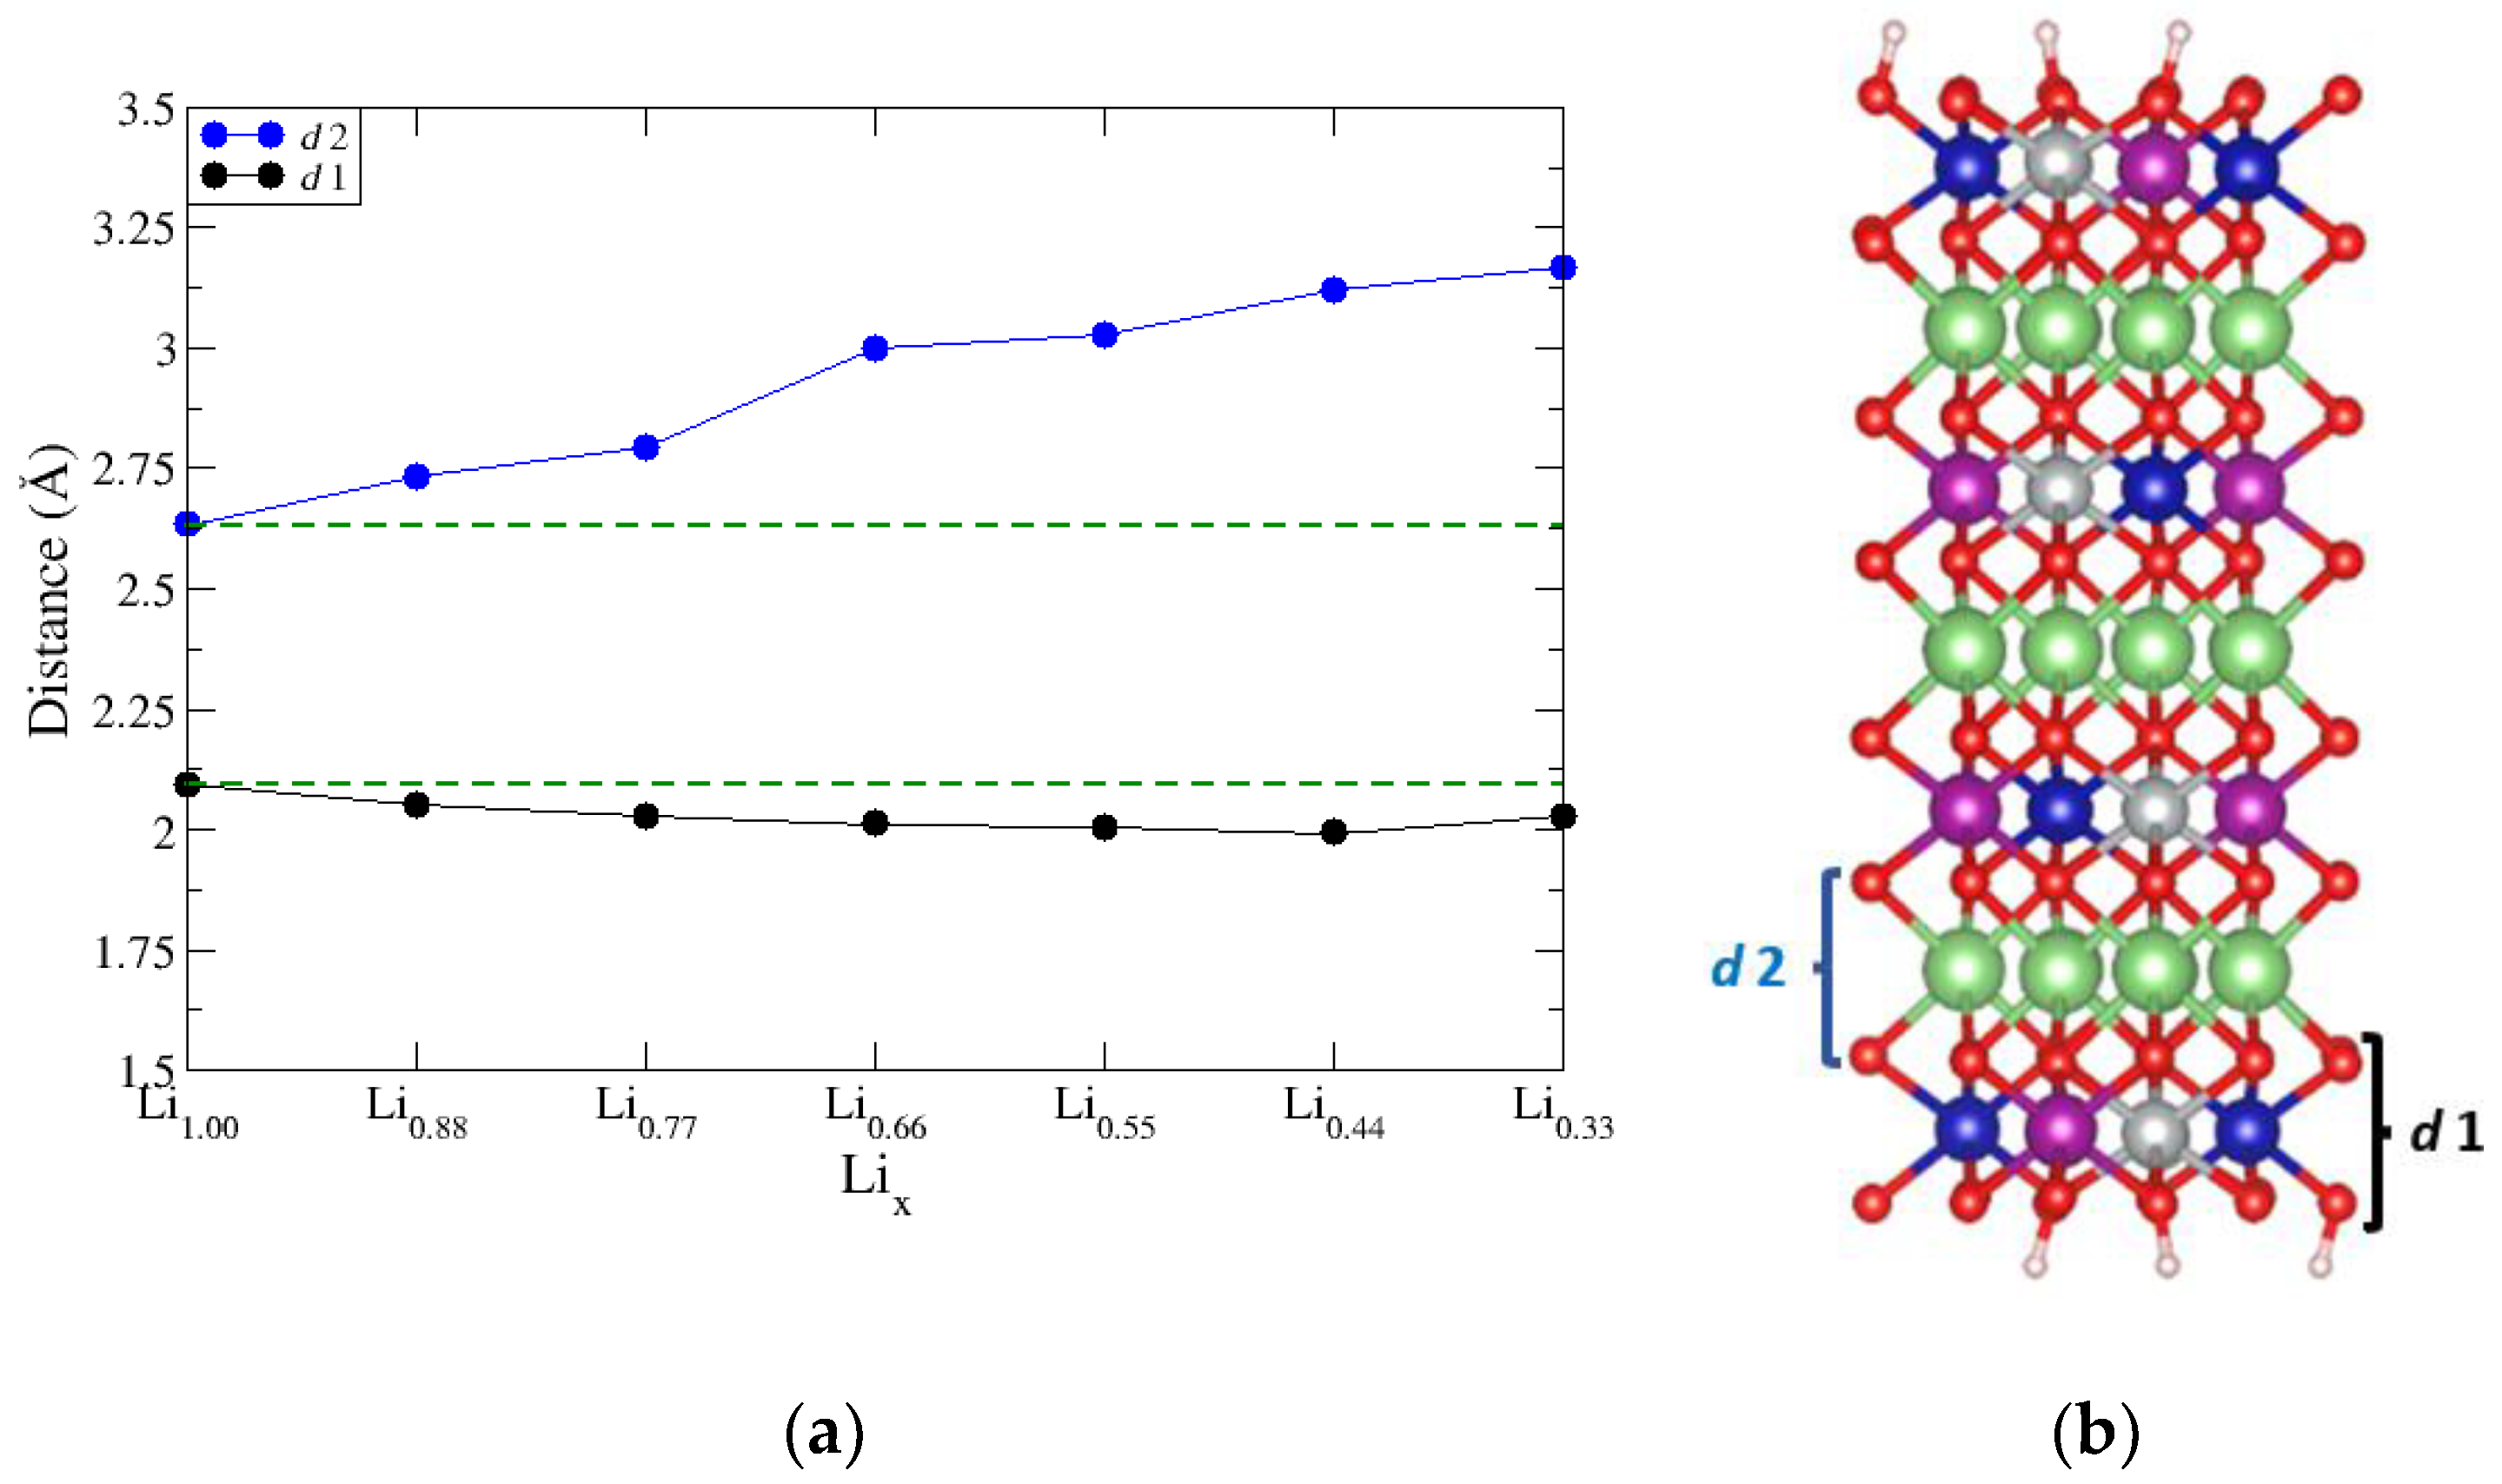
The values of Δ(ΔG1) can also be related to changes in the slab interatomic layer spacings, d, and the electronic structure of the transition metals. We monitored changes in two-layer spacings, shown in Figure 5b: d1 is defined as the average interplanar distance between the outermore metal oxide layers O–M–O of the slab and d2 is defined as the average interplanar distance between the outermost O–Li–O layer of the slab. The relationship between Δ(ΔG1) and values of d is to be expected: When Li is removed from the intercalation layers of NMC, there are changes in the values of d1 layer (Figure 5a, black curve) and the d2 (Figure 5a, blue curve). As Lix is reduced, there is a less positive charge in the intercalation layer to shield the ionized oxygen atoms from the adjacent layers. The oxygen layers experience a repulsion due to the like charges, which is manifested in increased values of d2 as Lix decreases. The values of d1 show a trend of gradual increase as Lix decreases. As expected from the functionality of a Li-ion battery, the transition metals oxidize as Li is removed from the inner layers. In equistoichiometric NMC, Ni should oxidize from Ni2+/Ni3+ between Li1.00→Li0.66 and then oxidize to Ni4+ over the next third of delithiation. Because there are only oxidation events occurring for a third of the metal atoms at any given delithiation step, it would be expected that the changes in d1 are smaller in magnitude than those of d1, as can be seen in Figure 5a.
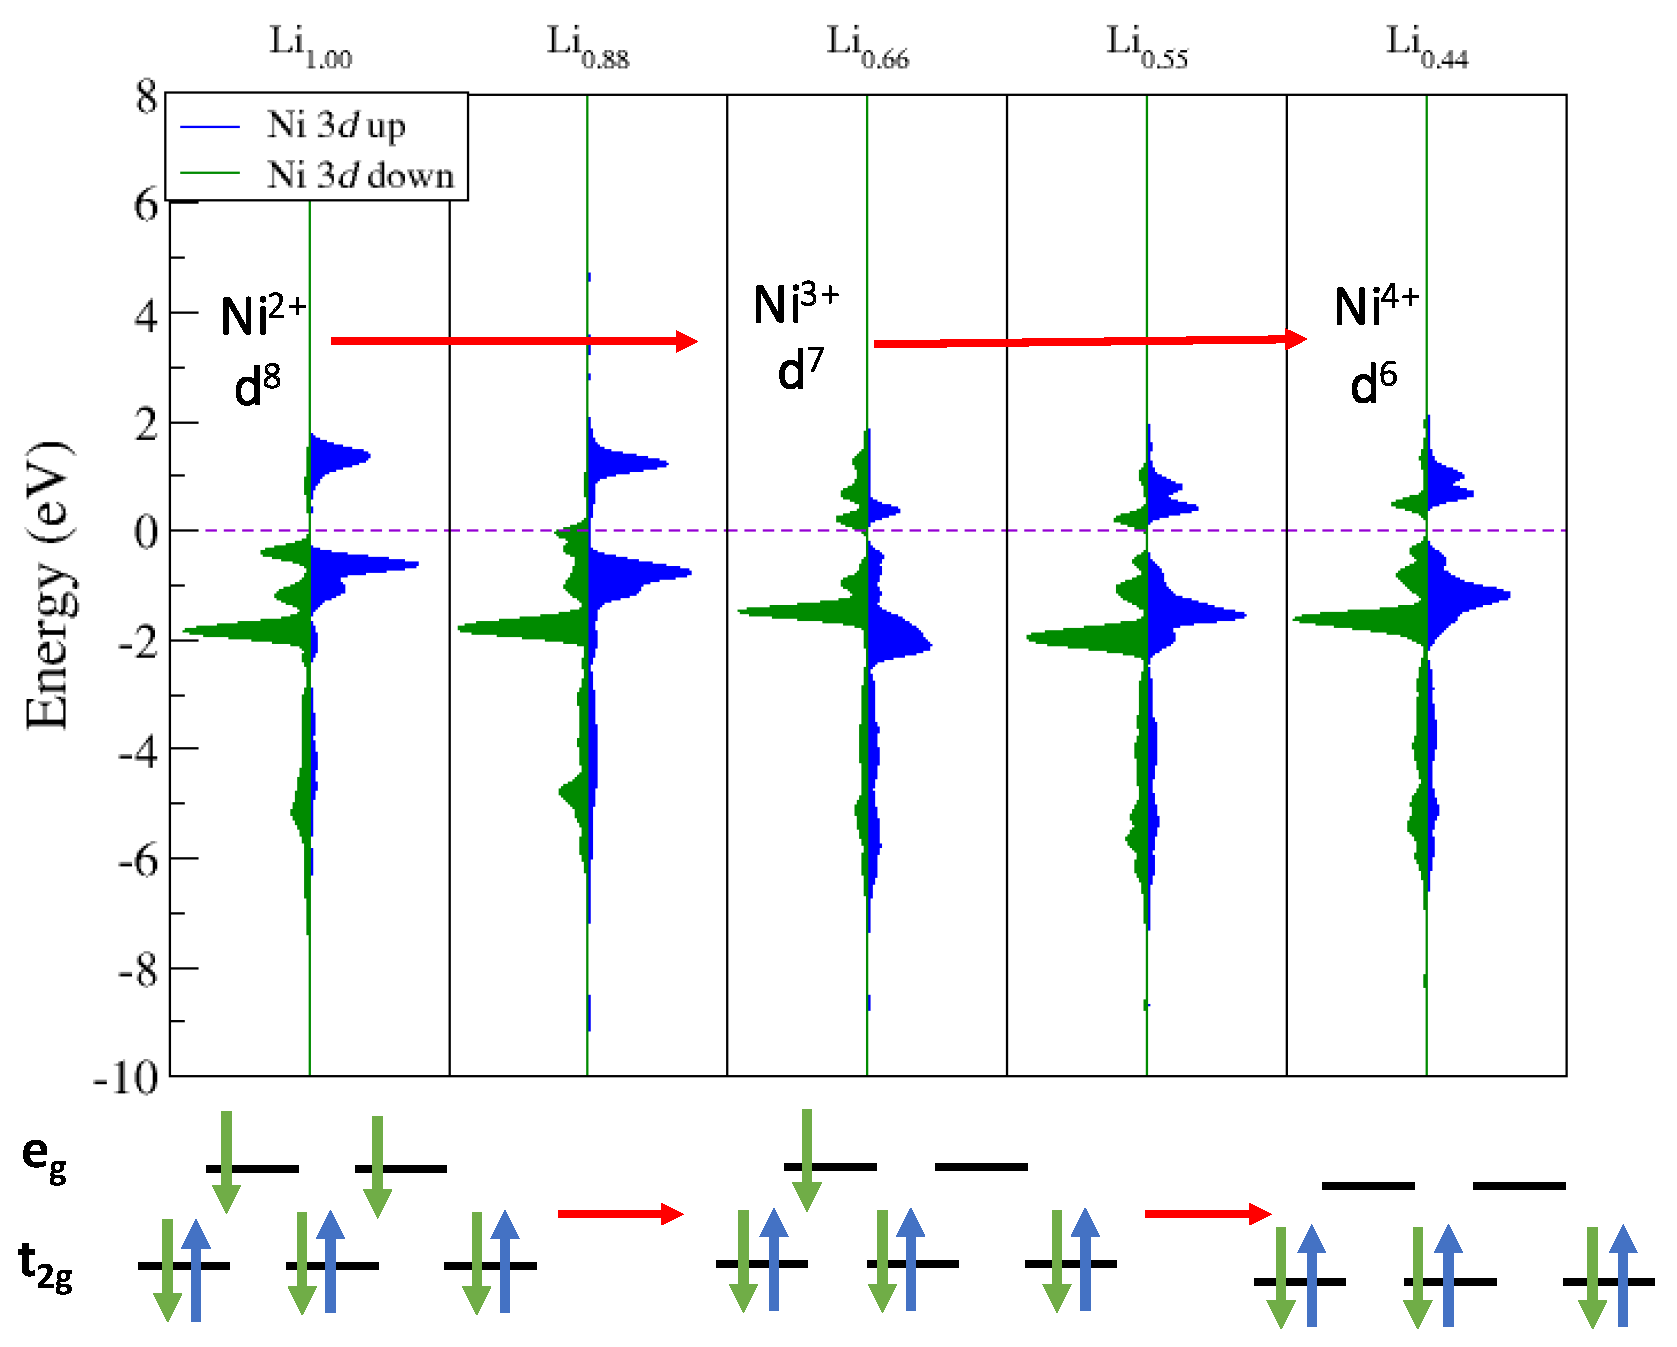
To monitor the changes in metal oxidation states, we carried out state-by-state, atom-projected density of states (PDOS) analysis, with the results plotted in Figure 6. Additionally, shown in Figure 6 are schematic d-orbital crystal field diagrams, showing how the d states of the Ni are split into three lower energy t2g orbitals and two higher energy eg orbitals. The crystal field diagrams aid in the interpretation of the DFT calculated PDOS in assigning the oxidation state of the lattice Ni as a function of Lix. We first focused on Ni over Lix values, starting from Li1.00 down to Li0.44. The plots in Figure 6 show the PDOS of the d-states for Ni as a function of Lix, with spin-down density plotted in green and spin-up in blue. At Li1.00, we observe Ni in the 2+ state where the electronic densities in the figure match the electron field split diagram of a 2+ (d8) configuration. All the d-orbitals are filled with spin-down electrons, causing all the spin-down density to fall below the Fermi energy (EF) (dashed purple line) and there is a split in the spin-up density with more being located below EF giving a d8 configuration. As Lix decreases, we observe a change in the spin-down density where some of the density moves up across EF, indicating that there are unoccupied eg orbitals. A similar PDOS analysis was performed for Co and Mn, which showed that these metals maintained the oxidation states (3+ and 4+, respectively) seen in the pristine NMC (See Figure S3). It is expected that, if Lix was lowered beyond 0.33, the changes in the oxidation state of Co would result as seen in cyclic voltammetry studies of the material [1].
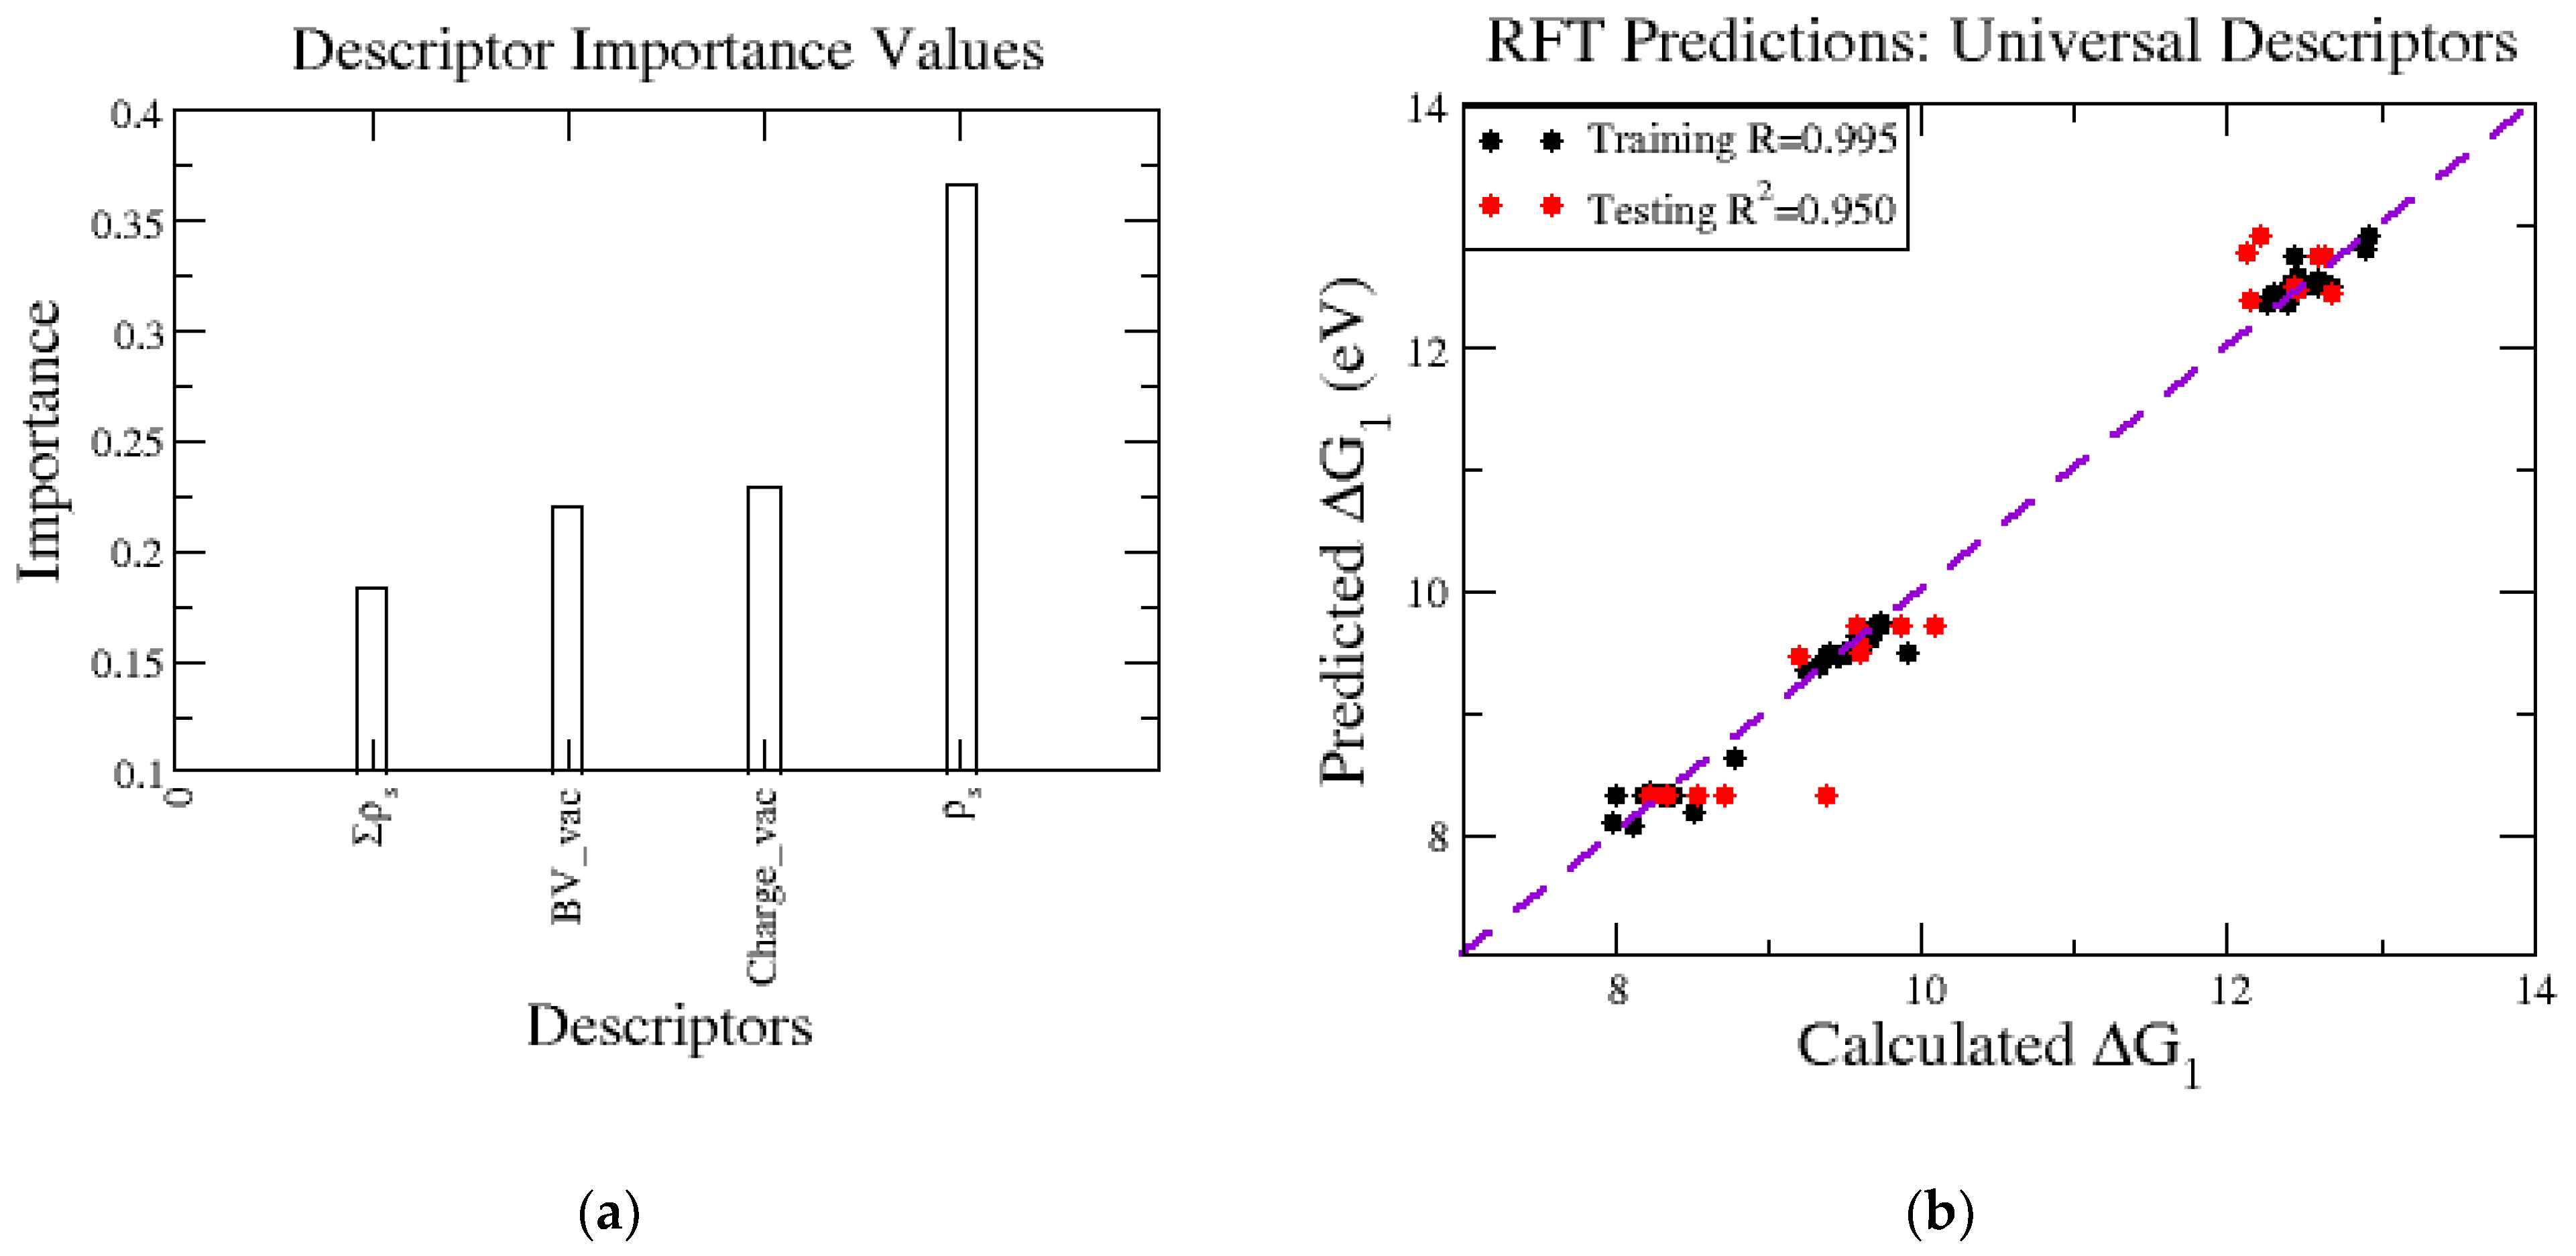
While the above analyses show that trends in ΔG1 can be interpreted in terms of slab geometry (d) and electronic structure (PDOS, oxidation state), it is the case that the level of system complexity hinders efforts to delineate the principal factors governing metal release. To this end, we employed RFT machine learning to build a model for ΔG1 based on descriptors. The initial descriptor testing is shown in the Supplementary Materials (Figure S2), which led to the selection of the four descriptors that are transferable when extending to other systems beyond Lix in NMC. The RFT model is built using two descriptors to track changes in the oxidation state, both derived from the starting (defect-free) slab. First, we used empirical bond-valence sums, referred to as BV, which are determined using the DFT optimized geometries and bond-valence parameters from the literature [43]. Briefly, in bond-valence theory, each bond between pairs of atoms contributes to BV. Bond-valence models are constructed such that the value of BV for a given atom should equal the magnitude nominal charge. Thus, in pristine NMC with Lix = 1.00, the values of BV would be 2, 3, and 4 for Ni, Co, and Mn, respectively. We denoted the value of BV for the metal atom to be removed as BV_vac. The second descriptor based on the starting slab was the calculated number of the valence electrons on the metal, (Charge_vac), which was readily obtained from the DFT output file for the optimized geometry. As mentioned in the Introduction, reviewing the metal release studies in other CMOs, another feature we linked to ΔG1 relates to the spin pairing and the vacancy-induced disruptions to it throughout the lattice. This is included in two descriptors, one being the magnetic moment of the metal to be released, (ρs) and the other is the sum of the magnetic moments of the neighboring metal atoms, (Σρs). The RFT model can assign the importance of each descriptor when predicting ΔG1, shown in Figure 7a. We observed the magnetic moment of the vacancy is the most important in the case of delithiated NMC vacancies and obtained accurate predictions, shown by a testing R2 value of 0.95 (Figure 7b). It is worth noting that remaining in the phase space of Ni1/3Mn1/3Co1/3 limits the range of ΔG1 values, shown by the tight groupings on the Ni, Mn, and Co release values, with Ni being the most favorable to release and Mn the least. This is a good starting point for descriptor selection and should be expanded to more complicated datasets with varied compositions and formulations of CMOs to obtain a large span of ΔG1 values filling in the gaps seen in Figure 7b and include additional metals other than Ni, Mn, and Co to have a predictability beyond NMC.
3.2. Voltage Modeling
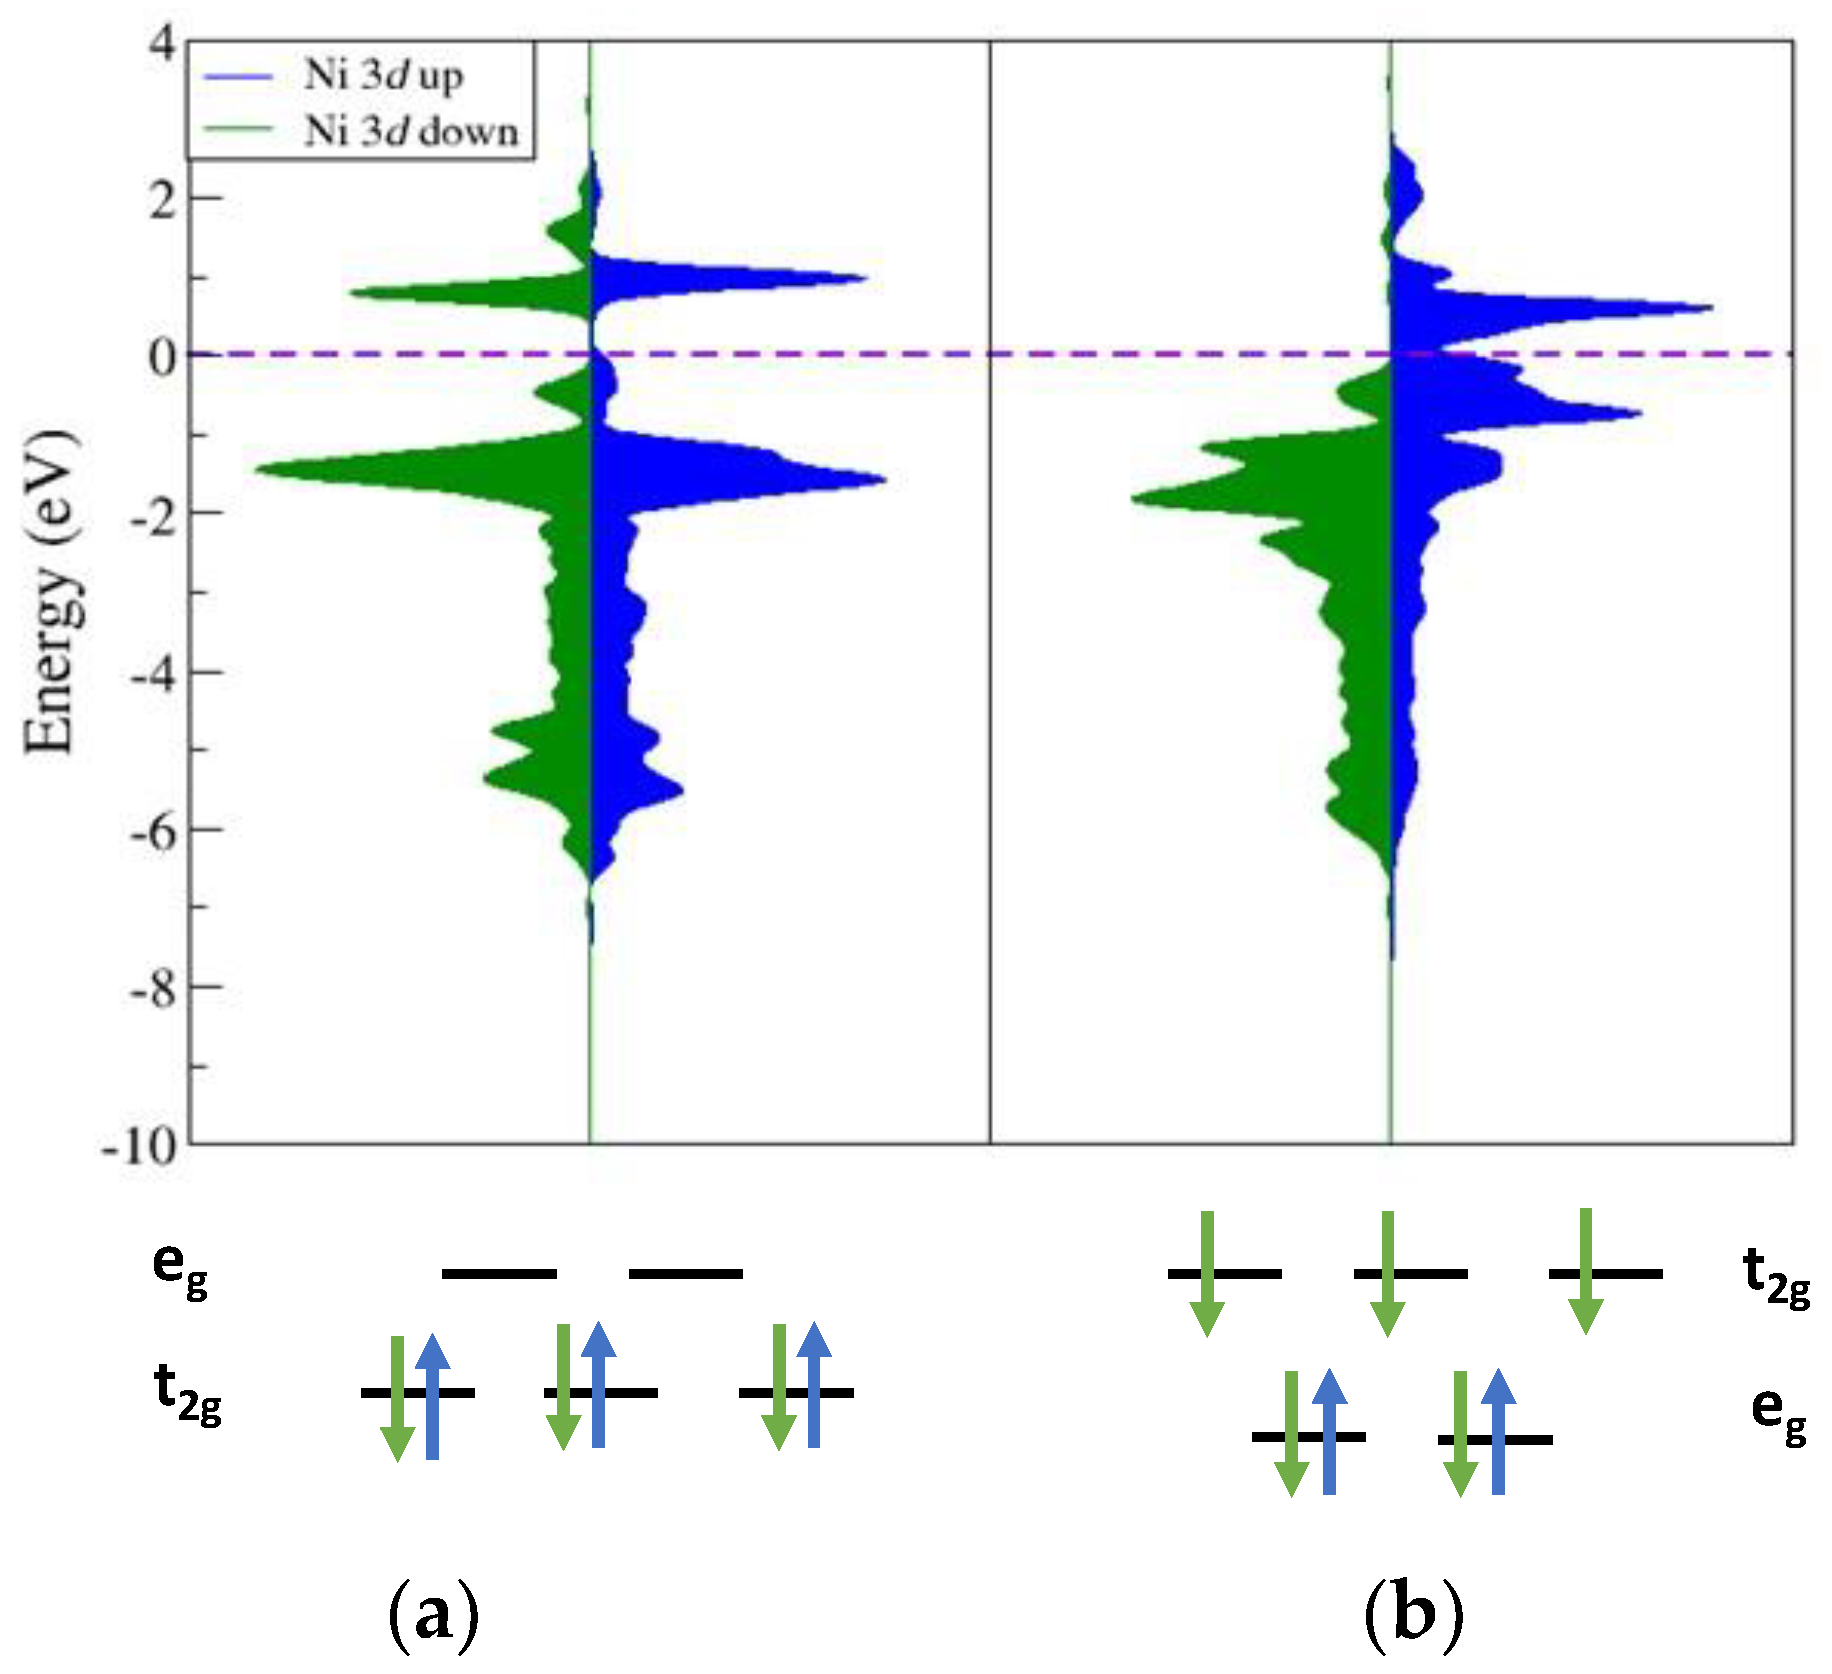
Using Equation (1), the lithium intercalation voltage, V, was calculated using the DFT total energy information for the NMC slabs as a function of Lix. As mentioned earlier, delithiating NMC beyond Li0.44 leads to lattice instabilities in the experiment. In exploratory calculations, the modeling of Lix structures in this range showed Ni displacement where Ni falls into the tetrahedral site of the lithium channel. These occurrences cause large changes in the DFT energy and non-sensical voltage predictions. This displacement of nickel is indicative of the known preference for a structural transformation of the delafossite structure into the spinel structure, causing the voltage prediction to fail. The changes in coordination environment of these Ni atoms can be tracked through calculated changes in their electronic structure using PDOS analysis. Figure 8 shows this comparison of two Ni atoms from the same structure at Lix = 0.22. The first is when Ni is in the octahedral site (Figure 8a) expected for the delafossite structure and when Ni occupies a tetrahedral site (Figure 8b). At a low value of Lix, the charge balance and redox potentials suggest that all lattice Ni will be present in the 4+ oxidation state. The octahedral PDOS shows a close match between the spin-up and spin-down spin density above and below EF, indicating a d6 configuration where there would be three up and spin-down electron in the t2g orbitals of an octahedral field split. The tetrahedral site nickel shows a distinctly different electronic structure, reflecting that the coordination environment changed. All the spin-down densities are below EF, while the spin-up densities are shifted above EF, indicating a d7 configuration in which all spin-down electrons fill the tetrahedral field split and the eg is also filled with spin-up electrons. When Ni relaxes into the tetrahedral site, as seen in sufficiently low Lix structures, there is a change in oxidation state, where it is now a Ni3+ cation that is more stable in a tetrahedral environment than a Ni4+ cation.
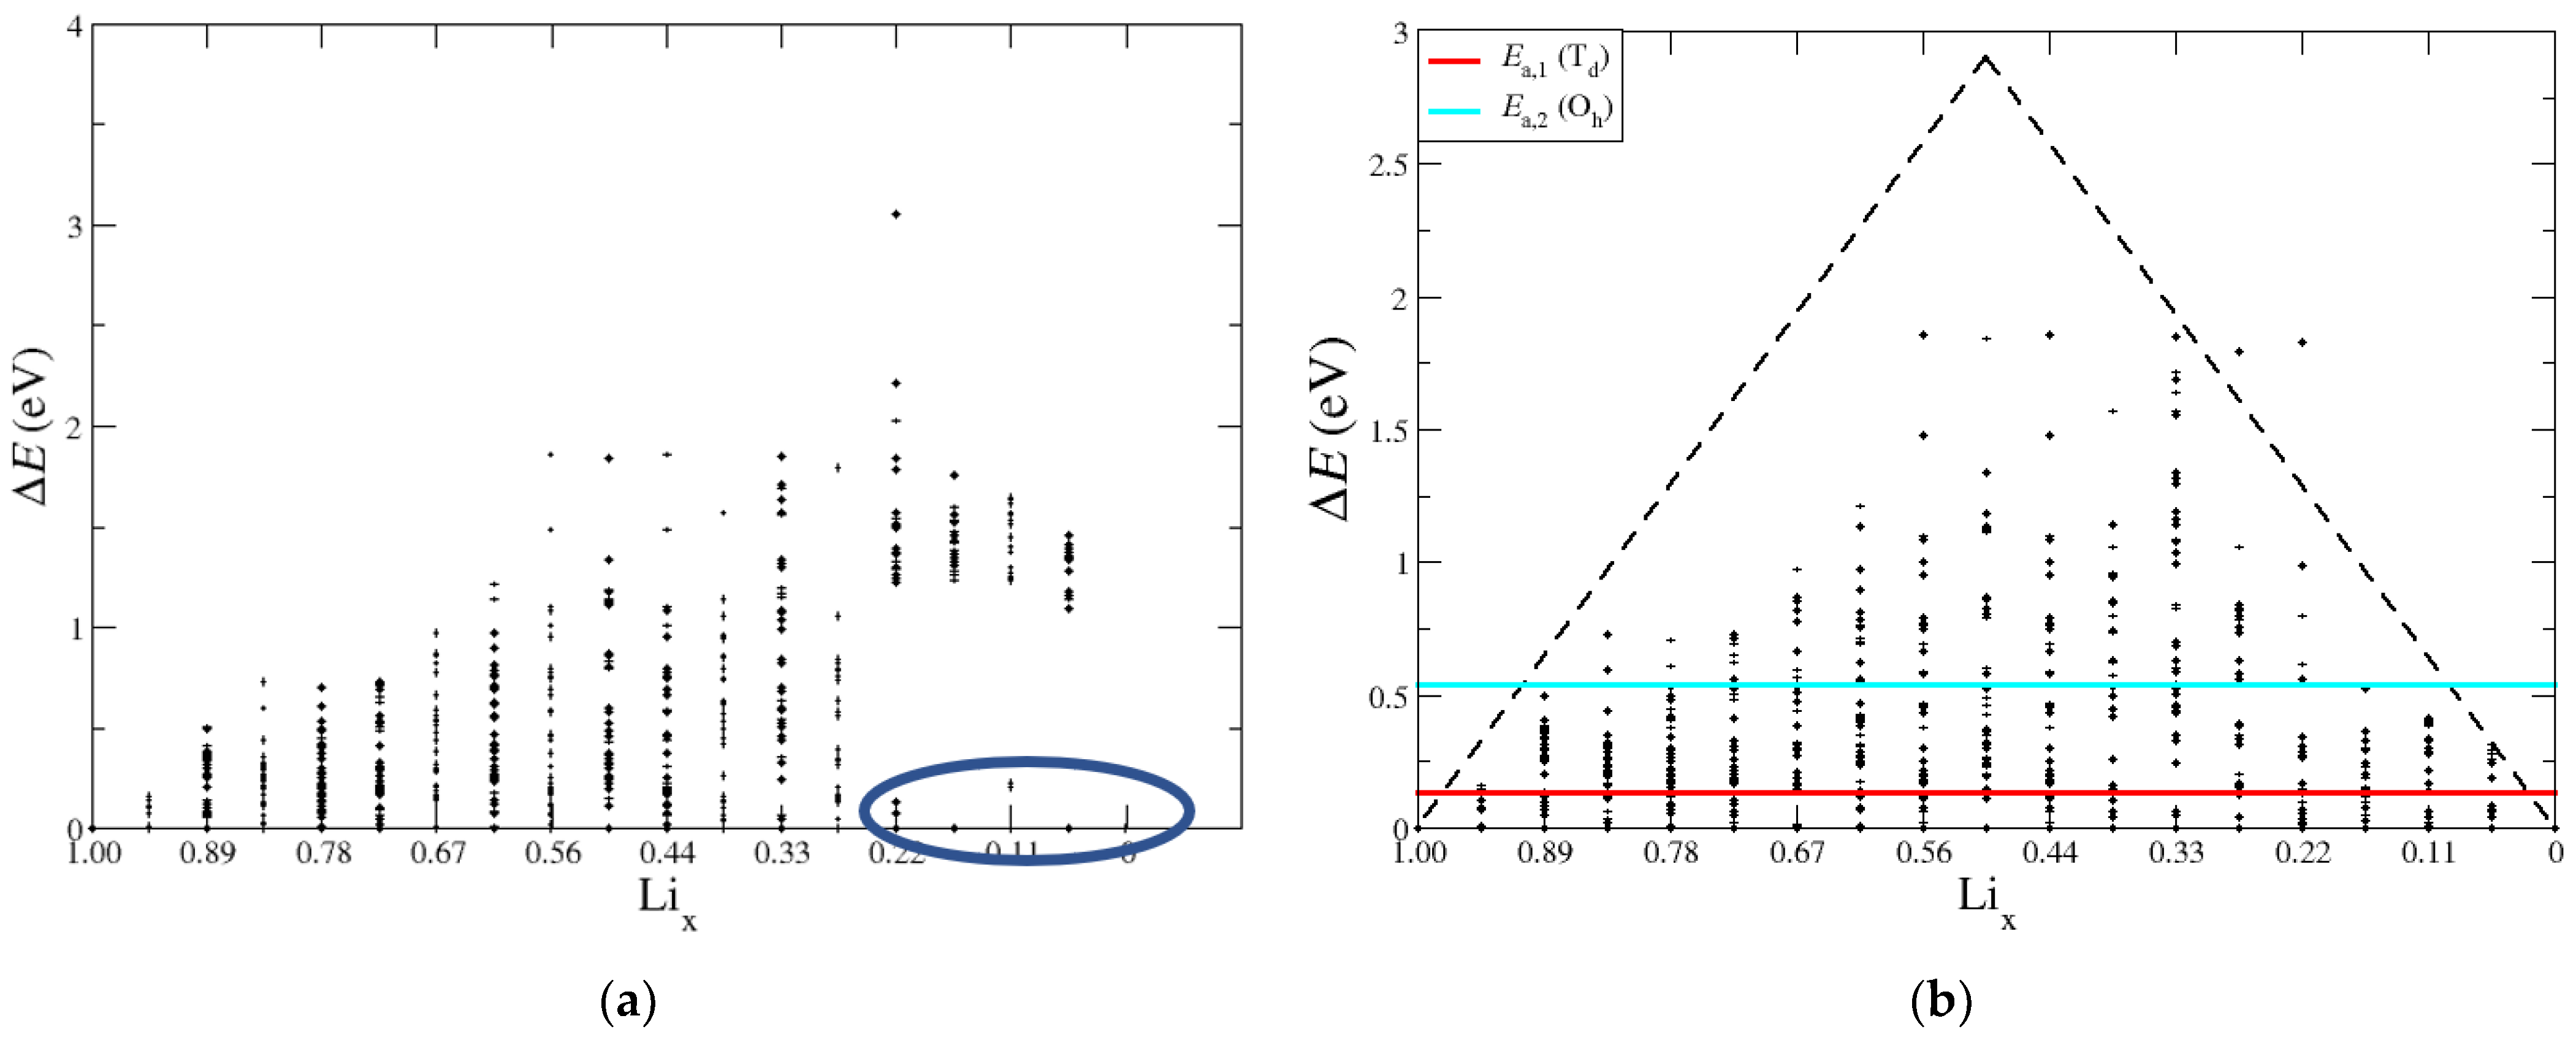
We next examined the range of DFT total energy values, ΔE, for different configurations of a given Lix. The goal was to identify trends in the lowest energy configurations to guide and constrain future modeling. Depicted in Figure 9 are the calculated values of ΔE as a function of Lix, where the total energy of the lowest energy configuration at each Li fraction was set to zero. On the left-hand side, the structures that have nickel atom displacements were included, and on the right-hand side, the baseline structure was set to the lowest energy structure, where nickel remains in the transition metal layer. The range of ΔE values is smallest at the endpoints corresponding to Li1.00 and Li0.00 and similar to the pascal triangle example in Figure 1, depicted in Figure 9b by the dashed black line. As Lix increases towards the intermediate lithium fractions, the total number of possible configurations increases, accompanied by larger values of ΔE. The two horizontal lines at 0.136 eV and 0.544 eV represent the energy barriers for different lithium diffusion pathways for the tetrahedral site (Ea,1, red) and octahedral site mechanism (Ea,2, cyan), respectively. Figure 9a shows the configurations that transition to the spinel phase and cause energy shifts that make the configurational energies unrelatable through the lithium diffusion pathway (circled in blue). In the case of the right-hand side, there are many low energy structures below the lithium diffusion barriers, which give a sensible voltage curve with a limited number of optimized structures. Overall, the analysis of ΔE and comparison to diffusion barriers further justifies the static calculations from Lix = 1.00 down to 0.44. This further explains why the calculations for V can become non-monatomic and unreliable for some Lix configurations lower than 0.44.
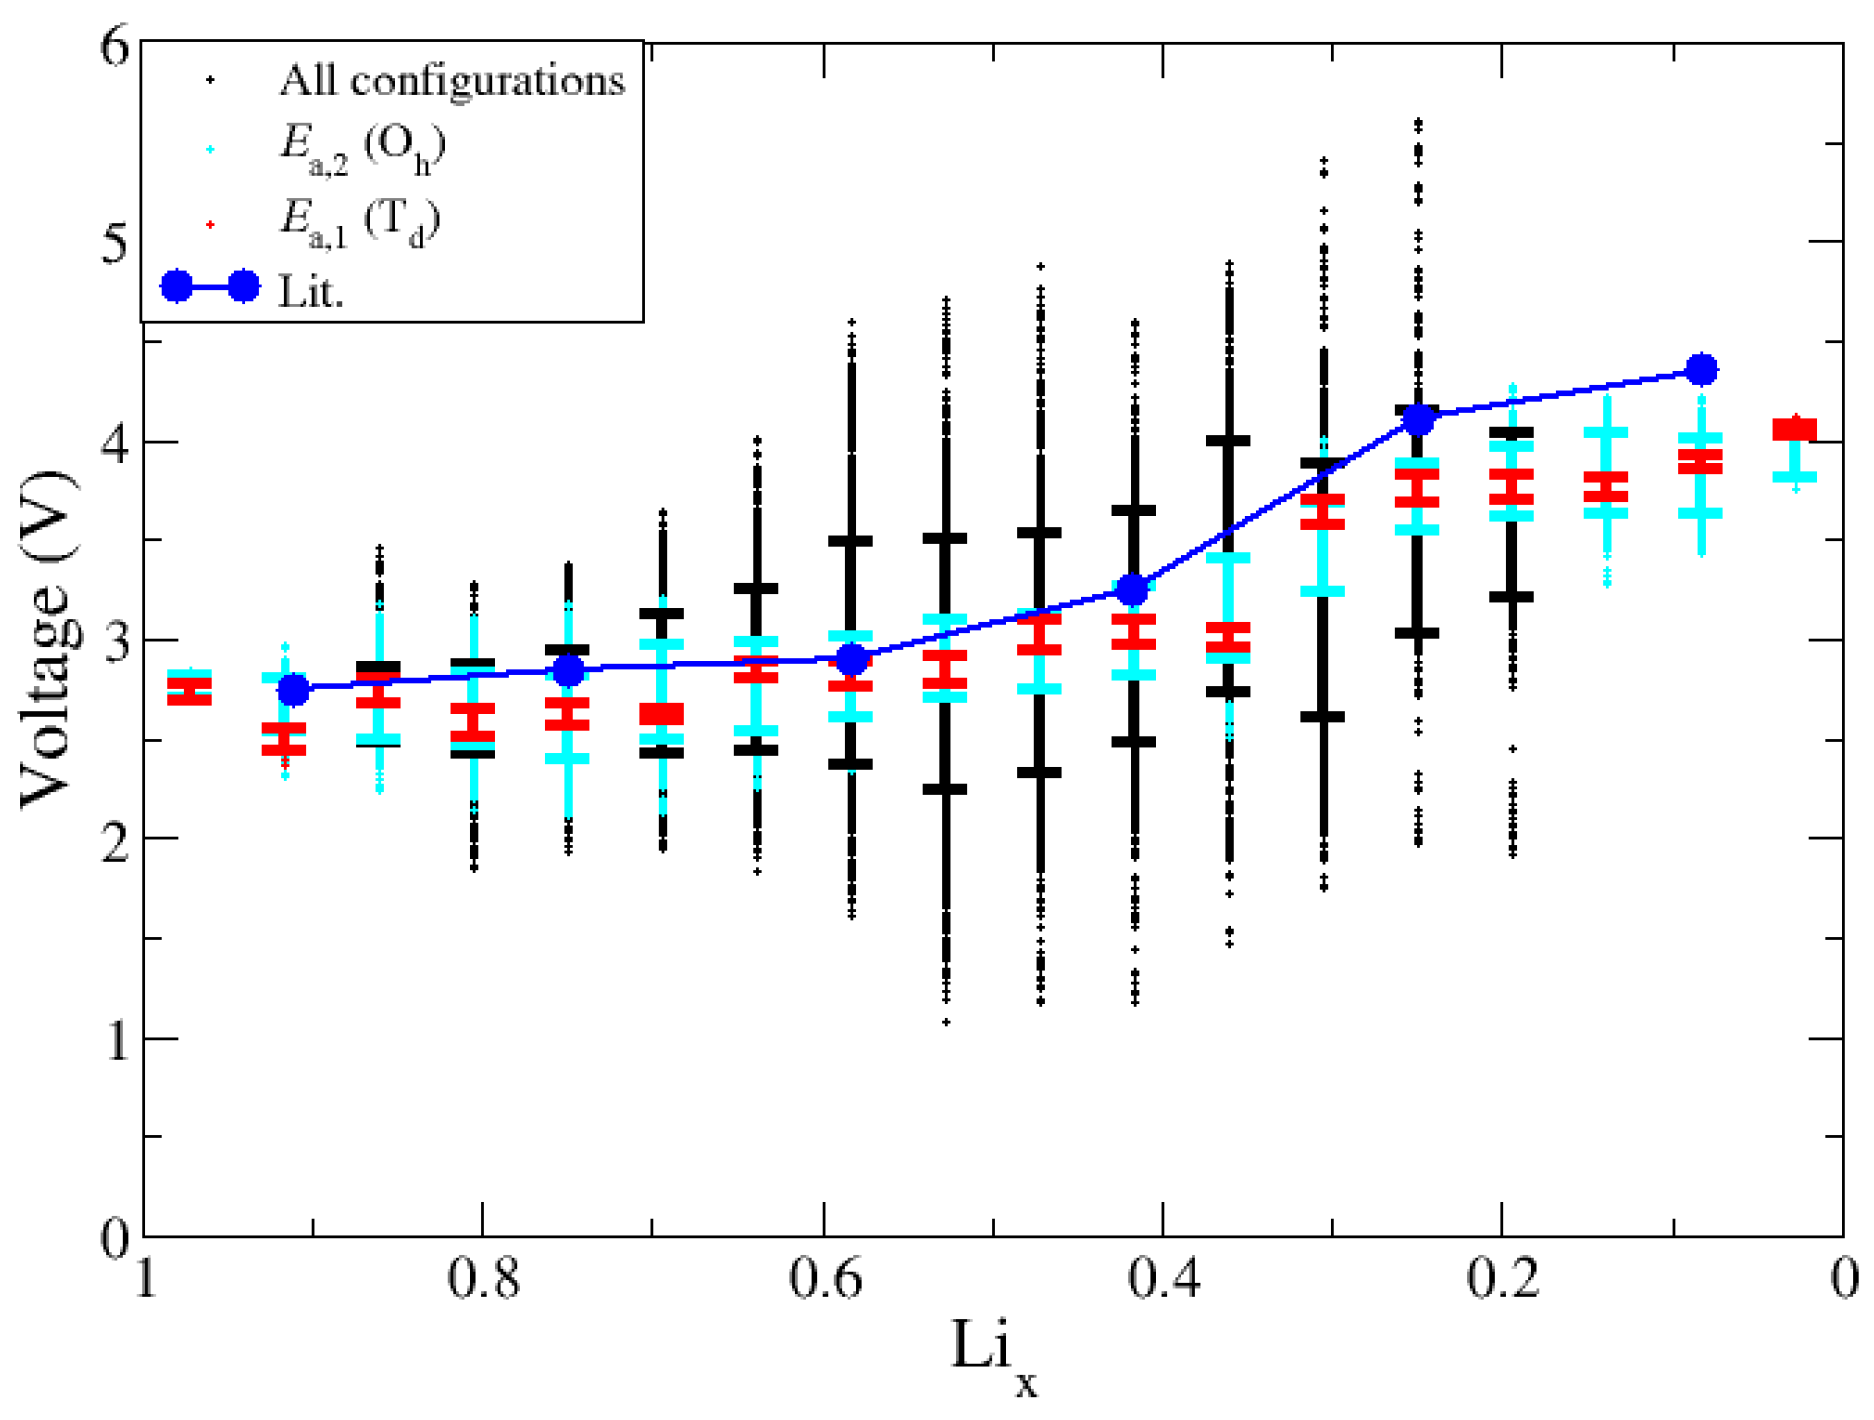
The study of ΔE as a function of Lix provides guidance in the calculation and interpretation of V. We calculated the values of V based on Equation (1) and using all possible combinations between two neighboring lithium fractions, and then we refined the dataset based on the outcomes of the above analyses. Figure 10 shows the voltage curve for all datasets, including the full (“all configs.,” black), configuration energies below Ea,2 (cyan), configuration energies Ea,1 (red) and another computational voltage curve of a small bulk system for comparison (blue). As shown in Figure 10, σ in V is the smallest for configurations that are below Ea,1. Because these structures exhibit a relatively small value of ΔE, they will yield similar V values when compared to neighboring Lix. For structures that fall outside either of the Ea, neighboring structures are no longer related by the energy of Li diffusion, thus produce a voltage value outside of the expected voltage range and can produce non monotonic changes in voltage. In summary, the non-monatomic changes in V can be traced to instances where the changes in Lix induce structural deformations in the slab, in which case Equation (1) is not applicable as it is meant to represent the differential limit of small changes in Lix.
We propose structural features that relate the lowest energy configurations for a given Lix can be used to select configurations a priori and reduce the total number of configurations that need testing. For example, in the case of removing six lithium atoms, it would be very unfavorable to remove all the lithium atoms from the same layer as doing so results in the most oxygen–oxygen repulsion. Using a radial distribution function, we looked at the Li–Li distribution to determine which lithium configurations would give more favorable energies. By comparing %Δg values between high and low energy configurations, we tracked the changes in Li proximity going across lithium fractions, see Table 2.
The negative values of %Δg indicate that the favorable energy structures exhibit Li in a dispersed arrangement. As Lix is reduced, there is a noticeable difference in the Li–Li RDF values for the highest and lowest energy configurations where Li is nearly 10% more dispersed in the Lix = 0.44 for the more stable structures. When choosing lithium configurations in the middle lithium fractions, configurations with localized lithium vacancies should be passed over as they lead to higher energy configurations that cause large fluctuations in voltage predictions. This by and large matches what one would expect based on configurational entropy considerations. However, while it has been previously suggested that configurational entropy contributes on the order of 3 meV/Å2 for transition metal surfaces, the values reported here for ΔE are significantly larger [44]. This could be due to inherent differences between CMOs and transition metals, and demonstrates the need to further explore how to quantify and judge the role of configurational entropy in first principles model in systems of increasing size and complexity.
4. Conclusions
Quantum chemical and machine learning modeling of NMC with variable Lix offers a means for further detailing the interplay of material descriptors (such as cation oxidation state and spin ordering) and surface reactivity. The process of metal release in aqueous settings is ubiquitous across the broad range of CMOs in technological, environmental, and engineered settings. The ability to link atomic- and molecular-level aspects of the solid state to macroscopic behavior, such as electroreactive performance measured through voltage, offers a platform for the in-silico discovery and optimization of complex oxides and their interfacial chemistry.
Supplementary Materials
The following supporting information can be downloaded at: https://0-www-mdpi-com.brum.beds.ac.uk/article/10.3390/app12084065/s1, Figure S1: RFT Optimization; Figure S2: RFT Descriptor Testing; Figure S3: Co & Mn PDOS.
Author Contributions
Conceptualization, Investigation, Writing, B.G.H.; Conceptualization, Writing—review and editing, S.E.M. All authors have read and agreed to the published version of the manuscript.
Funding
This material is based upon work supported by the National Science Foundation under Grant No. CHE-2001611, the NSF Center for Sustainable Nanotechnology. The CSN is part of the Centers for Chemical Innovation Program.
Institutional Review Board Statement
Not applicable.
Informed Consent Statement
Not applicable.
Data Availability Statement
Not applicable.
Acknowledgments
This research was supported, in part, through computational resources provided by the High Performance Computing Team at The University of Iowa, Iowa City, Iowa. This work used the Extreme Science and Engineering Discovery Environment (XSEDE) [43].
Conflicts of Interest
The authors declare no conflict of interest.
References
- Goodenough, J.; Park, K. The Li-ion rechargeable battery: A perspective. J. Am. Chem. Soc. 2013, 135, 1167–1176. [Google Scholar] [CrossRef] [PubMed]
- Schuler, B.; Qiu, D.Y.; Refaely-Abramson, S.; Kastl, C.; Chen, C.T.; Barja, S.; Koch, R.J.; Ogletree, D.F.; Aloni, S.; Schwartzberg, A.M.; et al. Large Spin-Orbit Splitting of Deep In-Gap Defect States of Engineered Sulfur Vacancies in Monolayer WS 2. Phys. Rev. Lett. 2019, 123, 076801. [Google Scholar] [CrossRef] [PubMed] [Green Version]
- Wilkerson, J. Recycled Lithium-Ion Batteries Can Perform Better Than New Ones. Scientific American, 1 February 2022. [Google Scholar]
- Ohzuku, T.; Makimura, Y. Layered Lithium Insertion Material of LiNi1/2Mn1/2O2: A Possible Alternative to LiCoO2 for Advanced Lithium-Ion Batteries. Chem. Lett. 2001, 30, 744–745. [Google Scholar] [CrossRef]
- Hang, M.N.; Gunsolus, I.L.; Wayland, H.; Melby, E.S.; Mensch, A.C.; Hurley, K.R.; Pedersen, J.A.; Haynes, C.L.; Hamers, R.J. Impact of Nanoscale Lithium Nickel Manganese Cobalt Oxide (NMC) on the Bacterium Shewanella oneidensis MR-1. Chem. Mater. 2016, 28, 1092–1100. [Google Scholar] [CrossRef]
- Hwang, B.J.; Tsai, Y.W.; Carlier, D.; Ceder, G. A Combined Computational/Experimental Study on LiNi1/3Co1/3Mn1/3O2. Chem. Mater. 2003, 15, 3676–3682. [Google Scholar] [CrossRef]
- Niemuth, N.J.; Curtis, B.J.; Hang, M.N.; Gallagher, M.J.; Fairbrother, D.H.; Hamers, R.J.; Klaper, R.D. Next-Generation Complex Metal Oxide Nanomaterials Negatively Impact Growth and Development in the Benthic Invertebrate Chironomus riparius upon Settling. Environ. Sci. Technol. 2019, 53, 3860–3870. [Google Scholar] [CrossRef]
- Chakraborty, A.; Kunnikuruvan, S.; Kumar, S.; Markovsky, B.; Aurbach, D.; Dixit, M.; Major, D.T. Layered Cathode Materials for Lithium-Ion Batteries: Review of Computational Studies on LiNi1–x–yCoxMnyO2 and LiNi1–x–yCoxAlyO2. Chem. Mater. 2020, 32, 915–952. [Google Scholar] [CrossRef]
- Huang, X.; Bennett, J.W.; Hang, M.N.; Laudadio, E.D.; Hamers, R.J.; Mason, S.E. Ab Initio Atomistic Thermodynamics Study of the Surface of LiCoO2 in a Water Environment and Implications for Reactivity under Ambient Conditions. J. Phys. Chem. C 2017, 121, 5069–5080. [Google Scholar] [CrossRef]
- Buchman, J.T.; Bennett, E.A.; Wang, C.; Abbaspour Tamijani, A.; Bennett, J.W.; Hudson, B.G.; Green, C.M.; Clement, P.L.; Zhi, B.; Henke, A.H.; et al. Nickel enrichment of next-generation NMC nanomaterials alters material stability, causing unexpected dissolution behavior and observed toxicity to S. oneidensis MR-1 and D. magna. Environ. Sci. Nano 2020, 7, 571–587. [Google Scholar] [CrossRef]
- Bennett, J.W.; Jones, D.T.; Hamers, R.J.; Mason, S.E. First-Principles and Thermodynamics Study of Compositionally Tuned Complex Metal Oxides: Cation Release from the Surface of Mn-Rich Lithium Nickel Manganese Cobalt Oxide. Inorg. Chem. 2018, 57, 13300–13311. [Google Scholar] [CrossRef]
- Bennett, J.W.; Jones, D.; Huang, X.; Hamers, R.J.; Mason, S.E. Dissolution of Complex Metal Oxides from First-Principles and Thermodynamics: Cation Removal from the Surface of Li(Ni1/3Mn1/3Co1/3)O2. Environ. Sci. Technol. 2018, 52, 5792–5802. [Google Scholar] [CrossRef] [PubMed]
- Abbaspour-Tamijani, A.; Bennett, J.W.; Jones, D.T.; Cartagena-Gonzalez, N.; Jones, Z.R.; Laudadio, E.D.; Hamers, R.J.; Santana, J.A.; Mason, S.E. DFT and thermodynamics calculations of surface cation release in LiCoO2. Appl. Surf. Sci. 2020, 515, 145865. [Google Scholar] [CrossRef] [Green Version]
- Ma, C.; Borgatta, J.; Hudson, B.G.; Tamijani, A.A.; De La Torre-Roche, R.; Zuverza-Mena, N.; Shen, Y.; Elmer, W.; Xing, B.; Mason, S.E.; et al. Advanced material modulation of nutritional and phytohormone status alleviates damage from soybean sudden death syndrome. Nat. Nanotechnol. 2020, 15, 1033–1042. [Google Scholar] [CrossRef] [PubMed]
- Bennett, J.W.; Jones, D.T.; Hudson, B.G.; Melendez-Rivera, J.; Hamers, R.J.; Mason, S.E. Emerging investigator series: First-principles and thermodynamics comparison of compositionally-tuned delafossites: Cation release from the surface of complex metal oxides. Environ. Sci. Nano 2020, 7, 1642–1651. [Google Scholar] [CrossRef]
- Han, X.; Lu, L.; Zheng, Y.; Feng, X.; Li, Z.; Li, J.; Ouyang, M. A review on the key issues of the lithium ion battery degradation among the whole life cycle. Etransportation 2019, 1, 100005. [Google Scholar] [CrossRef]
- Wandt, J.; Freiberg, A.; Thomas, R.; Gorlin, Y.; Siebel, A.; Jung, R.; Gasteiger, H.A.; Tromp, M. Transition metal dissolution and deposition in Li-ion batteries investigated by operando X-ray absorption spectroscopy. J. Mater. Chem. A 2016, 4, 18300–18305. [Google Scholar] [CrossRef]
- Liu, P.; Xu, R.; Liu, Y.; Lin, F.; Zhao, K. Computational Modeling of Heterogeneity of Stress, Charge, and Cyclic Damage in Composite Electrodes of Li-Ion Batteries. J. Electrochem. Soc. 2020, 167, 040527. [Google Scholar] [CrossRef]
- Ceder, G.; Chiang, Y.M.; Sadoway, D.R.; Aydinol, M.K.; Jang, Y.I.; Huang, B. Identification of cathode materials for lithium batteries guided by first-principles calculations. Nature 1998, 392, 694–696. [Google Scholar] [CrossRef]
- Islam, M.S.; Fisher, C.A.J. Lithium and sodium battery cathode materials: Computational insights into voltage, diffusion and nanostructural properties. Chem. Soc. Rev. 2014, 43, 185–204. [Google Scholar] [CrossRef] [Green Version]
- Liu, C.; Neale, Z.G.; Cao, G. Understanding electrochemical potentials of cathode materials in rechargeable batteries. Mater. Today 2016, 19, 109–123. [Google Scholar] [CrossRef]
- Watanabe, E.; Zhao, W.; Sugahara, A.; Mortemard de Boisse, B.; Lander, L.; Asakura, D.; Okamoto, Y.; Mizokawa, T.; Okubo, M.; Yamada, A. Redox-Driven Spin Transition in a Layered Battery Cathode Material. Chem. Mater. 2019, 31, 2358–2365. [Google Scholar] [CrossRef]
- Urban, A.; Seo, D.-H.; Ceder, G. Computational understanding of Li-ion batteries. npj Comput. Mater. 2016, 2, 16002. [Google Scholar] [CrossRef]
- Tygesen, A.S.; Chang, J.H.; Vegge, T.; García-Lastra, J.M. Computational framework for a systematic investigation of anionic redox process in Li-rich compounds. npj Comput. Mater. 2020, 6, 65. [Google Scholar] [CrossRef]
- Wang, B.; Li, S.L.; Truhlar, D.G. Modeling the Partial Atomic Charges in Inorganometallic Molecules and Solids and Charge Redistribution in Lithium-Ion Cathodes. J. Chem. Theory Comput. 2014, 10, 5640–5650. [Google Scholar] [CrossRef]
- Zhang, Y.; He, X.; Chen, Z.; Bai, Q.; Nolan, A.M.; Roberts, C.A.; Banerjee, D.; Matsunaga, T.; Mo, Y.; Ling, C. Unsupervised discovery of solid-state lithium ion conductors. Nat. Commun. 2019, 10, 5260. [Google Scholar] [CrossRef] [Green Version]
- Eremin, R.A.; Zolotarev, P.N.; Ivanshina, O.Y.; Bobrikov, I.A. Li(Ni,Co,Al)O2 Cathode Delithiation: A Combination of Topological Analysis, Density Functional Theory, Neutron Diffraction, and Machine Learning Techniques. J. Phys. Chem. C 2017, 121, 28293–28305. [Google Scholar] [CrossRef]
- Chikkannanavar, S.B.; Bernardi, D.M.; Liu, L. A review of blended cathode materials for use in Li-ion batteries. J. Power Sources 2014, 248, 91–100. [Google Scholar] [CrossRef]
- Choi, M.H.; Yoon, C.S.; Myung, S.T.; Lim, B.B.; Komaba, S.; Sun, Y.K. Effect of Lithium in Transition Metal Layers of Ni-Rich Cathode Materials on Electrochemical Properties. J. Electrochem. Soc. 2015, 162, A2313–A2318. [Google Scholar] [CrossRef]
- Abdellahi, A.; Urban, A.; Dacek, S.; Ceder, G. Understanding the Effect of Cation Disorder on the Voltage Profile of Lithium Transition-Metal Oxides. Chem. Mater. 2016, 28, 5373–5383. [Google Scholar] [CrossRef]
- Van der Ven, A.; Ceder, G. Lithium diffusion mechanisms in layered intercalation compounds. J. Power Sources 2001, 97, 529–531. [Google Scholar] [CrossRef]
- Van der Ven, A.; Thomas, J.C.; Xu, Q.C.; Swoboda, B.; Morgan, D. Nondilute diffusion from first principles: Li diffusion in LixTiS2. Phys. Rev. B 2008, 78, 104306. [Google Scholar] [CrossRef]
- Xia, H.M.; Shirley, Y.; Lu, L.; Ceder, G. Electrochemical Behavior and Li Diffusion Study of LiCoO2 Thin Film Electrodes Prepared by PLD. Adv. Mater. Micro- Nano-Syst. 2007. Available online: http://hdl.handle.net/1721.1/35827 (accessed on 19 February 2022).
- Giannozzi, P.; Baroni, S.; Bonini, N.; Calandra, M.; Car, R.; Cavazzoni, C.; Ceresoli, D.; Chiarotti, G.L.; Cococcioni, M.; Dabo, I.; et al. QUANTUM ESPRESSO: A modular and open-source software project for quantum simulations of materials. J. Phys. Condens. Matter 2009, 21, 395502. [Google Scholar] [CrossRef] [PubMed]
- Garrity, K.F.; Bennett, J.W.; Rabe, K.M.; Vanderbilt, D. Pseudopotentials for high-throughput DFT calculations. Comput. Mater. Sci. 2014, 81, 446–452. [Google Scholar] [CrossRef] [Green Version]
- Gu, X.; Liu, J.-L.; Yang, J.-H.; Xiang, H.-J.; Gong, X.-G.; Xia, Y.-Y. First-Principles Study of H+ Intercalation in Layer-Structured LiCoO2. J. Phys. Chem. C 2011, 115, 12672–12676. [Google Scholar] [CrossRef]
- Shu, Q.; Chen, L.; Xia, Y.; Gong, X.; Gu, X. Proton-Induced Dysfunction Mechanism of Cathodes in an Aqueous Lithium Ion Battery. J. Phys. Chem. C 2013, 117, 6929–6932. [Google Scholar] [CrossRef]
- Aydinol, M.K.; Kohan, A.F.; Ceder, G.; Cho, K.; Joannopoulos, J. Ab initio study of lithium intercalation in metal oxides and metal dichalcogenides. Phys. Rev. B 1997, 56, 1354–1365. [Google Scholar] [CrossRef] [Green Version]
- Knight, J.C.; Manthiram, A. Effect of nickel oxidation state on the structural and electrochemical characteristics of lithium-rich layered oxide cathodes. J. Mater. Chem. A 2015, 3, 22199–22207. [Google Scholar] [CrossRef]
- Rong, X.; Kolpak, A.M. Ab Initio Approach for Prediction of Oxide Surface Structure, Stoichiometry, and Electrocatalytic Activity in Aqueous Solution. J. Phys. Chem. Lett. 2015, 6, 1785–1789. [Google Scholar] [CrossRef]
- Wagman, D.D.; Evans, W.H.; Parker, V.B.; Schumm, R.H.; Halow, I.; Bailey, S.M.; Churney, K.L.; Nuttall, R.L. Erratum: The NBS tables of chemical thermodynamic properties. Selected values for inorganic and C1 and C2 organic substances in SI units. J. Phys. Chem. Ref. Data 1989, 18, 1807–1812. [Google Scholar] [CrossRef] [Green Version]
- Ojha, G.P.; Pant, B.; Muthurasu, A.; Chae, S.-H.; Park, S.-J.; Kim, T.; Kim, H.-Y. Three-dimensionally assembled manganese oxide ultrathin nanowires: Prospective electrode material for asymmetric supercapacitors. Energy 2019, 188, 116066. [Google Scholar] [CrossRef]
- Gagné, O.C.; Hawthorne, F.C. Comprehensive derivation of bond-valence parameters for ion pairs involving oxygen. Acta Crystallogr. B Struct. Sci. Cryst. Eng. Mater. 2015, 71 Pt 5, 562–578. [Google Scholar] [CrossRef] [PubMed] [Green Version]
- Sutton, C.; Levchenko, S.V. First-Principles Atomistic Thermodynamics and Configurational Entropy. Front. Chem. 2020, 8, 757. [Google Scholar] [CrossRef] [PubMed]
Figure 1.
The total number of delithiated structures across Lix is related to Pascal’s triangle where each row increases the total number of Li at Li1.00 by one. Sums of the row equal the total number of configurations in the charge cycle.
Figure 1.
The total number of delithiated structures across Lix is related to Pascal’s triangle where each row increases the total number of Li at Li1.00 by one. Sums of the row equal the total number of configurations in the charge cycle.

Figure 2.
The release of a M-OH unit from the Li(Ni1/3Mn1/3Co1/3)O2 cathode surface is modeled in three steps. Initially, the cathode is in its operational conditions and is Li terminated (NMCLi-term). Upon exposure to aqueous environments, there is a quick Li/H exchange on the surface, giving NMCH-term. The last step involves the release of an M−OH group, creating a vacancy on the surface (NMCM-OH vacancy).

Figure 3.
Plot of Li-intercalation voltage, V, versus Li fraction, Lix. The data plotted in blue follow approach 1 (single pathway), defined in the text. In black are the voltage values using lowest E configurations across Lix. The data plotted in green represent the literature results for a 6 Li atom bulk cell [1].

Figure 4.
(a) ΔG1 changes for Ni (black), Co (blue), and Mn (red) with respect to lithiation state. ΔG1 values are plotted with the lowest ΔG1 value referenced to zero and σ is shown with error bars. (b) To observe how much each metal changes individually, the initial M−OH.
Figure 4.
(a) ΔG1 changes for Ni (black), Co (blue), and Mn (red) with respect to lithiation state. ΔG1 values are plotted with the lowest ΔG1 value referenced to zero and σ is shown with error bars. (b) To observe how much each metal changes individually, the initial M−OH.

Figure 5.
(a) O–M–O (d1) and O–Li–O layer spacings (d2) tracked across the charge cycle. (b) Layered NMC structural model indicating O–M–O layer in black and O–Li–O layer in blue.
Figure 5.
(a) O–M–O (d1) and O–Li–O layer spacings (d2) tracked across the charge cycle. (b) Layered NMC structural model indicating O–M–O layer in black and O–Li–O layer in blue.

Figure 6.
Projected densities of states of surface Ni d-states as a function of Lix with down-spin density in green and up-spin in blue. EF is set to zero, indicated by the dashed purple line. Electron field splits are provided below to show the changes in Ni oxidation state.
Figure 6.
Projected densities of states of surface Ni d-states as a function of Lix with down-spin density in green and up-spin in blue. EF is set to zero, indicated by the dashed purple line. Electron field splits are provided below to show the changes in Ni oxidation state.

Figure 7.
(a) Importance values calculated through the RFT model for the descriptors used in training the model from left to right: sum of the magnetic moments of six neighboring metals to vacancy site, Σρs, bond valance sum of the removed metal, BV_vac, the number of valance electrons that the vacancy metal has, Charge_vac, and the magnetic moment of the vacancy site, ρs. (b) ΔG1 predictions of RFT model with the training data set shown in black and the testing dataset shown in red.

Figure 8.
PDOS of the Ni d-states in NMC at Lix = 0.22 for (a) Ni atom in O−M−O layer and (b) Ni that dropped into the Li channel, resulting in a tetrahedral coordination. Color scheme follows that of Figure 6 fillings.
Figure 8.
PDOS of the Ni d-states in NMC at Lix = 0.22 for (a) Ni atom in O−M−O layer and (b) Ni that dropped into the Li channel, resulting in a tetrahedral coordination. Color scheme follows that of Figure 6 fillings.

Figure 9.
(a) Relative energies of lithium configurations with the lowest energy configuration set to zero at each Lix. Large changes in energy are observed at low Lix because of Ni displacement, indicated by the blue circle. (b) Relative energies with Ni displacement structures removed. Td and Oh Li diffusion energy barriers are shown as red and cyan horizontal lines, respectively, to compare the configurations that are relatable by Li diffusion. The black dashed lines help to show the spread in energies where the largest deviations are around Li0.50.

Figure 10.
Voltage predictions after removing configurations with Ni dropping into tetrahedral sites. Voltage predictions for all configurations, configurations below Ea,2 and those below Ea,1 are shown in black, cyan, and red, respectively. Standard deviations are also included.
Figure 10.
Voltage predictions after removing configurations with Ni dropping into tetrahedral sites. Voltage predictions for all configurations, configurations below Ea,2 and those below Ea,1 are shown in black, cyan, and red, respectively. Standard deviations are also included.


Table 1.
ΔG1 values (eV, Equation (2)) for M = Ni, Mn, or Co. The values of the standard deviation, σ (eV), for all configurations are also reported.
Table 1.
ΔG1 values (eV, Equation (2)) for M = Ni, Mn, or Co. The values of the standard deviation, σ (eV), for all configurations are also reported.
| Lix | Ni ΔG1 (eV) | σ | Mn ΔG1 (eV) | σ | Co ΔG1 (eV) | σ |
|---|---|---|---|---|---|---|
| 1.00 | 9.38 | 0.00 | 12.70 | 0.00 | 9.92 | 0.00 |
| 0.89 | 8.25 | 0.33 | 12.37 | 0.35 | 9.34 | 0.20 |
| 0.78 | 8.28 | 0.23 | 12.41 | 0.29 | 9.47 | 0.15 |
| 0.67 | 8.40 | 0.39 | 12.48 | 0.29 | 9.64 | 0.53 |
| 0.56 | 8.36 | 0.24 | 12.46 | 0.48 | 9.72 | 0.25 |
| 0.44 | 8.38 | 0.59 | 12.60 | 0.65 | 9.64 | 0.16 |
Table 2.
Tabulated are the changes in the Li–Li distribution compared to the fully lithiated structure.
Table 2.
Tabulated are the changes in the Li–Li distribution compared to the fully lithiated structure.
| Li Fraction | 0.89 | 0.78 | 0.67 | 0.56 | 0.44 |
| %Δg | 0.26 | −0.97 | −4.09 | −8.25 | −9.58 |
Publisher’s Note: MDPI stays neutral with regard to jurisdictional claims in published maps and institutional affiliations. |
© 2022 by the authors. Licensee MDPI, Basel, Switzerland. This article is an open access article distributed under the terms and conditions of the Creative Commons Attribution (CC BY) license (https://creativecommons.org/licenses/by/4.0/).
Share and Cite
MDPI and ACS Style
Hudson, B.G.; Mason, S.E. Metal Release Mechanism and Electrochemical Properties of Lix(Ni1/3Mn1/3Co1/3)O2. Appl. Sci. 2022, 12, 4065. https://0-doi-org.brum.beds.ac.uk/10.3390/app12084065
AMA Style
Hudson BG, Mason SE. Metal Release Mechanism and Electrochemical Properties of Lix(Ni1/3Mn1/3Co1/3)O2. Applied Sciences. 2022; 12(8):4065. https://0-doi-org.brum.beds.ac.uk/10.3390/app12084065
Chicago/Turabian StyleHudson, Blake G., and Sara E. Mason. 2022. "Metal Release Mechanism and Electrochemical Properties of Lix(Ni1/3Mn1/3Co1/3)O2" Applied Sciences 12, no. 8: 4065. https://0-doi-org.brum.beds.ac.uk/10.3390/app12084065
Note that from the first issue of 2016, this journal uses article numbers instead of page numbers. See further details here.