Article

Understanding the Role of the Microbiome in Cancer Diagnostics and Therapeutics by Creating and Utilizing ML Models

by
Miodrag Cekikj
1,*,
Milena Jakimovska Özdemir
2,*,
Slobodan Kalajdzhiski
1,
Orhan Özcan
3 and
Osman Uğur Sezerman
2
1
Faculty of Computer Science and Engineering, Ss. Cyril and Methodius University, 1000 Skopje, North Macedonia
2
Biostatistics and Medical Informatics Department, Acibadem Mehmet Ali Aydinlar University, Istanbul 34752, Turkey
3
Epigenetiks Genetics Bioinformatics Software Inc., Istanbul 34083, Turkey
*
Authors to whom correspondence should be addressed.
Submission received: 8 January 2022 / Revised: 11 February 2022 / Accepted: 8 March 2022 / Published: 19 April 2022
(This article belongs to the Section Applied Biosciences and Bioengineering)

Abstract

:

Simple Summary

Cancer is one of the leading causes of death worldwide. Colorectal cancer belongs to the group of the most malignant tumors for which their burden can be only reduced through early detection and appropriate treatment. Increasing evidence indicates that the intestine microbiota is related and can impact colorectal carcinogenesis. This study proposes a multidisciplinary approach of two-phase methodology for modeling and interpreting the key biomarkers that can play a significant role in understanding the drug-resistant mechanism for patients diagnosed with colorectal cancer. The proposed methodology was evaluated using a publicly accessible dataset, which may serve clinicians as a complementary analysis tool in colorectal cancer diagnostics and therapeutics. This study contributes to the field of predictive modeling in healthcare.

Abstract

Recent studies have highlighted that gut microbiota can alter colorectal cancer susceptibility and progression due to its impact on colorectal carcinogenesis. This work represents a comprehensive technical approach in modeling and interpreting the drug-resistance mechanisms from clinical data for patients diagnosed with colorectal cancer. To accomplish our aim, we developed a methodology based on evaluating high-performance machine learning models where a Python-based random forest classifier provides the best performance metrics, with an overall accuracy of 91.7%. Our approach identified and interpreted the most significant genera in the cases of resistant groups. Thus far, many studies point out the importance of present genera in the microbiome and intend to treat it separately. The symbiotic bacterial analysis generated different sets of joint feature combinations, providing a combined overview of the model’s predictiveness and uncovering additional data correlations where different genera joint impacts support the therapy-resistant effect. This study points out the different perspectives of treatment since our aggregate analysis gives precise results for the genera that are often found together in a resistant group of patients, meaning that resistance is not due to the presence of one pathogenic genus in the patient microbiome, but rather several bacterial genera that live in symbiosis.

1. Introduction

It is estimated that there will be 19.3 million new cancer cases, of which 10% will be colorectal cancer (CRC), considering the statistics from 2020. Furthermore, out of 10 million cancer deaths, 9.4% are due to colorectal cancer [1]. Accordingly, this emerging evidence suggests that CRC is one of the most common malignant tumors, ranking in the top three causes of cancer-related death. The high mortality rate of CRC patients may be due to many genetic and environmental factors. One of the causes for the high mortality rate is the unreliable treatment of patients with colorectal cancer due to the gut microbiota [2]. The human intestine contains approximately 7000 different strains of bacteria in the intestinal region that represents an approximate weight of nearly two kilos [3]. The most common species in the normal human microbiome are Absidia, Bacteroides, Lactobacillus, Escherichia coli, and Enterococcus, collectively representing almost 90% of the total species [4]. These bacteria have well-known functions in the human organism and tend to live in symbiosis by production and fermentation of metabolites. Moreover, these bacteria actively participate in the immune system response. Disruption in the microbiome in the colon may cause inflammation and likewise promote the development of colorectal cancer [5].
Nowadays, numerous studies have verified that gut microbiota can alter CRC susceptibility and progression since the gut microbiota can have an impact on colorectal carcinogenesis by inducing tumor proliferation [6,7], inducing newly developed adenoma, promoting inflammation [8], and causing DNA damage [9]. Additionally, it is familiar that the microbiome can influence the metabolic pathways, modulate anticancer drug efficacy, and cause drug resistance [10]. Following the recent approaches for the treatment of colorectal cancer, various strategies are applied that consider the microbiome diversity in the patient—such as dietary interventions, antibiotic treatments, probiotics, prebiotics, and postbiotics. Recently, it has been published that specific bacteria have been causing chemoresistance [11]. The most common chemotherapeutic drug given to patients with colorectal cancer is 5-fluorouracil, which dissolves with the presence of bacteria such as Fusobacterium nucleatum, Escherichia coli, or Bacteroides fragilis in the gut microbiome and thus it is not efficient [12]. Lately, the treatment of colorectal cancer patients has been prolonged due to the usage of antibiotics such as ampicillin, colistin, and streptomycin to suppress pathogenic bacteria and promote immunotherapy outcomes [13].
With the progress of molecular techniques such as high-throughput sequencing, scientists can detect and characterize the spectrum of microbiome bacteria in CRC patients. However, to outline the relationship between gut microbiota and CRC development in patients, extensive bioinformatics studies need to be conducted on the induced alteration of CRC treatment.
Recent scientific work has highlighted the potential of applying machine learning (ML) algorithms in creating data-driven frameworks and experimental setups over the traditional biostatistical methods for targeting the microbiota with diverse strategies, providing new opportunities involving tailored therapies for individual patients [14]. Supervised and unsupervised learning, as well as multi-layer artificial neural networks or deep learning (DL)—both under the umbrella of artificial intelligence (AI)—are considered as two different subfields for analyzing gut microbiota insights with regard to cancer development and potential therapeutic effects [15]. The most frequently used methods applied on the human–microbiome interactions for disease prediction, understanding disease mechanisms, and further application in personalized medicine (biomarker-finding) can be generalized into the following groups: supervised learning methods (logistic regression, linear discriminant analysis, K-nearest neighbor, naïve Bayes, support vector machines), deep learning (using the artificial neural networks with deep architectures and convolutional neural networks), and ensemble methods (random forest, multiple decision trees, gradient boosting) [16]. A random forest classification-based screening modeling, combined with extracting the underlying decision trees to identify and learn their corresponding splitting threshold values, are commonly used to study the imbalance of human gut microbiota relation with colorectal cancer development [17]. Moreover, the random forest classification approach is adopted in proving the validity of adenoma-specific markers across multiple populations, which would contribute to the early diagnosis and treatment of CRC [18]. Naïve Bayes and random forest have also displayed high accuracy in analyzing the alterations of gut microbial composition in colorectal adenoma and were reported as accurate methods for predicting CRC based on the gut microbiota compositions [19].
In this paper, we intend to re-analyze the publicly available microbiome data to assess the critical influence on particular bacterial species present in the human gut that can cause chemotherapy resistance. As we are dealing with many data, accurate bioinformatics analysis and machine learning algorithms could help us to obtain valuable correlations between the microbiome and the CRC. To date, Scikit-learn random forest classifier [20] and KNIME tree ensemble [21] high accuracy algorithms were used for modeling and interpreting the drug resistance mechanism.

2. Materials and Methods
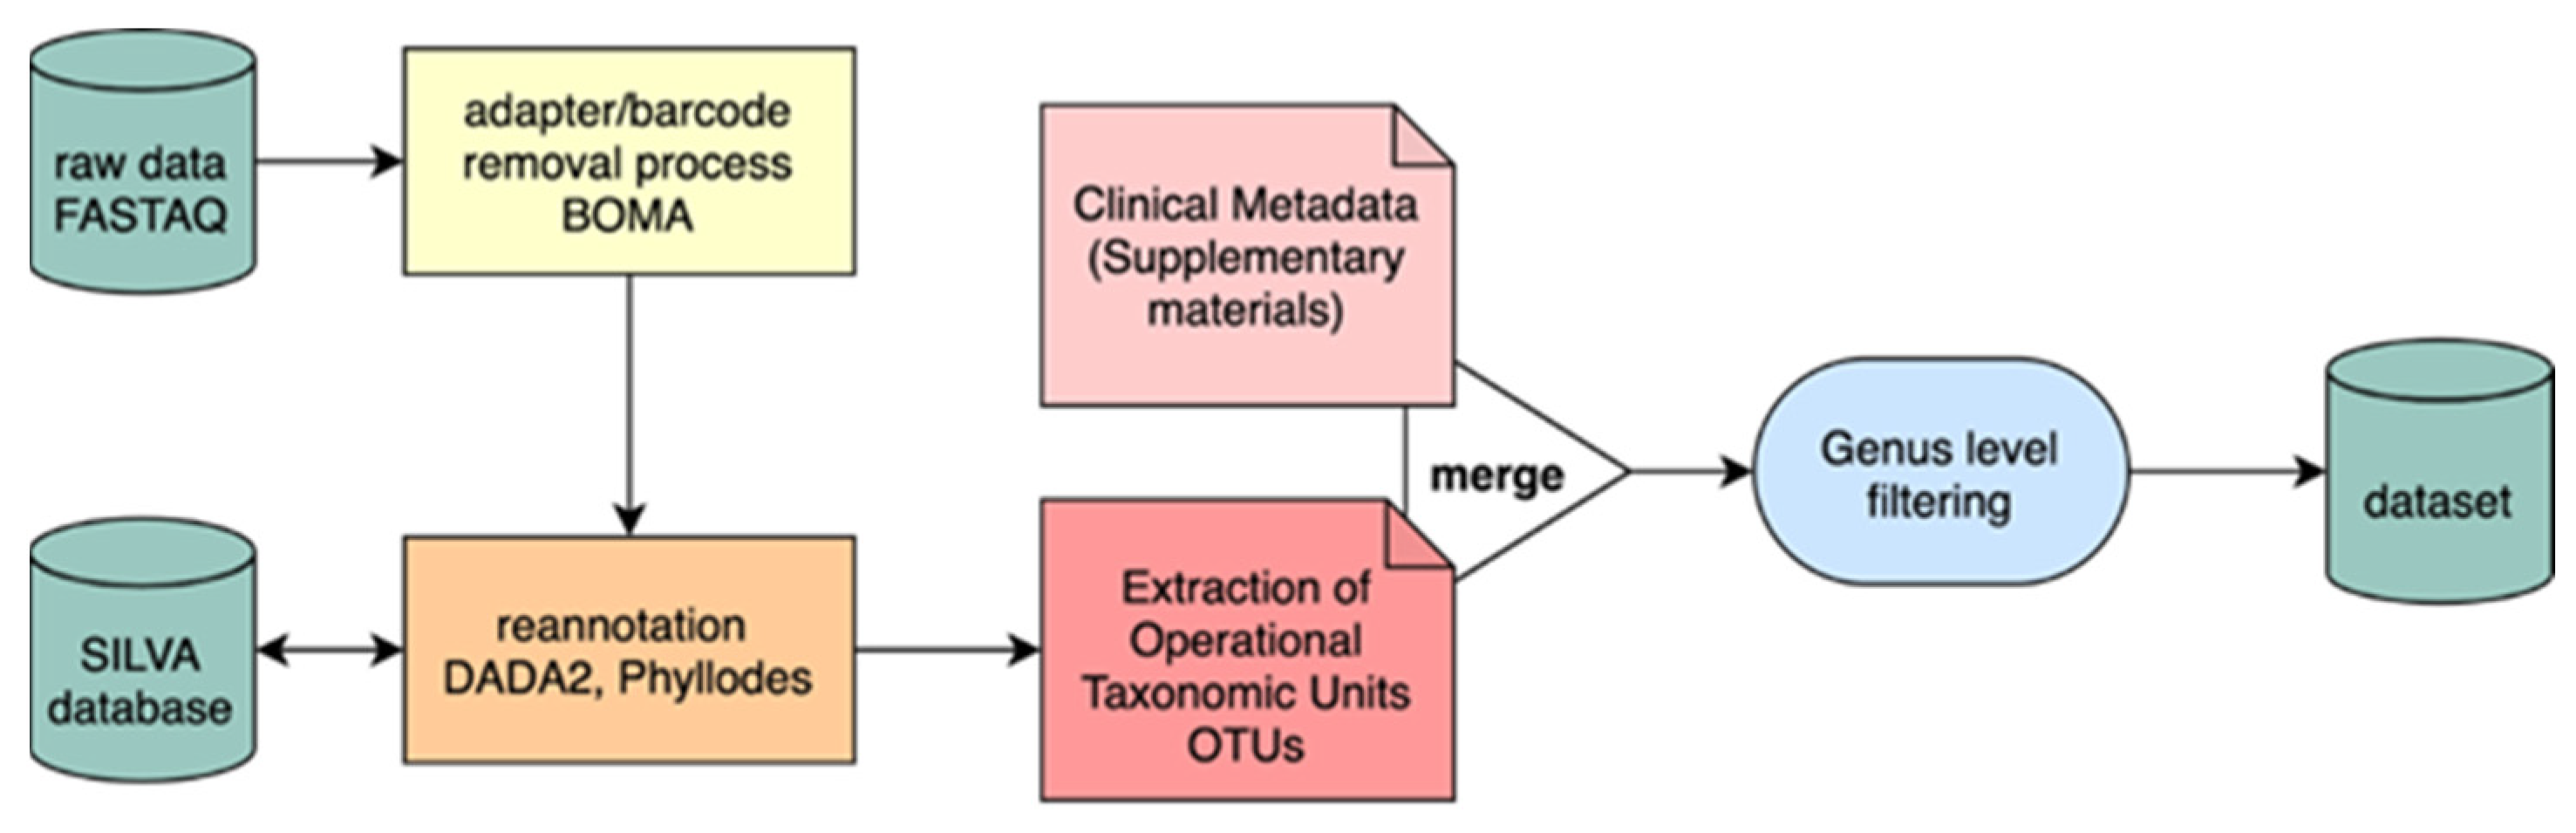
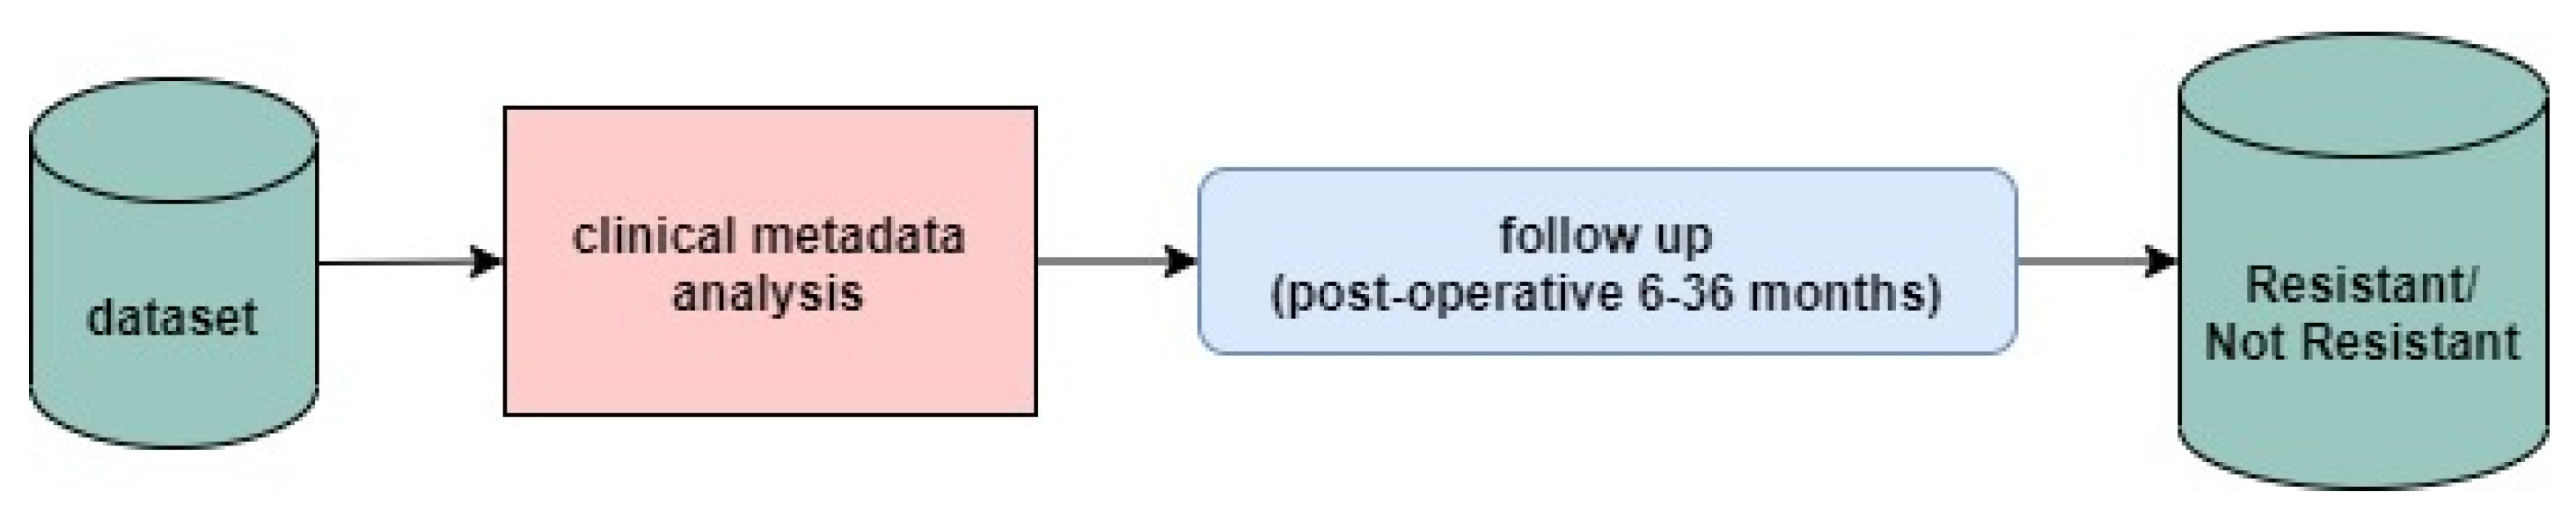
2.1. Dataset

In this study, we used a publicly available raw dataset and clinical metadata information published as part of the “Gut microbiota in patients after surgical treatment” [22]. The gut microbiota study data were extracted after sequencing the V3–V4 region of the 16S ribosomal RNA gene amplified from the individuals’ fecal samples. The analysis covers a total number of 116 individual microbiome samples, from which 23 microbiome samples were from patients diagnosed with tubular adenoma (19.8%), 15 microbiome samples were from CRC patients before operation (12.9%), 47 were CRC post-operative microbiome samples (40.5%), and 31 were healthy control microbiome samples (26.7%)—the dataset is summarized in Figure S1a. It is noted in the corresponding article that the design of their study is cross-sectional, meaning that the pre-operative and post-operative fecal samples were not collected from the same CRC patients. Moreover, according to the follow-up surgical resection in the interval from 6 to 36 months, the CRC post-operative samples were divided into two distinct groups. The first group consisted of 21 samples from patients with newly developed adenoma, which we associated as resistant, and the second group included the rest of 26 samples from patients with a clean intestine, which we associated as not resistant, presented in Figure S1b.

2.2. Taxonomic Analysis

For the publicly available dataset [22], we have started the analysis from the raw data. Initially, we removed the adapter and barcode sequences and the amplicon sequence primer sets (V3–V4). For this purpose, we used the BBMap (v.38.90) tool [23]. We applied this approach due to the errors that can occur when the primer sequences are accepted as amplicon ends. The aforementioned approach can produce incorrect consensus sequences and influence the taxonomic assignment.
Furthermore, we extracted the operational taxonomic units (OTU) tables after dataset processing. The idea was to improv taxonomical precision since the bacterial references and even the taxonomies are constantly changing (initial raw data published in December 2018). Reannotation of the raw reads against updated bacterial references was required to avoid the data’s taxonomical bias. All the OTUs were created with DADA2 [24] and Phyllodes packages implemented in the R 4.0 analytical platform with SILVA 138.1–16 s reference (latest reference database update on 27 August 2020) [25]. For analyzing the resistance mechanism, we have correspondingly excluded the clinical metadata fields describing the age, body mass index—BMI, gender, CEA—carcinoembryonic antigen (ng/mL), CA19-9—carbohydrate antigen (U/mL), follow-up (month), TNM—classification of carcinoma, and localization in the colon (right/left). This process is visually described through the flowchart in Figure 1.

2.3. Data Preprocessing
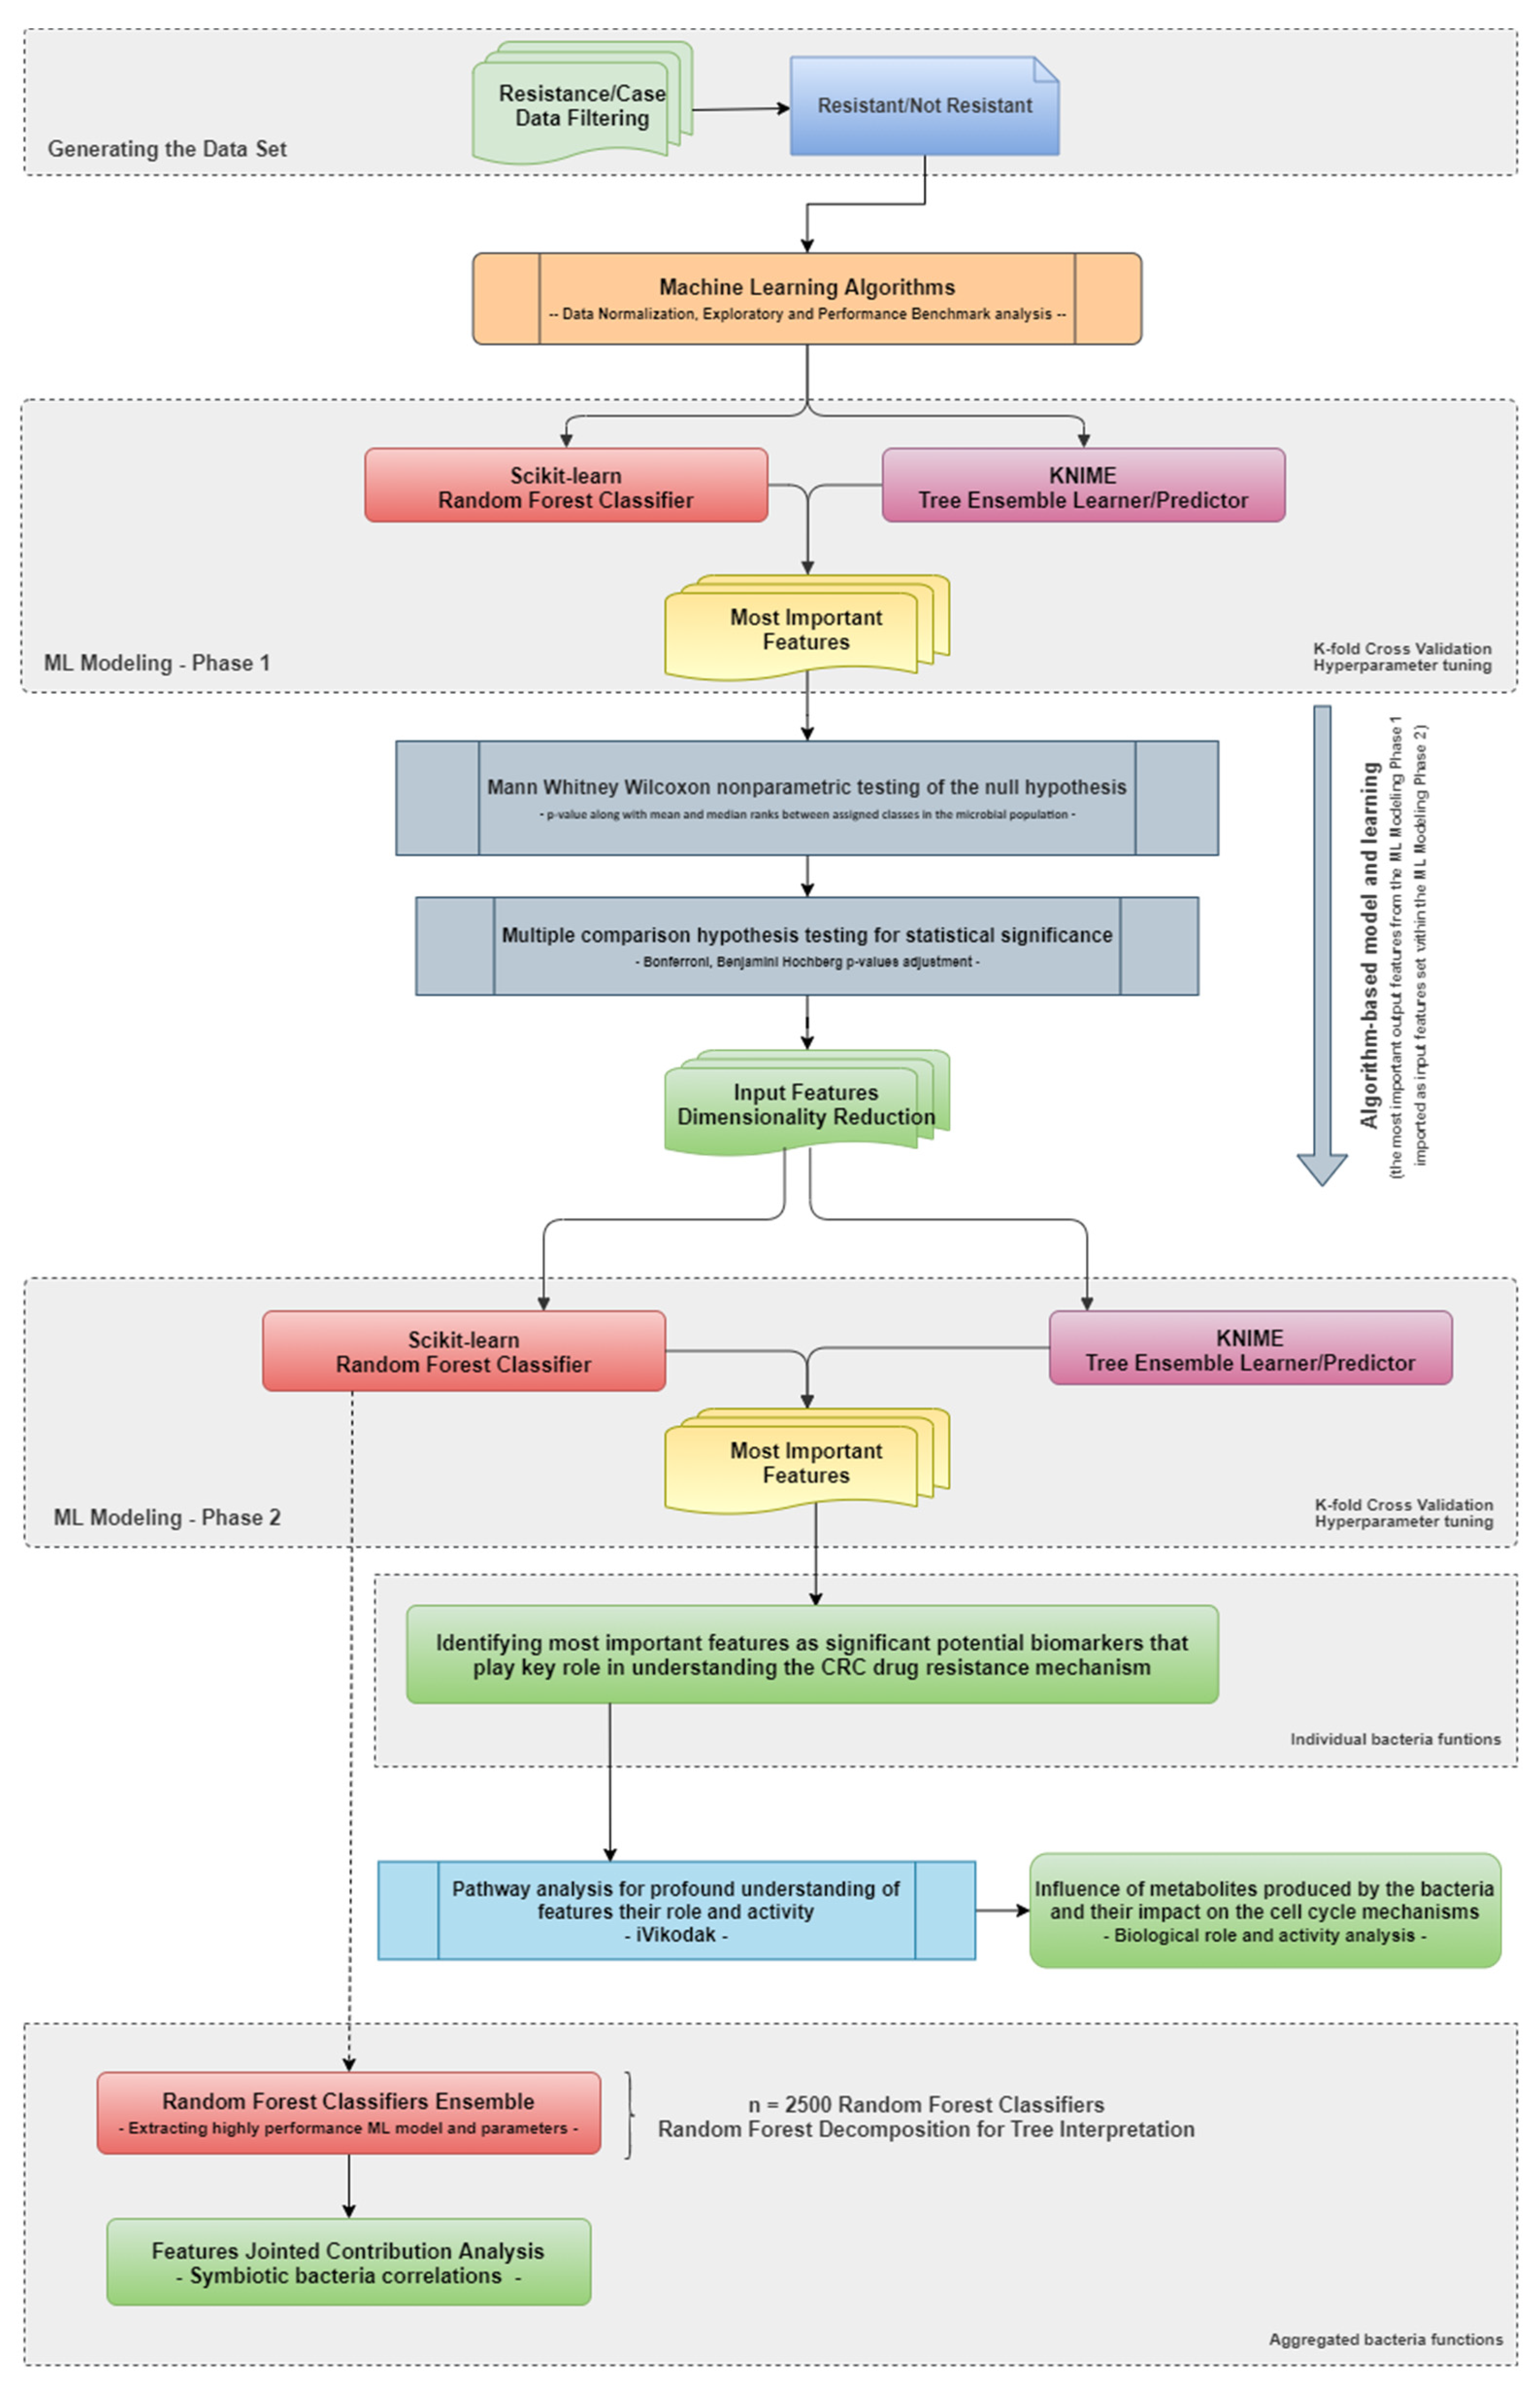
Three different data table structures were generated and identified as an initial dataset point for further analysis and processing. The first table was associated with the clinical metadata described previously. The metadata was followed by the other two tables representing the amplicon sequence variant (ASVs) taxonomy and counts distributed across the different microbiome samples. As a result, we have identified a total number of 3603 ASV units phylogenetically defined in several levels (Kingdom, Phylum, Class, Order, Family, Genus, and Species). A simple inner join technique based on the ASV identifier was performed for generating the reference dataset. By applying the technique of table pivoting, the ASVs units were structured by their count values distributed across the different samples. Additionally, we have filtered and isolated the data by all phylogenic levels (starting with the lowest one, the species level).
Without enough species-level information, we decided to further analyze and process the microbial composition classified and specified at the genus level. The handling of filtering and missing information (N/A values) reduced the initial data to 2097 ASV units. Afterward, we applied the data aggregation technique for merging the dataset for unique ASV units according to the ASVs naming and abundance. This approach reduced the final working dataset to 259 unique bacteria at the genus level distributed across 116 microbiome samples, including the clinical metadata.
Analyzing the corresponding clinical metadata, we have additionally divided the final dataset into a more specific subset for separate analysis and comparison of resistant related perspectives. This subset of research interest consisted of the CRC post-operative individuals considering the follow-up medical assessment information, resistant, and not resistant. Our main scientific interest was to understand post-operative individuals’ drug resistance mechanisms by using the microbiome data. The process of generating the subset is visually presented on the flowchart in Figure 2.

2.4. Methodology

The research methodology workflow of the whole study is generally summarized in Figure 3. Considering the dataset that we decided to analyze, we applied machine learning and statistics as a supervised learning approach to examine the biological features and model the drug-resistance mechanism. In general, classification ML algorithms and statistics are supervised learning approaches. In supervised learning approaches, the computer program can ‘learn’ from the reference data and make new observations or predictions (binary or multi-class) on previously not seen structured or not structured data. This study’s features working datasets are represented through the aggregated microbial composition and extracted at the genus level. There were missing values detected, therefore, additional data preprocessing was done to remove these instances. Hence, the quantity of data consists of 259 unique bacteria at the genus level distributed across 116 microbiome samples. Bacteria values were described according to their count values, respectively. An additional target categorical column was introduced, which provides the pre-operative and post-operative medical assessment information considering the metadata (including the record for the samples’ histology and treatment).
A set of multiple different ML supervised algorithms were initially performed to explore and provision the most promising approach determined by the maximized accuracy metric, a process labeled as ‘algorithm benchmark analysis’. Recognizing the most trustworthy algorithm base uncovered the potential of utilizing more advanced associate supervised algorithms to enhance accuracy and establish an understandable way for interpreting the contributions to the model predictiveness.
As a fundamental reference point, we assumed that all features could be potentially important and play a significant role in understanding the drug resistance mechanism. Thus, we proceed leveraging the ‘brute-force’ approach, through which we have denoted the considerable amount of input features along with their different level of relative bacterial abundance and distribution across the population. Initially, additional feature dimension reduction and engineering were not performed. However, since feature dimensionality is most frequently directly correlated with the applied ML algorithms’ performance metrics, we decided to reduce and semantically interpret the input set by designing the modeling process into two subsequent stages.
In the first stage, feature selection significance determination analysis was done, reducing the features set and the bacterial distribution initial understanding across the specific samples in this process. We assumed the narrowed first stage’s output as possible input for the second modeling iteration by considering the significance and potential relevance of the specific bacterial abundance. The approach aimed to establish more in-depth analysis and look for deep data insights, models’ behaviors, and performance metric improvements due to the attempt to recognize and confirm the biomarker potential of a particular bacterial, or group of bacterial, genus types. In terms of this, our technical expectations established improved performance evaluation addressing the key significant biomarkers that play an important role in the models’ predictiveness. We decided to use analytical feature reduction and engineering over, for example, the recursive features elimination (RFE) procedure, since it offers the opportunity of interpreting the significances, and at the same time, the ML models’ performance is directly associated and dependent upon the structure and dimension of the input dataset.
This phase was additionally followed by statistical and non-parametric data testing and analysis to examine the abundance within the different classes and find more data insight for further biological evaluations and findings.
The analysis continued in designing the second phase of ML models, generating more accurate results and providing better model prediction and metrics. Respectively, we used the scope of the reduced features to analyze the essential features that provided an admissible understanding of microbiome drug resistance classification’s critical markers. In general, the second stage was designed following the same modeling approach from the first one, with the difference of taking into consideration that the input features scope consists only of the most significant features determined in the previous step.
The extraction of the most informative features was used as an input into pathway analysis for a profound understanding of their biological role and activity. Additionally, we went a step further and established a more operational way of defining the predictability through the sequence of regions that correspond to each decision tree model. Assuming the random forest classifier’s randomized object state and stochastic algorithm’s nature, we developed a component for building and evaluating 2500 classifiers with different random state initializations. Extracting the model classifiers with the previously achieved accuracy resulted in five newly trained random forest classifiers. Performing the already described approach, we calculated the significant feature’s relevance and identified the most important variables for every iteration. Hence, we retrieve the additional data insight in terms of resistance mechanism interpretation, analyzing the extracted variables’ importance rank.
This process was wrapped up by incorporating joint features contribution analysis to provide a more profound symbiotic bacteria analysis for feature correlation and interaction in the final model predictions. To interpret the constitution of the entire trajectory of contributions, we could extract a specific combination of features that make significant individual and joint prediction contributions in correspondence to the resistance class. Decomposing the features’ contributions along the prediction path of the algorithm resulted in aggregated contributions which can better explain the impact of a set of correlated bacteria on the drug-resistance mechanism.

2.5. Data Normalization and Scaling

Different data normalization and scaling techniques were applied before the ML modeling process considering the various bacterial abundance distributions. Cronbach’s alpha reliability coefficient was calculated as a measure of internal consistency and featured correlation, respectively. We have imported a Scikit-learn built-in preprocessing module of the Standard Scaler (removing the mean and scaling to unit variance) and MinMax Scaler (transforming by scaling to a given range from 0.0 to 1.0) implementations. For data scaling and normalization in the KNIME Analytics program, we used MinMax Normalization, Z-Score Linear Normalization (Gaussian), and Normalization by Decimal Scaling. The centering and scaling methods were separately used for the training and test datasets, and were performed independently on each feature by computing the samples’ relevant statistics in the given dataset. The mean and standard deviation values were used for the transform functionality.

2.6. ML Modeling Screening Phase

We tried different well-known algorithms and industry standards addressing the data set, considering the binary classification study design. A preliminary algorithms screening phase, determined by the maximized accuracy factor, was performed to understand of the most promising technique for future observation and development. The data were randomly shuffled and divided into two separate datasets for training (70%) and testing (30%). Therefore, we applied naïve Bayes, logistic regression, K-nearest neighbor, support vector machine with principal component analysis (PCA), and decision tree algorithms.

2.7. ML Modeling

Referring to the performance metrics of the decision tree approach, we proceed to explore the ensemble-based algorithms (Scikit-learn random forest classifier in Python and tree ensemble learner in KNIME), building multiple decision trees and taking advantage of the tree-related majority voting. In terms of undertaking the machine learning algorithms selection, we focused on emphasizing the accuracy maximization and overall sensitivity and specificity metrics. Thus, we simulated and optimized different ML models in both development environments, applying different dataset splitting strategies and scaling and normalization techniques. The subset observed consisted of the CRC post-operative individuals, taking into account the follow-up medical assessment summary (individuals categorized as resistant and not resistant medical observations to the respective cancer treatment).

2.8. Highly Contributing Features

We compared both case models to analyze the input data relevance and identify the features with the most predictive power to the model. In the context of microbiome analysis, we denoted that the crucial features are the most informative ones defining the potential of significant bacteria for describing and understanding the CRC drug resistance mechanism. Scikit-learn random forest classifier in Python provides different techniques for computing the crucial algorithm variables. In this study, we used the importance of the random forest algorithm’s built-in features, the permutation method, and the technique of feature importance computed with SHAP values.
We performed calculations in the built-in feature relevance considering the Gini importance mean decrease impurity method to measure how each variable decreases the spit’s impurity in the specific tree. On the other hand, permutation based feature importance [26] randomly shuffles each feature and computes the change in the model’s performance. The features affecting the performance were identified as the most relevant ones. Ultimately, the SHAP interpretation [27] uses the Shapley values from game theory to estimate each feature’s influence on the prediction score.
The tree ensemble learner in KNIME provides a statistics table on the different decision trees’ attributes (output ports). We have developed an algorithm component for calculating the attribute importance regarding splitting value on the root, first, and second subsequent levels using statistics nodes. Therefore, we extracted and aggregated the most significant features for the specific use case.
Due to the potential drawbacks and tendency to prefer and favor individual or sets of potentially important features, we performed and combined the results to take advantage of all methods mentioned above. We compared the most relevant variables defined and extracted from both environments to provide narrowed feature sets. Therefore, this set of features was further analyzed and referenced as a set of crucial features that potentially play an important role in understanding the tumor proliferation mechanism impact on the reference gut microbiome dataset. This machine learning analysis assumed that high model accuracy directly influences the trustworthiness of the computed variable importance.
The overall model interpretation determines which variables have the most predictive power. However, using the tree interpreter library (v.0.2.3) [28] and applying the aggregated contributions convenience method on the most performant second-phase predictive model, we decomposed the prediction contribution for the individual predictions and aggregated them for the whole data set.
By analyzing the contribution of the joint features to the final probability of an instance, we were able to extract valuable conclusions on whether specific aggregated contributions impact the increase or decrease in the final resistance probabilities.

2.9. Statistical Analysis

The Mann–Whitney Wilcoxon rank-sum test was used for calculating the U value/p-value along with mean and median ranks between assigned classes in the microbial population of the dataset. We used the non-parametric test for understanding whether the distributions of the observations obtained between the two separate classes on a dependent variable significantly tend to differ from each other. The correspondent p-value probabilities for detecting the features with significantly different abundance levels between defined groups were calculated (using R and KNIME statistics nodes). Bonferroni and Benjamini–Hochberg p-value adjustments were additionally applied (R built-in functionality). The more conservative Bonferroni method for controlling the false positive rate (significance cut-off at α/n, where α = 0.05) was identified as statistically strict due to punishing all of the most important variables. Thus, we continued the analysis using Benjamini–Hochberg’s p-adjustment with a false discovery rate threshold of 0.15. The feature’s importance was ranked after calculating the p-values, followed by sorting according to the threshold of p-values < 0.05 (features were considered significant and extracted as potential key biomarkers for further biological analysis and interpretation).

3. Results

3.1. ML Modeling Screening Phase Results

The modeling screening phase is of huge importance since no gold standard is available for presenting trustworthy results. It was initially performed for trying and provisioning most of the well-known Scikit learn’s supervised learning classifiers. Using naïve Bayes did not result in significant performance metrics, giving overall accuracies no higher than 0.429. The assumption that all features are independent can be considered a limitation in this particular case. A similar model evaluation was retrieved using the logistic regression classifier, resulting in an accuracy of 0.425. The linearity between the dependent variable and the independent variables can be considered as a limitation. Furthermore, we tried the K-nearest neighbor algorithm (KNN) which was not able to retrieve a greater accuracy than 0.325. This can be potentially explained due to the high dimensionality as well as the sensitivity of choosing the neighbors based on the distance criteria. Utilizing the principal component analysis (PCA) with a support vector machine algorithm (SVM) resulted in achieving an overall accuracy of 0.497, which was also evaluated as a low performant approach.
We concluded that the most promising insight we retrieved was in using the decision tree approach, where we achieved a preliminary overall accuracy value of 0.764. Using the decision tree (‘gini’ attribute selection measure in correlation with the ‘best’ splitter as splitting strategy approach) provides additional benefit since the advantageous characteristic of decision trees is their comprehensibility. Although it has a simple visualization representation, this approach is beneficial because it forces the root split by some feature abundance distributions. The screening modeling phase results are summarized in Table 1.
Considering the decision tree algorithm’s accuracy, we continued modeling utilizing the tree-based random forest algorithm assuming that the performance metrics will be additionally improved by taking advantage of the tree-related majority voting.

3.2. ML Modeling Results

Since bioinformatical working environments are not standardized, in our opinion, it is essential to test and explore the random forest algorithm in different circumstances. We applied the practical ML modeling utilizing the random forest classifier implementations from two different experimental environments, Python-based Scikit-learn and KNIME. Moreover, we tried different data normalization/scaling techniques, splitting ratio and classifier parameters to provision and maximize models’ performance metrics. The process were designed following a two-phase strategy, where the first stage’s most significant features were used as a narrowed input scope for the second phase. Created models were additionally analyzed using k-fold cross-validation and hyperparameter tuning techniques. The main idea of this concept was identifying and observing the most significant features resulting from the second phase.
Scikit-learn standard scaler and Z-score normalization resulted in considerable research Cronbach’s alpha coefficients of over 0.85 for both resistant and not resistant sample groups. Two different random forest classifiers were designed with a cross-validation value of 20% as testing data. The standard scaled classifier performed with overall accuracies of 0.8. The classifier designed with z-score normalization performed with an overall 0.833 accuracy. Created ML models were further analyzed by trying k-fold cross-validation and hyperparameter tuning using the default built-in RandomizedSearchCV/GridSearchCV libraries (tuning the number of estimators, maximum depth of the threes, minimum number of samples required to split an internal node, a minimum number of samples required to be at a leaf node), and different algorithm parameter value setups. Since no significant improvements from the k-fold cross-validation were observed, we continued using the algorithm parameter tuning using different combinations for the number of trees in the forest (n_estimators), maximum depth of the tree (max_depth), and the number of features to consider when looking for the best split (max_features). Thus, the parameters’ setup of n_estimators = 55, max_depth = 5 and max_features = 3 resulted in increased algorithm metrics with an overall accuracy of 0.9. KNIME predictor configured the cross-validation value of 25% test data using the stratified sampling by additionally introduced ‘resistance’ target feature, was designed with z-score data normalization, where a Cronbach’s alpha of 0.854 was calculated. The Tree Ensemble Learner was configured with the Gini index split criterion.
Then, we proceed with the second ML iteration using the reduced most important features set. The standard scaled classifier (configured with the cross-validation value of 25% test data), where Cronbach’s alpha coefficient of 0.795 performed with an overall accuracy of 0.917. Experiencing similar behavior to the first iteration, we configured the same parameters set using the following values for the n_estimators = 25, max_depth = 4, and max_features = 3. Area under the curve (AUC) was calculated as value of 0.91. On the other hand, the Tree Ensemble Learner, configured with the Gini index split criterion and cross-validation value of 20% test data using randomly based sampling, resulted in Cronbach’s alpha coefficient of 0.795 and overall performance accuracy of 0.9. The general performance metrics are available in Table 2 and Table 3.
We concluded that the tree-based algorithms accomplished the highest scores compared with the other techniques we applied according to the performance metrics. We also tried XGBoost and AdaBoost algorithms, which resulted in no significant improvements compared with the forest-based approach described above. We identified the second-phase Python-based random forest classifier as the most performant and selected the resulting most important features as a reference set for further statistical analysis.

3.3. Statistical Analysis Results

Our taxonomic analysis of the raw data, assuming the improved taxonomical precision since the bacterial references are constantly changing, resulted in 3603 different bacterial taxonomic units detected. Thus, the gut microbiome consisted of 20 unique phyla, 35 classes, 72 orders, 119 families, and 259 unique genera—additional genus-level data were explored. The taxonomy on the genus level was unavailable for 1506 bacteria (3603/1506; 41.7%). From the remaining bacteria (2097; 58.2%), the most significant genera among the resistant samples belong to the statistically calculated Benjamini–Hochberg p-value interval from 0.009 to 0.024. Thus, in the resistant group, we found the Bacteroides (0.009), followed by Lachnoclostridium (0.017), Streptococcus (0.021), Eggerthella (0.024), Escherichia-Shigella (0.026), Flavonifractor (0.04), and [Ruminococcus] torques group (0.044). Accordingly, the most significant genera among the non-resistant samples belong to Benjamini–Hochberg p-value interval from 0.001 to 0.047. In the non-resistant group we found the Ruminococcus (0.002), Oscillospiraceae-UCG-002 (0.003), Oscillospiraceae NK4A214 group (0.010), Lachnospiraceae FCS020 group (0.019), Desulfovibrio (0.012), Intestinibacter (0.038), Christensenellaceae R-7 group (0.047), Clostridium sensu stricto 1 (0.016), Lachnospiraceae NC2004 group (0.037), Oscillospiraceae-UCG-005 (0.014), Blautia (0.045), and Alistipes (0.033). The statistical analysis results for genera abundances in resistant and non-resistant groups are presented in Figure 4.

3.4. Highly Contributing Features

The comparison for the resistant and non-resistant groups of samples presented a total of 86 unique genera. Subsequently, 28 were separated by the ML algorithm from these genera as the most important features (32.6%) ranking in an interval of statistically calculated Benjamini–Hochberg p-value from 0.002 to 0.049 between the groups. The most significant differentiation between the resistant and non-resistant groups were observed in the following genera: Ruminococcus, Oscillospiraceae-UCG-002, Eubacterium eligens group, Barnesiella, Bacteroides, Oscillospiraceae group, Desulfovibrio, Oscillospiraceae-UCG-005, Clostridium sensu stricto 1, Lachnoclostridium, and Lachnospiraceae FCS020 group (0.002, 0.003, 0.005, 0.007, 0.009, 0.010, 0.012, 0.014, 0.016, 0.017, and 0.019 respectively).
According to the models’ predictability and statistical analysis, we extracted the most significant genera acting as potential key biomarkers and factors for modulating the therapy resistance. Our findings are complementary to the other microbiome related studies published in the literature.
However, besides the practice of analyzing the particular feature significances, we went a step further decomposing the algorithm’s prediction path, extracting the aggregated feature contributions. This novel approach’s main aim was to explore what genera are mostly seen together and how they are jointly contributing to the resistance class. According to the stochastic nature of the algorithm, the aggregated contribution analysis can be done multiple times, considering all generated models following the same performance metrics as the referent one. For the purpose of our study, we proceed with the analysis using the selected Python-based best performant classifier from the second phase.
The benefit of the proposed aggregate analysis supports the thesis that resistance is not due to the presence of only a specific pathogenic genus in the patient microbiome, but several bacterial genera that live in symbiosis.

3.5. Joint Features Contribution Analysis Results

The symbiotic bacterial analysis generated different sets of joint feature combinations, providing a combined overview of the model’s predictability corresponding to the resistance class. As expected, the aggregated contributions are lower than the individual ones but uncover additional data insights regarding the constitution of the entire trajectory along the algorithm’s prediction path. These correlations reveal different genera joint impacts supporting the therapy-resistant effect. The joint feature contributions were calculated and extracted from the same Python-based random forest classifier, selected as the most performant second-phase predictive model.
Enterococcus, Blautia, Subdoligranulum, and Escherichia-Shigella were mostly observed contributing to the resistant group. Enterococcus is identified in correlation to Haemophilus, Intestinibacter, Ruminococcus, Lachnoclostridium, Weissella, Coprococcus, and Senegalimassilia. Blautia is commonly significant with Paraprevotella, Subdoligranulum, Oxalobacter, and TM7x genera. Subdoligranulum is retrieved as correlated to Escherichia-Shigella, Gemella, Negativibacillus, Blautia, Paraprevotella, and Escherichia-Shigella. Escherichia-Shigella is mostly observed in aggregated relation to Subdoligranulum, Coprococcus, Gemella, and Negativibacillus. The detailed aggregated features significances supporting the resistance behavior (contribution to the resistance class prediction) are presented in Table 4.
Weissella, Eisenbergiella, Escherichia-Shigella, Slackia, Phascolarctobacterium, and Ruminococcus were mostly observed contributing to the not resistant group. Weissella (individual algorithm importance rank of 0.016418) is perceived in aggregated correlation with Slackia (0.015248) and Eisenbergiella (0.017094). Phascolarctobacterium (0.014645) is discovered in relation to Streptococcus (0.023119), Paraprevotella (0.012763), Parasutterella (0.048950), Eisenbergiella (0.017094), and Barnesiella (0.009232). Escherichia-Shigella (0.033473) is retrieved as correlated to Negativibacillus (0.019078), Subdoligranulum (0.039651), Megasphaera (0.022836), and Veillonella (0.019204). Ruminococcus (0.038257) is mostly observed with Coprobacillus (0.015379), Turicibacter (0.013747), and Leuconostoc (0.012220). The detailed aggregated significances supporting the not resistance behavior (contribution to the not resistance class prediction) are presented in Table 5.
The aggregated contribution relations establish a fundamental ground for more profound future scientific research. The individual features importance ranks are available in Table S1.

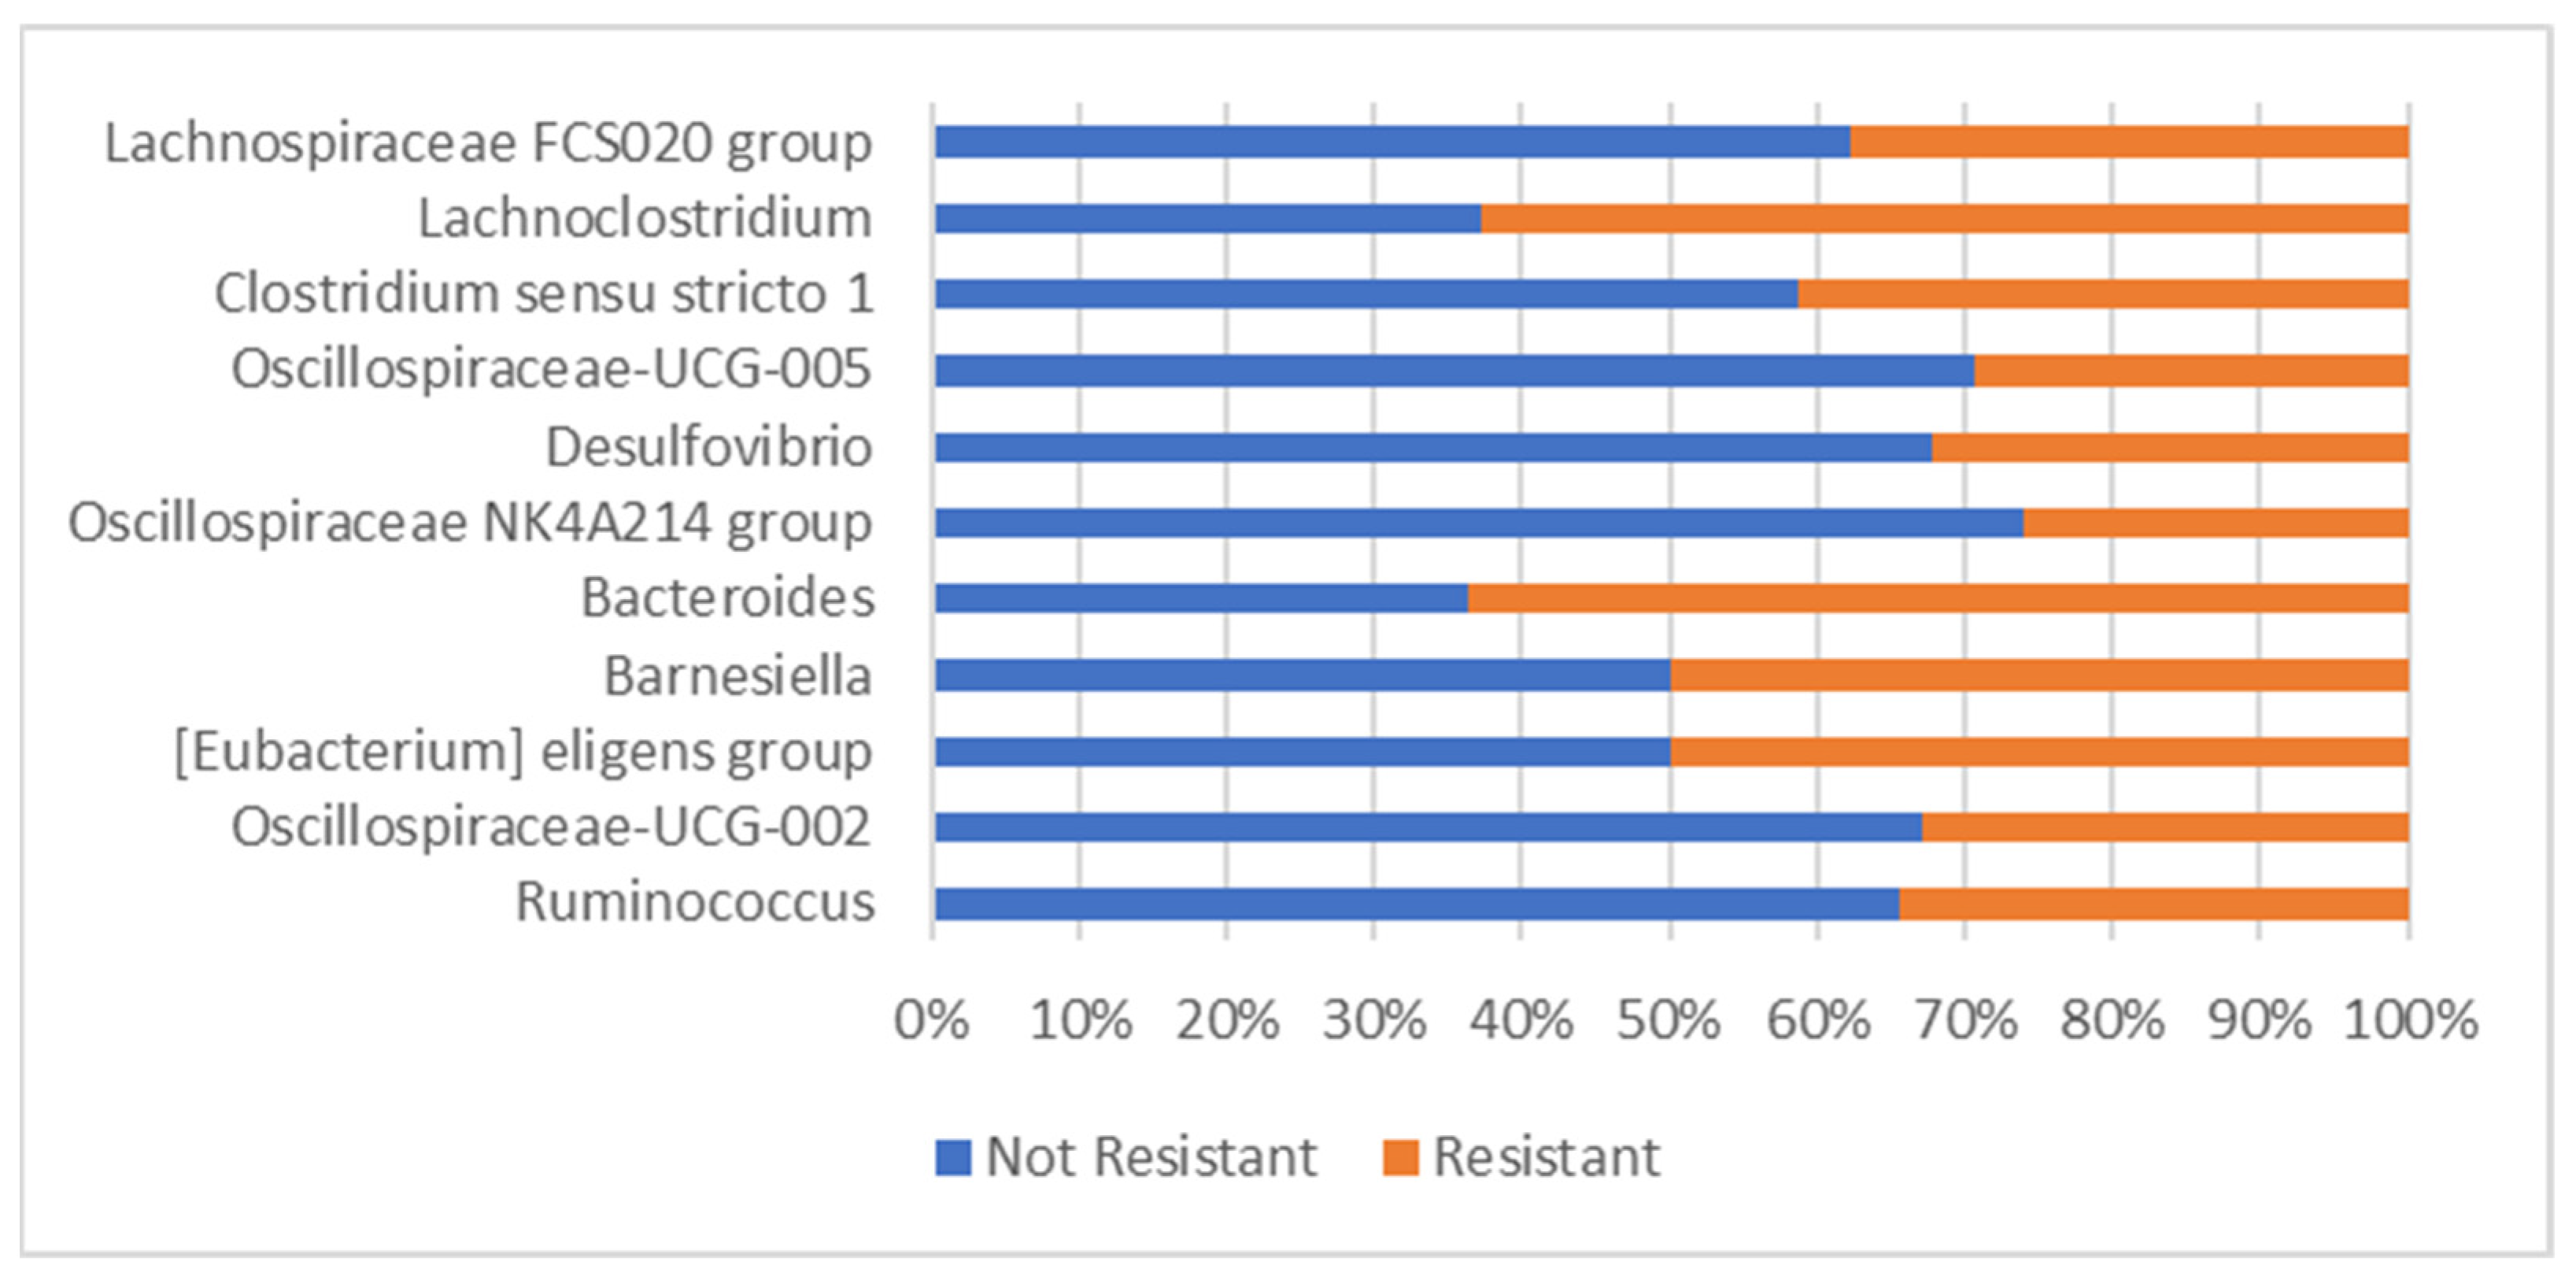
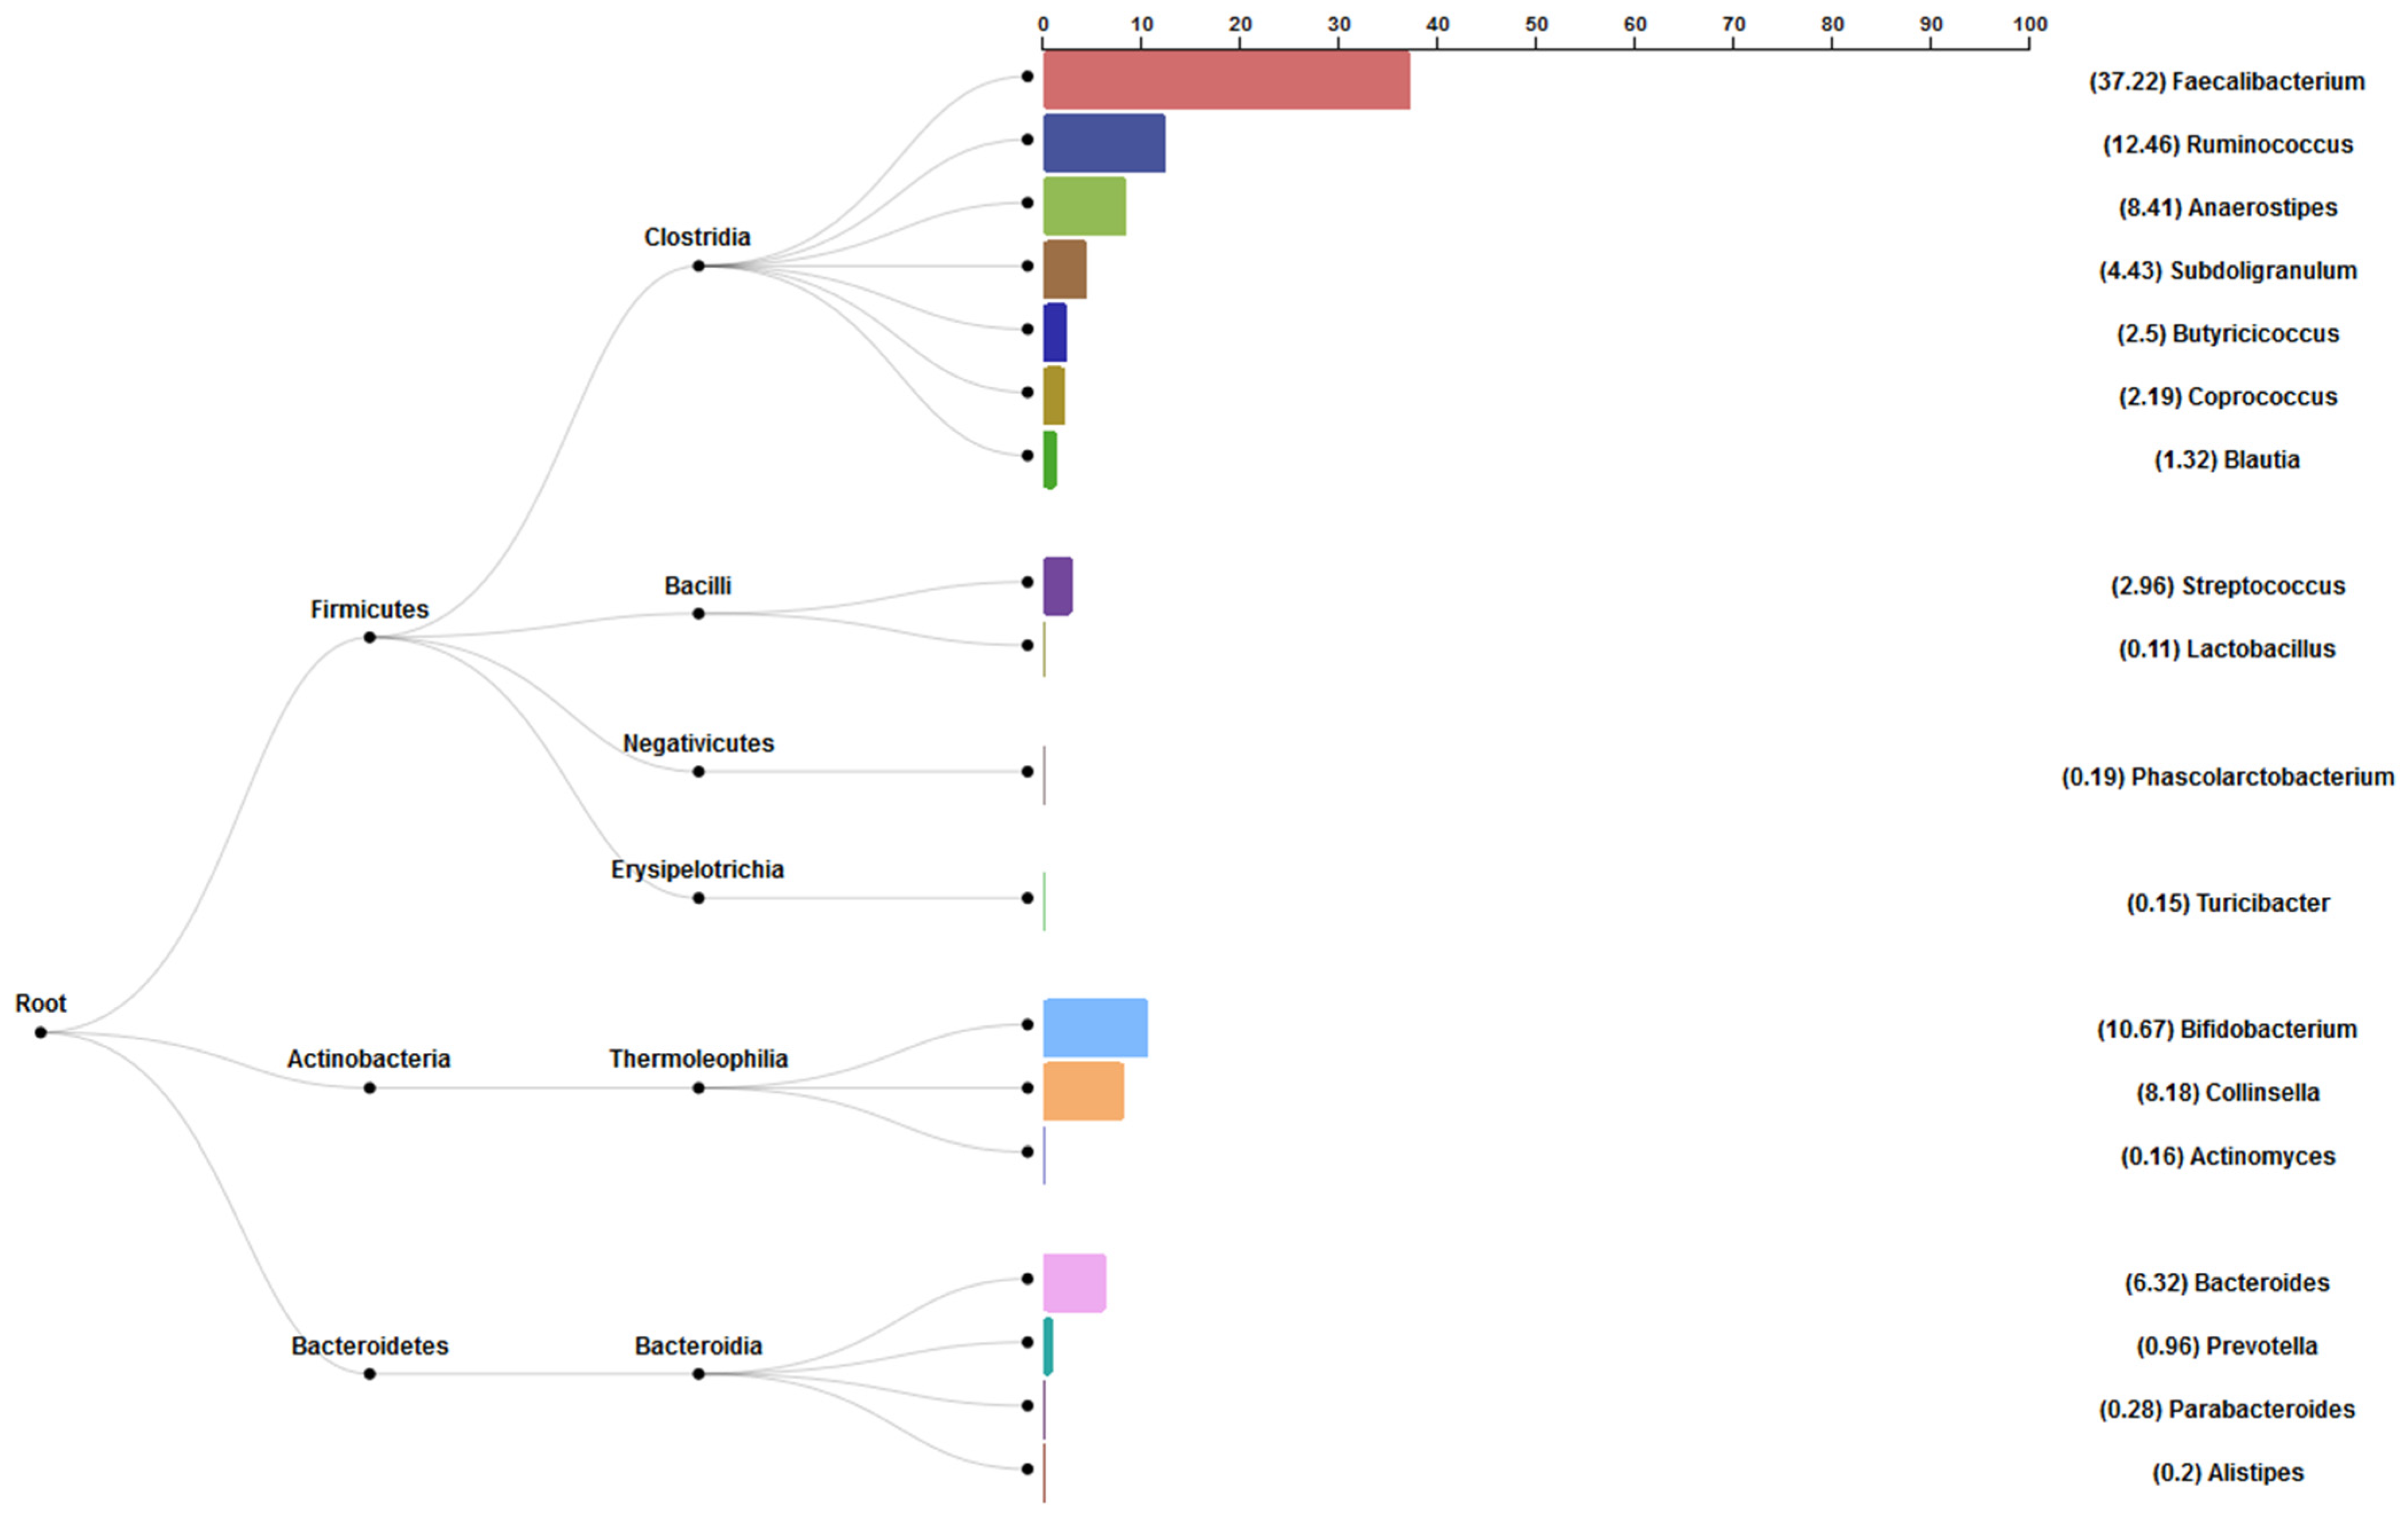
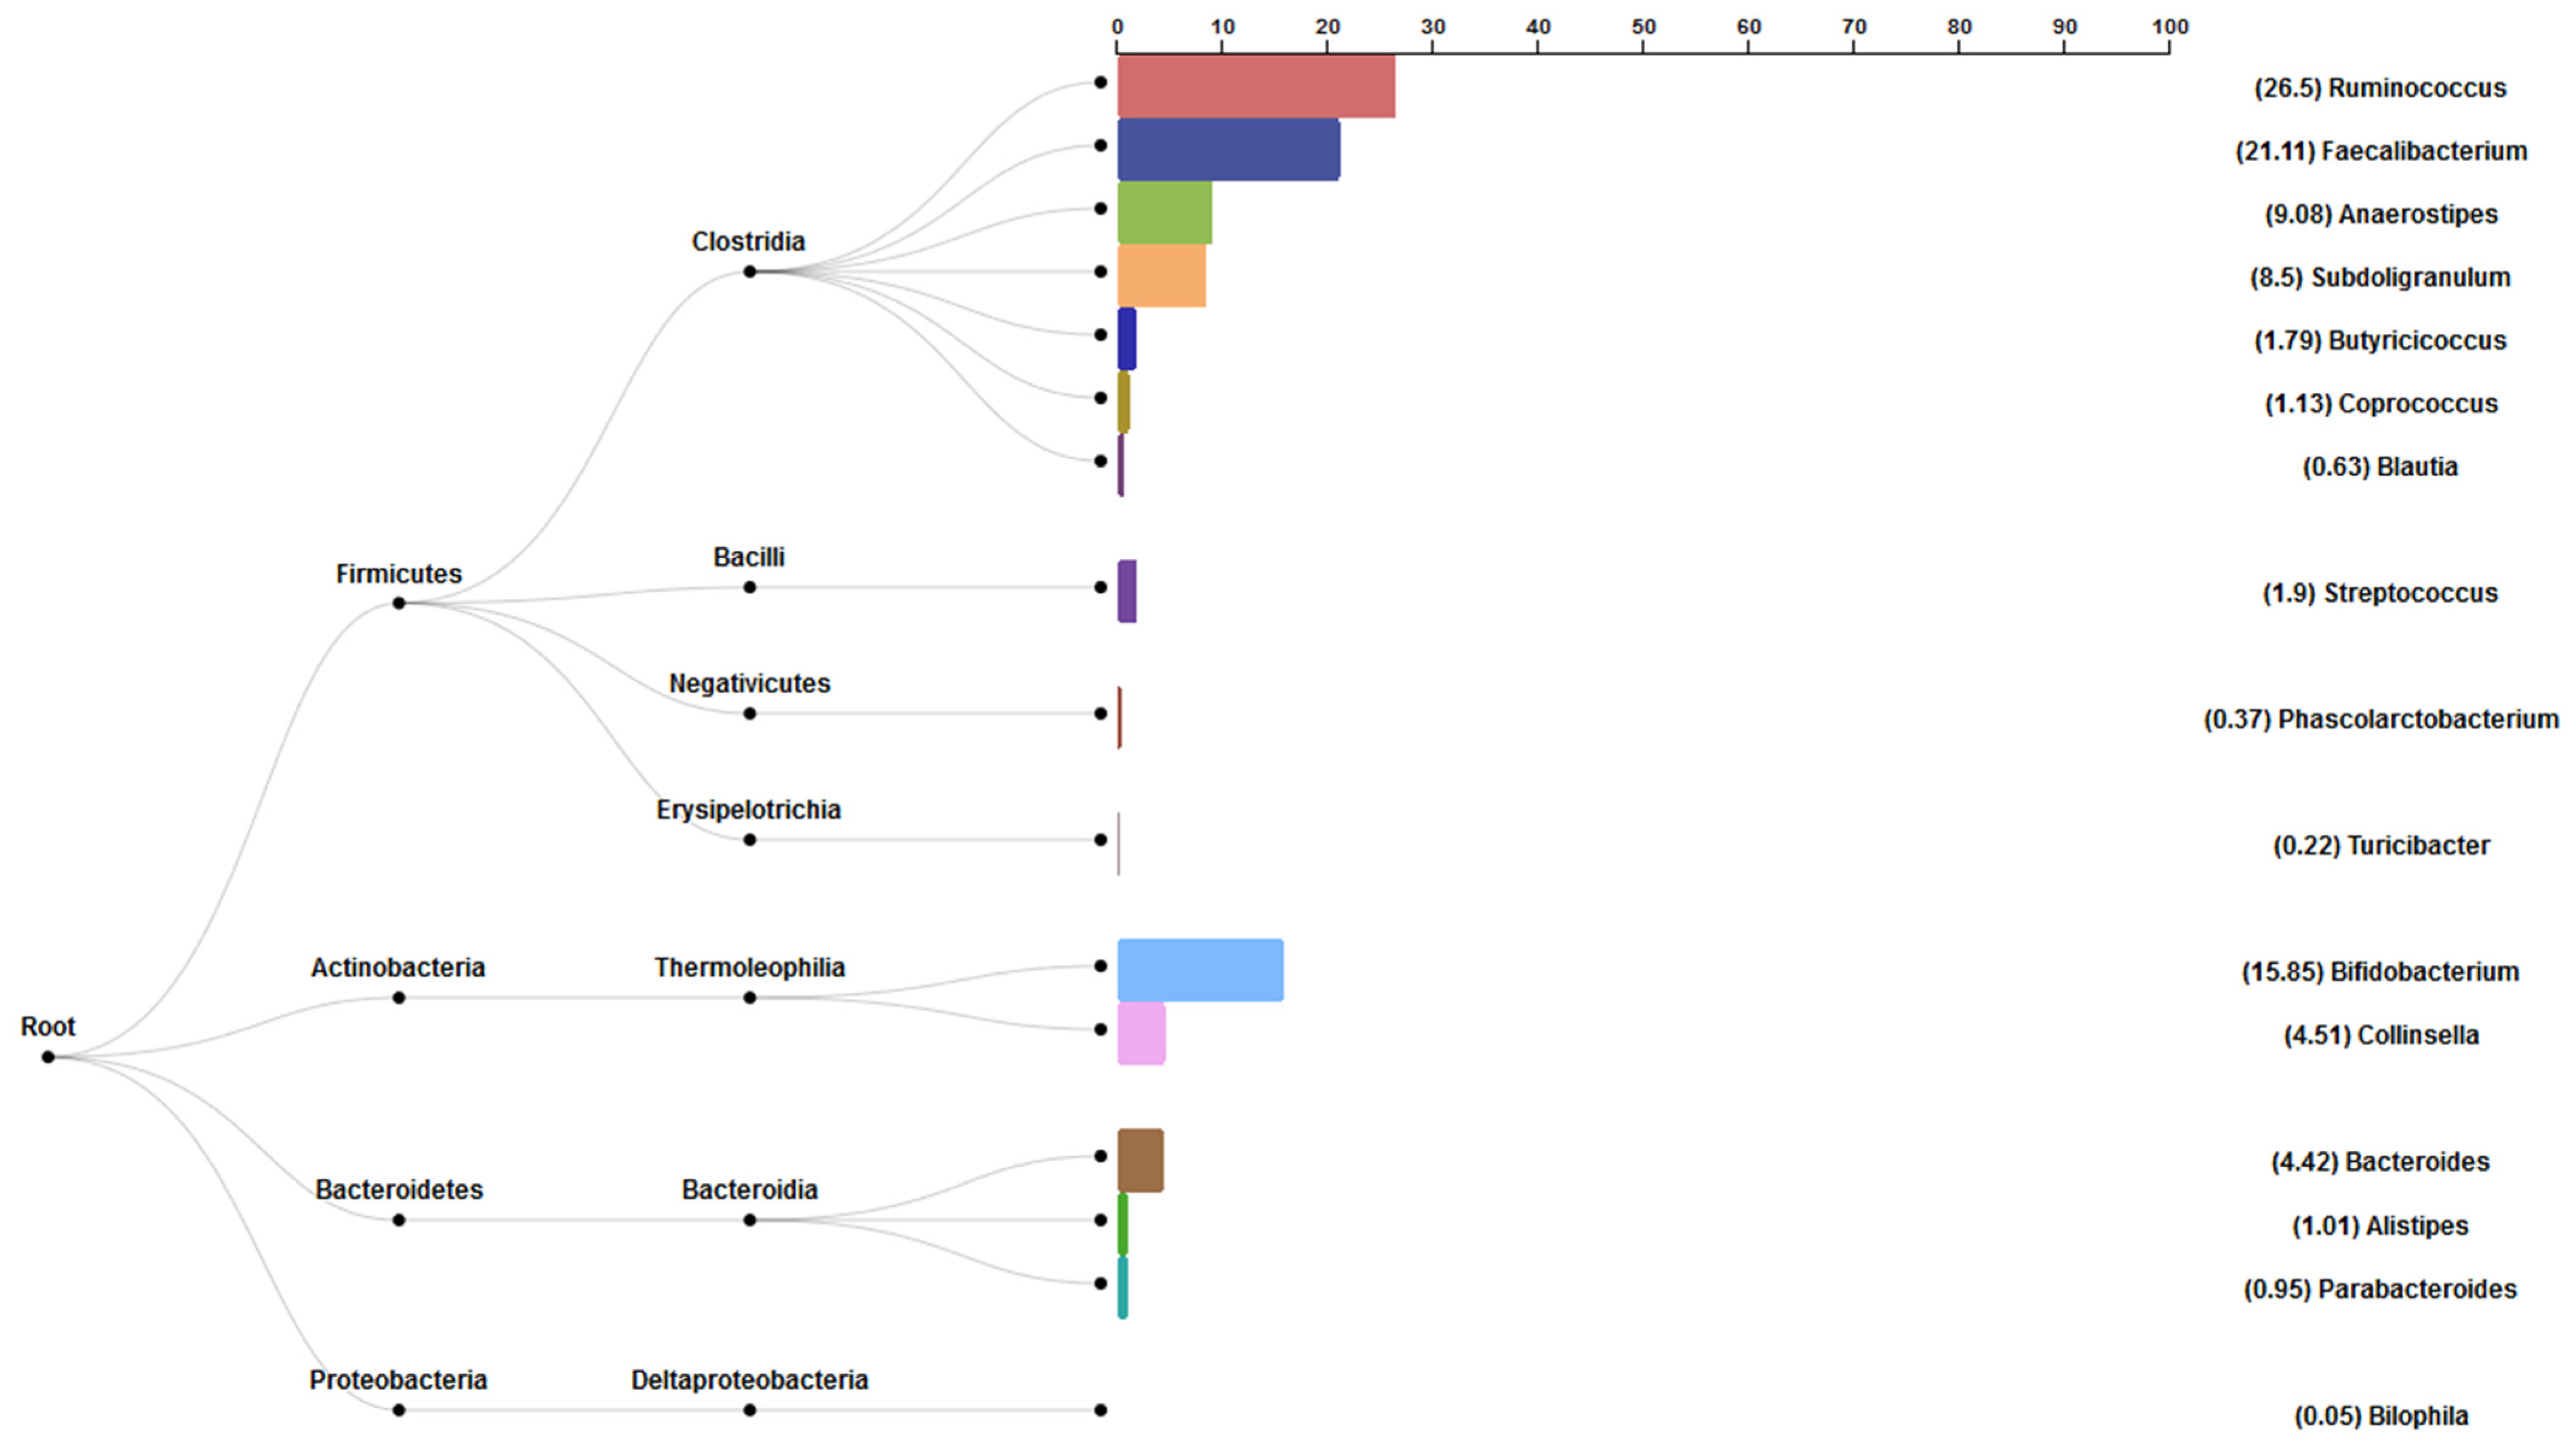
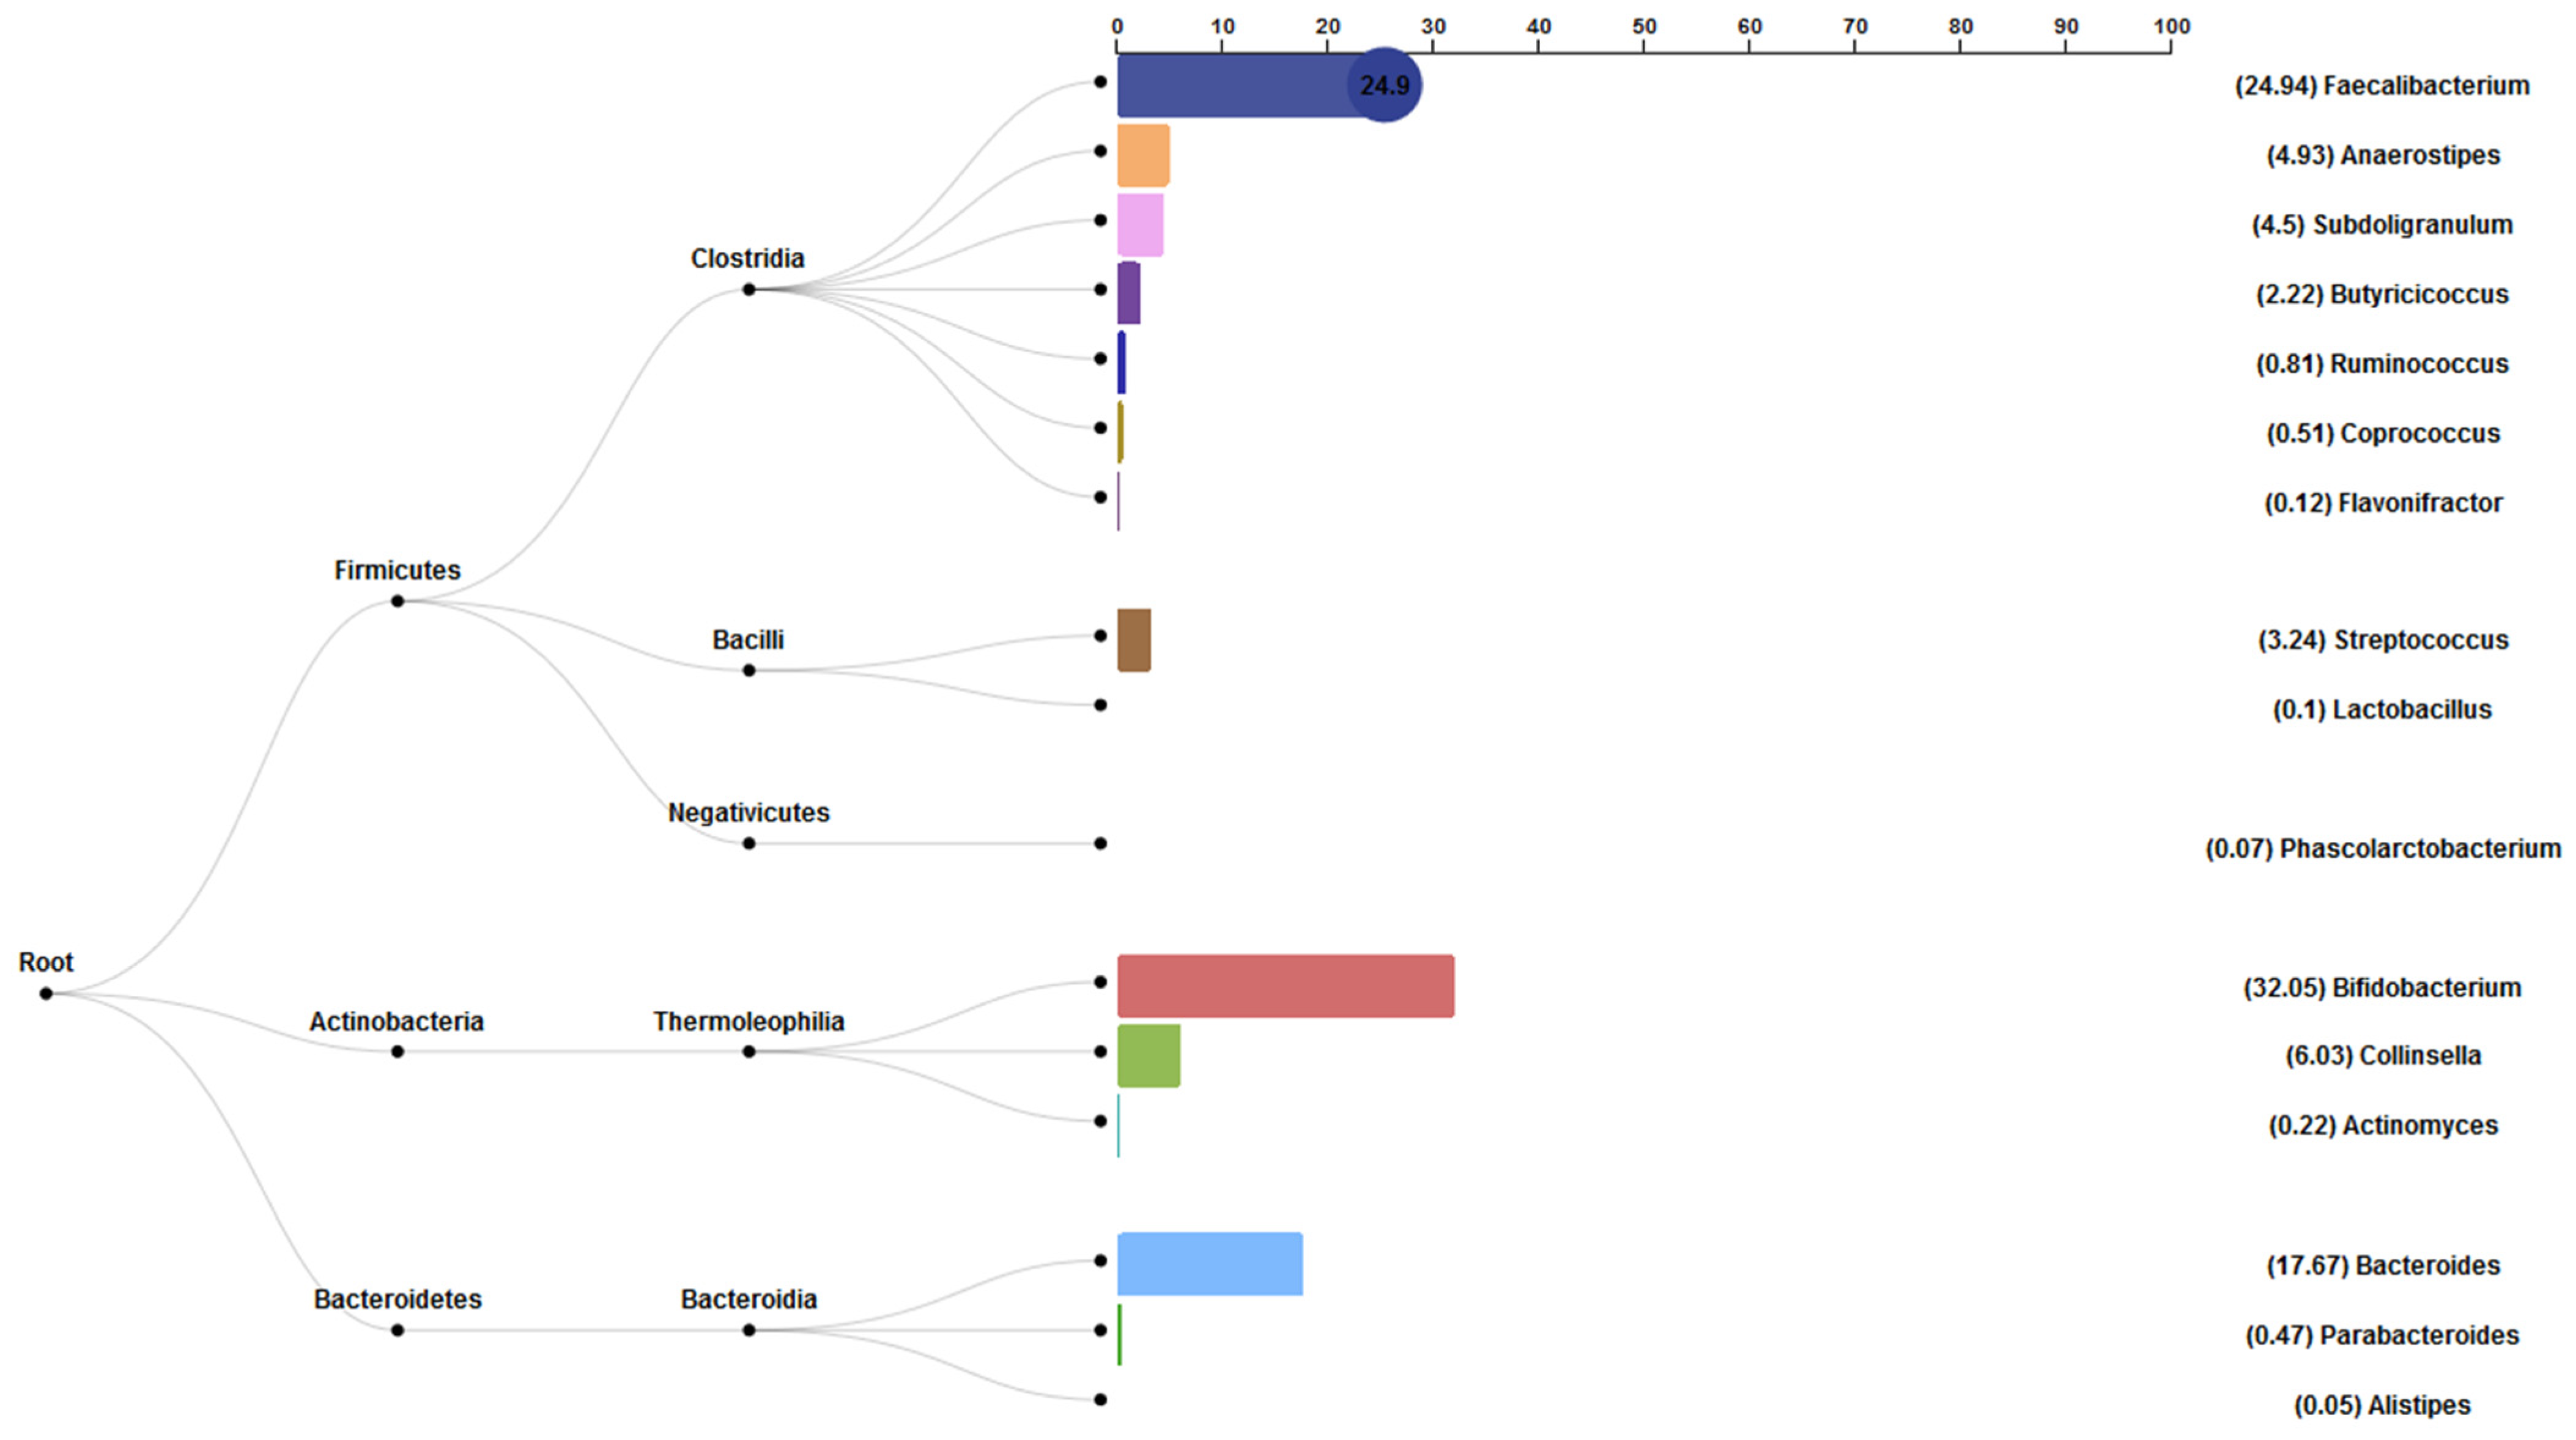
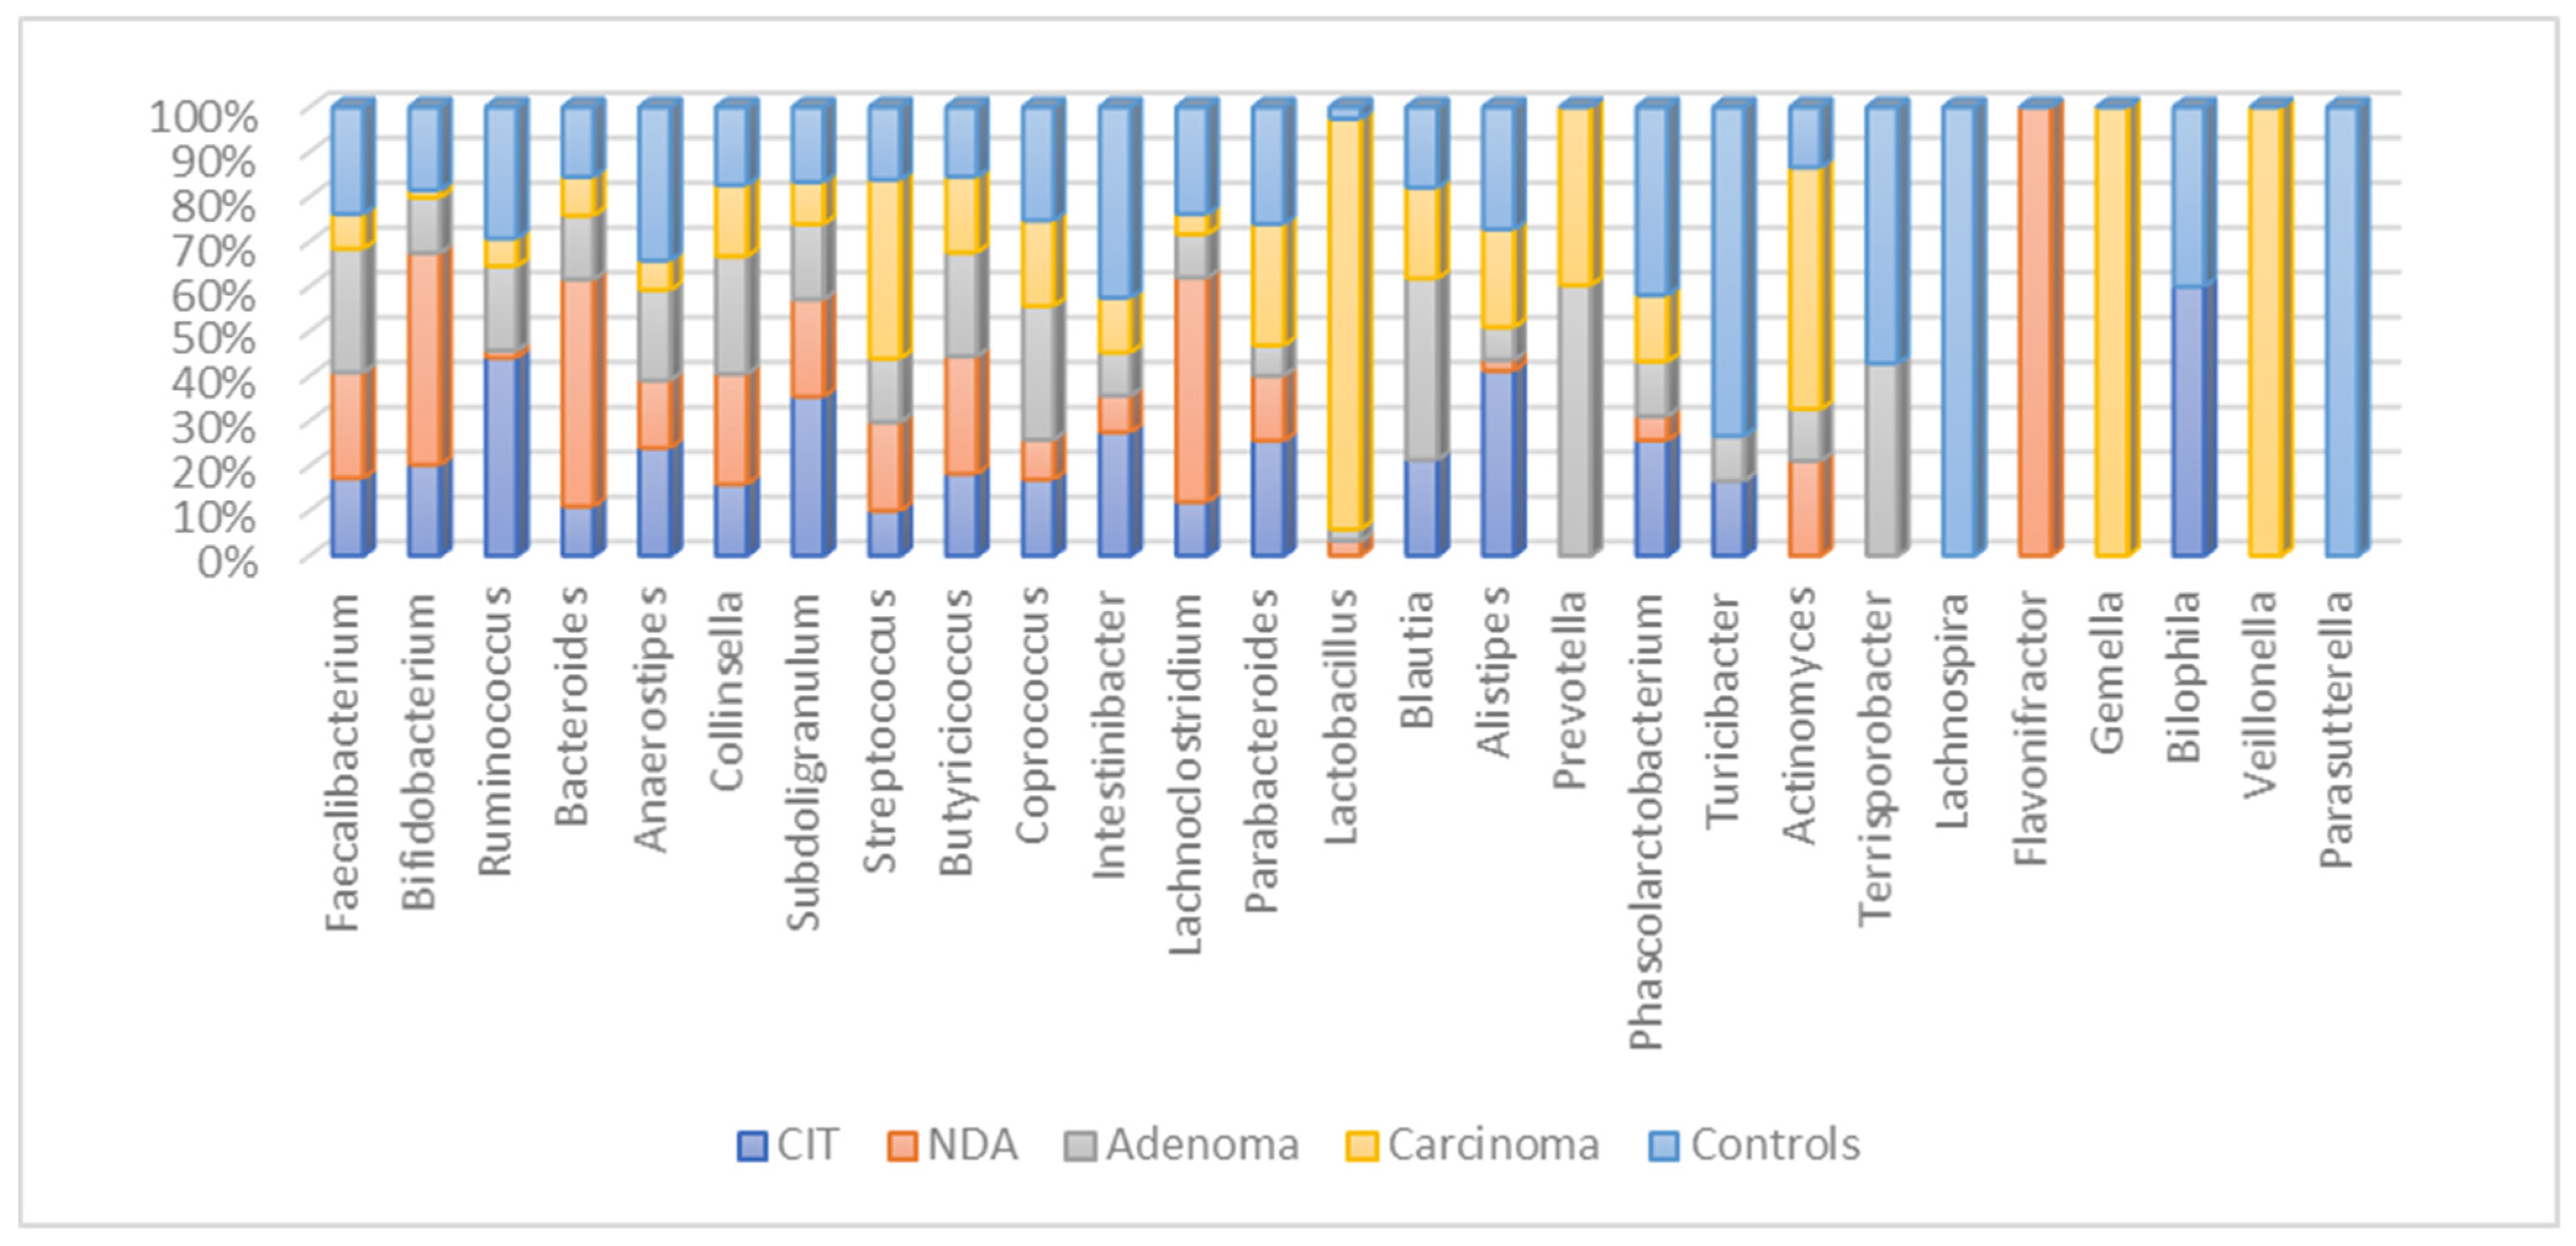
3.6. Bacterial Abundance Results

The previously created OTU tables were used to create a potential metabolomics profiling with the iVikodak workflow [29]. Although this type of inference should be performed from the metatranscriptomics datasets, they can give us insights into their potential roles in specific KEGG pathways. According to species abundance level, we can assume the influence of metabolites produced by the bacteria and their impact on the cellular mechanisms. The most abundant genus has been found to be the Faecalibacterium genus which could influence the development and support CRC development. This genus is less abundant in the non-resistant microbiome samples, and the concentration increases in resistant samples. Furthermore, the correlation between Faecalibacterium and CRC is enhanced with the evidence of the highest abundance of this genus in the not-treated CRC microbiome samples. The bacterial abundance is shown in Figure 5.
The second significant correlation was observed in correspondence to the Bifidobacterium genus. The inflammatory effect of the Bifidobacterium biofilm is supported by our results, as we observed the highest abundance in resistant samples. These cases are most prone to high immune response due to inflammations. Moreover, we observed a significant abundance of two beneficial genera, Ruminococcus and Bacteroides. The first one, Ruminococcus, has the highest abundance in the non-resistant group and partially decreases its abundance in the resistant group. The bacterial abundance is shown on Figure 6.
The abundance frequency pattern is slightly different in correspondence to the Bacteroides. Our results assume that the highest abundance of this genus is observed in the resistant samples because they are newly diagnosed cases that did not receive any drug treatment, while the treated resistant samples already have decreased the presence of Bacteroides. Due to the microbiome renewal ability, the non-resistant group has a higher abundance of this genus than the resistant cases. The bacterial abundance is shown in Figure 7.
The abundance frequency patterns covered in the analysis and segregated according to the diagnosis and control groups are visually presented in Figure 8.
The observed abundances show that some bacteria are present only in specific groups such as Parasutterella and Lachnospira that are found only in the control group. Therefore, mentioned bacteria are known to participate in the everyday protein catabolism in the colon of humans [4].
Considering the bacterial abundances, the bacterial abundance tendency in the non-resistant samples is summarized in Table 6, where p-values were calculated using the Benjamini–Hochberg statistical method.

4. Discussion

The human intestinal microbiota has a complex spectrum of bacteria, estimated to be nearly 1100 species [30]. Likewise, every bacterium influences different biological pathways and drug metabolism due to their enzymatic effects. Increasing evidence shows that understanding the gut microbiome can be a breakthrough discovery for the patient treatment responses, affecting the survival rates in various neoplasms, adenomas, and cancers.
The most frequent genus among the microbiome samples that we analyzed with our algorithm, Bacteroides, is already published in several studies that have a significant association with human CRC development [31]. This genus has been identified as an important feature from the model we used for comparison of resistant/non-resistant, in favor of the resistant group (p = 0.003, mean abundance 28). The enterotoxigenic Bacteroides bacteria has a critical impact on the CRC development and proliferation considering their biofilm production for colonization that results in a series of inflammatory reactions that encourages chronic intestinal inflammation and tissue damage [32]. Moreover, the functional studies done on mice verified that the presence of enterotoxigenic Bacteroides could directly promote intestinal carcinogenesis [33]. Additionally, the Alistipes bacteria, which is significantly increased in the non-resistant group, is living in symbiosis with the Bacteroides species because both are resistant to vancomycin, kanamycin, and colistin. These two species have similar pathways for amino acid fermentation supporting colon inflammation and adenoma development [5,34].
Additionally, the most compelling genus with the highest p-value was Ruminococcus. This genus is in favor of the non-resistant patients. This study highlights the fundamental role of gut microbiota in cancer development and progression along with chemotherapy outcomes. It is understandable that the Barnesiella species shows high correlation with the non-resistant group since its metabolites indicate infiltration of interferon-γ-producing γδT cells in cancer tissues. Furthermore, it is shown that this species can interfere with the impact of the anticancer immunomodulatory agents and prevent cancer treatment [15].
The resistance mechanism bacterial function table we composed from our study is summarized and discussed in Table 7.
Although we are familiar with the single impact of one genus in the patient microbiome, we are still far from answering why several genera are frequently found together and if the resistance is based on the presence of one genus or the presence of several genera together.

5. Conclusions

This study introduced a multidisciplinary systematic approach and a methodology for observing colorectal cancer carcinogenesis using microbial composition specified at the genus level. Leveraging the concepts of the bioinformatics studies, different highly performant machine learning models were developed to assist clinicians in efficiently analyzing resistant patients’ microbiome diversity to address and threaten tumor proliferation, newly developed adenoma, inflammation promotion, and potential DNA damage. The random forest classifier was identified as the most suitable algorithm for empowering follow-up technique for features significance interpretation. The most important genera were used in the pathway analysis to understand their biological roles and activities. The significant features relevance was further observed using the stochastic algorithm’s nature, where additional data insights and variables’ importance ranks were retrieved. Finally, symbiotic bacteria analysis was performed for features correlation and interaction (joint features contribution in correspondence to the resistance class). Thus far, many studies point out the importance of present genera in the microbiome and intend to treat it separately. This study points out the different perspectives of a treatment since our aggregate analysis gives clear results for the genera that are often found together in a resistant group of patients, meaning that resistance is not due to the presence of one pathogenic genus in the patient microbiome, but several bacterial genera that live in symbiosis.
The established methodology can also be used for unseen microbiome data that can help oncologists decide on treatment and post-treatment strategy for immunotherapy and drug resistance understandings.

Supplementary Materials

The following are available online at https://0-www-mdpi-com.brum.beds.ac.uk/article/10.3390/app12094094/s1, Figure S1: Reference study raw data context: (a) General microbiome samples overview; (b) Resistant and Nonresistant post-operative samples ratio overview. Table S1: Detailed overview of the classifier’s individual features importance ranks.

Author Contributions

Conceptualization, O.U.S. and S.K.; Methodology, O.U.S., S.K. and M.C.; Software, M.C. and O.Ö.; Validation, O.U.S., S.K. and O.Ö.; Formal analysis, M.C. and M.J.Ö.; Investigation, O.Ö., M.C. and M.J.Ö.; Resources, O.U.S. and O.Ö.; Data curation, O.Ö. and M.C.; Writing—original draft preparation, M.C. and M.J.Ö.; Writing—review and editing, S.K. and O.U.S.; Visualization, M.C. and S.K.; Supervision, O.U.S. and S.K.; Project administration, O.U.S. and S.K.; Funding acquisition, O.U.S., S.K. and M.C. All authors have read and agreed to the published version of the manuscript.

Funding

This research was supported by the European Cooperation in Science and Technology as part of the Short-Term Scientific Mission (STSM) within the COST Action CA18131—Statistical and machine learning techniques in human microbiome studies (ML4Microbiome), under the STSM number of 47729.

Acknowledgments

The authors would like to thank Biostatistics and Medical Informatics Department, Acibadem Mehmet Ali Aydinlar University, Istanbul and Sezerman Lab, for providing their technical infrastructure and practical bioinformatics knowledge to this work. We also acknowledge the support from the MSCA ITN Cell2Cell fellowship to L.L.E. project. This article is based upon work from the COST Action CA18131-Statistical and machine learning techniques in human microbiome studies, supported by COST (European Cooperation in Science and Technology). COST is a funding agency for research and innovation networks. Our Actions help connect research initiatives across Europe and enable scientists to grow their ideas by sharing them with their peers. It boosts their research, career, and innovation. More information is available online: www.cost.eu (accessed on 6 January 2022).

Conflicts of Interest

The authors declare no conflict of interest.

References

  1. Sung, H.; Ferlay, J.; Siegel, R.L.; Laversanne, M.; Soerjomataram, I.; Jemal, A.; Bray, F. Global Cancer Statistics 2020: GLOBOCAN Estimates of Incidence and Mortality Worldwide for 36 Cancers in 185 Countries. CA Cancer J. Clin. 2021, 71, 209–249. [Google Scholar] [CrossRef] [PubMed]
  2. Cheng, W.Y.; Wu, C.-Y.; Yu, J. The Role of Gut Microbiota in Cancer Treatment: Friend or Foe? Gut 2020, 69, 1867. [Google Scholar] [CrossRef] [PubMed]
  3. Zhang, X.; Zhao, S.; Song, X.; Jia, J.; Zhang, Z.; Zhou, H.; Fu, H.; Cui, H.; Hu, S.; Fang, M.; et al. Inhibition Effect of Glycyrrhiza Polysaccharide (GCP) on Tumor Growth through Regulation of the Gut Microbiota Composition. J. Pharmacol. Sci. 2018, 137, 324–332. [Google Scholar] [CrossRef] [PubMed]
  4. Carding, S.; Verbeke, K.; Vipond, D.T.; Corfe, B.M.; Owen, L.J. Dysbiosis of the Gut Microbiota in Disease. Microb. Ecol. Health Dis. 2015, 26, 26191. [Google Scholar] [CrossRef] [PubMed]
  5. Si, H.; Yang, Q.; Hu, H.; Ding, C.; Wang, H.; Lin, X. Colorectal Cancer Occurrence and Treatment Based on Changes in Intestinal Flora. Semin. Cancer Biol. 2021, 70, 3–10. [Google Scholar] [CrossRef] [PubMed]
  6. Yang, Y.; Weng, W.; Peng, J.; Hong, L.; Yang, L.; Toiyama, Y.; Gao, R.; Liu, M.; Yin, M.; Pan, C.; et al. Fusobacterium Nucleatum Increases Proliferation of Colorectal Cancer Cells and Tumor Development in Mice by Activating Toll-Like Receptor 4 Signaling to Nuclear Factor−κB, and Up-Regulating Expression of MicroRNA-21. Gastroenterology 2017, 152, 851–866.e24. [Google Scholar] [CrossRef] [Green Version]
  7. Long, X.; Wong, C.C.; Tong, L.; Chu, E.S.H.; Szeto, C.H.; Go, M.Y.Y.; Coker, O.O.; Chan, A.W.H.; Chan, F.K.L.; Sung, J.J.Y.; et al. Peptostreptococcus Anaerobius Promotes Colorectal Carcinogenesis and Modulates Tumour Immunity. Nat. Microbiol. 2019, 4, 2319–2330. [Google Scholar] [CrossRef]
  8. Chung, L.; Orberg, E.T.; Geis, A.L.; Chan, J.L.; Fu, K.; Shields, C.E.D.; Dejea, C.M.; Fathi, P.; Chen, J.; Finard, B.B.; et al. Bacteroides Fragilis Toxin Coordinates a Pro-Carcinogenic Inflammatory Cascade via Targeting of Colonic Epithelial Cells. Cell Host Microbe 2018, 23, 203–214.e5. [Google Scholar] [CrossRef] [Green Version]
  9. Rubinstein, M.R.; Wang, X.; Liu, W.; Hao, Y.; Cai, G.; Han, Y.W. Fusobacterium Nucleatum Promotes Colorectal Carcinogenesis by Modulating E-Cadherin/β-Catenin Signaling via Its FadA Adhesin. Cell Host Microbe 2013, 14, 195–206. [Google Scholar] [CrossRef] [Green Version]
  10. Sánchez-Alcoholado, L.; Ramos-Molina, B.; Otero, A.; Laborda-Illanes, A.; Ordóñez, R.; Medina, J.A.; Gómez-Millán, J.; Queipo-Ortuño, M.I. The Role of the Gut Microbiome in Colorectal Cancer Development and Therapy Response. Cancers 2020, 12, 1406. [Google Scholar] [CrossRef]
  11. Gut Microbiota Modulation: A Novel Strategy for Prevention and Treatment of Colorectal Cancer. Oncogene 2020, 39, 4925–4943. [CrossRef] [PubMed]
  12. Longley, D.B.; Harkin, D.P.; Johnston, P.G. 5-Fluorouracil: Mechanisms of Action and Clinical Strategies. Nat. Rev. Cancer 2003, 3, 330–338. [Google Scholar] [CrossRef] [PubMed]
  13. Ma, W.; Mao, Q.; Xia, W.; Dong, G.; Yu, C.; Jiang, F. Gut Microbiota Shapes the Efficiency of Cancer Therapy. Front. Microbiol. 2019, 10, 1050. [Google Scholar] [CrossRef] [PubMed] [Green Version]
  14. Cammarota, G.; Ianiro, G.; Ahern, A.; Carbone, C.; Temko, A.; Claesson, M.J.; Gasbarrini, A.; Tortora, G. Gut Microbiome, Big Data and Machine Learning to Promote Precision Medicine for Cancer. Nat. Rev. Gastroenterol. Hepatol. 2020, 17, 635–648. [Google Scholar] [CrossRef] [PubMed]
  15. Cheung, H.; Yu, J. Machine Learning on Microbiome Research in Gastrointestinal Cancer. J. Gastroenterol. Hepatol. 2021, 36, 817–822. [Google Scholar] [CrossRef]
  16. Marcos-Zambrano, L.J.; Karaduzovic-Hadziabdic, K.; Loncar Turukalo, T.; Przymus, P.; Trajkovik, V.; Aasmets, O.; Berland, M.; Gruca, A.; Hasic, J.; Hron, K.; et al. Applications of Machine Learning in Human Microbiome Studies: A Review on Feature Selection, Biomarker Identification, Disease Prediction and Treatment. Front. Microbiol. 2021, 12, 634511. [Google Scholar] [CrossRef]
  17. Ai, D.; Pan, H.; Han, R.; Li, X.; Liu, G.; Xia, L.C. Using Decision Tree Aggregation with Random Forest Model to Identify Gut Microbes Associated with Colorectal Cancer. Genes 2019, 10, 112. [Google Scholar] [CrossRef] [Green Version]
  18. Wu, Y.; Jiao, N.; Zhu, R.; Zhang, Y.; Wu, D.; Wang, A.J.; Fang, S.; Tao, L.; Li, Y.; Cheng, S.; et al. Identification of Microbial Markers across Populations in Early Detection of Colorectal Cancer. Nat. Commun. 2021, 12, 3063. [Google Scholar] [CrossRef]
  19. Ai, L.; Tian, H.; Chen, Z.; Chen, H.; Xu, J.; Fang, J.Y. Systematic Evaluation of Supervised Classifiers for Fecal Microbiota-Based Prediction of Colorectal Cancer. Oncotarget 2017, 8, 9546–9556. [Google Scholar] [CrossRef] [Green Version]
  20. Sklearn.Ensemble.RandomForestClassifier. Available online: https://scikit-learn/stable/modules/generated/sklearn.ensemble.RandomForestClassifier.html (accessed on 10 February 2022).
  21. KNIME|Open for Innovation. Available online: https://www.knime.com/ (accessed on 10 February 2022).
  22. Jin, Y.; Liu, Y.; Zhao, L.; Zhao, F.; Feng, J.; Li, S.; Chen, H.; Sun, J.; Zhu, B.; Geng, R.; et al. Gut Microbiota in Patients after Surgical Treatment for Colorectal Cancer. Environ. Microbiol. 2019, 21, 772–783. [Google Scholar] [CrossRef] [Green Version]
  23. Unofficial BBMap Repository. Paris, France. 2021. Available online: https://github.com/BioInfoTools/BBMap (accessed on 10 February 2022).
  24. Callahan, B.J.; McMurdie, P.J.; Rosen, M.J.; Han, A.W.; Johnson, A.J.A.; Holmes, S.P. DADA2: High-Resolution Sample Inference from Illumina Amplicon Data. Nat. Methods 2016, 13, 581–583. [Google Scholar] [CrossRef] [PubMed] [Green Version]
  25. Silva. Available online: https://www.arb-silva.de/ (accessed on 10 February 2022).
  26. Breiman, L. Random Forests. Mach. Learn. 2001, 45, 5–32. [Google Scholar] [CrossRef] [Green Version]
  27. Lundberg, S. Slundberg/Shap. Available online: https://github.com/slundberg/shap (accessed on 10 February 2022).
  28. Treeinterpreter: Package for Interpreting Scikit-Learn’s Decision Tree and Random Forest Predictions. Available online: https://pypi.org/project/treeinterpreter/ (accessed on 10 February 2022).
  29. Nagpal, S.; Haque, M.M.; Mande, S.S. Vikodak—A Modular Framework for Inferring Functional Potential of Microbial Communities from 16S Metagenomic Datasets. PLoS ONE 2016, 11, e0148347. [Google Scholar] [CrossRef] [PubMed]
  30. Qin, J.; Li, R.; Raes, J.; Arumugam, M.; Burgdorf, K.S.; Manichanh, C.; Nielsen, T.; Pons, N.; Levenez, F.; Yamada, T.; et al. A Human Gut Microbial Gene Catalogue Established by Metagenomic Sequencing. Nature 2010, 464, 59–65. [Google Scholar] [CrossRef] [PubMed] [Green Version]
  31. Yu, J.; Feng, Q.; Wong, S.H.; Zhang, D.; Liang, Q.Y.; Qin, Y.; Tang, L.; Zhao, H.; Stenvang, J.; Li, Y.; et al. Metagenomic Analysis of Faecal Microbiome as a Tool towards Targeted Non-Invasive Biomarkers for Colorectal Cancer. Gut 2017, 66, 70–78. [Google Scholar] [CrossRef]
  32. Cheng, W.T.; Kantilal, H.K.; Davamani, F. The Mechanism of Bacteroides Fragilis Toxin Contributes to Colon Cancer Formation. Malays. J. Med. Sci. 2020, 27, 9–21. [Google Scholar] [CrossRef]
  33. Wong, S.H.; Zhao, L.; Zhang, X.; Nakatsu, G.; Han, J.; Xu, W.; Xiao, X.; Kwong, T.N.Y.; Tsoi, H.; Wu, W.K.K.; et al. Gavage of Fecal Samples from Patients with Colorectal Cancer Promotes Intestinal Carcinogenesis in Germ-Free and Conventional Mice. Gastroenterology 2017, 153, 1621–1633.e6. [Google Scholar] [CrossRef] [Green Version]
  34. Viaud, S.; Saccheri, F.; Mignot, G.; Yamazaki, T.; Daillère, R.; Hannani, D.; Enot, D.P.; Pfirschke, C.; Engblom, C.; Pittet, M.J.; et al. The Intestinal Microbiota Modulates the Anticancer Immune Effects of Cyclophosphamide. Science 2013, 342, 971–976. [Google Scholar] [CrossRef] [Green Version]
  35. Yu, Y.; Lu, J.; Oliphant, K.; Gupta, N.; Claud, K.; Lu, L. Maternal Administration of Probiotics Promotes Gut Development in Mouse Offsprings. PLoS ONE 2020, 15, e0237182. [Google Scholar] [CrossRef]
  36. Lian, J.; Hua, T.; Xu, J.; Ding, J.; Liu, Z.; Fan, Y. Interleukin-1β Weakens Paclitaxel Sensitivity through Regulating Autophagy in the Non-small Cell Lung Cancer Cell Line A549. Exp. Ther. Med. 2021, 21, 293. [Google Scholar] [CrossRef]
  37. Dovrolis, N.; Michalopoulos, G.; Theodoropoulos, G.E.; Arvanitidis, K.; Kolios, G.; Sechi, L.A.; Eliopoulos, A.G.; Gazouli, M. The Interplay between Mucosal Microbiota Composition and Host Gene-Expression Is Linked with Infliximab Response in Inflammatory Bowel Diseases. Microorganisms 2020, 8, 438. [Google Scholar] [CrossRef] [PubMed] [Green Version]
  38. Anani, H.; Abdallah, R.A.; Khoder, M.; Fontanini, A.; Mailhe, M.; Ricaboni, D.; Raoult, D.; Fournier, P.E. Colibacter Massiliensis Gen. Nov. Sp. Nov., a Novel Gram-Stain-Positive Anaerobic Diplococcal Bacterium, Isolated from the Human Left Colon. Sci. Rep. 2019, 9, 17199. [Google Scholar] [CrossRef] [PubMed]
  39. Ubeda, C.; Bucci, V.; Caballero, S.; Djukovic, A.; Toussaint, N.C.; Equinda, M.; Lipuma, L.; Ling, L.; Gobourne, A.; No, D.; et al. Intestinal Microbiota Containing Barnesiella Species Cures Vancomycin-Resistant Enterococcus Faecium Colonization. Infect. Immun. 2013, 81, 965–973. [Google Scholar] [CrossRef] [PubMed] [Green Version]
  40. Jia, W.; Rajani, C.; Xu, H.; Zheng, X. Gut Microbiota Alterations Are Distinct for Primary Colorectal Cancer and Hepatocellular Carcinoma. Protein Cell 2020, 12, 374–393. [Google Scholar] [CrossRef]
  41. Daillère, R.; Vétizou, M.; Waldschmitt, N.; Yamazaki, T.; Isnard, C.; Poirier-Colame, V.; Duong, C.P.M.; Flament, C.; Lepage, P.; Roberti, M.P.; et al. Enterococcus Hirae and Barnesiella Intestinihominis Facilitate Cyclophosphamide-Induced Therapeutic Immunomodulatory Effects. Immunity 2016, 45, 931–943. [Google Scholar] [CrossRef] [Green Version]
  42. Forslund, K.; Hildebrand, F.; Nielsen, T.; Falony, G.; Chatelier, E.L.; Sunagawa, S.; Prifti, E.; Vieira-Silva, S.; Gudmundsdottir, V.; Pedersen, H.K.; et al. Disentangling Type 2 Diabetes and Metformin Treatment Signatures in the Human Gut Microbiota. Nature 2015, 528, 262–266. [Google Scholar] [CrossRef]
  43. Wang, Y.; Gao, X.; Zhang, X.; Xiao, F.; Hu, H.; Li, X.; Dong, F.; Sun, M.; Xiao, Y.; Ge, T.; et al. Microbial and Metabolic Features Associated with Outcome of Infliximab Therapy in Pediatric Crohn’s Disease. Gut Microbes 2021, 13, 1865708. [Google Scholar] [CrossRef]
  44. Oehmcke-Hecht, S.; Mandl, V.; Naatz, L.T.; Dühring, L.; Köhler, J.; Kreikemeyer, B.; Maletzki, C. Streptococcus Gallolyticus Abrogates Anti-Carcinogenic Properties of Tannic Acid on Low-Passage Colorectal Carcinomas. Sci. Rep. 2020, 10, 4714. [Google Scholar] [CrossRef]
  45. Santoni, M.; Piva, F.; Conti, A.; Santoni, A.; Cimadamore, A.; Scarpelli, M.; Battelli, N.; Montironi, R. Re: Gut Microbiome Influences Efficacy of PD-1-Based Immunotherapy Against Epithelial Tumors. Eur. Urol. 2018, 74, 521–522. [Google Scholar] [CrossRef]
  46. Mansour, B.; Monyók, Á.; Makra, N.; Gajdács, M.; Vadnay, I.; Ligeti, B.; Juhász, J.; Szabó, D.; Ostorházi, E. Bladder Cancer-Related Microbiota: Examining Differences in Urine and Tissue Samples. Sci. Rep. 2020, 10, 11042. [Google Scholar] [CrossRef]
Figure 1. Data preprocessing and transformation.
Applsci 12 04094 g001
Figure 2. Dividing the processed dataset into a subset based on the clinical metadata for post-operative follow-up parameters.
Applsci 12 04094 g002
Figure 3. Study methodology diagram for modeling and interpreting the key biomarkers that play a significant role in understanding the drug-resistant mechanism for CRC patients.
Applsci 12 04094 g003
Figure 4. Median abundances for the most significant genera in resistant and non-resistant groups.
Applsci 12 04094 g004
Figure 5. Bacterial abundance in CRC-prior treatment group.
Applsci 12 04094 g005
Figure 6. Bacterial abundance in the non-resistant group.
Applsci 12 04094 g006
Figure 7. Bacterial abundance in the resistant group.
Applsci 12 04094 g007
Figure 8. Genera abundance frequency patterns segregated by diagnostic and control groups.
Applsci 12 04094 g008
Table 1. Screening modeling phase algorithms overall accuracies.
ML AlgorithmsOverall Accuracy *
Naïve Bayes0.429
Logistic Regression0.425
K-Nearest Neighbors0.325
Support Vector Machine0.497
Decision Tree0.764
* The overall algorithm accuracy was selected as the main algorithm selection indicator.
Table 2. General ML modeling performance metrics for the resistant and non-resistant CRC post-operative individuals’ group.
EnvironmentML
Algorithms
Normalization/ScalingAccuracySensitivitySpecificity
Python Scikit-learnRFC (P1)Standard Scaler0.91.0000.833
Python Scikit-learnRFC (P1)Z-Score Normalizer0.91.00.75
KNIMETEL (P1)Z-Score Normalizer0.8330.7781.0
Python Scikit-learnRFC (P2)Standard Scaler0.9171.0000.833
KNIMETEL (P2)Z-Score Normalizer0.91.0000.8
RFC—Scikit-learn random forest classifier, TEL—Tree ensemble learner, P1—Phase 1 ML modeling, P2—Phase 2 ML modeling.
Table 3. Detailed ML modeling performance metrics for the resistant and non-resistant CRC post-operative individuals’ group.
PrecisionRecallF1-Score
Environments and ML
Algorithms
ResistantNon-
Resistant
ResistantNon-
Resistant
ResistantNon-
Resistant
Python Scikit-learn—RFC (P1)0.831.001.000.800.910.89
Python Scikit-learn—RFC (P1)0.751.001.000.860.860.92
KNIME—TEL (P1)10.7780.6001.0000.7500.875
Python Scikit-learn—RFC (P2)0.831.001.000.860.910.92
KNIME—TEL (P2)0.8001.0001.0000.8330.8890.909
RFC—Scikit-learn random forest classifier, TEL—Tree ensemble learner, P1—Phase 1 ML Modeling, P2—Phase 2 ML modeling.
Table 4. Aggregated bacteria significance contributions to the resistant class.
Aggregated Bacteria‘Resistance’ Contribution
[‘Escherichia-Shigella’, ‘Subdoligranulum’, ‘Gemella’, ‘Negativibacillus’]0.00770053
[‘Blautia’, ‘TM7x’] [‘0.0061875
[‘Escherichia-Shigella’, ‘Coprococcus’, ‘Lachnospiraceae UCG-010′, ‘Family XIII UCG-001′]0.00555556
[‘Terrisporobacter’, ‘Weissella’, ‘Slackia’]0.00538462
[‘Enterococcus’, ‘Haemophilus’, ‘UCG-005′]0.005
[‘Intestinibacter’, ‘Enterococcus’, ‘Lachnospiraceae NC2004 group’, ‘Lachnoclostridium’]0.0047138
[‘Coprococcus’, ‘Megasphaera’, ‘Parasutterella’, ‘UCG-002′]0.0045
[‘Streptococcus’, ‘Phascolarctobacterium’, ‘Paraprevotella’, ‘Dubosiella’]0.00403846
[‘Subdoligranulum’, ‘Blautia’, ‘Paraprevotella’, ‘Oxalobacter’]0.00317853
[‘Subdoligranulum’, ‘Butyrivibrio’]0.00307692
[‘Lachnospiraceae UCG-010′, ‘Barnesiella’]0.00235897
[‘Blautia’, ‘Oxalobacter’] [‘0.00231884
[‘Clostridium sensu stricto 1′, ‘Flavonifractor’, ‘Agathobacter’, ‘Butyricimonas’]0.00227193
[‘Flavonifractor’, ‘Agathobacter’, ‘Butyricimonas’, ‘Anaerofustis’]0.00222222
[‘[Eubacterium] ruminantium group’, ‘[Eubacterium] eligens group’, ‘Moryella’]0.00198413
[‘Haemophilus’, ‘Alistipes’]0.00188889
[‘Clostridium sensu stricto 1′, ‘Blautia’, ‘TM7x’, ‘Butyricimonas’]0.00188235
[‘Ruminococcus’, ‘Enterococcus’, ‘Turicibacter’, ‘Leuconostoc’]0.00181818
[‘[Eubacterium] ruminantium group’, ‘Denitrobacterium’]0.00179724
[‘Turicibacter’, ‘Leuconostoc’]0.00171429
[‘Slackia’, ‘Eubacterium’]0.00162037
[‘Escherichia-Shigella’, ‘Subdoligranulum’]0.0013468
[‘Enterococcus’, ‘Weissella’, ‘Lachnoclostridium’]0.00133333
[‘Enterococcus’, ‘Coprococcus’, ‘Anaerococcus’, ‘Senegalimassilia’]0.00128205
[‘Ruminococcus’, ‘Weissella’, ‘[Eubacterium] ruminantium group’, ‘Denitrobacterium’]0.00121212
Table 5. Aggregated bacteria significance contributions to the not resistant class.
Aggregated Bacteria‘Not Resistance’ Contribution
[‘Weissella’, ‘Eisenbergiella’, ‘[Eubacterium] ruminantium group’, ‘Denitrobacterium’]0.006
[‘Escherichia-Shigella’, ‘Lachnospiraceae UCG-010′, ‘Family XIII UCG-001′]0.00568889
[‘Enterococcus’, ‘Lachnospiraceae NC2004 group’, ‘Lachnoclostridium’]0.00533109
[‘Ruminococcus’, ‘[Eubacterium] eligens group’, ‘Coprobacillus’]0.00474074
[‘Streptococcus’, ‘Phascolarctobacterium’, ‘Paraprevotella’]0.0043956
[‘Phascolarctobacterium’, ‘Eisenbergiella’, ‘Olsenella’]0.00394872
[‘Escherichia-Shigella’, ‘Negativibacillus’]0.00385632
[‘Weissella’, ‘[Eubacterium] ruminantium group’, ‘Denitrobacterium’]0.00378355
[‘Phascolarctobacterium’, ‘Eisenbergiella’, ‘Parasutterella’, ‘Olsenella’]0.00334066
[‘Bacteroides’, ‘Megasphaera’, ‘Coprobacillus’]0.00314286
[‘Flavonifractor’, ‘Agathobacter’]0.003
[‘[Eubacterium] ruminantium group’, ‘Slackia’, ‘Eubacterium’]0.00283414
[‘Clostridium sensu stricto 1′, ‘Weissella’, ‘Slackia’]0.00266667
[‘Subdoligranulum’, ‘Ruminococcus’, ‘NK4A214 group’, ‘Family XIII UCG-001′]0.00242424
[‘Clostridium sensu stricto 1′, ‘Blautia’, ‘TM7x’]0.00238235
[‘Streptococcus’, ‘UCG-002′, ‘Negativibacillus’]0.00227273
[‘Ruminococcus’, ‘Turicibacter’, ‘Leuconostoc’]0.00226263
[‘Phascolarctobacterium’, ‘Lachnospiraceae NC2004 group’, ‘Barnesiella’]0.00222222
[‘Haemophilus’, ‘Terrisporobacter’, ‘Weissella’, ‘Slackia’]0.00215385
[‘Alistipes’, ‘Lachnospiraceae NC2004 group’]0.002
[‘[Eubacterium] ruminantium group’, ‘Parasutterella’, ‘Slackia’, ‘Eubacterium’]0.0019222
[‘[Eubacterium] eligens group’, ‘Moryella’]0.00189076
[‘Eisenbergiella’, ‘Olsenella’]0.00181319
[‘Escherichia-Shigella’, ‘Subdoligranulum’, ‘Megasphaera’, ‘Veillonella’]0.00166667
[‘Weissella’, ‘Slackia’]0.00153515
Table 6. Bacterial abundance tendency in the non-resistant samples.
GenusOur Study Resultsp-Values
BarnesiellaIncrease in non-resistant0.0069
AlistipesIncrease in non-resistant0.0017
IntestinibacterIncrease in non-resistant0.038
FlavonifractorDecrease in non-resistant0.04
AkkermansiaIncrease in non-resistant0.041
[Ruminococcus] torques groupDecrease in non-resistant0.043
StreptococcusDecrease in non-resistant0.021
ButyricimonasIncrease in non-resistant0.022
EggerthellaDecrease in non-resistant0.024
Escherichia-ShigellaDecrease in non-resistant0.026
AnaerovoracaceaeIncrease in non-resistant0.027
NegativibacillusIncrease in non-resistant0.031
LeuconostocDecrease in non-resistant0.034
RuminococcusDecrease in non-resistant0.0017
OscillospiraceaeIncrease in non-resistant0.0034
BacteroidesDecrease in non-resistant0.0087
Clostridium sensu stricto 1Increase in non-resistant0.015
Table 7. Summary of the resistance mechanism bacteria functions.
GenusInformation about Biological Role and Abundance of the GenusReferences
BarnesiellaImproves systemic amount of Th1 and Tc1 and the intertumoral level of IFN-γ-producing γδ TILs (IFN-δ + γδT cells), leading to an increase in cyclophosphamide efficacy.[12,35,36,37]
AlistipesRestore the ability of tumor-associated myeloid cells to produce TNF in mice treated with anti-IL-10R/CpG-ODN therapy.[32]
IntestinibacterDecreased profiles of Intestinibacter shows it to be resistant to oxidative stress and able to degrade fucose, indicative of an indirect involvement in mucus degradation. It also appears to possess the genetic potential for sulfite reduction, including part of an assimilatory sulfate reduction pathway.[30,33]
FlavonifractorIt is correlated with the degradation of beneficial anticarcinogenic flavonoids, which was also found to be significantly correlated with the enzymes and modules involved in flavonoid degradation within Indian CRC samples.[32,38]
AkkermansiaHave a beneficial role in epithelial tumor patients who showed a good response to anti-PD-1 therapy, and oral supplementation with a muciniphila post-FMT with nonresponsive feces restored the efficacy of PD-1 blockade through increasing the recruitment of CCR9+ CXCR3+ CD4+ T cells into tumor beds.[37]
[Ruminococcus] torques groupIncrease in CD4+ cells and serum CD25. Correlated with better tumor reduction but increased events of ICI-associated colitis.[39]
Christensenellaceae R-7 groupNewly identified groups without relevant information.[40]
StreptococcusProtect tumor cells from the toxic effect; the tannic acids are degraded by Sgg and the cytotoxic effect could be abolished.[41]
ButyricimonasButyricimonas and Clostridium, especially those in cluster XIVa and IV, are acetic acid and butyric acid-producing bacteria, are anti-inflammatory, and promote healthy colonocytes.[31]
EggerthellaEggerthella lenta is capable of acquiring vancomycin resistance. It is also capable of oxidizing bile acids, which potentially prevents the production of cancer-promoting secondary bile acids such as chenodeoxycholic acid. Their enterotoxins cause genome instability.[31]
Escherichia-ShigellaBoth favoring or suppressing of cancer cases are possible.[42]
AnaerovoracaceaeBacteria decrease interleukin-1β if LB (lactobacillus species supplemented as probiotics) interleukin-1B increase drug resistance.[6,18]
NegativibacillusThis genera in Crohn’s disease patients before treatment is associated with disease refractory to infliximab. They are published as resistant to vancomycin, cefalexin, amoxicillin and clavulanic acid, penicillin G, daptomycin, metronidazole, trimethoprim sulfamethoxazole, oxacillin, imipenem, ceftriaxone, rifampicin, doxycycline, erythromycin, tobramycin, fosfomycin, and amoxicillin.[43]
LeuconostocPromotes apoptosis in colon cancer cell line by upregulation of MAPK1, Bax, and caspase 3, and downregulation of AKT, NF-kB, and Bcl-XL expressions.[10,39]
RuminococcusCorrelated with better tumor reduction but increased events of ICI-associated colitis. Promoters of antitumor response by TLR4, TNF production, although prescription of antibiotics may alter.[19,44]
OscillospiraceaeMicrobiota composition, antibiotics before ipilimumab treatment does not influence baseline dominant microbiota.[11,44]
[Eubacterium] eligens groupAssociation with complete remission after CAR T cell therapy, intestinal microbiota may influence the outcome of chimeric antigen receptor T cell (CAR T) therapy. Patients with complete response to CD19 CAR T-therapy exhibited enrichment of Oscillospiraceae. Oscillospiraceae is with higher abundance in healthy individuals than the cancer patients.[45]
Lachnospiraceae NC2004 groupEnterotoxigenic bacteria that have a critical impact for the CRC development and proliferation considering their production of biofilm for colonization that results in a series of inflammatory reactions that persuade a chronic intestinal inflammation and tissue damage. A protective role of Bacteroidetes was also researched using samples from metastatic melanoma patients treated with ipilimumab.[46]
LachnoclostridiumSignificantly associated with clinical benefit, 5-fluorouracil treatment increase after treatment.[11]
Lachnospiraceae FCS020 groupHigh abundance in inflammatory bowel disease patients.[46]
Publisher’s Note: MDPI stays neutral with regard to jurisdictional claims in published maps and institutional affiliations.

