
Buildup Factor Computation and Percentage Depth Dose Simulation of Tissue Mimicking Materials for an External Photon Beam (0.15–15 MeV)


Abstract
:1. Introduction
2. Materials and Methods
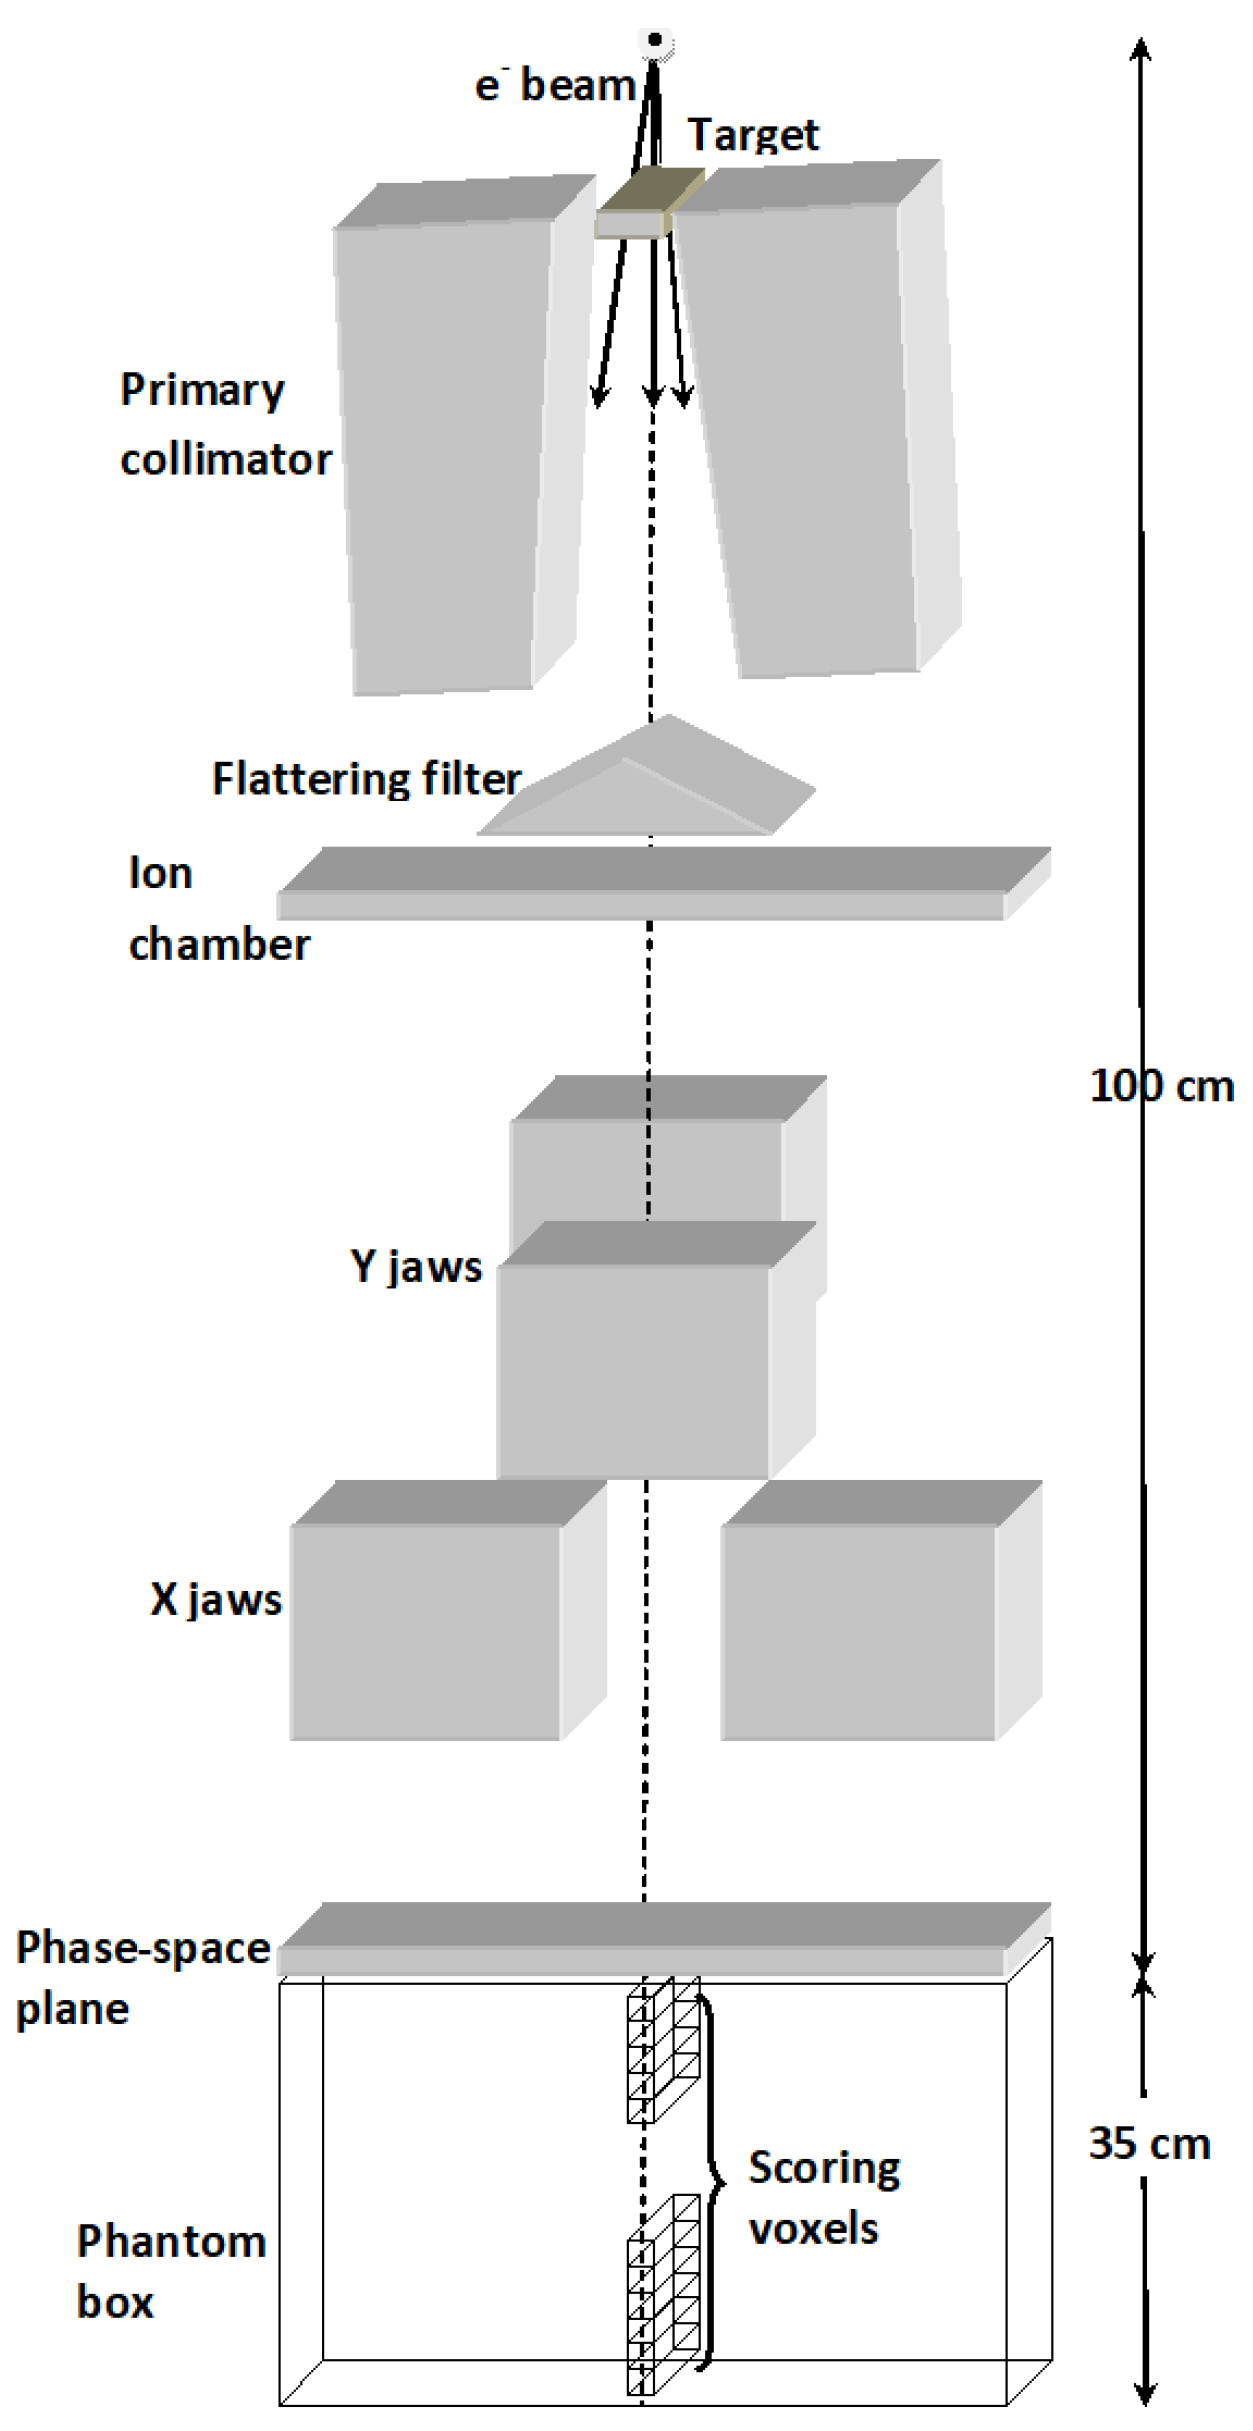
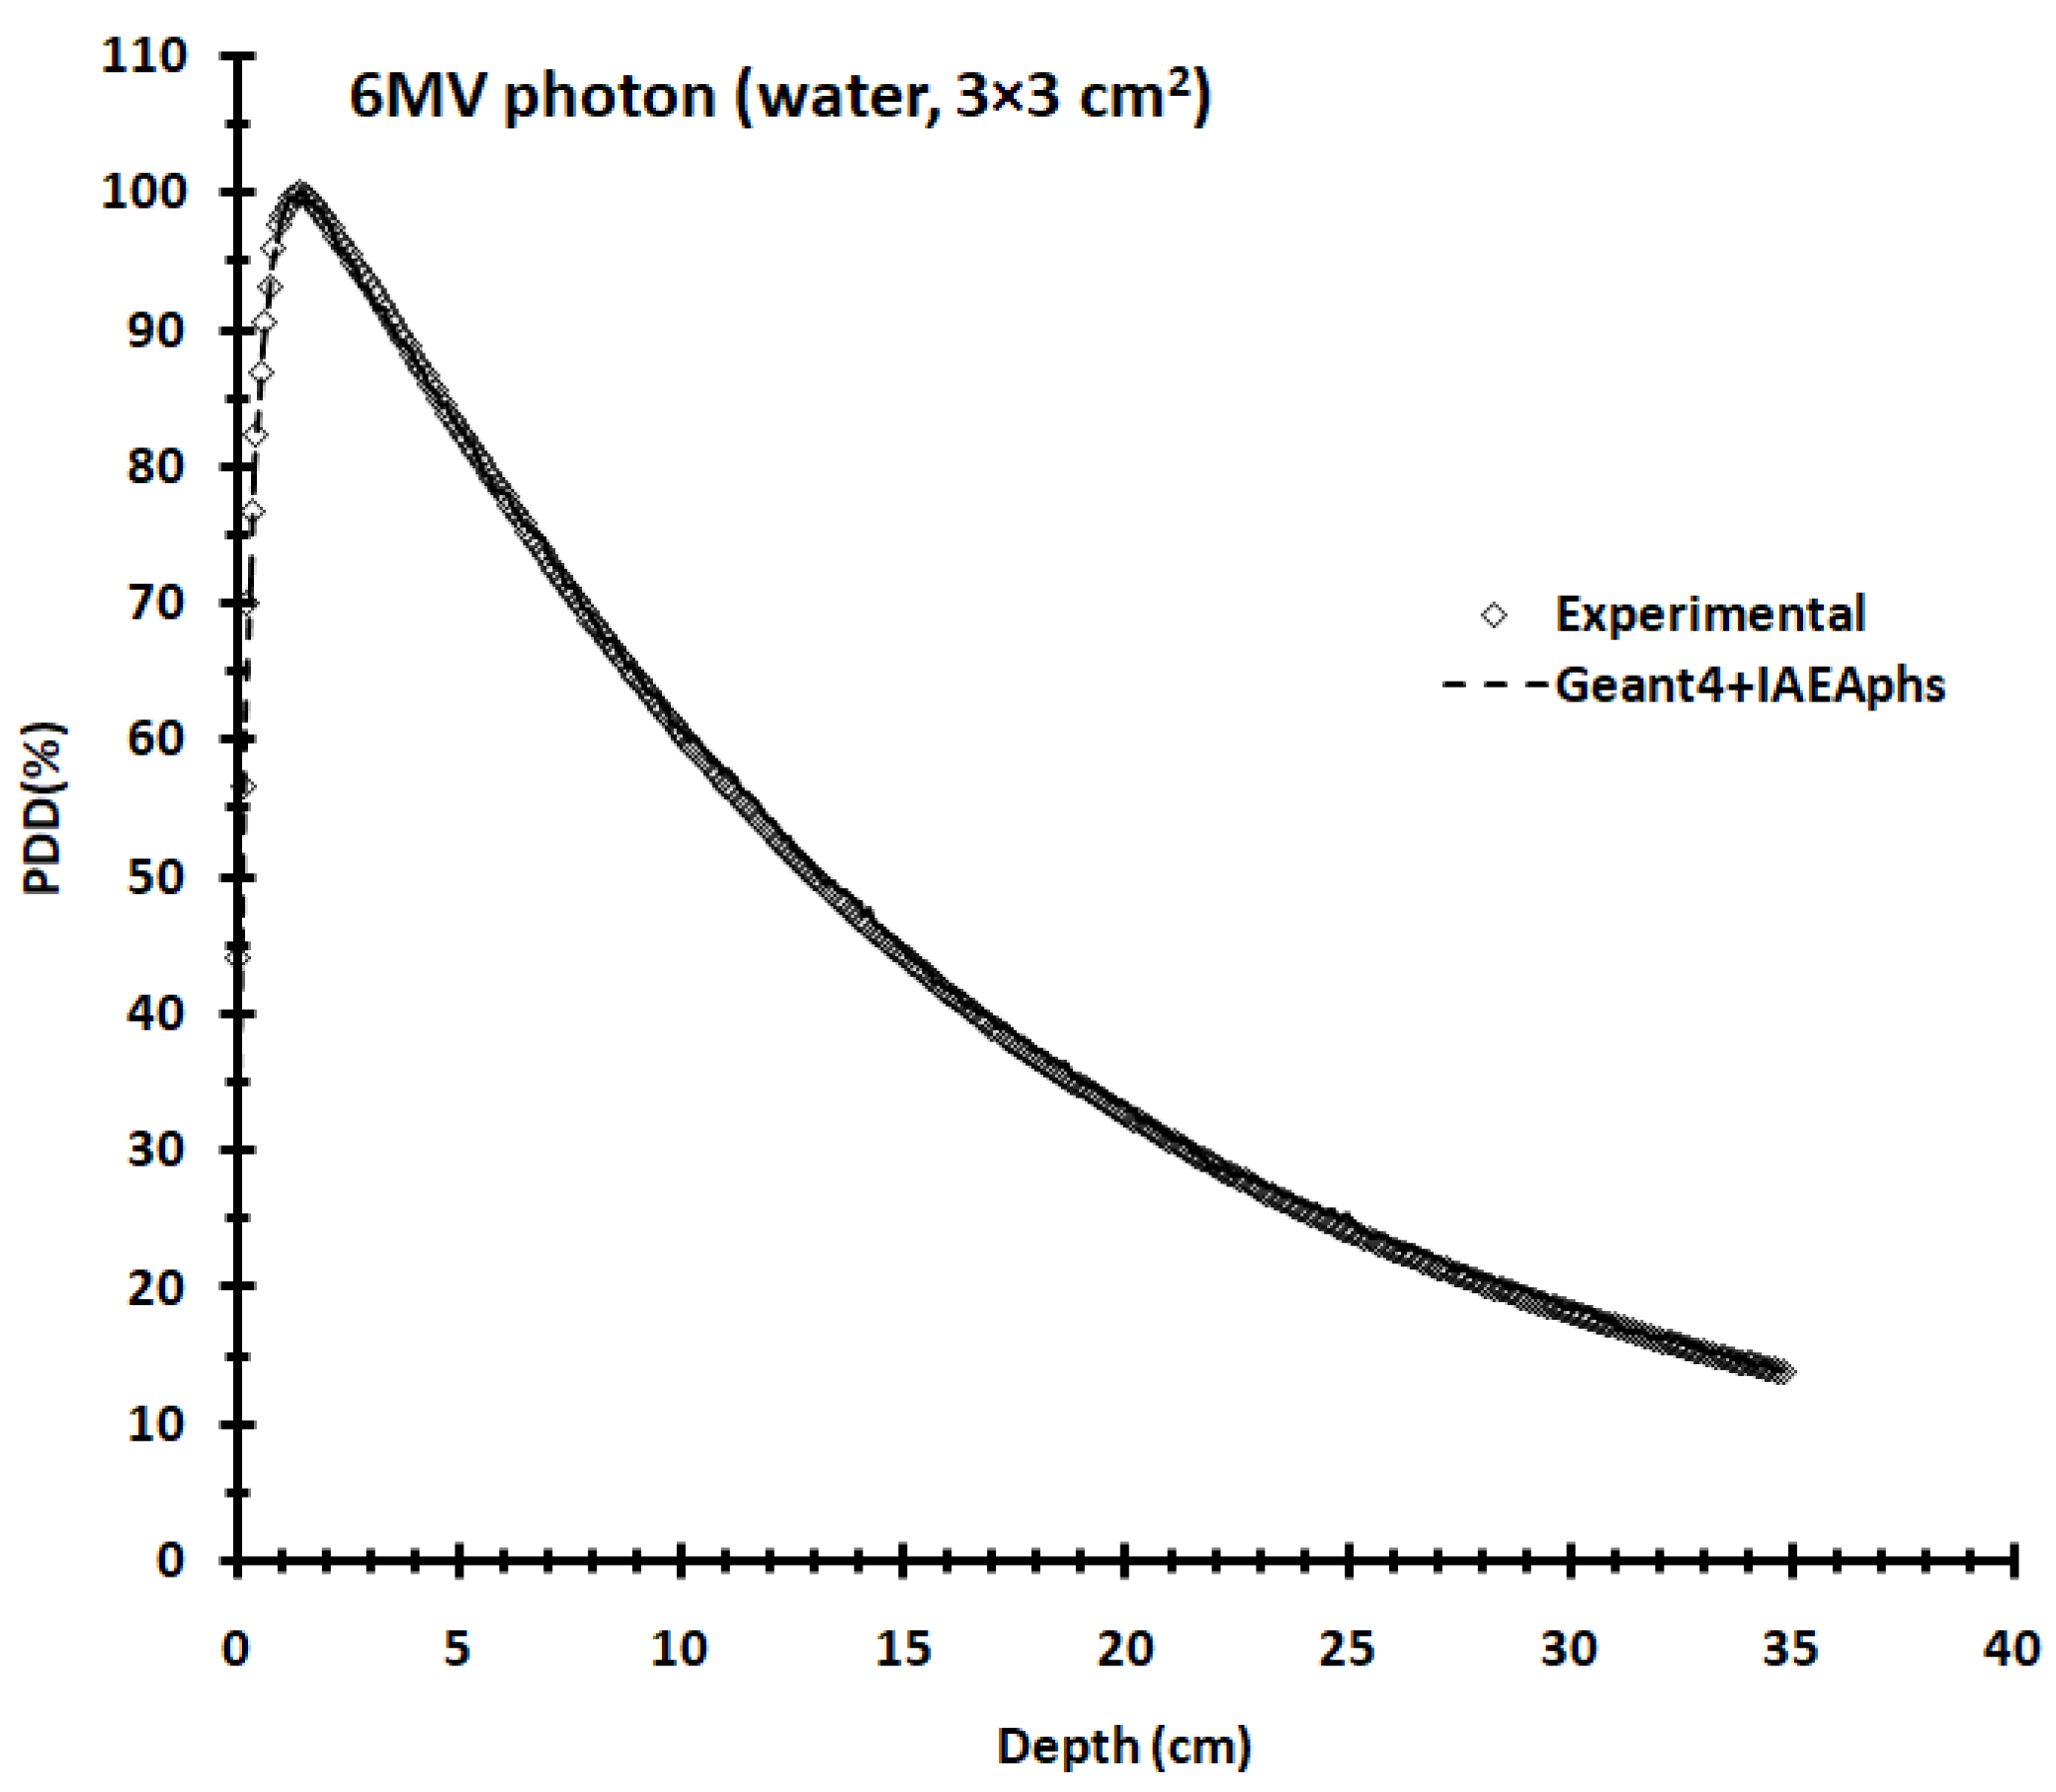
2.1. PDD Simulation
2.2. BUF Computation
2.3. Analysis Procedure
3. Results and Discussion
3.1. Adipose Tissue
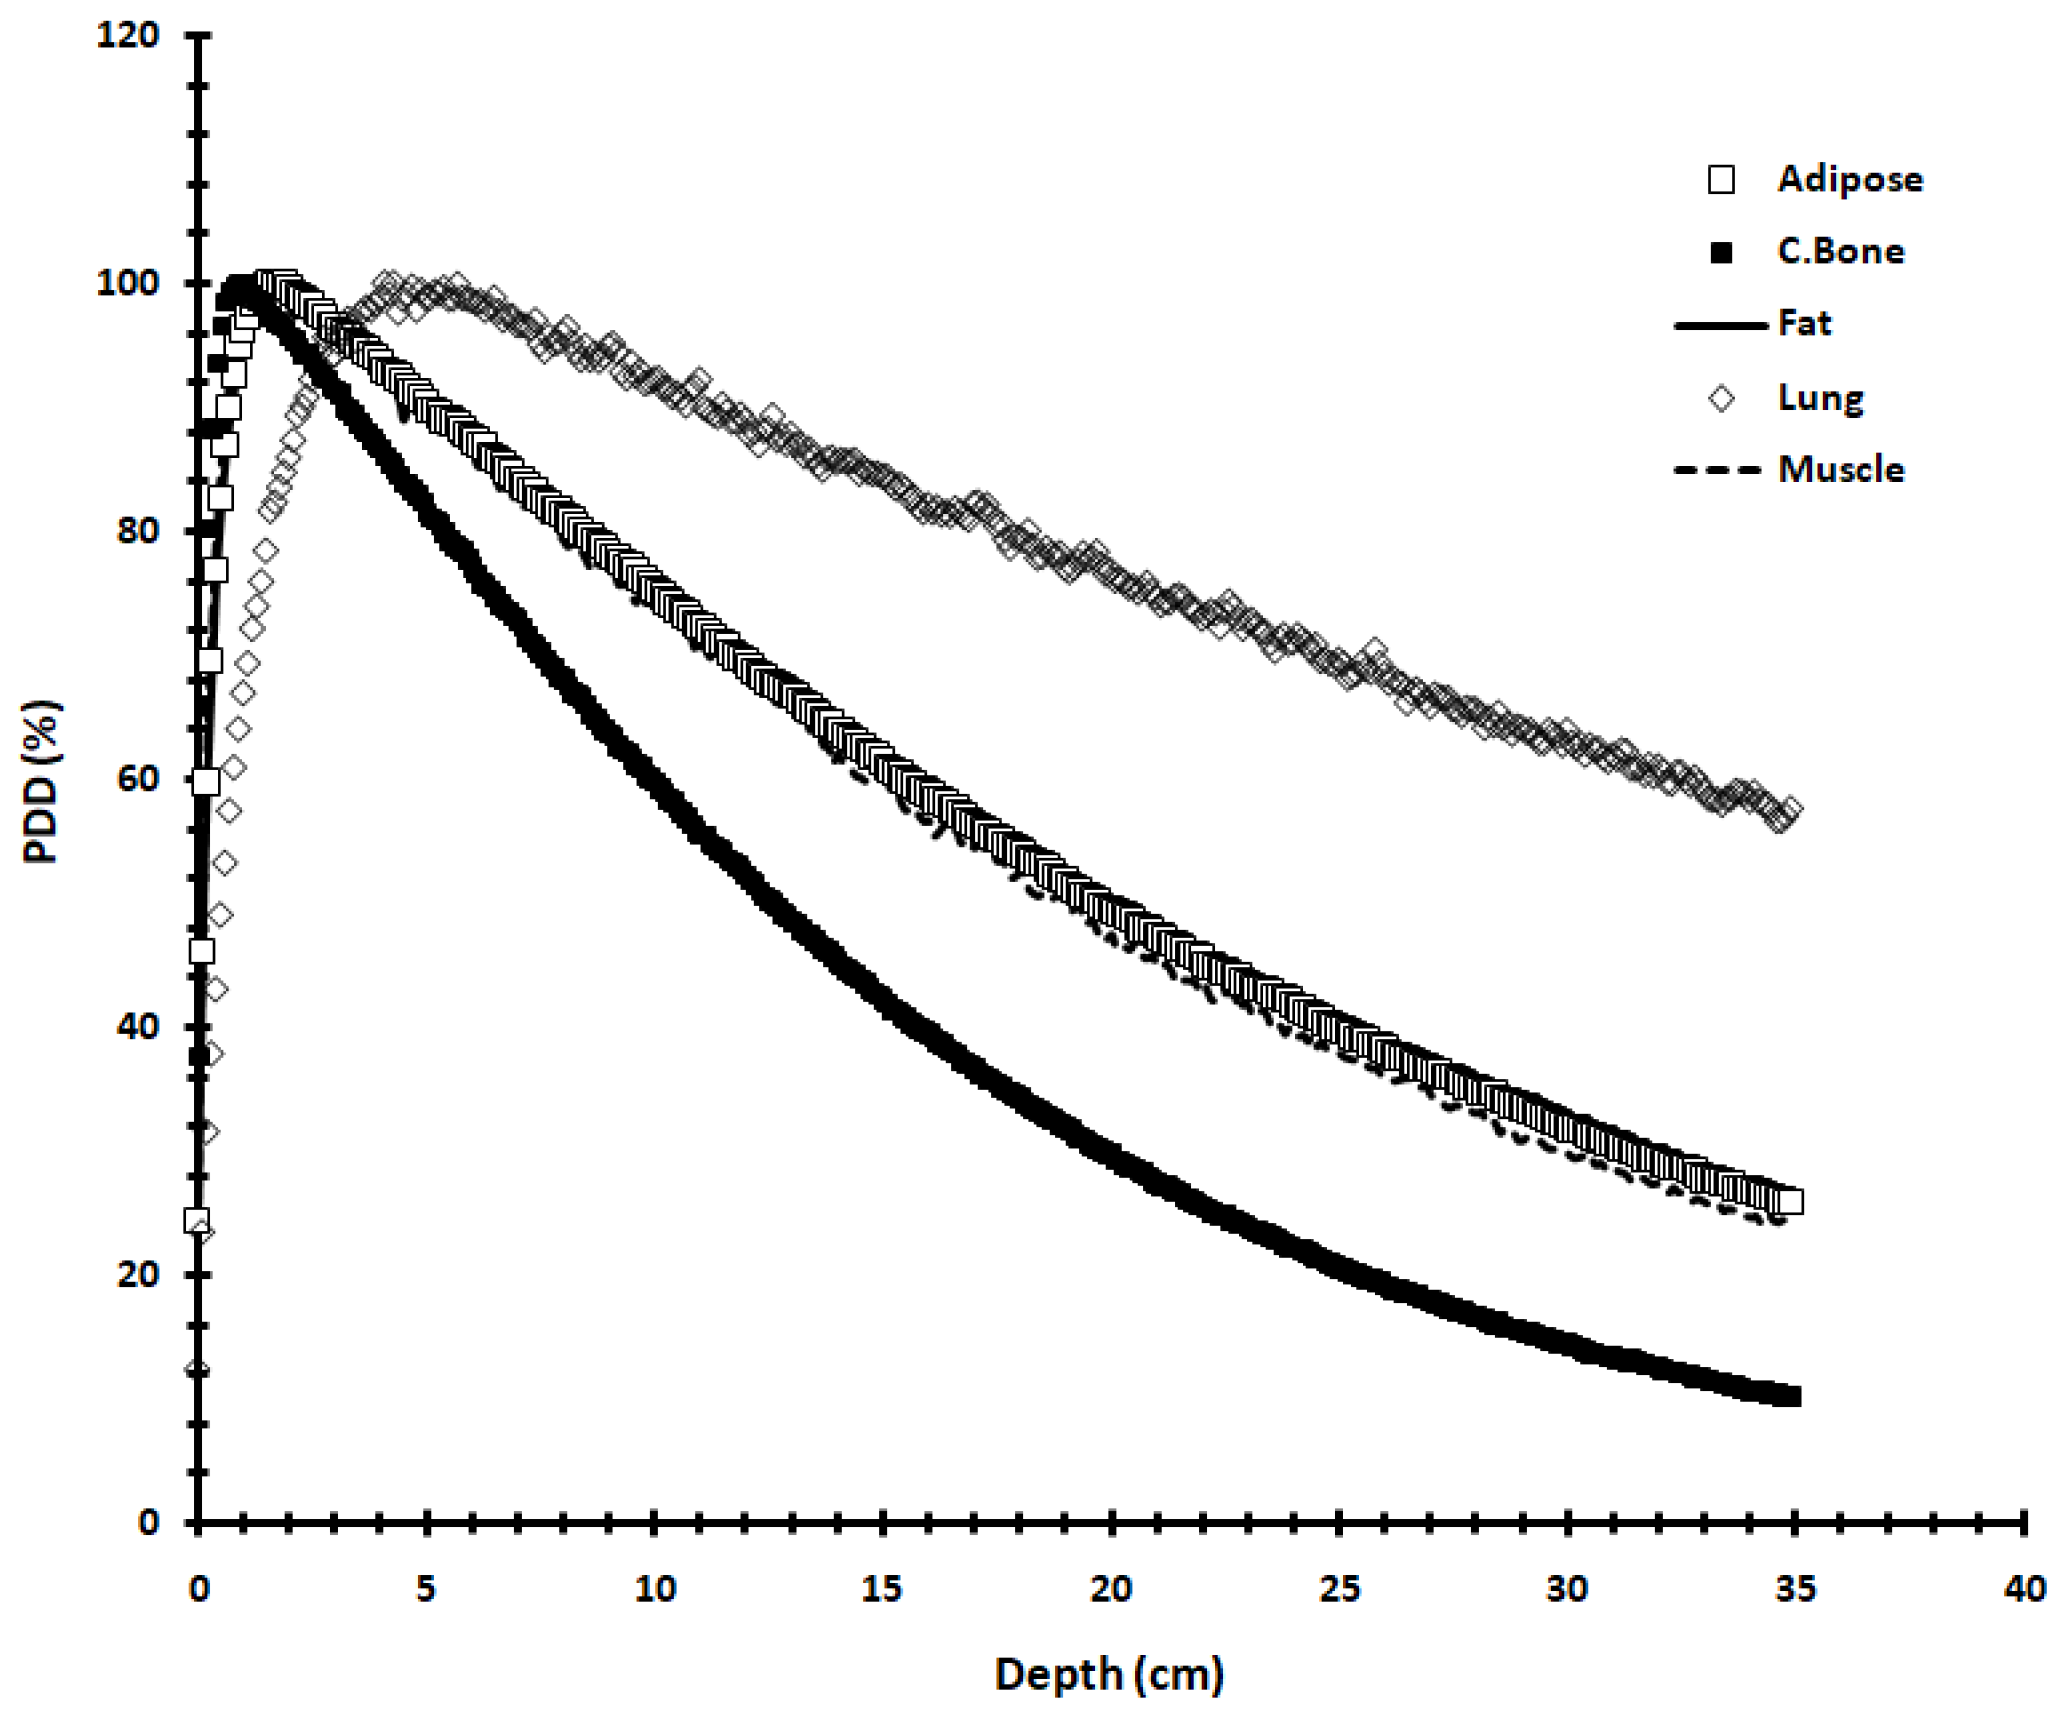
- PDD distribution: Figure 3 shows the Geant4-simulated percentage depth dose distributions for the five studied tissues for a cm field size for a 6 MV photon beam. The PDD distribution is a function of depth, field size and SSD and can be characterized by the surface dose (d0(%)), depth of maximum dose (dmax(cm)) 80% dose (d80%(cm)), and dose at depth of 10 cm (d10cm(%)) and 20 cm (d20cm(%)). We can see a fast increase followed by a slower decrease after reaching the maximum photon absorption. The first region is caused by the backscattering dominance, whereas the second region simply describes the exponential attenuation of photons through matter;
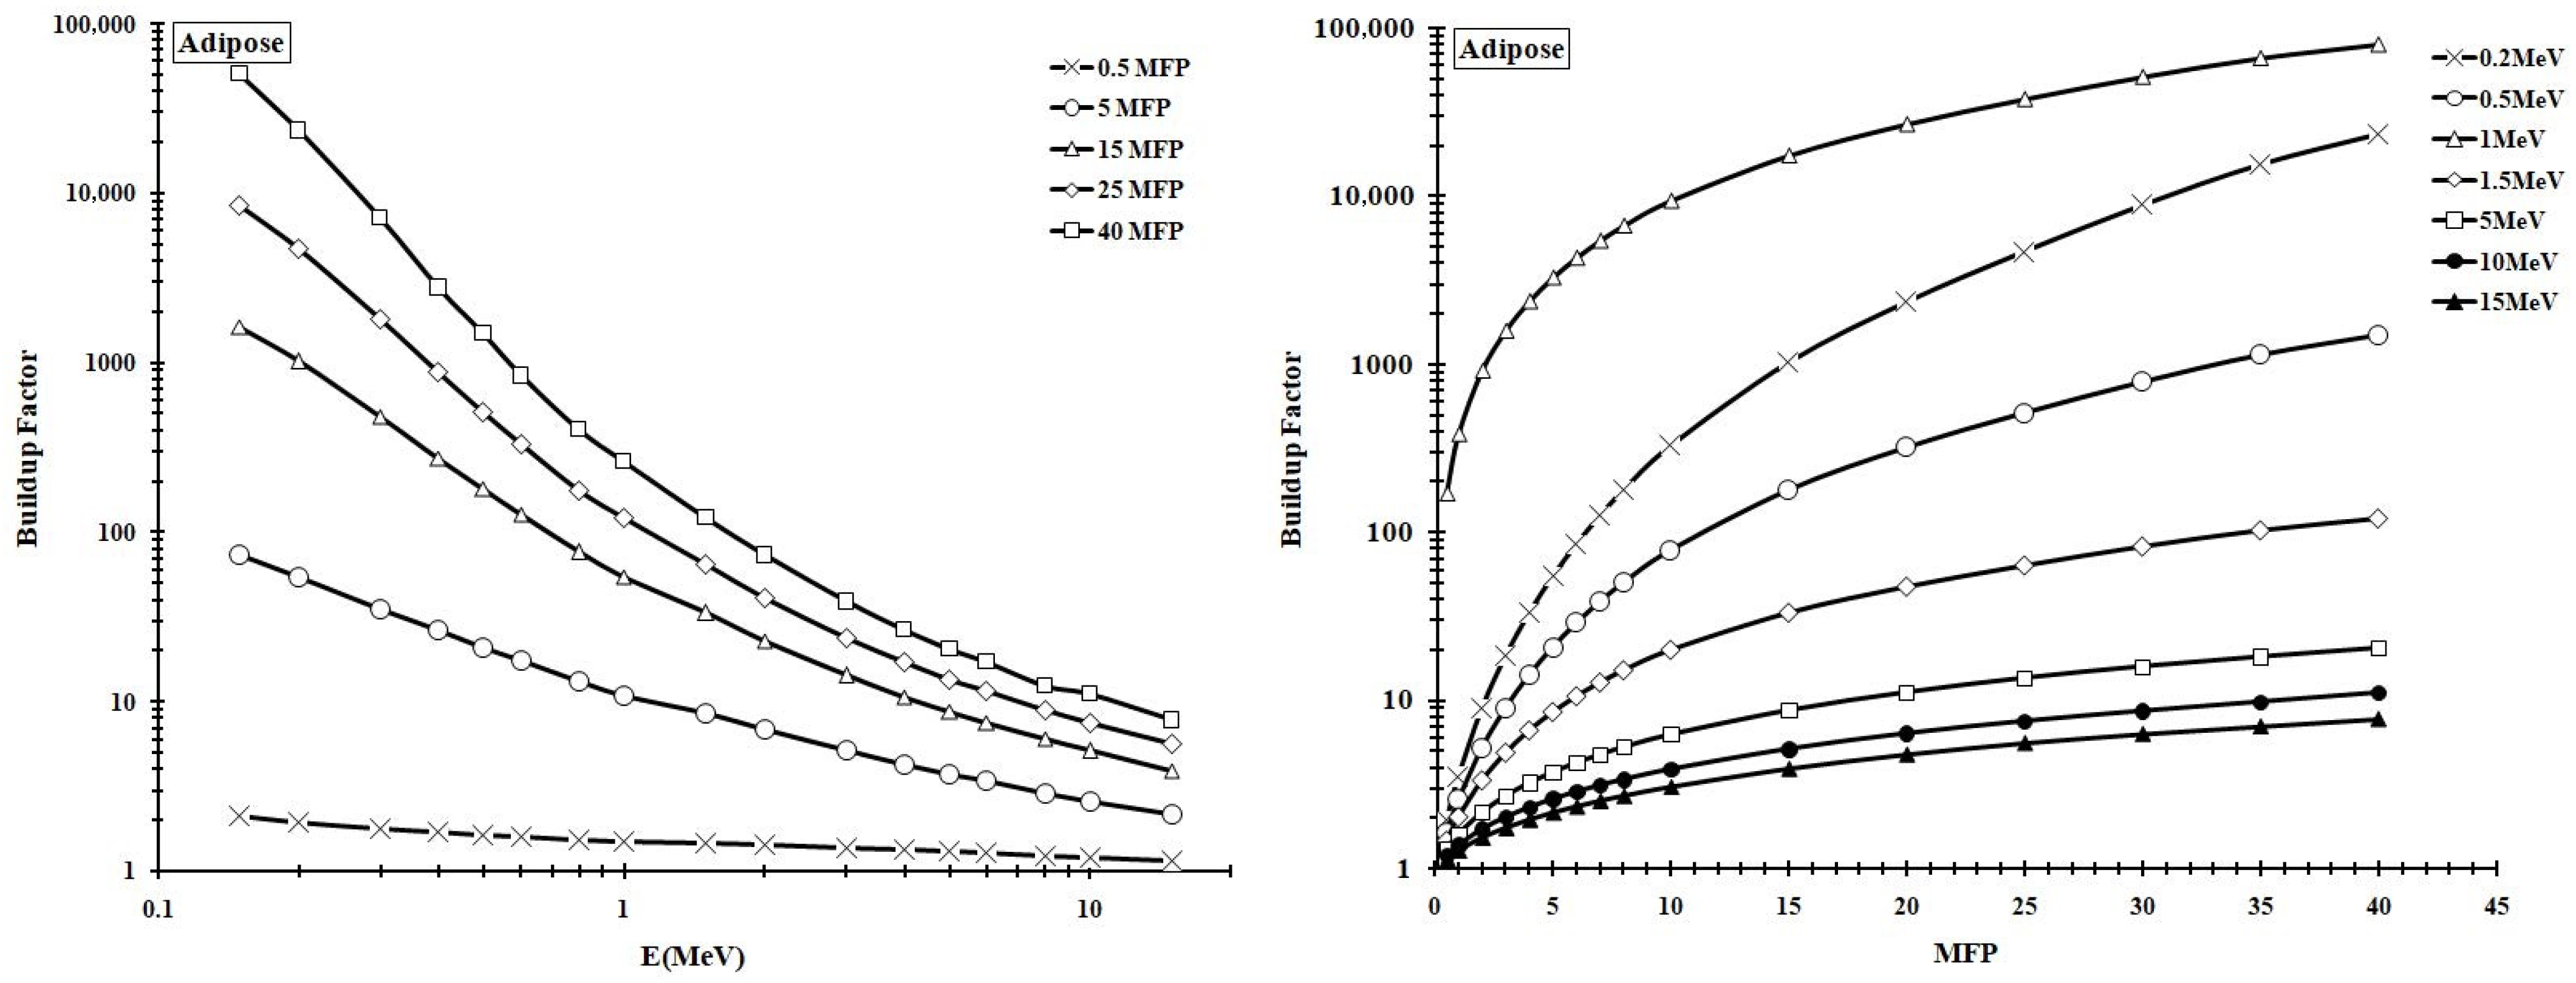
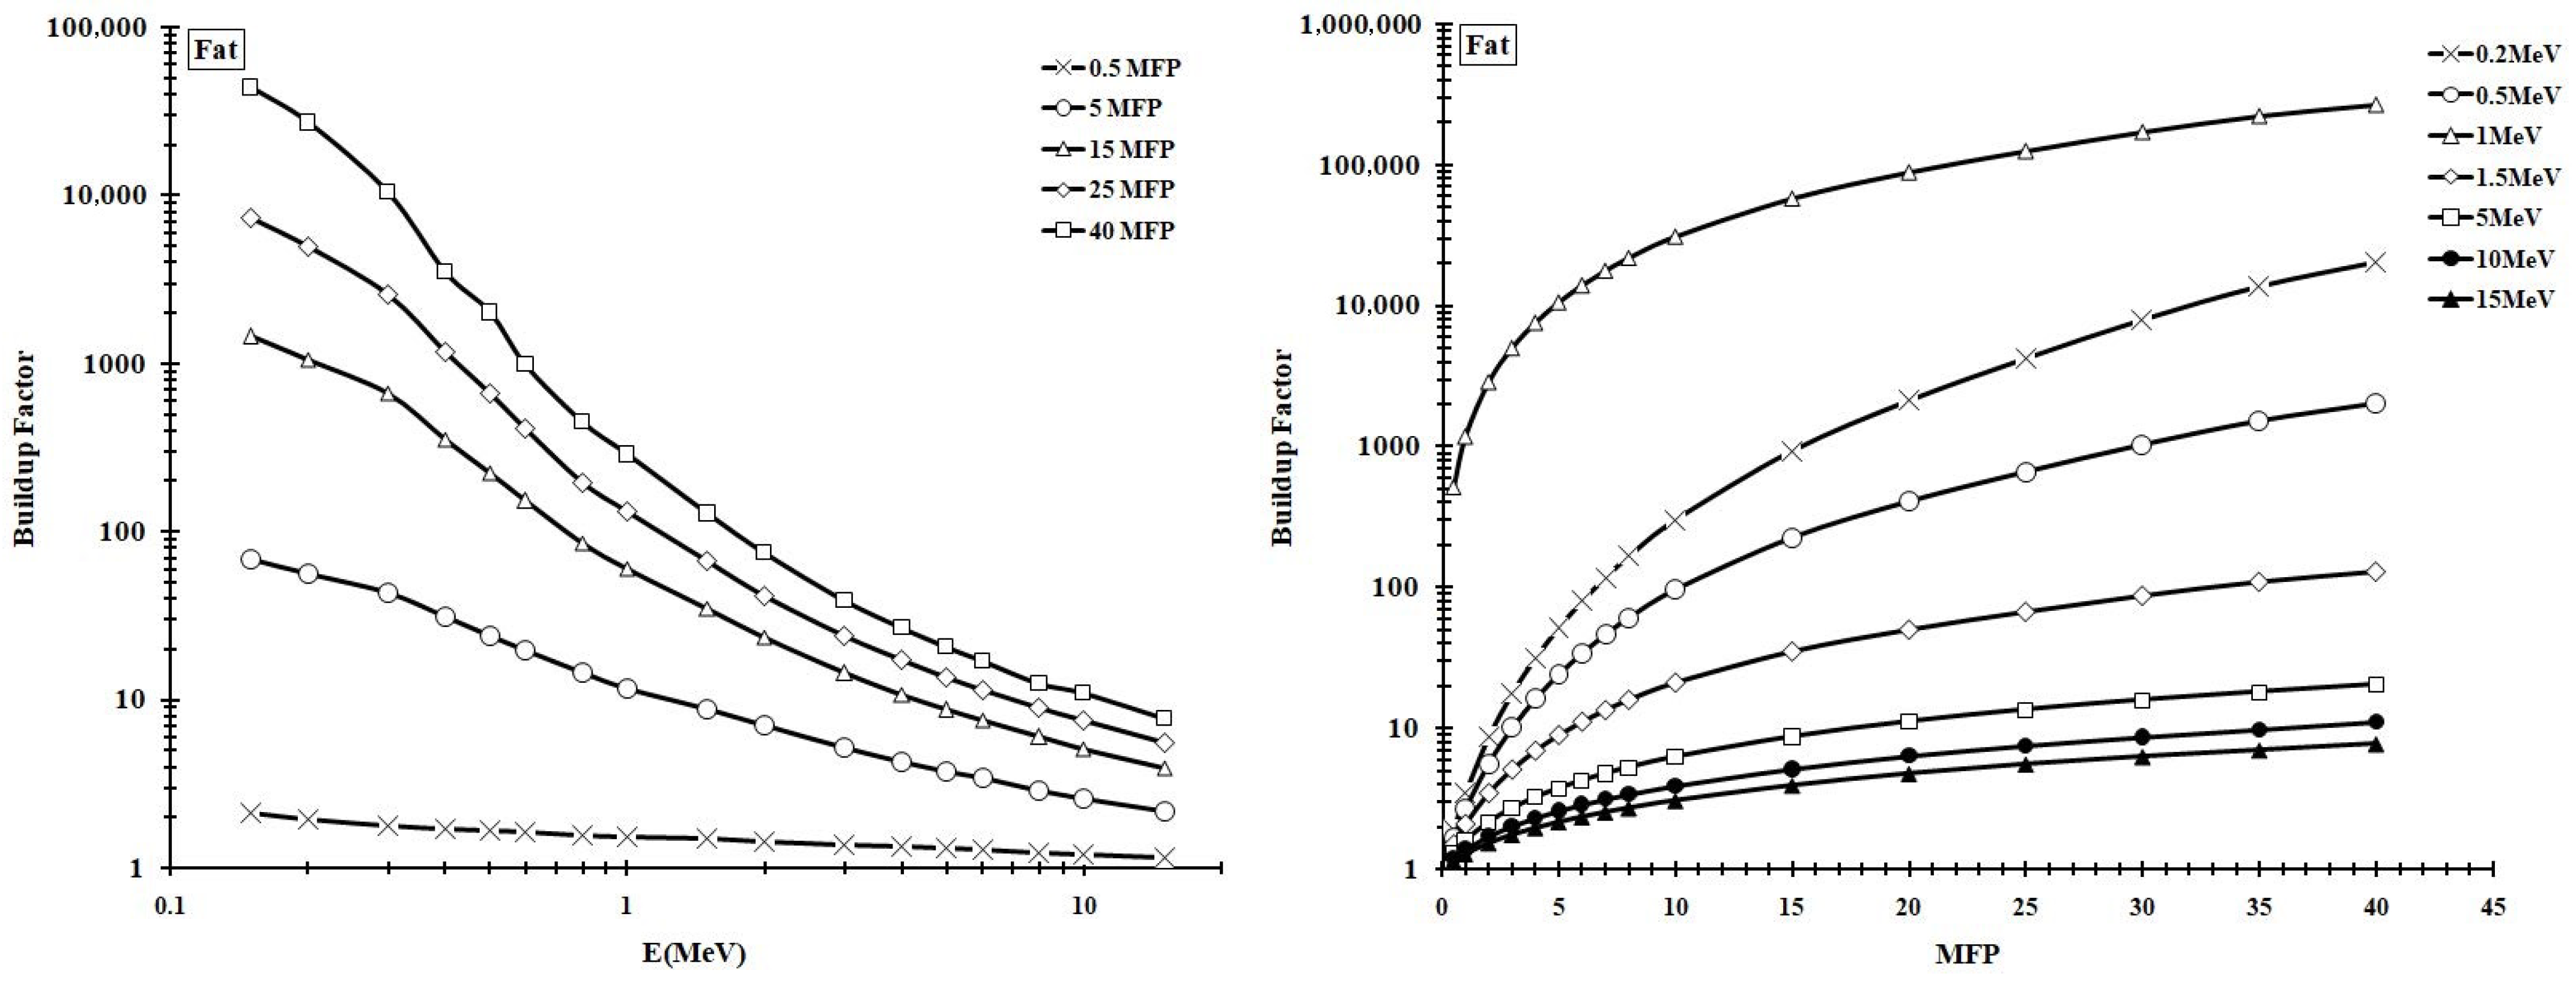
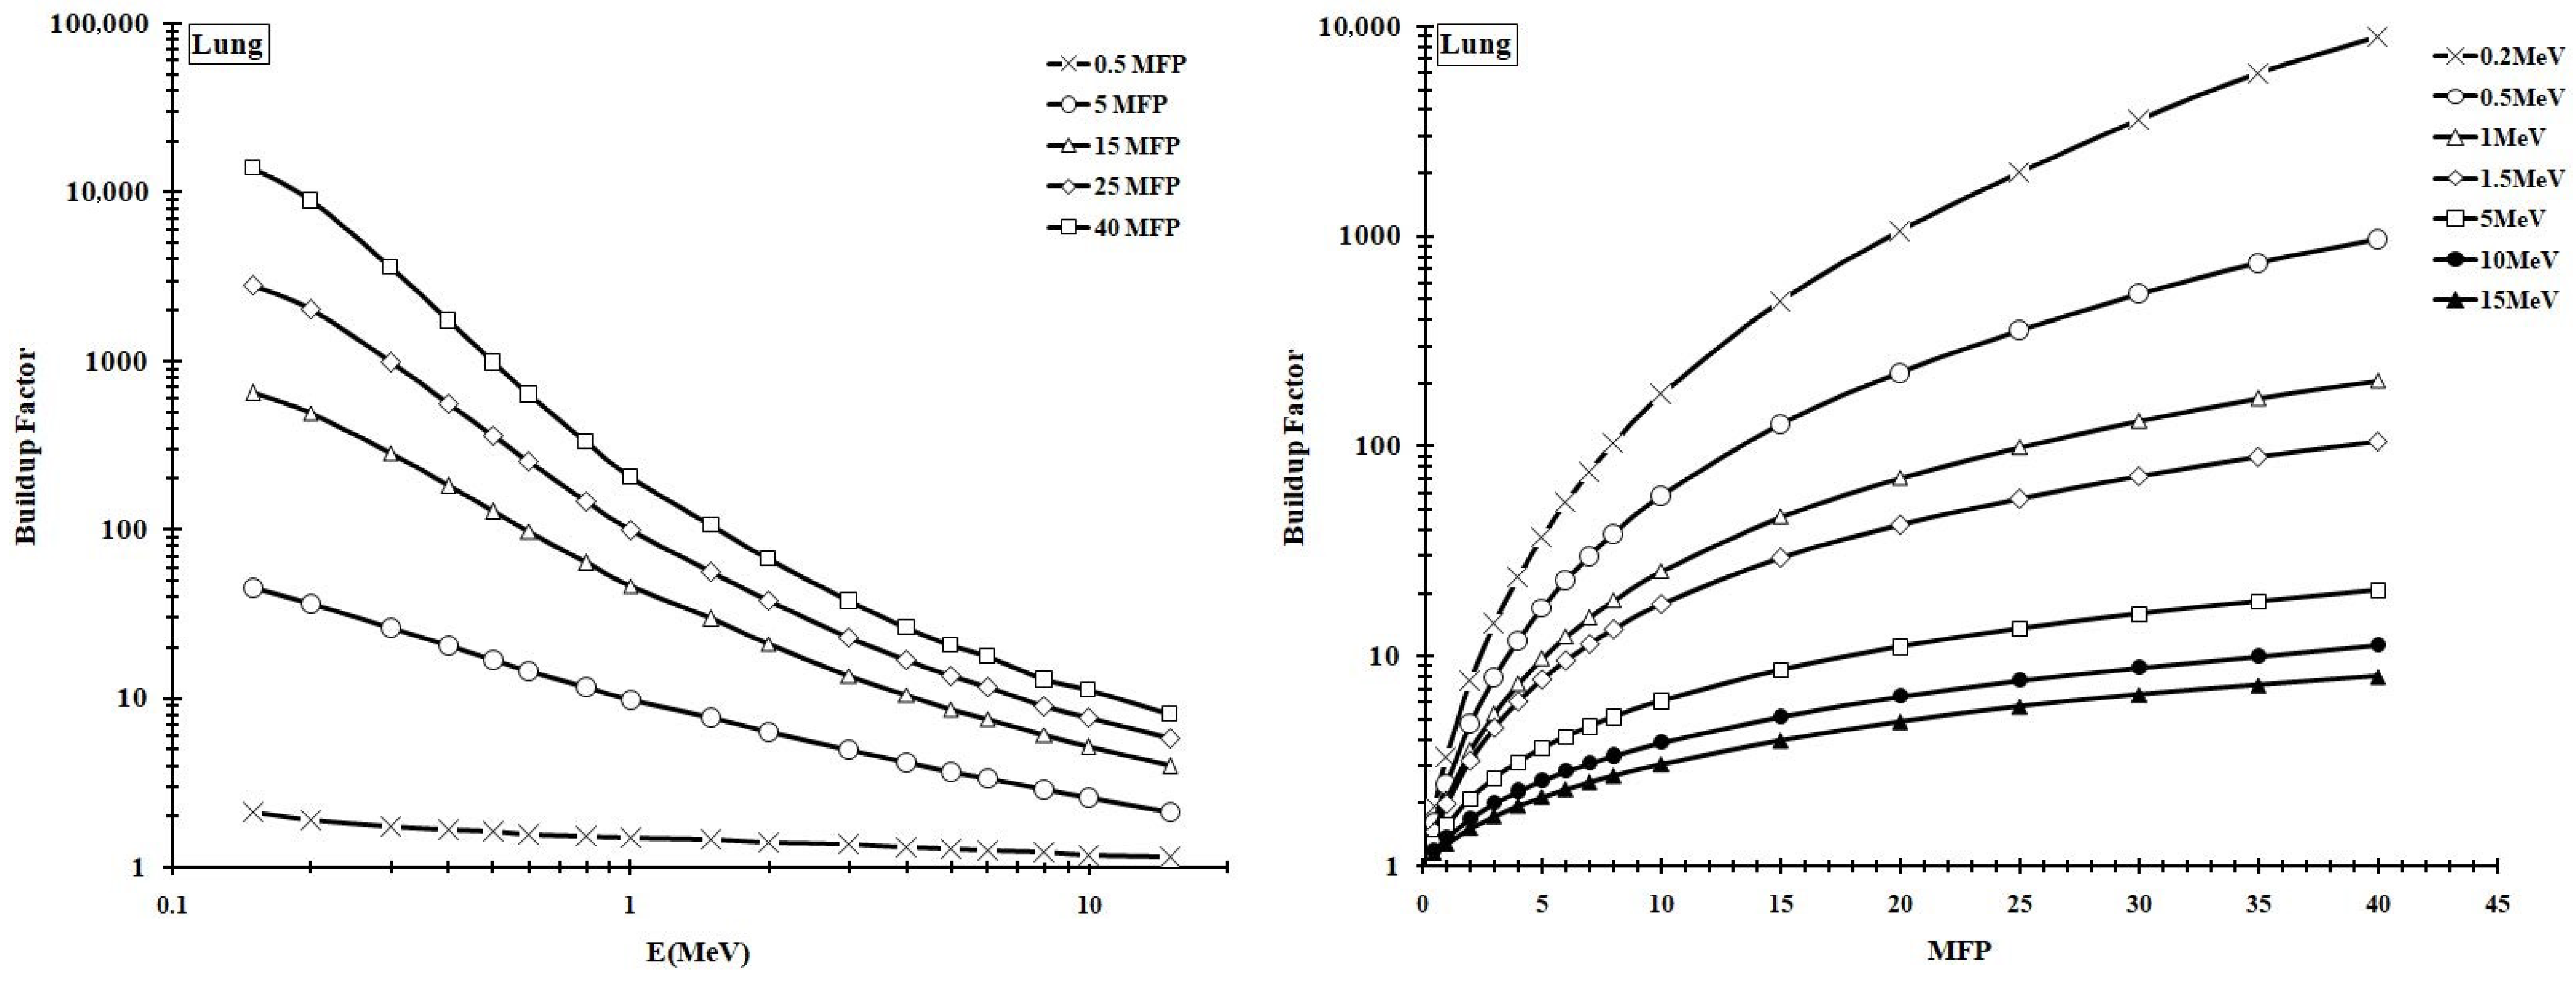
- Photon energy effect: The incident photon energy dependence of adipose tissue BUF for fixed penetrations of 0.5, 5, 15, 25 and 40 mfp is shown in Figure 4 (left side). For each penetration depth, BUF continuously decreased as a function of energy. In order to understand such phenomena, the studied energy interval can be divided into two subintervals: from 0.15 to 1 MeV corresponding to the Compton process domination and from 1 to 15 MeV, where the pair production effect is dominant. The large value of the BUF at the beginning of each curve can be explained by the multiple Coulomb scattering, which only attenuates and does not totally absorb the photon energy, existing for a longer time in the medium. Similarly to the photoelectric effect, resulting in lower BUF values due to the total energy absorption, the second energy interval is mainly dominated by the pair production process;
- Penetration depth effect: Figure 4 (right side) shows the dependence of BUF on penetration depth dependence for fixed photon energies of 0.2, 0.5, 1, 1.5, 5, 10 and 15 MeV for adipose tissue. Generally, increased BUF values for deeper penetrations were observed. However, the increasing rate of BUF (comparing 0.5 to 40 mfp range edges) is inversely proportional to photon energies. Additionally, we can see the contribution effect of secondary photons to BUF due to the multiple scattering effect, which reaches a maximum at 1 MeV;
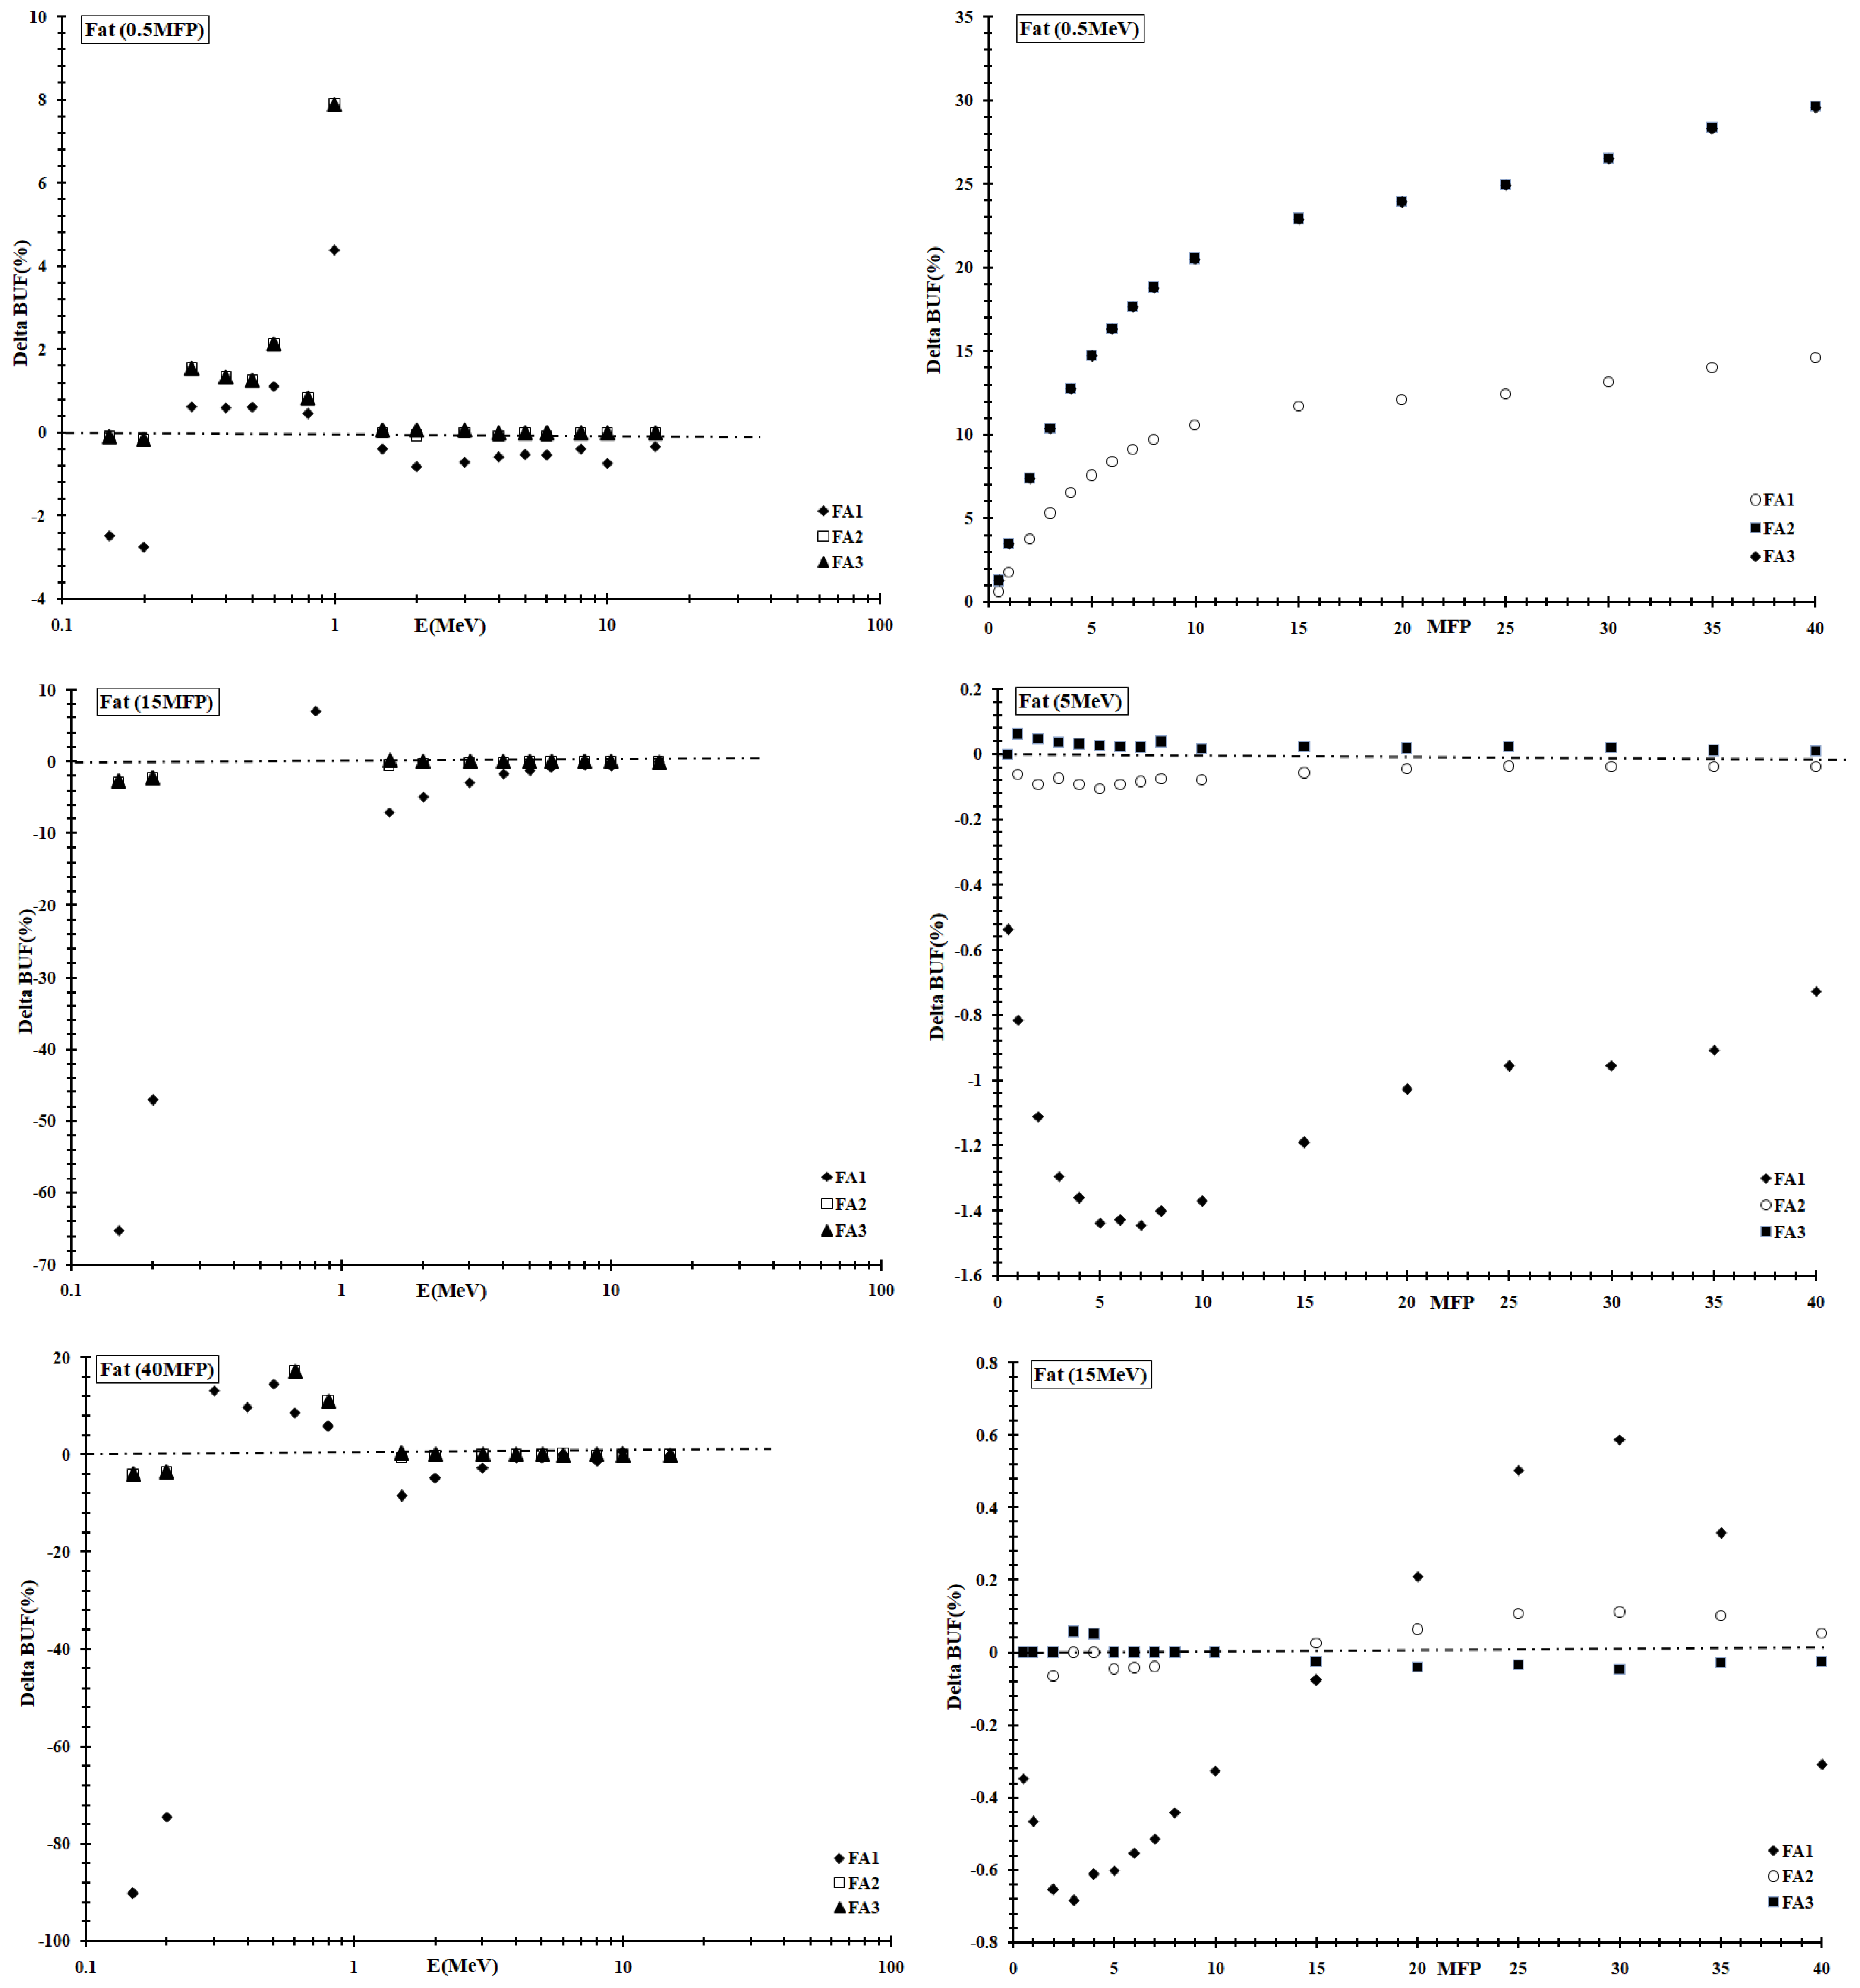
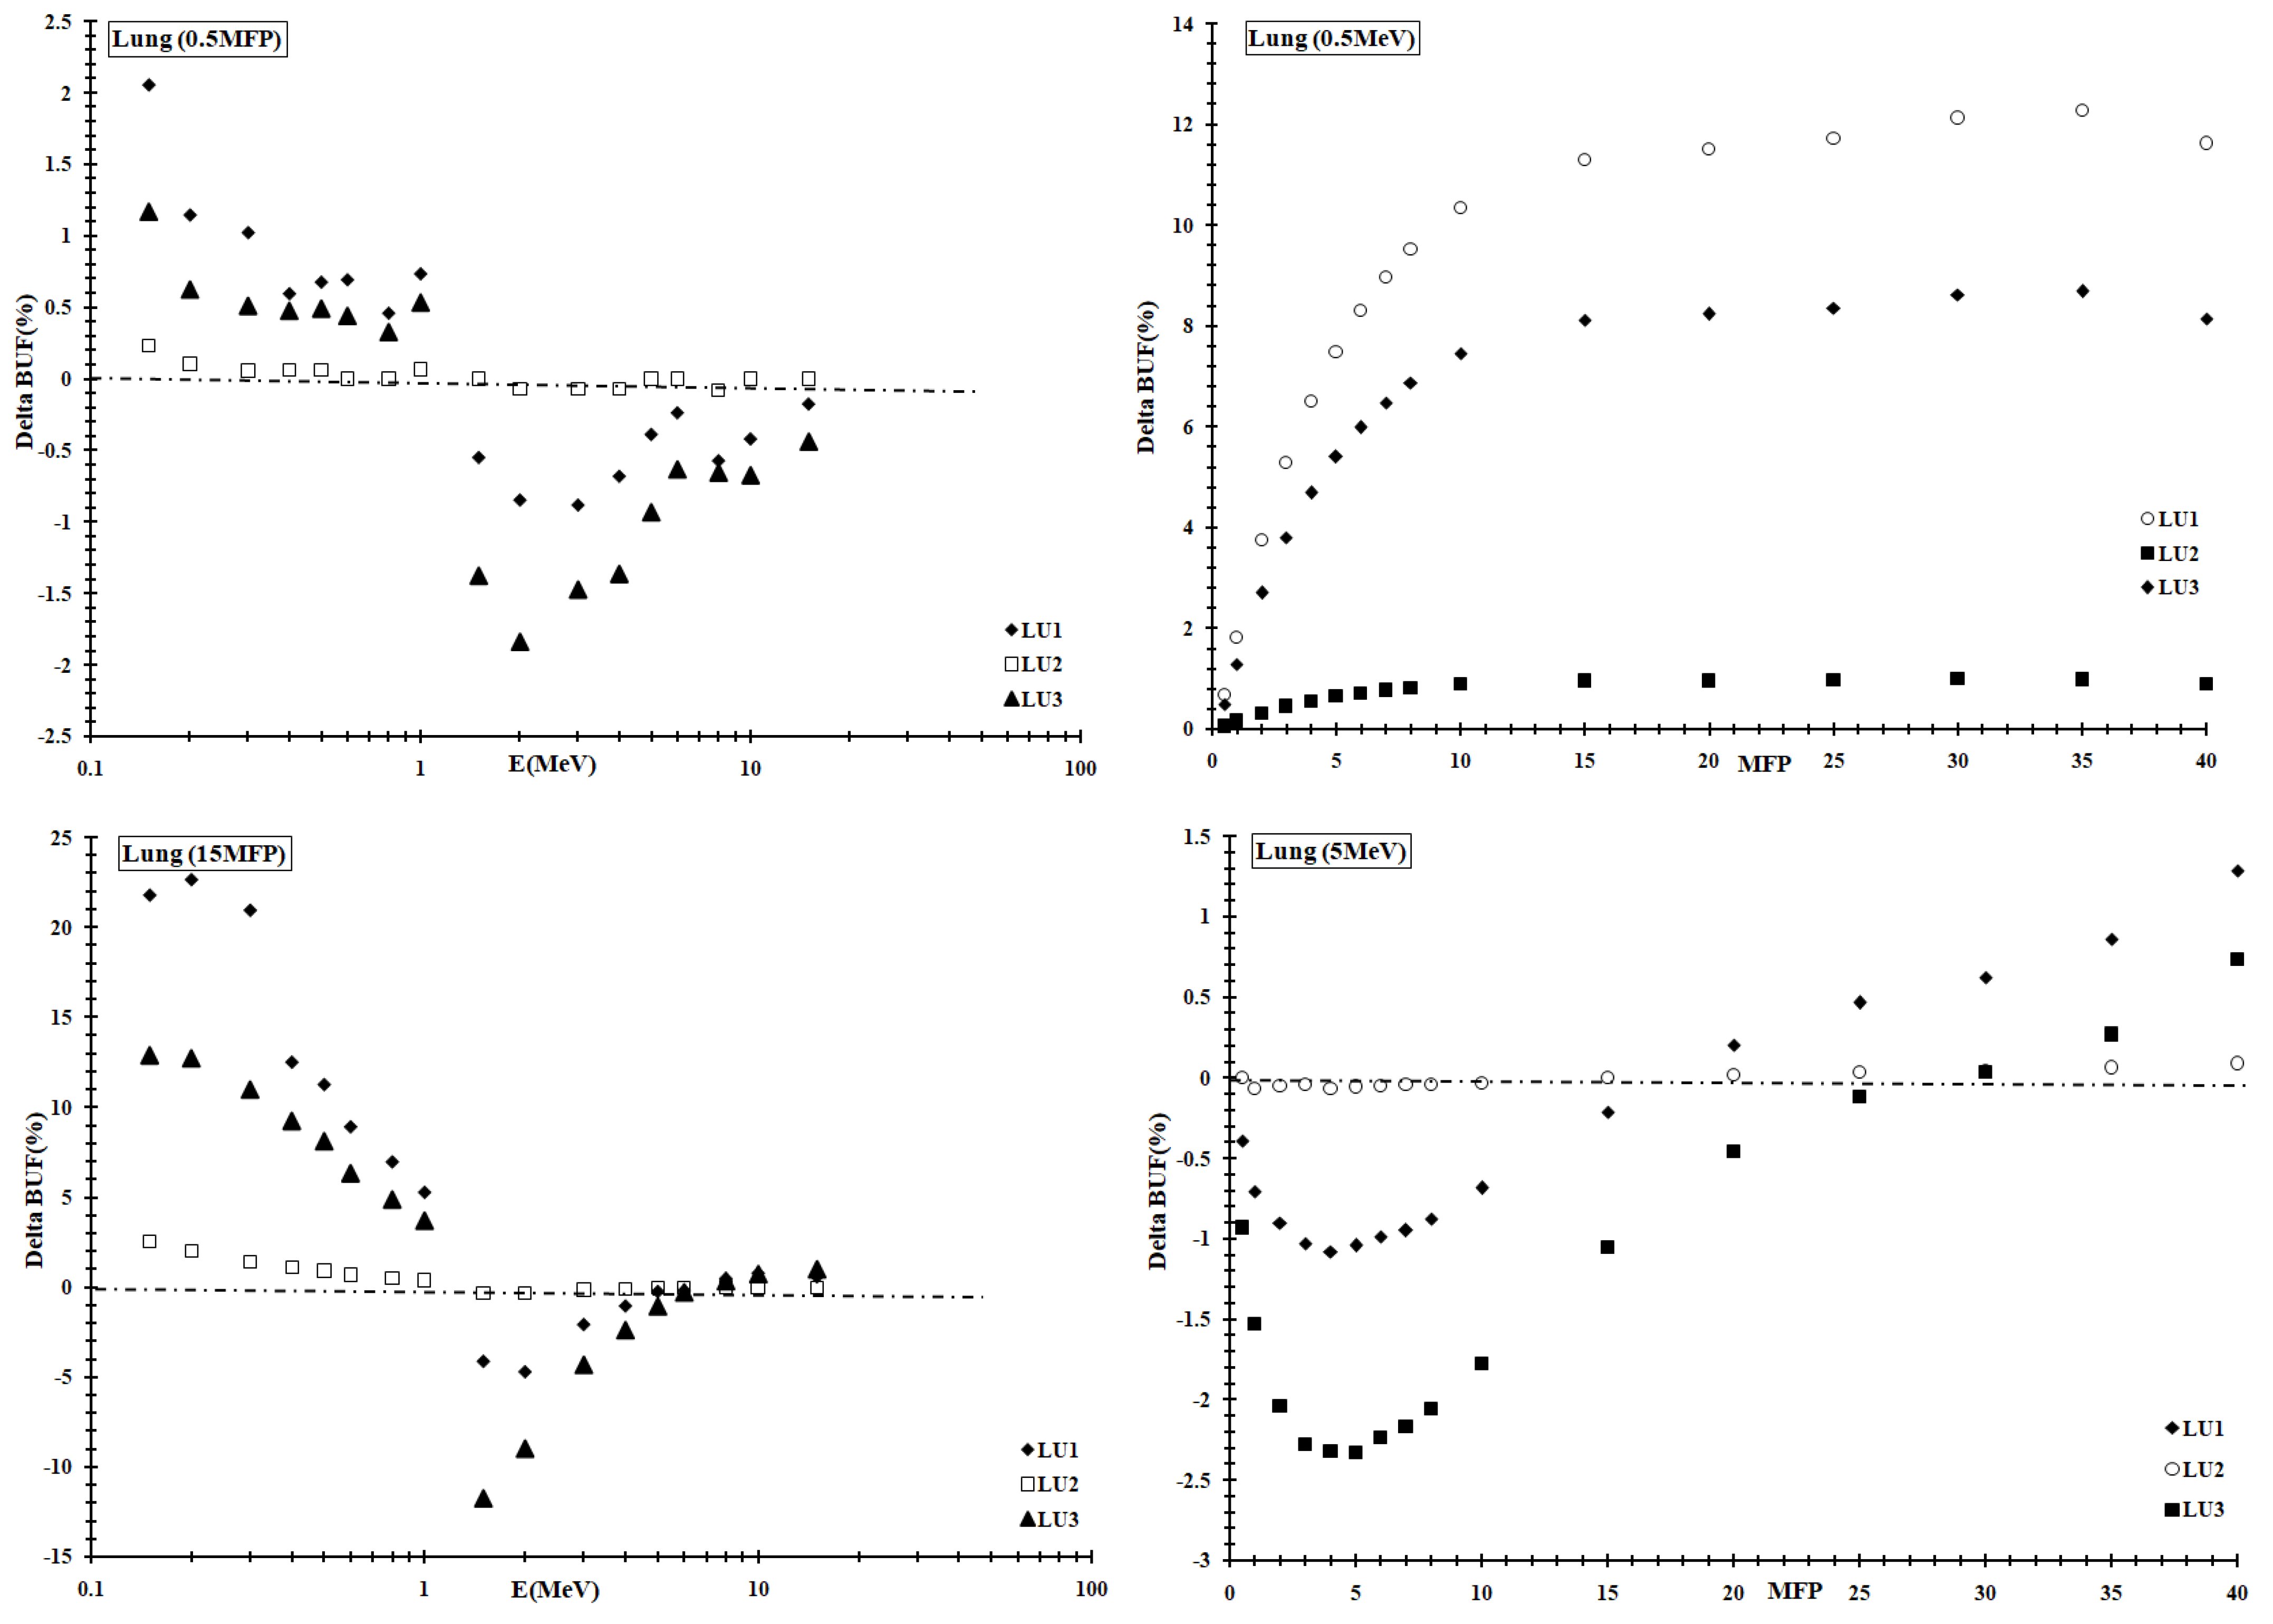
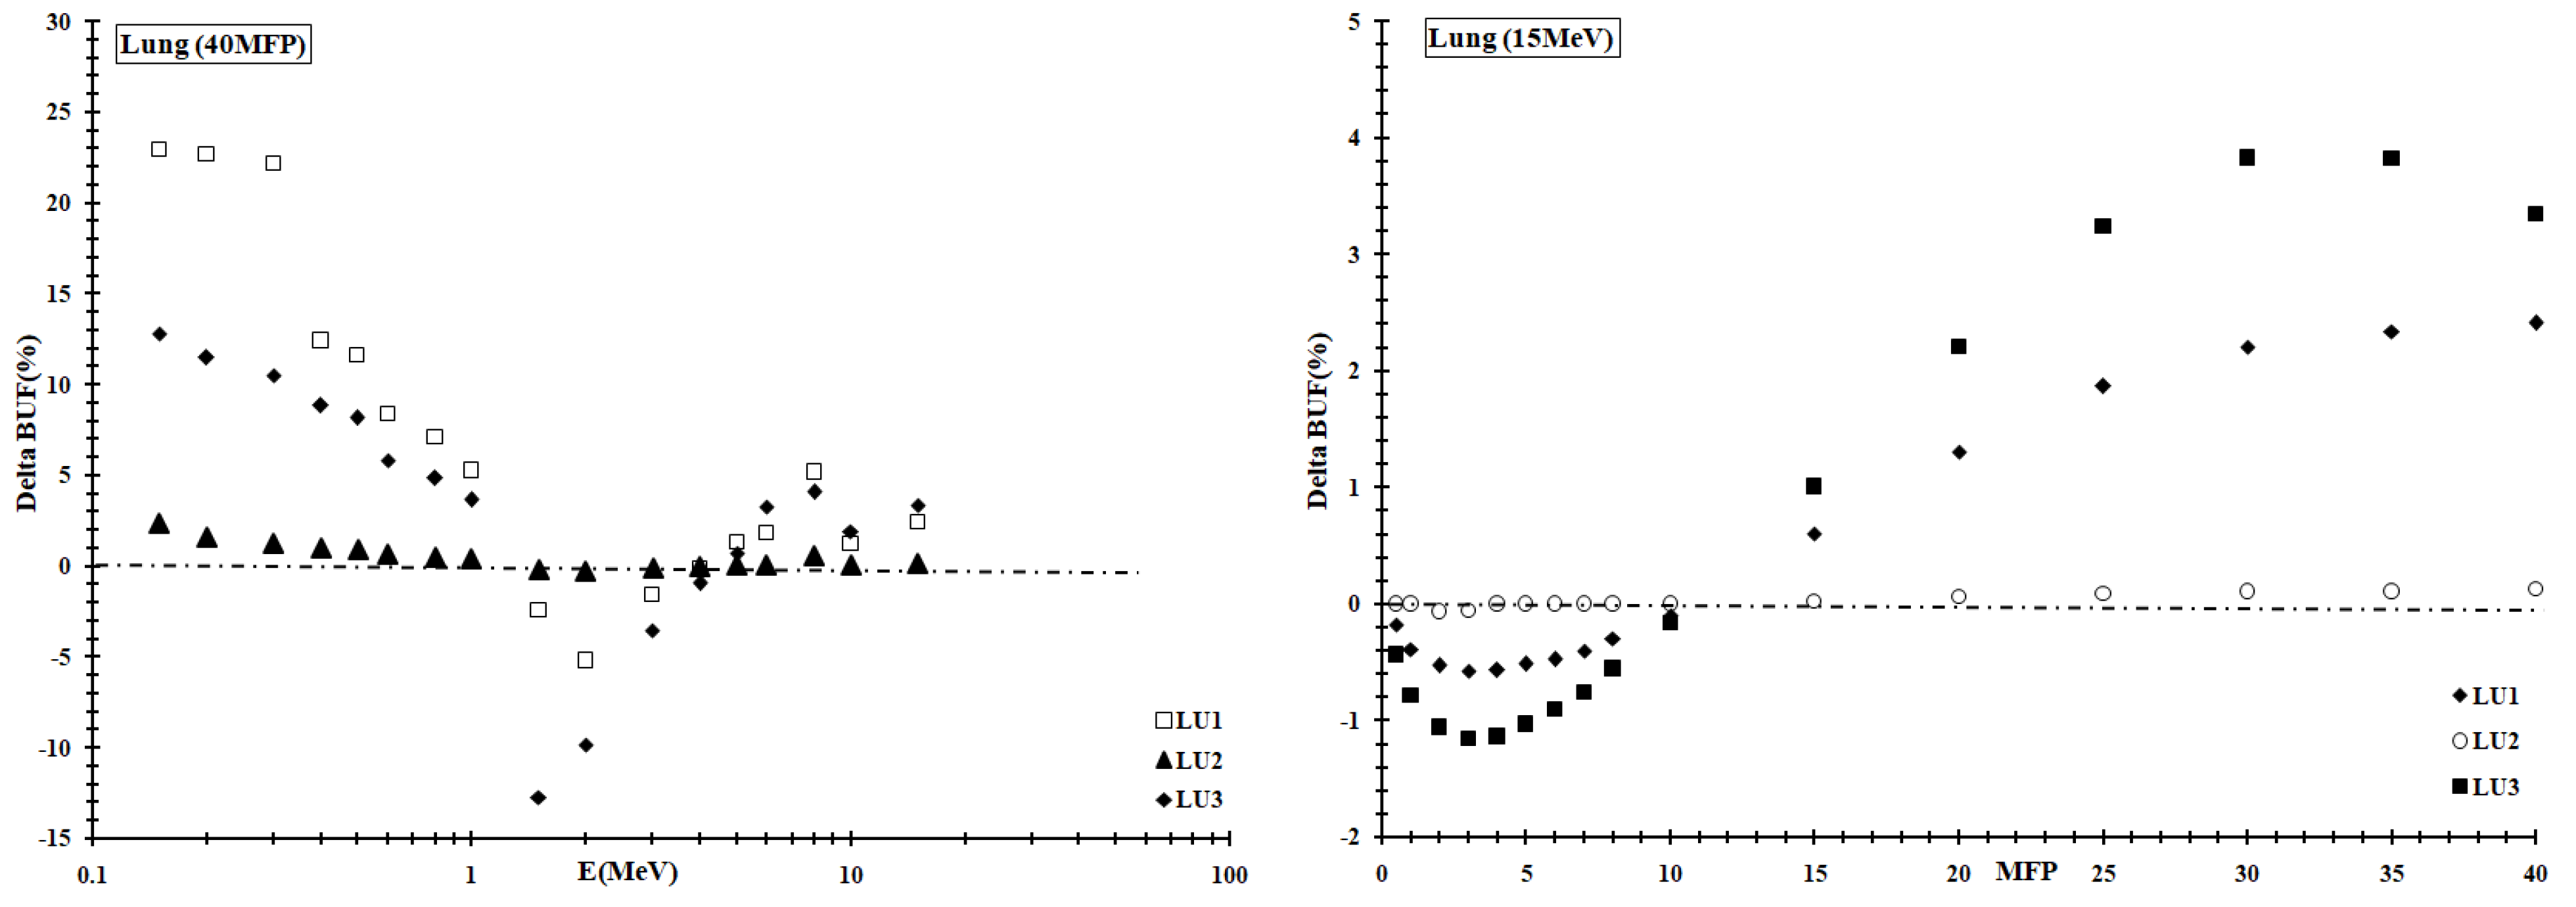
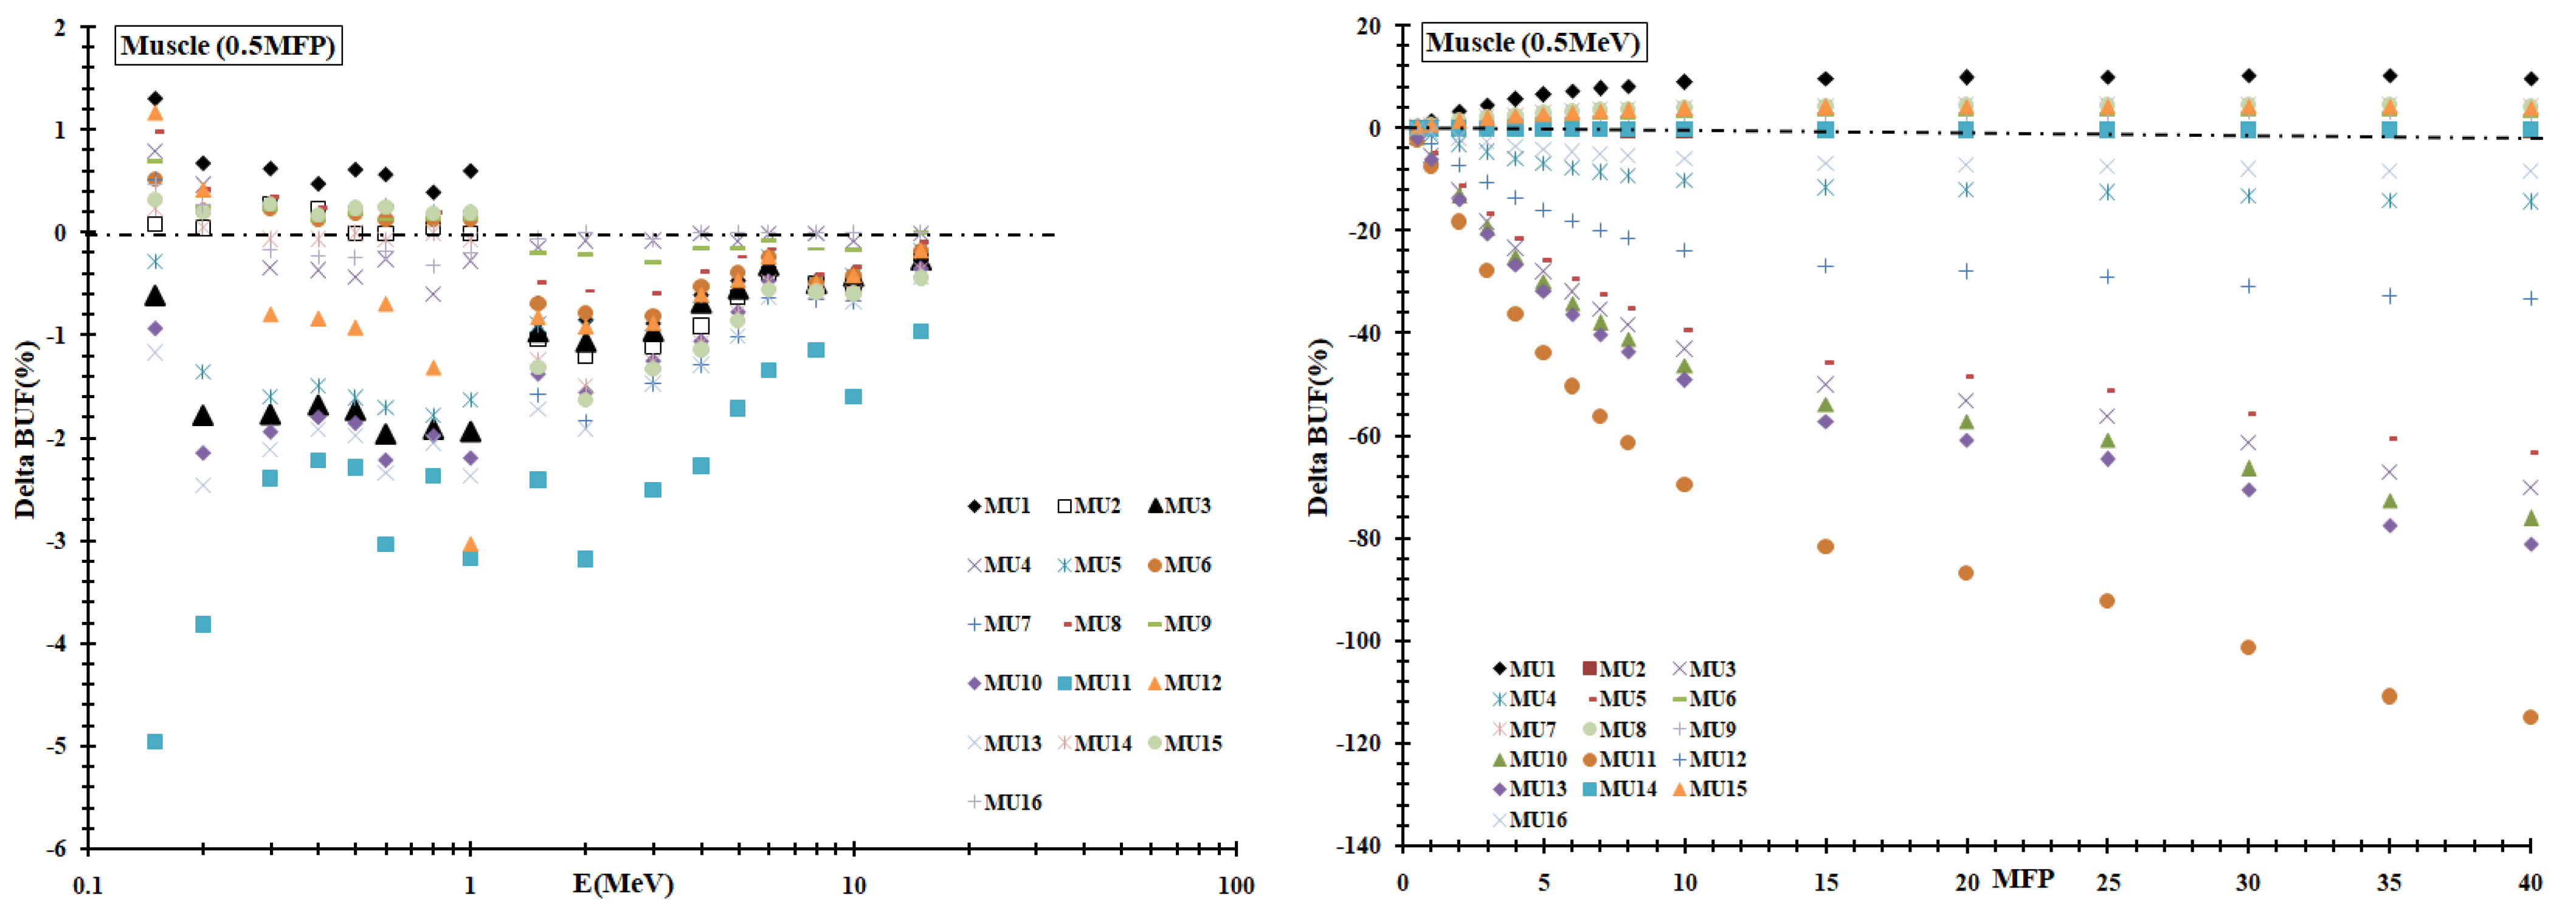
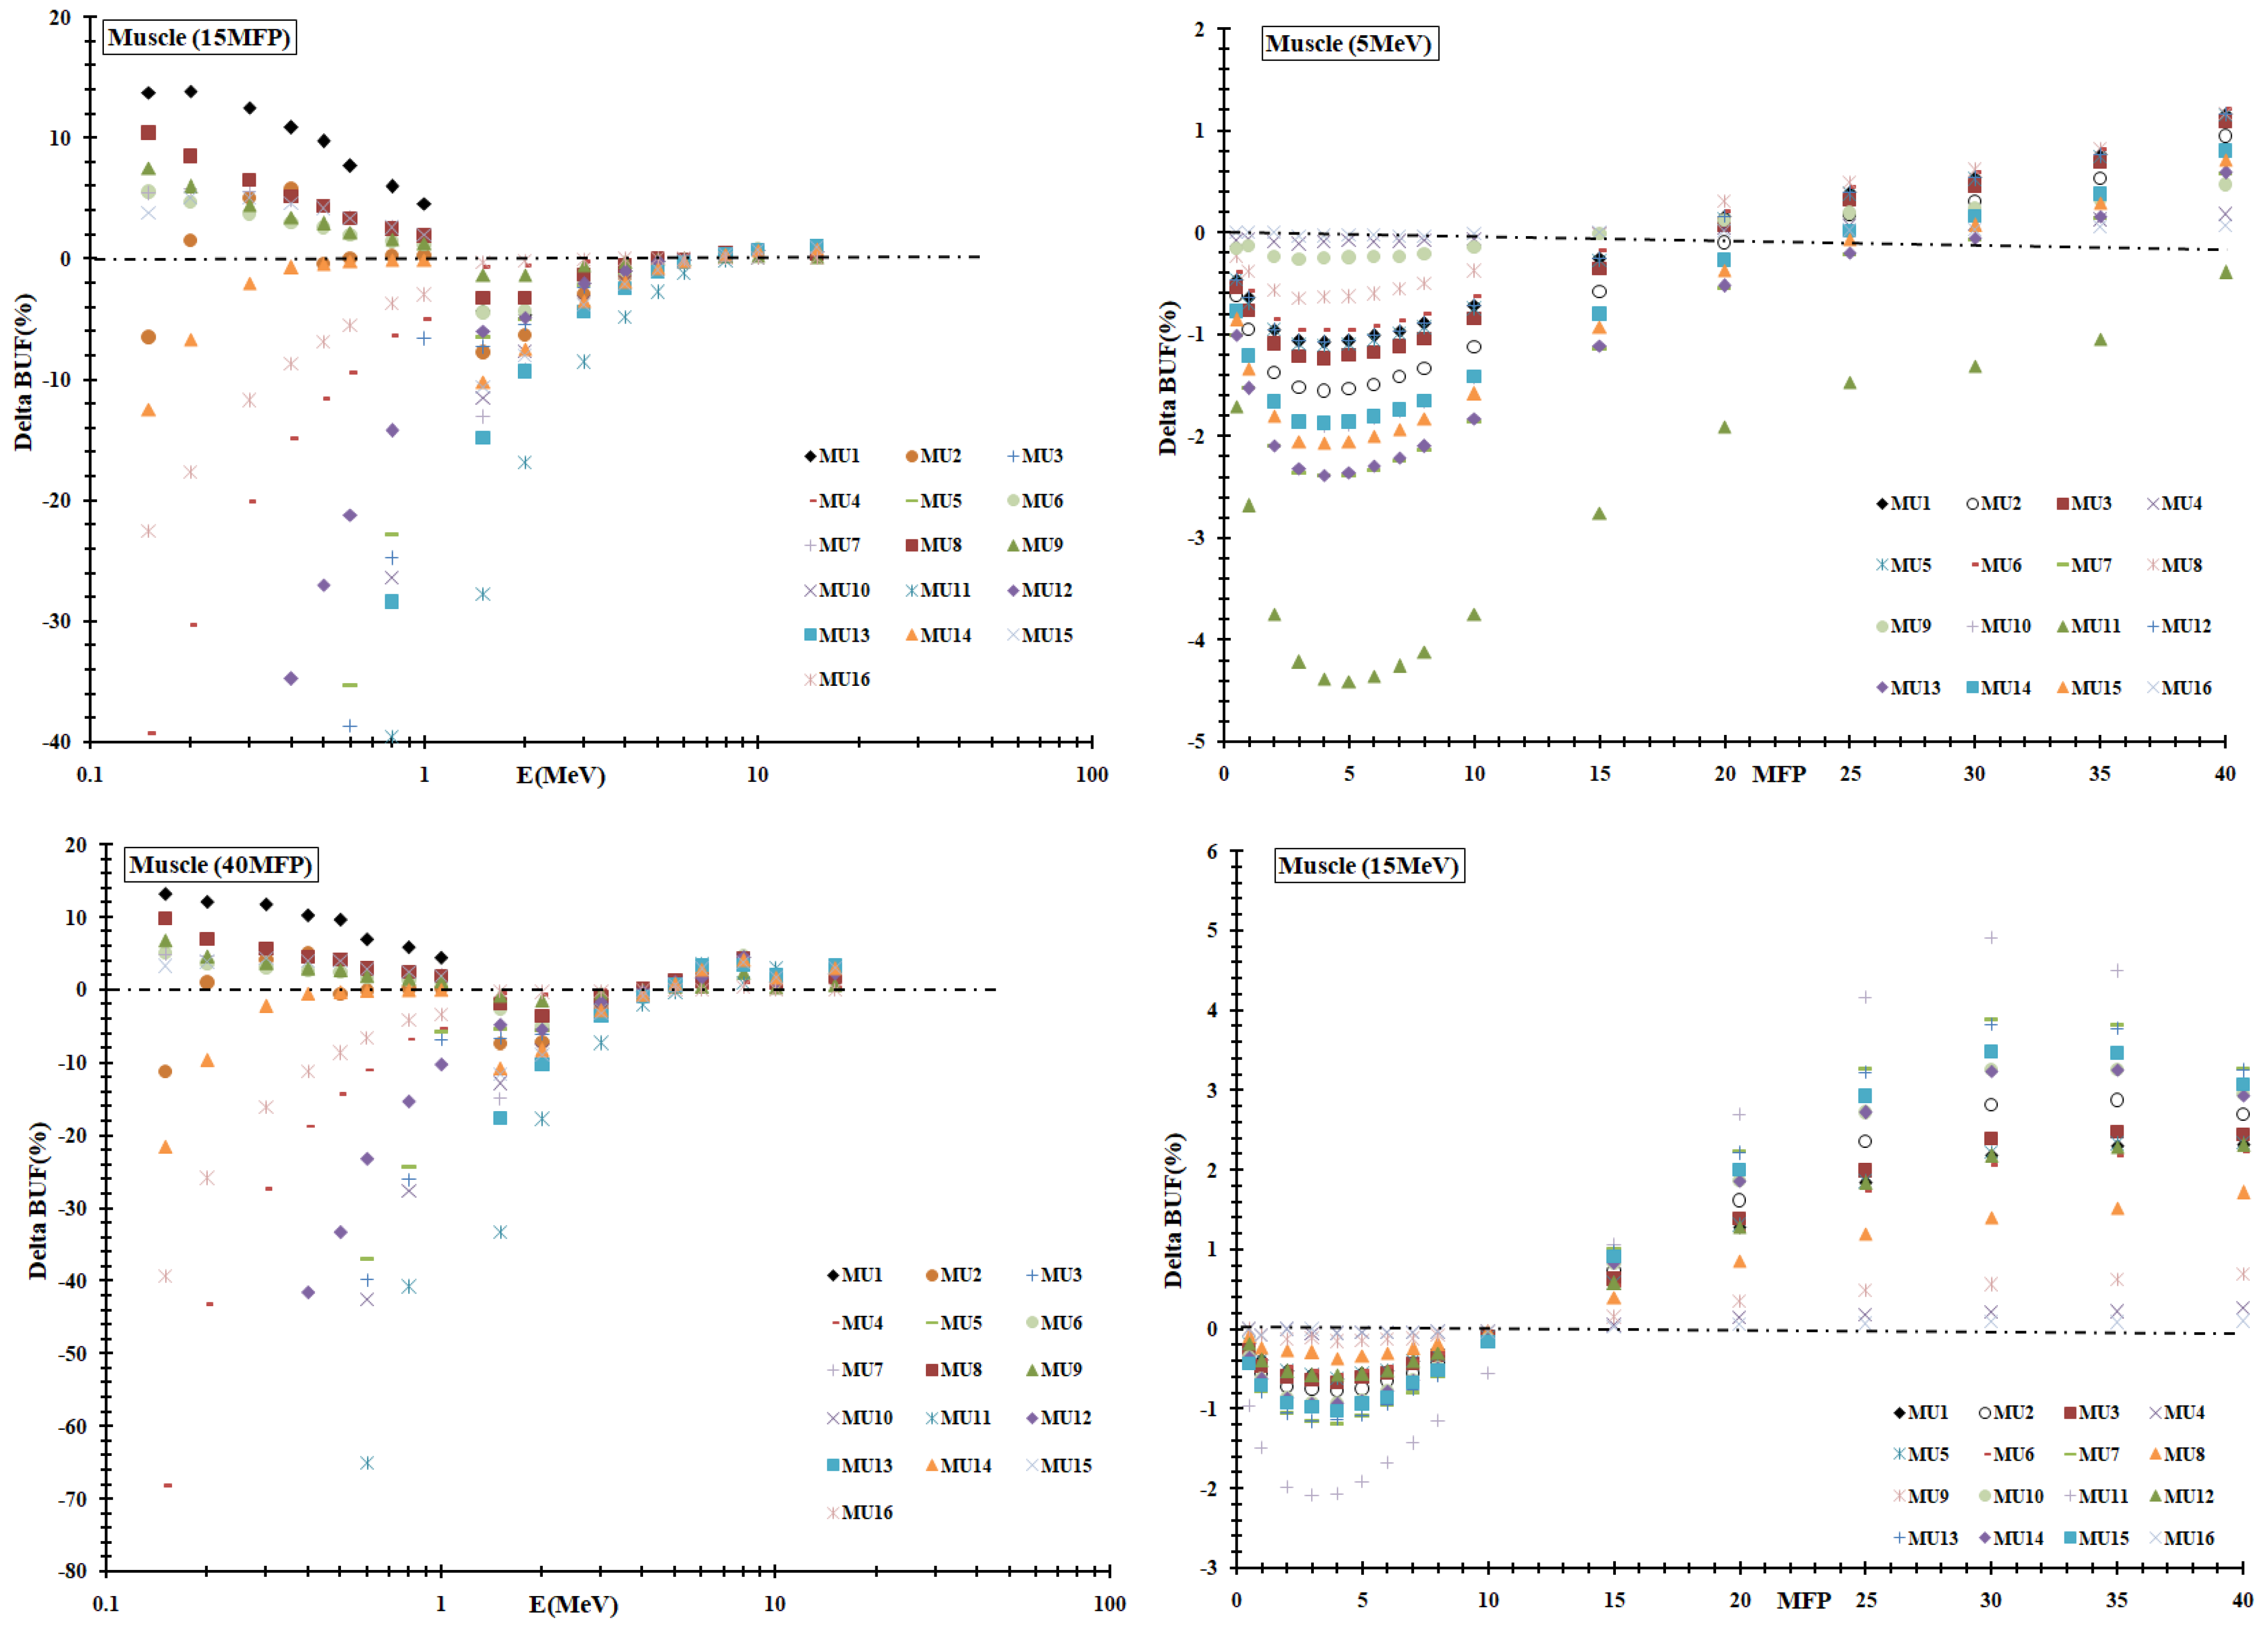
- Chemical composition effect: A major effect on the BUF magnitude is caused by the difference in the chemical compositions of adipose tissue and the equivalent candidate materials. Figure 5 shows the relative BUF deviations of AD1, AD2 and AD3 to adipose tissue as a function of energy at fixed penetrations of 0.5, 15 and 40 mfp and as a function of mfp at selected photon energies (0.5, 5 and 15 MeV). According to the photon energy region, the magnitude of the build-up factor and its dependence on vary. As the relative deviation of BUFs are given in terms of delta(%) = 100 × (1 − BUF(Material)/BUF(Adipose)) in Figure 5, we have:BUF(AD2) > BUF(AD1) > BUF(Adipose) > BUF(AD3), and from Table 1, we have (AD2) < (AD1) < (Adipose) < (AD3), which confirms the theoretical hypothesis that BUF and are inversely proportional;
- TEM study: Based on the relative difference between the radiological properties of tissues and mimicking material candidates in % for BUF, , , , , , d0 and dmax and in cm for d80, d10cm and d20cm listed in Table 3 and plotted in Figure 5, we can see the close similarity of the AD1 candidate to adipose tissue. Moreover, the substitute AD2 seems to be closer to adipose tissue when looking for other parameters than BUF and . However, the discrepancy of AD3 compared to adipose tissue was seen for many parameters. Therefore, AD1 can be an acceptable TMM for adipose for the actual photon energy range.
3.2. Cortical Bone Tissue
3.3. Fat Tissue
3.4. Lung Tissue
3.5. Muscle Tissue
4. Conclusions
Author Contributions
Funding
Data Availability Statement
Acknowledgments
Conflicts of Interest
Abbreviations
| GP | Geometric progression |
| BUF | Buildup factor |
| AD1 | AP6 |
| AD2 | Ethoxyethanol |
| AD3 | Polyethylene |
| CB1 | Aluminum |
| CB2 | P.V.C. |
| CB3 | SB3 |
| CB4 | Teflon |
| CB5 | Witt liquid |
| FA1 | Alderson fat |
| FA2 | FT1 |
| FA3 | Glycerol trioleate |
| LU1 | Alderson lung |
| LU2 | LN1 |
| LU3 | Stacey latex |
| MU1 | Alderson muscle 1 |
| MU2 | Alderson muscle 2 |
| MU3 | Bakelite |
| MU4 | Goodman liquid |
| MU5 | Lexan |
| MU6 | M3 |
| MU7 | Mix D |
| MU8 | MS15 |
| MU9 | MS20 |
| MU10 | Nylon-6 |
| MU11 | Paraffin wax |
| MU12 | Perspex |
| MU13 | Polystyrene |
| MU14 | Shonka plastic |
| MU15 | Temex |
| MU16 | Water |
References
- White, D.R.; Constantinou, C. Anthropomorphic phantom materials. Prog. Med. Radiat. Phys. 1982, 1, 133–193. [Google Scholar]
- Vasiliev, V.N.; Kostjuchenko, V.I.; Riazantsev, O.B.; Khaybullin, V.G.; Samarin, S.I.; Uglov, A.S. Tissue equivalence of some phantom materials for proton beams. arXiv 2010, arXiv:1005.4389. [Google Scholar]
- Bradley, D.; Tajuddin, A.A.; Sudin, C.W.A.C.W.; Bauk, S. Photon attenuation studies on tropical hardwoods. Appl. Radiat. Isot. 1991, 42, 771–773. [Google Scholar] [CrossRef]
- Ferreira, C.; Ximenes Filho, R.E.M.; Vieira, J.W.; Tomal, A.; Poletti, M.E.; Garcia, C.A.B.; Maia, A.F. Evaluation of tissue-equivalent materials to be used as human brain tissue substitute in dosimetry for diagnostic radiology. Nucl. Instrum. Methods Phys. Res. B 2010, 268, 2515–2521. [Google Scholar] [CrossRef]
- Marwan, A.; Kabir, N.A.; Hashim, R.; Marashdeh, M.W.; Tajuddin, A.A. Measurement of attenuation coefficients and CT numbers of epoxy resin and epoxy-based Rhizophora spp particle boards in computed tomography energy range. Radiat. Phys. Chem. 2018, 149, 41–48. [Google Scholar]
- Yemby, H.T.; Mullisaca P, A.; Apaza V, G.; Chen, F.; Vega R, J. Construction and characterization of materials equivalent to the tissues and organs of the human body for radiotherapy. Radiat. Phys. Chem. 2019, 159, 70–75. [Google Scholar]
- IEC 60601-2-37:2007; Particular Requirements for the Basic Safety and Essential Performance of Ultrasonic Medical Diagnostic and Monitoring Equipment. IEC: Geneva, Switzerland, 2007.
- Li, P.; Yang, Z.; Jiang, S. Tissue mimicking materials in image-guided needle-based interventions: A review Mater. Sci. Eng. C 2018, 93, 1116–1131. [Google Scholar] [CrossRef]
- McGarry, C.K.; Grattan, L.J.; Ivory, A.M.; Leek, F.; Liney, G.P.; Liu, Y.; Miloro, P.; Rai, R.; Robinson, A.P.; Shih, A.J.; et al. Tissue mimicking materials for imaging and therapy phantoms: A review. Phys. Med. Biol. 2020, 65, 1–43. [Google Scholar] [CrossRef]
- White, D.R.; Booz, J.; Griffith, R.V.; Spokas, J.J.; Wilson, I.J. ICRU Report 44: Tissue Substitutes in Radiation Dosimetry and Measurement. J. ICRU 1989, os23. Available online: https://0-journals-sagepub-com.brum.beds.ac.uk/toc/crub/os-23/1 (accessed on 3 March 2022).
- Manohara, S.R.; Hanagodimath, S.M.; Gerward, L. The effective atomic numbers of some biomolecules calculated by two methods: A comparative study. Med. Phys. 2009, 36, 137–141. [Google Scholar] [CrossRef]
- Manohara, S.R.; Hanagodimath, S.M.; Gerward, L.; Subhranshu, S.S. Energy-absorption buildup factors of some fluorides and sulfates: Thermoluminescent dosimetric materials. Mater. Today Proc. 2019, 10, 20–24. [Google Scholar] [CrossRef]
- Kadri, O.; Alfuraih, A. Search for Tissue Equivalent Materials Based on Exposure and Energy Absorption Buildup Factor Computations. Appl. Sci. 2022, 12, 798. [Google Scholar] [CrossRef]
- Swinehart, D.F. The Beer-Lambert Law. J. Chem. Educ. 1962, 39, 333. [Google Scholar] [CrossRef]
- ANSI/ANS-6; American Nuclear Society. Standards Committee, Gamma-Ray Attenuation Coefficients and Buildup Factors for Engineering Materials. American Nuclear Society: La Grange Park, IL, USA, 1991. Available online: https://books.google.com.sa/books?id=jKwYyAEACAAJ (accessed on 3 March 2022).
- White, D.R. Tissue substitutes in experimental radiation physics. Med. Phys. 1978, 5, 467. [Google Scholar] [CrossRef]
- Capote, R.; Jeraj, R.; Ma, C.M.; Rogers, D.W.O.; Sanchez-Doblado, F.; Sempau, J.; Seuntjens, J.; Siebers, J.V. Phase-Space Database for External Beam Radiotherapy. Summary Report of a Consultants’ Meeting (INDC(NDS)–0484). International Atomic Energy Agency (IAEA). Available online: http://www-nds.iaea.org/reports-new/indc-reports/indc-nds/indc-nds-0484.pdf (accessed on 3 March 2022).
- Cortes-Giraldo, M.A.; Quesada, J.M.; Gallardo, M.I.; Capote, R. An implementation to read and write IAEA phase-space files in GEANT4-based simulations. Int. J. Radiat. Biol. 2012, 88, 200–208. [Google Scholar] [CrossRef]
- Berger, M.J.; Hubbell, J.H.; Seltzer, S.M.; Chang, J.; Coursey, J.S.; Sukumar, R.; Zucker, D.S.; Olsen, K. XCOM: Photon Cross Sections Database; NBSIR 87-3597; National Institute of Standards and Technology: Gaithersburg, MD, USA, 2010. Available online: https://www.nist.gov/pml/xcom-photon-cross-sections-database (accessed on 3 March 2022).
- Kadri, O.; Alfuraih, A. Photon energy absorption and exposure buildup factors for deeppenetration in human tissues. Nucl. Sci. Tech. 2019, 30, 176. [Google Scholar] [CrossRef]
- Jackson, D.F.; Hawkes, D.J. X-ray attenuation coefficients of elements and mixtures. Phys. Rep. 1981, 70, 169–233. [Google Scholar] [CrossRef]
- Salamaab, E.; Alic, A.S.; Emadd, N.; Radia, A. Validation of GEANT4 Monte Carlo Simulation Code for 6 MV Varian Linac Photon Beam. Arab. J. Nucl. Sci. Appl. 2015, 48, 70–76. [Google Scholar]
- Sardari, D.; Maleki, R.; Samavat, H.; Esmaeeli, A. Measurement of depth-dose of linear accelerator and simulation by use of Geant4 computer code. Rep. Pract. Oncol. Radiother. 2010, 15, 64–68. [Google Scholar] [CrossRef] [Green Version]
- Mia, M.A.; Rahman, M.S.; Purohit, S.; Kabir, S.M.E.; Meaze, A.K.M.M.H. Analysis of Percentage Depth Dose for 6 and 15 MV Photon Energies of Medical Linear Accelerator With CC13 Ionization Chamber. Nucl. Sci. Appl. 2019, 28, 31–35. [Google Scholar]
- Albantow, C.; Hargrave, C.; Brown, A.; Halsall, C. Comparison of 3D printed nose bolus to traditional wax bolus for cost-effectiveness, volumetric accuracy and dosimetric effect. J. Med. Radiat. Sci. 2020, 67, 54–63. [Google Scholar] [CrossRef] [PubMed] [Green Version]
- Dai, G.; Xu, X.; Wu, X.; Lei, X.; Wei, X.; Li, Z.; Xiao, Q.; Zhong, R.; Bai, S. Application of 3D-print silica bolus for nasal NK/T-cell lymphoma radiation therapy. J. Radiat. Res. 2020, 61, 920–928. [Google Scholar] [CrossRef] [PubMed]
- Lu, Y.; Song, J.; Yao, X.; An, M.; Shi, Q.; Huang, X. 3D Printing Polymer-based Bolus Used for Radiotherapy. Int. J. Bioprint. 2021, 7, 414. [Google Scholar] [CrossRef] [PubMed]


| Material | Elemental Composition | |||
|---|---|---|---|---|
| 0.5 | 5 | 15 | ||
| Adipose | H(12.001), C(64.005), N(0.800), O(22.902), Na(0.050), Mg(0.002) | 6.67 | 5.374 | 5.348 |
| P(0.016), S(0.070), Cl(0.120), K(0.030), Ca(0.002), Fe(0.002) | ||||
| AD1 | H(8.359), C(69.133), N(2.360), O(16.938), F(3.070), Cl(0.140) | 6.713 | 5.656 | 5.619 |
| AD2 | H(11.180), C(53.310), O(35.510) | 6.914 | 5.635 | 5.597 |
| AD3 | H(14.370), C(85.630) | 5.928 | 4.742 | 4.705 |
| Bone | H(3.392), C(15.509), N(3.972), O(44.128), Na(0.060), Mg(0.210) | 14.08 | 10.49 | 10.44 |
| P(10.206), S(0.310), Ca(22.213) | ||||
| CB1 | Al(100.000) | 13 | 13 | 13 |
| CB2 | H(4.840), C(38.436), Cl(56.724) | 14.51 | 11.38 | 11.32 |
| CB3 | H(3.100), C(31.260), N(0.990), O(37.570), Cl(0.050), Ca(27.030) | 14.27 | 10.11 | 10.06 |
| CB4 | C(24.020), F(75.980) | 8.653 | 8.251 | 8.243 |
| CB5 | H(4.686), O(56.630), P(10.867), K(27.817) | 14.11 | 10.94 | 10.88 |
| Fat | H(12.210), C(76.080), O(11.710) | 6.007 | 5.127 | 5.111 |
| FA1 | H(14.369), C(85.607), O(0.004), Sb(0.020) | 6.382 | 4.749 | 4.71 |
| FA2 | H(11.701), Li(3.48)), C(72.748), O(12.071) | 6.775 | 5.09 | 5.076 |
| FA3 | H(11.840), C(77.320), O(10.840) | 6.774 | 5.141 | 5.126 |
| Lung | H(10.134), C(10.237), N(2.866), O(75.752), Na(0.184), Mg(0.007) | 8.153 | 6.576 | 6.547 |
| Al(0.001), P(0.082), S(0.225), Cl(0.266), K(0.194), Ca(0.010) | ||||
| Fe(0.041), Zn(0.001) | ||||
| LU1 | H(5.741), C(73.947), N(2.010), O(18.142), Sb(0.160) | 9.129 | 5.873 | 5.821 |
| LU2 | H(6.000), C(51.440), N(4.290), O(30.720), Al(7.550) | 8.231 | 6.536 | 6.511 |
| LU3 | H(10.100), B(8)), C(79.200), O(0.120), S(1.910), Zn(0.670) | 8.843 | 5.325 | 5.298 |
| Muscle | H(10.200), C(12.300), N(3.500), O(72.893), Na(0.080) | 8.075 | 6.534 | 6.506 |
| Mg(0.020), P(0.200), S(0.500), K(0.300), Ca(0.007) | ||||
| MU1 | H(8.830), C(64.450), N(4.050), O(20.350), Cl(2.240), Sb(0.080) | 8.908 | 5.843 | 5.79 |
| MU2 | H(8.871), C(66.817), N(3.100), O(21.132), Sb(0.080) | 8.037 | 5.63 | 5.593 |
| MU3 | H(5.740), C(77.460), O(16.800) | 6.438 | 5.771 | 5.73 |
| MU4 | H(10.200), C(12.010), N(3.540), O(74.250) | 7.505 | 6.459 | 6.435 |
| MU5 | H(5.549), C(75.573), O(18.878) | 6.526 | 5.827 | 5.783 |
| MU6 | H(11.430), C(65.580), O(9.220), Mg(13.480), Ca(0.290) | 8.287 | 5.891 | 5.833 |
| MU7 | H(13.401), C(77.799), O(3.500), Mg(3.860), Ti(1.440) | 8.436 | 5.274 | 5.247 |
| MU8 | H(9.750), C(63.160), N(0.940), O(16.020), Al(9.600), Cl(0.530) | 8.437 | 6.06 | 6.045 |
| MU9 | H(8.119), C(58.344), N(1.780), O(18.638), Mg(13.029), Cl(0.090) | 8.316 | 6.338 | 6.317 |
| MU10 | H(9.799), C(63.683), N(12.379), O(14.139) | 6.364 | 5.48 | 5.452 |
| MU11 | H(14.860), C(85.140) | 5.902 | 4.706 | 4.67 |
| MU12 | H(8.051), C(59.986), O(31.963) | 6.918 | 5.843 | 5.796 |
| MU13 | H(7.74), C(92.26) | 6.301 | 5.284 | 5.267 |
| MU14 | H(10.2), C(76.8), N(3.6), O(5.9), F(1.7), Ca(1.8) | 8.043 | 5.489 | 5.456 |
| MU15 | H(9.654), C(87.489), N(0.06), O(0.473), S(1.539) | 8.42 | 5.407 | 5.377 |
| Ti(0.332), Zn(0.453) | ||||
| MU16 | H(11.19), O(88.81) | 7.72 | 6.505 | 6.478 |
| 0.15 | 0.2 | 0.3 | 0.4 | 0.5 | 1 | 1.5 | 2 | 3 | 5 | 10 | 15 | ||
|---|---|---|---|---|---|---|---|---|---|---|---|---|---|
| Adipose | a | −0.222 | −0.217 | −0.190 | −0.172 | −0.154 | −0.100 | −0.077 | −0.048 | −0.016 | 0.018 | 0.041 | 0.047 |
| b | 4.117 | 3.517 | 3.022 | 2.746 | 2.575 | 381.555 | 2.046 | 1.931 | 1.772 | 1.590 | 1.379 | 1.282 | |
| c | 2.600 | 2.507 | 2.230 | 2.047 | 1.890 | 1.496 | 1.345 | 1.204 | 1.065 | 0.935 | 0.854 | 0.834 | |
| d | 0.099 | 0.095 | 0.082 | 0.073 | 0.067 | 0.046 | 0.041 | 0.025 | 0.009 | −0.010 | −0.019 | −0.026 | |
| 14.121 | 13.923 | 14.174 | 13.864 | 14.149 | 13.909 | 13.740 | 14.253 | 12.433 | 14.772 | 13.016 | 14.469 | ||
| 6.626 | 6.640 | 6.658 | 6.662 | 6.670 | 6.664 | 5.428 | 5.394 | 5.383 | 5.374 | 5.362 | 5.348 | ||
| 0.151 | 0.137 | 0.119 | 0.107 | 0.097 | 0.071 | 0.058 | 0.050 | 0.040 | 0.030 | 0.021 | 0.018 | ||
| 0.027 | 0.030 | 0.032 | 0.033 | 0.033 | 0.031 | 0.029 | 0.026 | 0.023 | 0.019 | 0.015 | 0.014 | ||
| 2.999 | 2.991 | 2.987 | 2.985 | 2.984 | 2.983 | 2.985 | 2.991 | 3.014 | 3.073 | 3.242 | 3.397 | ||
| 1.546 | 1.542 | 1.540 | 1.539 | 1.539 | 1.538 | 1.539 | 1.542 | 1.554 | 1.585 | 1.671 | 1.751 | ||
| Bone | a | −0.041 | −0.056 | −0.078 | −0.081 | −0.080 | −0.063 | −0.049 | −0.034 | −0.011 | 0.016 | 0.042 | 0.062 |
| b | 2.722 | 2.661 | 2.482 | 2.353 | 2.250 | 1.978 | 1.874 | 1.798 | 1.687 | 1.539 | 1.349 | 1.263 | |
| c | 1.266 | 1.365 | 1.468 | 1.471 | 1.453 | 1.323 | 1.234 | 1.155 | 1.056 | 0.955 | 0.875 | 0.826 | |
| d | −0.007 | −0.006 | 0.014 | 0.016 | 0.018 | 0.019 | 0.017 | 0.012 | 0.001 | −0.019 | −0.032 | −0.053 | |
| 10.507 | 7.952 | 16.942 | 15.907 | 16.301 | 15.937 | 14.926 | 14.499 | 10.770 | 15.083 | 13.319 | 14.462 | ||
| 14.088 | 14.172 | 14.022 | 14.063 | 14.082 | 14.102 | 11.402 | 10.753 | 10.572 | 10.486 | 10.449 | 10.437 | ||
| 0.148 | 0.131 | 0.111 | 0.099 | 0.090 | 0.066 | 0.053 | 0.046 | 0.037 | 0.029 | 0.023 | 0.021 | ||
| 0.032 | 0.030 | 0.030 | 0.031 | 0.031 | 0.029 | 0.026 | 0.024 | 0.021 | 0.019 | 0.016 | 0.016 | ||
| 6.258 | 6.122 | 6.041 | 6.015 | 6.004 | 5.990 | 5.994 | 6.019 | 6.102 | 6.315 | 6.860 | 7.300 | ||
| 1.733 | 1.696 | 1.673 | 1.666 | 1.663 | 1.659 | 1.660 | 1.667 | 1.690 | 1.749 | 1.900 | 2.022 | ||
| Fat | a | −0.217 | −0.213 | −0.211 | −0.192 | −0.171 | −0.110 | −0.081 | −0.049 | −0.017 | 0.018 | 0.041 | 0.048 |
| b | 4.062 | 3.471 | 3.147 | 2.842 | 2.656 | 1191.250 | 2.064 | 1.946 | 1.780 | 1.596 | 1.382 | 1.285 | |
| c | 2.545 | 2.470 | 2.412 | 2.196 | 2.010 | 1.544 | 1.361 | 1.210 | 1.067 | 0.934 | 0.853 | 0.831 | |
| d | 0.097 | 0.093 | 0.094 | 0.080 | 0.079 | 0.053 | 0.045 | 0.027 | 0.010 | −0.010 | −0.018 | −0.025 | |
| 14.117 | 13.694 | 14.409 | 13.472 | 14.190 | 13.780 | 13.764 | 14.372 | 12.632 | 14.888 | 13.289 | 14.154 | ||
| 6.763 | 6.774 | 6.002 | 6.004 | 6.007 | 6.001 | 5.162 | 5.140 | 5.132 | 5.127 | 5.121 | 5.111 | ||
| 0.151 | 0.138 | 0.119 | 0.107 | 0.098 | 0.071 | 0.058 | 0.050 | 0.040 | 0.030 | 0.021 | 0.018 | ||
| 0.027 | 0.030 | 0.032 | 0.033 | 0.033 | 0.031 | 0.029 | 0.026 | 0.023 | 0.019 | 0.015 | 0.013 | ||
| 2.931 | 2.925 | 2.922 | 2.920 | 2.920 | 2.919 | 2.920 | 2.926 | 2.947 | 3.000 | 3.153 | 3.294 | ||
| 1.585 | 1.582 | 1.580 | 1.580 | 1.579 | 1.579 | 1.579 | 1.583 | 1.594 | 1.623 | 1.705 | 1.782 | ||
| Lung | a | −0.161 | −0.167 | −0.152 | −0.139 | −0.126 | −0.083 | −0.061 | −0.041 | −0.014 | 0.018 | 0.039 | 0.047 |
| b | 3.856 | 3.307 | 2.859 | 2.621 | 2.468 | 2.093 | 1.981 | 1.873 | 1.731 | 1.567 | 1.366 | 1.273 | |
| c | 2.054 | 2.073 | 1.932 | 1.815 | 1.713 | 1.414 | 1.282 | 1.182 | 1.060 | 0.940 | 0.865 | 0.841 | |
| d | 0.063 | 0.066 | 0.058 | 0.053 | 0.048 | 0.033 | 0.027 | 0.019 | 0.005 | −0.012 | −0.022 | −0.032 | |
| 14.487 | 14.052 | 14.196 | 14.240 | 14.239 | 14.432 | 14.473 | 13.965 | 13.183 | 13.953 | 13.409 | 15.140 | ||
| 8.079 | 8.093 | 8.128 | 8.144 | 8.153 | 8.156 | 6.682 | 6.608 | 6.592 | 6.576 | 6.550 | 6.547 | ||
| 0.149 | 0.136 | 0.118 | 0.105 | 0.096 | 0.070 | 0.057 | 0.049 | 0.039 | 0.030 | 0.022 | 0.019 | ||
| 0.027 | 0.029 | 0.032 | 0.032 | 0.033 | 0.031 | 0.028 | 0.026 | 0.023 | 0.019 | 0.016 | 0.014 | ||
| 3.493 | 3.479 | 3.470 | 3.466 | 3.465 | 3.464 | 3.465 | 3.476 | 3.510 | 3.599 | 3.847 | 4.071 | ||
| 1.482 | 1.476 | 1.473 | 1.471 | 1.470 | 1.470 | 1.470 | 1.475 | 1.489 | 1.527 | 1.632 | 1.727 | ||
| Muscle | a | −0.163 | −0.168 | −0.153 | −0.140 | −0.127 | −0.084 | −0.062 | −0.042 | −0.014 | 0.018 | 0.039 | 0.047 |
| b | 3.874 | 3.317 | 2.866 | 2.625 | 2.471 | 2.096 | 1.983 | 1.875 | 1.733 | 1.568 | 1.367 | 1.273 | |
| c | 2.067 | 2.086 | 1.941 | 1.822 | 1.718 | 1.416 | 1.284 | 1.183 | 1.060 | 0.940 | 0.865 | 0.841 | |
| d | 0.064 | 0.067 | 0.059 | 0.054 | 0.048 | 0.033 | 0.028 | 0.019 | 0.005 | −0.012 | −0.021 | −0.032 | |
| 14.481 | 14.035 | 14.198 | 14.214 | 14.219 | 14.390 | 14.423 | 13.967 | 13.099 | 13.991 | 13.333 | 15.149 | ||
| 8.010 | 8.022 | 8.053 | 8.067 | 8.075 | 8.076 | 6.637 | 6.564 | 6.549 | 6.534 | 6.509 | 6.506 | ||
| 0.149 | 0.136 | 0.118 | 0.105 | 0.096 | 0.070 | 0.057 | 0.049 | 0.039 | 0.030 | 0.022 | 0.019 | ||
| 0.027 | 0.029 | 0.032 | 0.032 | 0.033 | 0.031 | 0.028 | 0.026 | 0.023 | 0.019 | 0.016 | 0.014 | ||
| 3.471 | 3.458 | 3.450 | 3.446 | 3.444 | 3.443 | 3.444 | 3.455 | 3.488 | 3.576 | 3.822 | 4.043 | ||
| 1.483 | 1.477 | 1.473 | 1.472 | 1.471 | 1.471 | 1.471 | 1.476 | 1.490 | 1.527 | 1.632 | 1.727 |
| Tissue | Material | BUF | d0(%) | dmax(cm) | d80%(cm) | d10cm(%) | d20cm(%) | |||||
|---|---|---|---|---|---|---|---|---|---|---|---|---|
| Adipose | AD1 | 1.9 | 3.1 | 3.1 | 3.1 | 17.0 | 13.3 | 1.6 | 0.3 | 0.3 | 0.3 | 2.0 |
| AD2 | 8.0 | 4.3 | 0.6 | 0.6 | 4.9 | 0.5 | 0.8 | 0.0 | −0.1 | 0.1 | 0.0 | |
| AD3 | 26.0 | 11.5 | 1.6 | 1.6 | 10.8 | 0.3 | 0.8 | 0.0 | −0.1 | 1.1 | 2.0 | |
| Bone | CB1 | 6.9 | 15.6 | 5.0 | 5.5 | 108.5 | 68.0 | 23.6 | −0.3 | -1.1 | 19.1 | 33.9 |
| CB2 | 4.2 | 5.7 | 0.7 | 0.9 | 9.6 | 20.7 | 14.3 | 0.2 | 1.2 | 15.6 | 33.2 | |
| CB3 | 0.6 | 2.3 | 0.3 | 0.4 | 2.1 | 2.4 | 1.1 | 0.1 | −0.2 | 0.0 | 0.3 | |
| CB4 | 78.8 | 29.9 | 8.9 | 9.9 | 28.6 | 61.4 | 0.5 | 0.1 | −0.3 | 2.5 | 6.7 | |
| CB5 | 0.6 | 2.4 | 0.9 | 0.9 | 5.8 | 12.3 | 2.4 | 0.3 | 0.1 | 3.0 | 5.7 | |
| Fat | FA1 | 10.8 | 7.1 | 1.5 | 1.6 | 8.7 | 2.7 | 0.0 | 0.3 | 0.0 | 2.3 | 0.6 |
| FA2 | 9.9 | 4.9 | 0.9 | 0.9 | 0.4 | 1.4 | 2.9 | 0.0 | 0.0 | 1.9 | 1.0 | |
| FA3 | 9.8 | 4.7 | 0.3 | 0.3 | 1.3 | 1.3 | 0.4 | 0.2 | 0.0 | 0.5 | 0.2 | |
| Lung | LU1 | 5.7 | 11.2 | 4.6 | 4.5 | 14.8 | 32.3 | 6.5 | 0.4 | -1.3 | 2.6 | 5.7 |
| LU2 | 0.5 | 0.8 | 4.0 | 4.0 | 18.8 | 22.3 | 7.3 | 0.5 | −0.2 | 0.2 | 0.4 | |
| LU3 | 4.8 | 13.5 | 1.8 | 1.8 | 10.2 | 10.3 | 7.3 | 1.2 | −0.1 | 0.4 | 0.0 | |
| Muscle | MU1 | 4.3 | 9.8 | 1.9 | 1.9 | 0.6 | 11.8 | 2.3 | 0.0 | 0.0 | 3.1 | 0.2 |
| MU2 | 2.1 | 8.0 | 2.0 | 2.1 | 1.5 | 15.4 | 4.2 | −0.2 | 0.0 | 2.1 | 0.8 | |
| MU3 | 28.4 | 15.7 | 4.7 | 4.8 | 14.8 | 34.4 | 8.4 | 0.0 | −0.7 | 7.2 | 12.0 | |
| MU4 | 6.1 | 3.9 | 0.1 | 0.1 | 0.2 | 1.0 | 2.3 | −0.4 | −0.4 | 4.4 | 4.6 | |
| MU5 | 25.7 | 14.8 | 4.8 | 5.0 | 16.5 | 35.2 | 6.9 | 0.1 | −0.7 | 5.6 | 9.3 | |
| MU6 | 1.8 | 6.4 | 0.8 | 0.9 | 10.3 | 1.6 | 1.9 | 0.0 | 0.0 | 2.0 | 2.1 | |
| MU7 | 3.3 | 12.0 | 2.2 | 2.3 | 19.1 | 2.2 | 1.9 | −0.3 | −0.1 | 1.9 | 1.7 | |
| MU8 | 2.4 | 5.8 | 1.2 | 1.2 | 3.4 | 3.5 | 2.7 | 0.2 | 0.1 | 3.2 | 1.3 | |
| MU9 | 1.5 | 2.9 | 2.2 | 2.2 | 5.8 | 10.3 | 2.7 | −0.2 | 0.1 | 1.7 | 0.2 | |
| MU10 | 31.2 | 18.5 | 1.4 | 1.5 | 5.9 | 12.9 | 15.6 | −0.6 | −1.3 | 11.1 | 21.7 | |
| MU11 | 50.6 | 27.5 | 3.2 | 3.3 | 24.4 | 2.8 | 7.6 | −0.2 | 0.3 | 0.4 | 3.2 | |
| MU12 | 15.4 | 12.4 | 2.6 | 2.7 | 3.8 | 18.0 | 5.0 | −0.1 | −0.3 | 6.3 | 8.6 | |
| MU13 | 33.6 | 20.5 | 3.4 | 3.6 | 1.6 | 27.0 | 0.8 | 0.3 | 0.0 | 1.7 | 1.5 | |
| MU14 | 2.5 | 8.8 | 1.1 | 1.1 | 8.2 | 9.5 | 3.1 | −0.1 | −0.3 | 3.9 | 7.8 | |
| MU15 | 2.9 | 10.8 | 1.6 | 1.6 | 7.0 | 12.6 | 1.9 | 0.1 | 0.1 | 1.6 | 0.6 | |
| MU16 | 3.5 | 2.3 | 1.6 | 1.6 | 6.5 | 7.1 | 0.8 | 0.2 | 0.2 | 1.3 | 0.8 |
Publisher’s Note: MDPI stays neutral with regard to jurisdictional claims in published maps and institutional affiliations. |
© 2022 by the authors. Licensee MDPI, Basel, Switzerland. This article is an open access article distributed under the terms and conditions of the Creative Commons Attribution (CC BY) license (https://creativecommons.org/licenses/by/4.0/).
Share and Cite
Kadri, O.; Alfuraih, A. Buildup Factor Computation and Percentage Depth Dose Simulation of Tissue Mimicking Materials for an External Photon Beam (0.15–15 MeV). Appl. Sci. 2022, 12, 4250. https://0-doi-org.brum.beds.ac.uk/10.3390/app12094250
Kadri O, Alfuraih A. Buildup Factor Computation and Percentage Depth Dose Simulation of Tissue Mimicking Materials for an External Photon Beam (0.15–15 MeV). Applied Sciences. 2022; 12(9):4250. https://0-doi-org.brum.beds.ac.uk/10.3390/app12094250
Chicago/Turabian StyleKadri, Omrane, and Abdulrahman Alfuraih. 2022. "Buildup Factor Computation and Percentage Depth Dose Simulation of Tissue Mimicking Materials for an External Photon Beam (0.15–15 MeV)" Applied Sciences 12, no. 9: 4250. https://0-doi-org.brum.beds.ac.uk/10.3390/app12094250