Systematic Review

Effects of Velocity Loss Threshold during Resistance Training on Strength and Athletic Adaptations: A Systematic Review with Meta-Analysis

by
Alejandro Hernández-Belmonte
and
Jesús G. Pallarés
*
Human Performance and Sports Science Laboratory, Faculty of Sport Sciences, University of Murcia, 30720 San Javier, Spain
*
Author to whom correspondence should be addressed.
Submission received: 16 March 2022 / Revised: 23 April 2022 / Accepted: 25 April 2022 / Published: 27 April 2022
(This article belongs to the Special Issue Progresses in Resistance Training)

Abstract

:
This study aimed to systematically review the effects of the different velocity loss (VL) thresholds during resistance training (RT) on strength and athletic adaptations. The VL was analyzed as both a categorical and continuous variable. For the categorical analysis, individual VL thresholds were divided into Low-ModVL (≤ 25% VL) or Mod-HighVL (> 25% VL). The efficacy of these VL thresholds was examined using between-group (Low-ModVL vs. Mod-HighVL) and within-group (pre–post effects in each group) analyses. For the continuous analysis, the relationship (R2) between each individual VL threshold and its respective effect size (ES) in each outcome was examined. Ten studies (308 resistance-trained young men) were finally included. The Low-ModVL group trained using a significantly (p ≤ 0.001) lower VL (16.1 ± 6.2 vs. 39.8 ± 9.0%) and volume (212.0 ± 102.3 vs. 384.0 ± 95.0 repetitions) compared with Mod-HighVL. Between-group analyses yielded higher efficacy of Low-ModVL over Mod-HighVL to increase performance against low (ES = 0.31, p = 0.01) and moderate/high loads (ES = 0.21, p = 0.07). Within-group analyses revealed superior effects after training using Low-ModVL thresholds in all strength (Low-ModVL, ES = 0.79–2.39 vs. Mod-HighVL, ES = 0.59–1.91) and athletic (Low-ModVL, ES = 0.35–0.59 vs. Mod-HighVL, ES = 0.05–0.36) parameters. Relationship analyses showed that the adaptations produced decreased as the VL threshold increased, especially for the low loads (R2 = 0.73, p = 0.01), local endurance (R2 = 0.93, p = 0.04), and sprint ability (R2 = 0.61, p = 0.06). These findings prove that low–moderate levels of intra-set fatigue (≤25% VL) are more effective and efficient stimuli than moderate–high levels (> 25% VL) to promote strength and athletic adaptations.

1. Introduction

Resistance training (RT) has been proven as an effective strategy to increase athletic performance [1,2] and health status [3,4]. However, adaptations in response to a given RT program mainly depend on the manipulation of different variables such as the relative intensity [5,6], exercises trained [7], training frequency [8,9], volume [10], or range of motion used [11,12]. In addition to these parameters, effects generated by resistance exercises are modulated by the level of fatigue generated within each training set (i.e., intra-set fatigue). Intra-set fatigue is conditioned by the number of repetitions performed within the set in relation to the maximum number of repetitions that could be completed (i.e., distance to muscle failure) [13,14]. Thus, the closer the set to muscle failure, the higher levels of mechanical and metabolic stress [15,16,17,18]. In turn, these acute stress markers lead to different physiological signals that modulate the direction and magnitude of the training adaptations [19].
On this matter, results found by two systematic review and meta-analysis studies revealed that strength adaptations would be maximized using submaximal levels of intra-set fatigue [9,20]. Nevertheless, the fact that these review studies focused only on a dichotomous question (i.e., to reach muscle failure or not) limits to some extent the practical applications of their findings. For instance, considering that a lifter could perform ~19 repetitions against the 65% of his/her one-repetition maximum (1RM) in the full squat exercise [14], the single instruction based on whether reaching muscle failure or not lacks sufficient concision to accurately program the training stimulus. On the other hand, while the knowledge concerning the influence of intra-set fatigue on strength capacity is limited, no study to date has systematically reviewed the literature to analyze the effects of this training variable on athletic performance. Therefore, it would be of great practical value to clear up the effects produced by the different levels of intra-set fatigue on strength and athletic adaptations, by gathering experimental studies programming this training variable through an accurate and objective methodology.
In the last decade, the velocity loss (VL) approach has been found as the most accurate method to program a target intra-set fatigue [13]. This methodology relies on the monitorization of the progressive decline of the barbell velocity, which is caused by the reduction in the shortening velocity generated by a fatigue status [21,22]. The validity of the VL as an accurate indicator to objectively assess the neuromuscular fatigue incurred is based on the strong relationship found between intra-set VL and parameters of mechanical and metabolic stress [15]. In general, these relationships proved that the greater the VL reached, the higher the mechanical and metabolic fatigue incurred within the training set.
Therefore, considering the more accurate information provided by the VL approach over traditional methodologies used to set intra-set fatigue, this study aimed to systematically review the scientific evidence examining the effects of the different VL thresholds during RT on strength and athletic adaptations.

2. Materials and Methods

2.1. Registration of Systematic Review Protocol

This systematic review and meta-analysis was conducted according to the Cochrane Handbook for Systematic Reviews of Interventions (version 5.1.0) [23] and the Preferred Reporting Items for Systematic Reviews and Meta-Analyses (PRISMA) statement [24]. Moreover, the original protocol was prospectively registered with the International Prospective Register of Systematic Reviews (PROSPERO) in March 2021 (registration number: CRD42021245530).

2.2. Eligibility Criteria

The PICOS (population, intervention, comparators, outcomes, study design) criteria were used to delimit the inclusion and exclusion criteria.
Participants: No restrictions for gender, socio-economic status, ethnicity, or geographical area were set.
Intervention: RT programs (no duration restriction) based on dynamic resistance exercises performed using a measurable external load were included. Thus, interventions in which the VL was incurred through other types of exercises (e.g., endurance or sled training) were excluded.
Comparators: The VL threshold was considered as the main independent variable. Eligible investigations should have described the VL threshold used by each experimental group throughout the training program (e.g., Group A = 10% VL vs. Group B = 30% VL). Studies in which the VL threshold was not the only training variable differencing the experimental groups were excluded. This review only considered those investigations in which the velocity of all repetitions performed throughout the RT program was monitored. Moreover, studies reporting the effect of only one VL threshold were excluded (e.g., 10% VL vs. Control group).
Outcomes: Two main outcomes were considered: (i) changes in muscle strength measured by dynamic, isometric, or isokinetic tests, and (ii) changes in athletic performance evaluated by jump, sprint, agility, or other specific tests.
Study design: The present review considered experimental investigations based on a pre–post design.

2.3. Search Strategy and Study Selection

A search from the earliest record up to and including March 2021 was carried out using the electronic databases Medline, Scopus, and Web of Science (core collection). The following combination of terms was adapted for each database and applied to the title, abstract, and keyword search: (“velocity loss” OR “velocity decline” OR “level of effort” OR “effort index”) AND (“resistance training” OR “resistance exercise*” OR “strength training” OR “strength exercise*” OR “weight training” OR “weight exercise*”) AND (neuromuscular OR functional* OR strength* OR adaptation* OR performance OR jump OR sprint OR “change of direction”). Moreover, the main search process was complemented with a screening of the references and citations of studies included, as well as by fixing alerts on the above-mentioned databases to monitor any eligible study published after the date of the last search (15 March 2021). Records retrieved from the search were imported to Mendeley (v1.19.6, Elsevier, London, UK) and processed in Microsoft Excel 2016 (Microsoft Corporation, Redmond, WA, USA) by A.H.B. After automatic and manual removal of duplicates, two researchers (A.H.B. and J.G.P.) independently screened the titles and abstracts considering eligibility criteria (first-stage screening). Full texts of the remaining studies were subjected to a second-stage screening. Any discrepancy between A.H.B. and J.G.P. during the study selection process was solved by discussion with a third investigator external to the current study (A.M.C.).

2.4. Study Coding and Data Extraction

Two reviewers (A.H.B. and J.G.P.) independently collected the data of studies finally included using standardized forms in Microsoft Excel. Specifically, the following information was extracted from each study: identification information (authors and year of publication), sample characteristics (size, sex, and initial relative strength ratio (1RM/Body mass, RSR)), configuration of the RT program (VL programmed and actually incurred, total volume, training velocity, load used, exercises trained, duration, and frequency), dependent variables of interest (strength and athletic outcomes), and the evaluation methodologies (e.g., 1RM, sprint, or countermovement jump). For the quantitative analyses (meta-analysis), the group size, mean pre–post differences, and standard deviations (SD) of the dependent variables of interest were collected. The corresponding author was contacted to provide missing data when necessary. Considering the definition of the VL term (progressive decline of barbell velocity across repetitions within the set [13]), only data from those experimental groups that incurred a VL equal to or higher than 1% (i.e., performing at least two repetitions pet set) were analyzed. To achieve a minimum of five comparators for each outcome [25] in the between- and within-group analyses, individual VL thresholds (e.g., 10%, 15%, or 20%) from included studies were categorized as low–moderate VL (Low-ModVL, ≤ 25% VL) and moderate–high VL (Mod-HighVL, > 25% VL). Previous investigations on the topic found that a 25% VL corresponds to completing about half of the total number of repetitions that could be performed in the training set during both upper- and lower-limb resistance exercises [14,26].

2.5. Methodological Quality Assessment

Methodological quality was evaluated independently by two reviewers (A.H.B. and J.G.P.) using The Physiotherapy Evidence Database (PEDro) scale. This scale is composed of 11 items encompassing external validity (item 1), internal validity (items 2 to 9), and statistical reporting (items 10 and 11) [27]. Nevertheless, according to the PEDro guidelines, the first item of this scale should not be used to calculate the total score. Therefore, authors used this tool as a scale from 0 to 10, rating the score as: <4 (poor quality), 4–5 (fair quality), 6–8 (good quality), and >8 (excellent quality) [28]. Only good- to excellent-quality studies (minimum score of 6) were included in the current review. Any discrepancy between A.H.B. and J.G.P. during the assessment of the methodological quality was solved by discussion with a third investigator external to the current study (A.M.C.). The Kappa coefficient was used to examine inter-rater agreement during the methodological quality assessment.

2.6. Statistical Analysis

2.6.1. Structure of the Comparisons

Between-group comparisons were used to analyze the VL threshold as a categorical variable (Low-ModVL vs. Mod-HighVL). Thus, experimental groups that trained using a VL threshold of 25% or lower (Low-ModVL) were compared with those that trained using a VL threshold over 25% (Mod-HighVL). This categorical analysis was complemented by within-group comparisons, for which the pre–post training effects of the individual VL thresholds that included either Low-ModVL or Mod-HighVL were computed to obtain an effect size (ES) for each group. Moreover, the VL threshold was studied as a continuous variable. For that, the coefficient of determination (R2) was used to examine the relationship between each individual VL threshold (e.g., 10%, 15%, or 20%) and its respective ES in each outcome. A minimum of two experimental groups (k ≥ 2) [23] using the same individual VL threshold was required to include it in the relationship analysis. On the other hand, the characteristics of the RT programs conducted by both VL groups were compared using a t-test.

2.6.2. Main Procedures and Statistics

The inverse-variance method (random-effect model) was used to compute the standardized ES and the respective 95% confidence interval (95% CI). The ES was calculated from mean pre–post differences and adjusted for small sample bias [29]. In the between-group analyses, the sign of the ES indicated which group was favored by the comparison (i.e., Low-ModVL or Mod-HighVL), and not the direction of the change (i.e., increase or decrease in performance). For the sprint outcome, the higher the ES the greater the decrease in time. The ES magnitude was considered significant at p ≤ 0.05 and rated as: small (0.20–0.49), moderate (0.50–0.79), or large (≥ 0.80) [30]. The heterogeneity of results across studies was evaluated using the I2 and the significance of the Chi-square (X2, p ≤ 0.05). The I2 was interpreted as: small (I2 < 25%), moderate (I2 = 25–50%), or high (I2 > 50%). As recommended by the Cochrane guidelines [23], the analysis of the publication bias was not performed due to the reduced number of comparisons included in some outcomes and the similar size between them. Analyses were executed using the RevMan software (version 5.4.1).

3. Results

3.1. Search Results

The initial search yielded 164 studies from the electronic databases and one from the reference lists of the included studies. Another investigation was identified from the alerts established on the databases. Therefore, a total of 166 studies were initially examined (Figure 1). After removing duplicates, 81 titles and abstracts were screened, resulting in 21 potentially eligible full texts. Finally, 10 investigations met the eligibility criteria and so were considered for the qualitative and quantitative analyses [31,32,33,34,35,36,37,38,39,40].

3.2. Characteristics of Included Studies

The results of the methodological quality assessment are presented in Table 1. Inter-rater agreement for the methodological quality evaluation process was perfect (Kappa coefficient = 1.00). In summary, the 10 studies obtained a minimum score of 6, so all of them were finally considered.
On the other hand, Table 2 shows the characteristics of the 10 studies (n = 308 participants, k = 24 groups) finally included in the analysis. All RT interventions were conducted on male-only samples. The initial RSR of participants was 1.3 kg·kg−1 (range 1.2–1.4 kg·kg−1) for the lower limb, and 1.1 kg·kg−1 (range 0.9–1.5 kg·kg−1) for the upper limb. All training programs included a single resistance exercise. Specifically, seven studies trained the back squat [31,32,34,35,37,38,40], two the bench press [36,39], and one the push-up [33]. VL ranged from 5% to 50%, with 10% and 30% being the most common VL thresholds (k = 4). Except for one study using the body mass as resistance (no additional external load) [33], relative load ranged from 50% to 85% 1RM. The average duration and frequency of the RT programs were 7.4 weeks (range 5–8 weeks) and 2.2 sessions/week (range 2–3 sessions/week), respectively. Changes in dynamic strength were evaluated using the 1RM (n = 10) [31,32,33,34,35,36,37,38,39,40], and the changes in velocity against (i) absolute loads lifted faster than 1.00 m·s−1 (squat) and 0.80 m·s−1 (bench press) at pre-training (i.e., low loads, n = 8) [31,32,34,35,36,38,39,40], and (ii) absolute loads lifted slower than 1.00 m·s−1 (squat) and 0.80 m·s−1 (bench press) at pre-training (i.e., moderate/high loads, n = 8) [31,32,34,35,36,38,39,40]. Five studies performed a local endurance test [31,32,33,34,35,36,40]. Athletic performance was examined through the sprint and jump abilities in seven studies [31,32,34,35,37,38,40].
Characteristics of the sample and RT programs conducted by Low-ModVL and Mod-HighVL groups are detailed in Table 3. The Low-ModVL group trained using a significantly (p ≤ 0.001) lower VL (16.1 ± 6.2% vs. 39.8 ± 9.0%) and volume (212.0 ± 102.3 repetitions vs. 384.0 ± 95.0 repetitions) compared with Mod-HighVL. Moreover, although not significant (p = 0.08), the Low-ModVL group trained at a faster velocity (0.73 ± 0.18 m·s−1 vs. 0.61 ± 0.16 m·s−1).

3.3. Muscular Strength

Between-group analysis showed that Low-ModVL produced a greater effect on moderate/high loads (ES = 0.21, p = 0.07, Figure 2) and low loads (ES = 0.31, p = 0.01, Figure 3) compared with Mod-HighVL. No large between-group differences were found in 1RM (ES = 0.07, p = 0.50, Figure 4) and local endurance (ES = 0.02, p = 0.85, Figure 5). Within-group analyses revealed a superior efficacy of the Low-ModVL (ES = 0.79–2.39) over the Mod-HighVL (ES = 0.59–1.91) to increase all strength variables (Table 4). The ES decreased as the VL threshold increased (Figure 6), especially for the low loads (R2 = 0.73, p = 0.01, Figure 6C) and local endurance (R2 = 0.93, p = 0.04, Figure 6D).

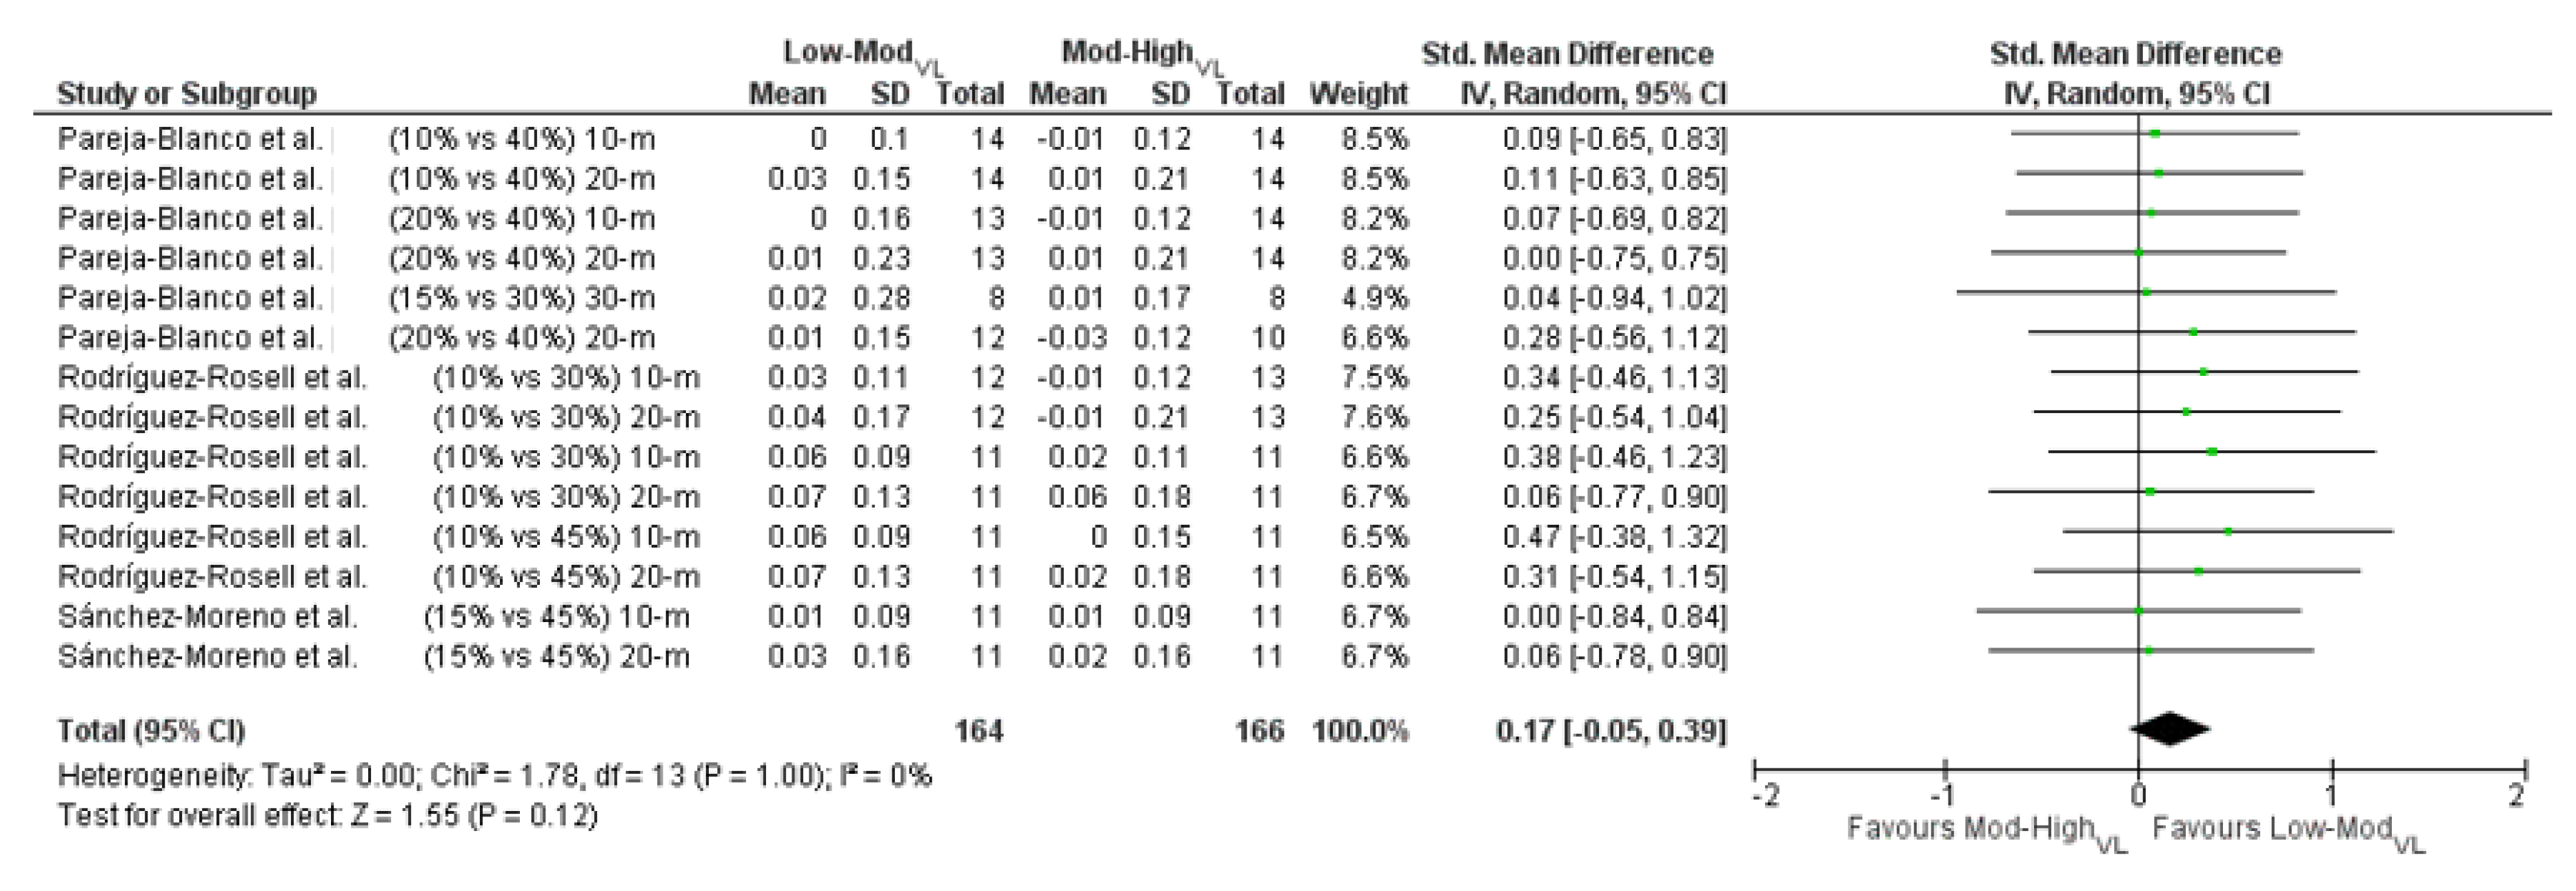
3.4. Athletic Performance

Between-group analysis showed that the Low-ModVL group produced a greater effect on sprint (ES = 0.17, p = 0.12, Figure 7) and jump (ES = 0.18, p = 0.23, Figure 8) abilities compared with Mod-HighVL. Similarly, within-group analyses revealed a superior efficacy of the Low-ModVL group to increase sprint (Low-ModVL, ES = 0.35, p = 0.001; Mod-HighVL, ES = 0.05, p = 0.67) and jump (Low-ModVL, ES = 0.59, p < 0.0001; Mod-HighVL, ES = 0.36, p = 0.03) (Table 4). The ES decreased as the VL threshold increased, especially for the sprint ability (R2 = 0.61, p = 0.06, Figure 6E).

4. Discussion

The present systematic review with meta-analysis found that low–moderate levels of intra-set fatigue (≤25% intra-set VL) are more effective and efficient stimuli than moderate–high levels (>25% intra-set VL) to promote strength and athletic adaptations. In practice, these findings can provide coaches and athletes concise information to program intra-set fatigue during RT that goes beyond whether to reach muscle failure or not.

4.1. Muscle Strength

The present research revealed that Low-ModVL thresholds produced higher increments in muscle strength than Mod-HighVL, especially at submaximal loads (Figure 2 and Figure 3). On the other hand, although within-group analysis showed that 1RM and local muscle endurance could also be favored by Low-ModVL thresholds (Table 4), no large between-group differences were found concerning these variables (Figure 4 and Figure 5). These findings offer a wide view of the adaptative effects across the force–velocity relationship produced by different levels of intra-set fatigue during RT programs. To date, most interventions examining this aspect included the 1RM as the single variable to evaluate changes in dynamic strength [9,20]. Nevertheless, the 1RM only informs about an individual point within the force–velocity relationship, which corresponds to the force applied to the maximal absolute load the athlete could lift once [41]. Hence, this parameter lacks information about the ability of the athlete to exert force to the other loads included within the force–velocity spectrum, especially to those he has to deal with on the field/track. Thus, the information provided by the 1RM can be complemented by analyzing pre–post changes in barbell velocity [42], which in turn would reflect the changes in the levels of force applied [43]. In this regard, we found that, although the effectiveness to increase the 1RM did not largely differ between VL groups (Figure 4), performance at sub-maximal loads (i.e., low loads: ≤60% 1RM; moderate/high loads: >60% 1RM) were maximized by Low-ModVL thresholds (Figure 2 and Figure 3, Table 4). In particular, all between-group comparisons examining changes at low loads favored the Low-ModVL group. Representing these results on a force–velocity curve (force = X-axis; velocity = Y-axis), a greater upward shift of this curve (especially at its medial and distal sections) was generated after training using low–moderate levels of intra-set fatigue. In practice, this fact suggests that those sports actions whose performance directly depends on the force (and so velocity) applied to the weight of the athlete (e.g., jumps, sprints, changes of direction) or of an object (e.g., ball or javelin) would benefit from using Low-ModVL thresholds during RT.
On the other hand, contrary to traditional beliefs supporting that higher training volume would produce greater enhancements in local muscle endurance [44], this review did not find large differences between Low-ModVL and Mod-HighVL thresholds to improve this capacity (Figure 5). Indeed, the within-group analysis showed superior effectiveness of Low-ModVL thresholds (ES = 1.50 vs. 1.14, Table 4). Among other factors, this finding could be explained by the slightly higher increments in the 1RM achieved by the Low-ModVL group (Table 4). As has been found by previous studies [34,40], changes in local muscle endurance are mainly related to the changes in 1RM (r = 0.63 to 0.71, p < 0.05). As the athletes increase their 1RM, the absolute load (kg) used during the local endurance test represents a lower relative load (i.e., a lower %1RM), thus allowing them to complete a higher number of repetitions [14,26].

4.2. Athletic Performance

Superior efficacy of Low-ModVL thresholds to increase sprint and jump performance was found. Indeed, all between-group comparisons favored the Low-ModVL group for the sprint (Figure 7), whereas only one favored the Mod-HighVL for the jump (Figure 8). Moreover, the within-group comparison showed a non-significant effect of the Mod-HighVL group to improve the sprint performance. The relationship analysis, for its part, found that changes in athletic performance decreased as the VL threshold increased, especially for the sprint capacity (Figure 6E). It is worth noting that, except for the study conducted by Galiano et al. [32] which executed sprint and jump repetitions in each training session, most participants included in the other studies changed their performance in these athletic abilities without specific training. This fact reinforces the great capacity of RT to generate a direct transference on sports abilities [45,46]. Nevertheless, our results revealed that the magnitude and direction of this transference are dependent on the levels of intra-set fatigue generated throughout the training program. In particular, we found that Mod-HighVL thresholds not only generated lower positive adaptations than Low-ModVL on sprint and jump performance, but they even produced detrimental effects on these physical abilities [34,35,37,38]. Therefore, these results suggest that coaches and physical trainers of those sports with a high frequency of sprint and jump actions (e.g., soccer, basketball, handball, rugby, or athletics) should be cautious with the level of intra-set fatigue programmed for athletes in each RT session.

4.3. Physiological Mechanisms behind These Results

The different levels of mechanics and metabolic markers produced as intra-set VL increased [15] stimulate diverse physiological pathways that could explain the results found by the current study. For instance, although the α-motor neuron innervating each muscle fiber appears to be the main determinant of its initial typology (i.e., I, IIA, or IIX) [47], this fiber phenotype could be modified to some extent by training factors such as intra-set fatigue [48]. In this regard, Pareja-Blanco et al. [38] found that an RT program based on 40% VL reduced the percentage of IIX fiber type by almost half. Similarly, other investigations revealed that training to muscle failure would promote IIX to IIA fiber transition [49,50,51,52]. Although more research including molecular mechanisms is needed, a recent study found that incurring high intra-set fatigue (40% VL) throughout an RT program increased the Thr287-CaMKII δD phosphorylation levels, which in turn was negatively associated (r = −0.72, p < 0.001) with the IIX fiber type expression [19]. Therefore, considering the key influence of IIX fibers type on the capacity to apply force quickly (i.e., rate of force development) [49,53], the above-mentioned transition of muscle fibers towards a slower phenotype could explain the lower, even detrimental effects of the moderate–high levels of intra-set fatigue on high-velocity actions (sprints, jumps, and low loads).
Another aspect that could be behind these results is related to the higher levels of blood ammonia generated when a moderate–high VL is incurred. Sánchez-Medina and González-Badillo [15] found a very close relationship (R2 ≥ 0.86) between intra-set VL and the acute levels of blood ammonia. In particular, these authors reported that blood ammonia exponentially increases above resting levels when intra-set VL exceeds 30% and 40% in squat and bench press exercises, respectively [15]. In turn, the continuous exposition to high levels of blood ammonia and its associated pathways (purine cycle) could have decreased the intra-muscular adenine nucleotide content [54,55] in the athletes that trained using Mod-HighVL thresholds.

4.4. Efficiency

Interestingly, the Low-ModVL group produced superior enhancements in strength and athletic performance, even conducting a significantly (p ≤ 0.001) lower total volume throughout the RT program. Specifically, the number of repetitions performed by the Low-ModVL group was ~45% lower (172 repetitions) than that conducted by the Mod-HighVL (Table 3). Thus, in addition to being more effective, Low-ModVL thresholds represent more efficient stimuli than Mod-HighVL. This interpretation agrees with that derived from the meta-analyses conducted by Grgic et al. [9] and Vieira et al. [20] in which the non-failure group showed significantly superior strength improvements, even performing less training volume. It is worth noting that, except in powerlifting and weightlifting, RT is commonly incorporated as a complement to the field- or track-specific training [47,48]. Therefore, considering the findings shown by the current review, practitioners would benefit from RT programs based on low–moderate levels of intra-set fatigue (≤ 25% VL), since they produce higher performance improvements at a lower time and fatigue [16,18,56] cost.

4.5. Strengths and Limitations of This Study

To the best of our knowledge, no study to date has qualitatively and quantitatively examined the efficacy and efficiency of the different VL thresholds for improving strength and athletic adaptations. Importantly, all investigations included were monitored using velocity, which reinforces the isolation of the independent variable under study (intra-set VL, and so intra-set fatigue). Specifically, this methodology ensures that all participants included in the different VL groups: (i) trained at an identical relative load (i.e., %1RM) throughout the RT program regardless of the changes in neuromuscular performance or motivation state [38], and (ii) incurred the programmed intra-set fatigue even if they performed a different number of repetitions within the set [26]. Moreover, the fact that no between-or within-group analyses showed a significant (p < 0.05) heterogeneity would strengthen the findings of the present research.
On the other hand, this research is not exempt from limitations. Firstly, all the studies included male-only samples, so the knowledge on the strength and athletic adaptations produced by the different VL thresholds should be extended to the female population. Secondly, a reduced range of exercises was examined. On this matter, although squat and bench press represent two of the main multi-joint exercises used in RT routines, it would be of great practical value to amplify these analyses to other upper- (e.g., prone bench pull or shoulder press) and lower-limb (e.g., hip thrust or deadlift) exercises. Thirdly, the similarities between studies in terms of the subject’s RSR (range 0.9–1.5 kg·kg−1), duration (range 5–8 weeks), or training frequency (2–3 sessions/week) limited the implementation of meta-regression analyses to examine the possible influence of these parameters on our findings. Finally, only sprint and jump abilities were examined as parameters of athletic performance, so future studies are encouraged to include other sports abilities such as throws, changes of direction, or other specific tests (e.g., Wingate test).

5. Conclusions

The present systematic review with meta-analysis found that low–moderate levels of intra-set fatigue (≤25% intra-set VL) are more effective and efficient stimuli than moderate–high levels (>25% intra-set VL) to promote strength and athletic adaptations. These findings provide accurate information to set a target intra-set fatigue during RT that goes beyond whether to reach muscle failure or not. In practice, coaches and athletes who do not have a velocity monitoring device can implement our findings using the “level of effort” or the “repetitions in reserve” methodologies [14]. For instance, practitioners could maximize the efficacy and efficiency of the RT stimulus by performing half or less of the total repetitions possible in the set, which would correspond to reaching about ≤25% of intra-set VL.

Author Contributions

Conceptualization, A.H.-B. and J.G.P.; methodology, A.H.-B. and J.G.P.; formal analysis, A.H.-B. and J.G.P.; data curation, A.H.-B. and J.G.P.; writing—original draft preparation, A.H.-B. and J.G.P.; writing—review and editing, A.H.-B. and J.G.P.; supervision, J.G.P. All authors have read and agreed to the published version of the manuscript.

Funding

This research received no external funding.

Institutional Review Board Statement

Not applicable.

Informed Consent Statement

Not applicable.

Data Availability Statement

The data presented in this study are available on request from the corresponding author.

Conflicts of Interest

The authors declare no conflict of interest.

References

  1. Suchomel, T.J.; Nimphius, S.; Stone, M.H. The importance of muscular strength in athletic performance. Sports Med. 2016, 46, 1419–1449. [Google Scholar] [CrossRef] [PubMed]
  2. Seitz, L.B.; Reyes, A.; Tran, T.T.; de Villarreal, E.S.; Haff, G.G. Increases in lower-body strength transfer positively to sprint performance: A systematic review with meta-analysis. Sports Med. 2014, 44, 1693–1702. [Google Scholar] [CrossRef] [PubMed]
  3. Westcott, W.L. Resistance training is medicine: Effects of strength training on health. Curr. Sports Med. Rep. 2012, 11, 209–216. [Google Scholar] [CrossRef] [PubMed]
  4. El-Kotob, R.; Ponzano, M.; Chaput, J.P.; Janssen, I.; Kho, M.E.; Poitras, V.J.; Ross, R.; Ross-White, A.; Saunders, T.J.; Giangregorio, L.M. Resistance training and health in adults: An overview of systematic reviews. Appl. Physiol. Nutr. Metab. 2020, 45, S165–S179. [Google Scholar] [CrossRef]
  5. Csapo, R.; Alegre, L.M. Effects of resistance training with moderate vs. heavy loads on muscle mass and strength in the elderly: A meta-analysis. Scand. J. Med. Sci. Sports 2016, 26, 995–1006. [Google Scholar] [CrossRef]
  6. Lopez, P.; Radaelli, R.; Taaffe, D.R.; Newton, R.U.; Galvão, D.A.; Trajano, G.S.; Teodoro, J.L.; Kraemer, W.J.; Häkkinen, K.; Pinto, R.S. Resistance training load effects on muscle hypertrophy and strength gain: Systematic review and network meta-analysis. Med. Sci. Sport Exerc. 2020, 53, 1206–1216. [Google Scholar] [CrossRef]
  7. Gentil, P.; Fisher, J.; Steele, J. A review of the acute effects and long-term adaptations of single- and multi-joint exercises during resistance training. Sports Med. 2017, 47, 843–855. [Google Scholar] [CrossRef]
  8. Ralston, G.W.; Kilgore, L.; Wyatt, F.B.; Buchan, D.; Baker, J.S. Weekly training frequency effects on strength gain: A meta-analysis. Sports Med. Open 2018, 4, 1–24. [Google Scholar] [CrossRef]
  9. Grgic, J.; Schoenfeld, B.J.; Davies, T.B.; Lazinica, B.; Krieger, J.W.; Pedisic, Z. Effect of resistance training frequency on gains in muscular strength: A systematic review and meta-analysis. Sports Med. 2018, 48, 1207–1220. [Google Scholar] [CrossRef]
  10. Schoenfeld, B.J.; Ogborn, D.; Krieger, J.W. Dose-response relationship between weekly resistance training volume and increases in muscle mass: A systematic review and meta-analysis. J. Sports Sci. 2017, 35, 1073–1082. [Google Scholar] [CrossRef]
  11. Pallarés, J.G.; Martínez-Cava, A.; Courel-Ibáñez, J.; González-Badillo, J.J.; Morán-Navarro, R. Full squat produces greater neuromuscular and functional adaptations and lower pain than partial squats after prolonged resistance training. Eur. J. Sport. Sci. 2020, 20, 115–124. [Google Scholar] [CrossRef] [PubMed]
  12. Martínez-Cava, A.; Hernández-Belmonte, A.; Courel-Ibáñez, J.; Morán-Navarro, R.; González-Badillo, J.J.; Pallarés, J.G. Bench press at full range of motion produces greater neuromuscular adaptations than partial executions after prolonged resistance training. J. Strength Cond. Res. 2022, 36, 10–15. [Google Scholar] [CrossRef]
  13. González-Badillo, J.J.; Yañez-García, J.M.; Mora-Custodio, R.; Rodríguez-Rosell, D. Velocity loss as a variable for monitoring resistance exercise. Int. J. Sports Med. 2017, 38, 217–225. [Google Scholar] [CrossRef] [PubMed]
  14. Hernández-Belmonte, A.; Courel-Ibáñez, J.; Conesa-Ros, E.; Martínez-Cava, A.; Pallarés, J.G. Level of effort: A reliable and practical alternative to the velocity-based approach for monitoring resistance training. J. Strength Cond. Res. 2021. [Google Scholar] [CrossRef] [PubMed]
  15. Sánchez-Medina, L.; González-Badillo, J.J. Velocity loss as an indicator of neuromuscular fatigue during resistance training. Med. Sci. Sports Exerc. 2011, 43, 1725–1734. [Google Scholar] [CrossRef] [PubMed]
  16. Pareja-Blanco, F.; Rodríguez-Rosell, D.; Sánchez-Medina, L.; Ribas-Serna, J.; López-López, C.; Mora-Custodio, R.; Yáñez-García, J.M.; González-Badillo, J.J. Acute and delayed response to resistance exercise leading or not leading to muscle failure. Clin. Physiol. Funct. Imaging 2017, 37, 630–639. [Google Scholar] [CrossRef]
  17. Morán-Navarro, R.; Pérez, C.E.; Mora-Rodríguez, R.; de la Cruz-Sánchez, E.; González-Badillo, J.J.; Sánchez-Medina, L.; Pallarés, J.G. Time course of recovery following resistance training leading or not to failure. Eur. J. Appl. Physiol. 2017, 117, 2387–2399. [Google Scholar] [CrossRef]
  18. González-Badillo, J.J.; Rodríguez-Rosell, D.; Sánchez-Medina, L.; Ribas, J.; López-López, C.; Mora-Custodio, R.; Yañez-García, J.M.; Pareja-Blanco, F. Short-term recovery following resistance exercise leading or not to failure. Int. J. Sports Med. 2016, 37, 295–304. [Google Scholar] [CrossRef] [Green Version]
  19. Martinez-Canton, M.; Gallego-Selles, A.; Gelabert-Rebato, M.; Martin-Rincon, M.; Pareja-Blanco, F.; Rodriguez-Rosell, D.; Morales-Alamo, D.; Sanchis-Moysi, J.; Dorado, C.; Jose Gonzalez-Badillo, J.; et al. Role of CaMKII and sarcolipin in muscle adaptations to strength training with different levels of fatigue in the set. Scand. J. Med. Sci. Sport 2020, 31, 91–103. [Google Scholar] [CrossRef]
  20. Vieira, A.F.; Umpierre, D.; Teodoro, J.L.; Lisboa, S.C.; Baroni, B.M.; Izquierdo, M.; Cadore, E.L. Effects of resistance training performed to failure or not to failure on muscle strength, hypertrophy, and power output: A systematic review with meta-analysis. J. Strength Cond. Res. 2021, 35, 1165–1175. [Google Scholar] [CrossRef]
  21. Allen, D.G.; Lamb, G.D.; Westerblad, H. Skeletal muscle fatigue: Cellular mechanisms. Physiol. Rev. 2008, 88, 287–332. [Google Scholar] [CrossRef] [PubMed] [Green Version]
  22. Westerblad, H.; Dahlstedt, A.J.; Lännergren, J. Mechanisms underlying reduced maximum shortening velocity during fatigue of intact, single fibres of mouse muscle. J. Physiol. 1998, 510, 269–277. [Google Scholar] [CrossRef] [PubMed]
  23. Higgins, J.P.T.; Green, S. (Eds.) Cochrane Handbook for Systematic Reviews of Interventions Version 5.1.0 [Updated March 2011]. The Cochrane Collaboration. 2015. Available online: www.cochrane-handbook.org (accessed on 27 March 2011).
  24. Page, M.J.; McKenzie, J.E.; Bossuyt, P.M.; Boutron, I.; Hoffmann, T.C.; Mulrow, C.D.; Shamseer, L.; Tetzlaff, J.M.; Akl, E.A.; Brennan, S.E.; et al. The PRISMA 2020 statement: An updated guideline for reporting systematic reviews. Int. J. Surg. 2021, 88, 105906. [Google Scholar] [CrossRef] [PubMed]
  25. Jackson, D.; Turner, R. Power analysis for random-effects meta-analysis. Res. Synth. Methods 2017, 8, 290–302. [Google Scholar] [CrossRef] [PubMed] [Green Version]
  26. Rodríguez-Rosell, D.; Yáñez-García, J.M.; Sánchez-Medina, L.; Mora-Custodio, R.; González-Badillo, J.J. Relationship between velocity loss and repetitions in reserve in the bench press and back squat exercises. J. Strength Cond. Res. 2020, 34, 2537–2547. [Google Scholar] [CrossRef]
  27. Maher, C.G.; Sherrington, C.; Herbert, R.D.; Moseley, A.M.; Elkins, M. Reliability of the PEDro scale for rating quality of randomized controlled trials. Phys. Ther. 2003, 83, 713–721. [Google Scholar] [CrossRef] [Green Version]
  28. Cashin, A.G.; McAuley, J.H. Clinimetrics: Physiotherapy Evidence Database (PEDro) scale. J. Physiother. 2020, 66, 59. [Google Scholar] [CrossRef]
  29. Hedges, L.V. Distribution theory for Glass’s estimator of effect size and related estimators. J. Educ. Stat. 1981, 6, 107–128. [Google Scholar] [CrossRef]
  30. Cohen, J. Statistical Power Analysis for the Behavioral Sciences; Lawrence Erlbaum Associates Inc.: Mahwah, NJ, USA, 1988. [Google Scholar]
  31. Sánchez-Moreno, M.; Rodríguez-Rosell, D.; Díaz-Cueli, D.; Pareja-Blanco, F.; González-Badillo, J.J. Effects of velocity loss threshold within resistance training during concurrent training on endurance and strength performance. Int. J. Sports Physiol. Perform. 2021, 16, 849–857. [Google Scholar] [CrossRef]
  32. Galiano, C.; Pareja-Blanco, F.; Hidalgo de Mora, J.; Sáez de Villarreal, E. Low-velocity loss induces similar strength gains to moderate-velocity loss during resistance training. J. Strength Cond. Res. 2020, 36, 340–345. [Google Scholar] [CrossRef]
  33. Sánchez-Moreno, M.; Cornejo-Daza, P.J.; González-Badillo, J.J.; Pareja-Blanco, F. Effects of velocity loss during body mass prone-grip pull-up training on strength and endurance performance. J. Strength Cond. Res. 2020, 34, 911–917. [Google Scholar] [CrossRef] [PubMed]
  34. Rodríguez-Rosell, D.; Yáñez-García, J.M.; Mora-Custodio, R.; Pareja-Blanco, F.; Ravelo-García, A.G.; Ribas-Serna, J.; González-Badillo, J.J. Velocity-based resistance training: Impact of velocity loss in the set on neuromuscular performance and hormonal response. Appl. Physiol. Nutr. Metab. 2020, 45, 817–828. [Google Scholar] [CrossRef] [PubMed]
  35. Pareja Blanco, F.; Alcazar, J.; Sánchez-Valdepeñas, J.; Cornejo Daza, P.J.; Piqueras Sanchiz, F.; Mora-Vela, R.; Sánchez-Moreno, M.; Bachero-Mena, B.; Ortega-Becerra, M.; Alegre, L.M. Velocity loss as a critical variable determining the adaptations to strength training. Med. Sci. Sports Exerc. 2020, 52, 1752–1762. [Google Scholar] [CrossRef] [PubMed]
  36. Pareja-Blanco, F.; Alcazar, J.; Cornejo-Daza, P.J.; Sánchez-Valdepeñas, J.; Rodriguez-Lopez, C.; Hidalgo-de Mora, J.; Sánchez-Moreno, M.; Bachero-Mena, B.; Alegre, L.M.; Ortega-Becerra, M. Effects of velocity loss in the bench press exercise on strength gains, neuromuscular adaptations, and muscle hypertrophy. Scand. J. Med. Sci. Sport 2020, 30, 2154–2166. [Google Scholar] [CrossRef] [PubMed]
  37. Pareja-Blanco, F.; Sánchez-Medina, L.; Suárez-Arrones, L.; González-Badillo, J.J. Effects of velocity loss during resistance training on performance in professional soccer players. Int. J. Sports Physiol. Perform. 2017, 12, 512–519. [Google Scholar] [CrossRef] [PubMed]
  38. Pareja-Blanco, F.; Rodríguez-Rosell, D.; Sánchez-Medina, L.; Sanchis-Moysi, J.; Dorado, C.; Mora-Custodio, R.; Yáñez-García, J.M.; Morales-Alamo, D.; Pérez-Suárez, I.; Calbet, J.A.; et al. Effects of velocity loss during resistance training on athletic performance, strength gains and muscle adaptations. Scand. J. Med. Sci. Sport 2017, 27, 724–735. [Google Scholar] [CrossRef] [PubMed] [Green Version]
  39. Rodiles-Guerrero, L.; Pareja-Blanco, F.; León-Prados, J.A. Effect of velocity loss on strength performance in bench press using a weight stack machine. Int. J. Sports Med. 2020, 41, 921–928. [Google Scholar] [CrossRef]
  40. Rodríguez-Rosell, D.; Yáñez-García, J.M.; Mora-Custodio, R.; Sánchez-Medina, L.; Ribas-Serna, J.; González-Badillo, J.J. Effect of velocity loss during squat training on neuromuscular performance. Scand. J. Med. Sci. Sports 2021, 31, 1621–1635. [Google Scholar] [CrossRef]
  41. Grgic, J.; Lazinica, B.; Schoenfeld, B.J.; Pedisic, Z. Test–retest reliability of the one-repetition maximum (1RM) strength assessment: A systematic review. Sports Med. Open 2020, 6, 31. [Google Scholar] [CrossRef]
  42. Weakley, J.; Mann, B.; Banyard, H.; McLaren, S.; Scott, T.; García-Ramos, A. Velocity-based training: From theory to application. Strength Cond. J. 2020, 43, 31–49. [Google Scholar] [CrossRef]
  43. González-Badillo, J.J.; Sánchez-Medina, L.; Pareja-Blanco, F.; Rodríguez-Rosell, D. Fundamentals of Velocity-Based Resistance Training; Ergottech: Murcia, Spain, 2014. [Google Scholar]
  44. Bird, S.P.; Tarpenning, K.M.; Marino, F.E. Designing resistance training programmes to enhance muscular fitness: A review of the acute programme variables. Sports Med. 2005, 35, 841–851. [Google Scholar] [CrossRef] [PubMed]
  45. Issurin, V.B. Training transfer: Scientific background and insights for practical application. Sports Med. 2013, 43, 675–694. [Google Scholar] [CrossRef] [PubMed]
  46. Young, W.B. Transfer of strength and power training to sports performance. Int. J. Sports Physiol. Perform. 2006, 1, 74–83. [Google Scholar] [CrossRef] [PubMed] [Green Version]
  47. Buller, A.J.; Eccles, J.C.; Eccles, R.M. Interactions between motoneurones and muscles in respect of the characteristic speeds of their responses. J. Physiol. 1960, 150, 417–439. [Google Scholar] [CrossRef]
  48. Fry, A.C. The role of resistance exercise intensity on muscle fibre adaptations. Sports Med. 2004, 34, 663–679. [Google Scholar] [CrossRef]
  49. Andersen, L.L.; Andersen, J.L.; Zebis, M.K.; Aagaard, P. Early and late rate of force development: Differential adaptive responses to resistance training? Scand. J. Med. Sci. Sport 2010, 20, 162–169. [Google Scholar] [CrossRef]
  50. Andersen, J.L.; Aagaard, P. Myosin heavy chain IIX overshoot in human skeletal muscle. Muscle Nerve 2000, 23, 1095–1104. [Google Scholar] [CrossRef]
  51. Campos, G.E.; Luecke, T.J.; Wendeln, H.K.; Toma, K.; Hagerman, F.C.; Murray, T.F.; Ragg, K.E.; Ratamess, N.A.; Kraemer, W.J.; Staron, R.S. Muscular adaptations in response to three different resistance-training regimens: Specificity of repetition maximum training zones. Eur. J. Appl. Physiol. 2002, 88, 50–60. [Google Scholar] [CrossRef]
  52. Staron, R.S.; Karapondo, D.L.; Kraemer, W.J.; Fry, A.C.; Gordon, S.E.; Falkel, J.E.; Hagerman, F.C.; Hikida, R.S. Skeletal muscle adaptations during early phase of heavy-resistance training in men and women. J. Appl. Physiol. 1994, 76, 1247–1255. [Google Scholar] [CrossRef]
  53. Harridge, S.D.; Bottinelli, R.; Canepari, M.; Pellegrino, M.A.; Reggiani, C.; Esbjörnsson, M.; Saltin, B. Whole-muscle and single-fibre contractile properties and myosin heavy chain isoforms in humans. Pflügers Archiv 1996, 432, 913–920. [Google Scholar] [CrossRef]
  54. Hellsten-Westing, Y.; Norman, B.; Balsom, P.D.; Sjodin, B. Decreased resting levels of adenine nucleotides in human skeletal muscle after high-intensity training. J. Appl. Physiol. 1993, 74, 2523–2528. [Google Scholar] [CrossRef] [PubMed]
  55. Stathis, C.G.; Febbraio, M.A.; Carey, M.F.; Snow, R.J. Influence of sprint training on human skeletal muscle purine nucleotide metabolism. J. Appl. Physiol. 1994, 76, 1802–1809. [Google Scholar] [CrossRef] [PubMed]
  56. Teixeira, J.E.; Forte, P.; Ferraz, R.; Leal, M.; Ribeiro, J.; Silva, A.J.; Barbosa, T.M.; Monteiro, A.M. Monitoring accumulated training and match load in football: A systematic review. Int. J. Environ. Res. Public Health 2021, 18, 3906. [Google Scholar] [CrossRef] [PubMed]
Figure 1. Flowchart illustrating the different phases of the search and study selection. RT: resistance training; VL: velocity loss; n: number.
Applsci 12 04425 g001
Figure 2. Between-group analysis comparing the effects of Low-ModVL (≤25% intra-set VL) and Mod-HighVL (>25% intra-set VL) to promote changes at moderate/high loads (absolute loads lifted slower than 1.00 m·s−1 and 0.80 m·s−1 at pre-training in the squat and bench press exercises, respectively, >60% 1RM [35,36]). Green squares: ES for each individual comparison; Black diamond: pooled ESs. Sánchez-Moreno et al. [31]; Pareja-Blanco et al. [35,36,38]; Rodiles-Guerrero et al. [39]; Rodríguez-Rosell et al. [34,40].
Applsci 12 04425 g002
Figure 3. Between-group analysis comparing the effects of Low-ModVL (≤25% intra-set VL) and Mod-HighVL (>25% intra-set VL) to promote changes at low loads (absolute loads lifted faster than 1.00 m·s−1 and 0.80 m·s−1 at pre-training in the squat and bench press exercises, respectively, ≤ 60% 1RM [35,36]). Green squares: ES for each individual comparison; Black diamond: pooled ESs. Sánchez-Moreno et al. [31]; Pareja-Blanco et al. [35,36,38]; Rodiles-Guerrero et al. [39]; Rodríguez-Rosell et al. [34,40].
Applsci 12 04425 g003
Figure 4. Between-group analysis comparing the effects of Low-ModVL (≤25% intra-set VL) and Mod-HighVL (>25% intra-set VL) to promote changes in 1RM. Green squares: ES for each individual comparison; Black diamond: pooled ESs. Sánchez-Moreno et al. [31,33]; Pareja-Blanco et al. [35,36,37,38]; Rodiles-Guerrero et al. [39]; Rodríguez-Rosell et al. [34,40].
Applsci 12 04425 g004
Figure 5. Between-group analysis comparing the effects of Low-ModVL (≤25% intra-set VL) and Mod-HighVL (>25% intra-set VL) to promote changes in local muscle endurance. Green squares: ES for each individual comparison; Black diamond: pooled ESs. Sánchez-Moreno et al. [31]; Pareja-Blanco et al. [35,36]; Rodríguez-Rosell et al. [34,40].
Applsci 12 04425 g005
Figure 6. Bubble plots showing the relationship between individual VL thresholds and their respective effect size (ES) in each outcome. The size (area) of the bubbles represents the number of experimental groups (k) included in each VL threshold. A minimum of two groups (k ≥ 2) training the same individual VL threshold was required to include it in the relationship analysis.
Applsci 12 04425 g006
Figure 7. Between-group analysis comparing the effects of Low-ModVL (≤25% intra-set VL) and Mod-HighVL (>25% intra-set VL) to promote changes in sprint capacity. Green squares: ES for each individual comparison; Black diamond: pooled ESs. Sánchez-Moreno et al. [31]; Pareja-Blanco et al. [35,37,38]; Rodríguez-Rosell et al. [34,40].
Applsci 12 04425 g007
Figure 8. Between-group analysis comparing the effects of Low-ModVL (≤25% intra-set VL) and Mod-HighVL (>25% intra-set VL) to promote changes in jump capacity. Green squares: ES for each individual comparison; Black diamond: pooled ESs. Sánchez-Moreno et al. [31]; Pareja-Blanco et al. [35,37,38]; Rodríguez-Rosell et al. [34,40].
Applsci 12 04425 g008
Table 1. Results of the PEDro scale showing the risk of bias in potential studies.
StudyItem
1 *234567891011Total
Galiano et al. [32]010100011116
Pareja-Blanco et al. [35]010100011116
Pareja-Blanco et al. [36]010100011116
Pareja-Blanco et al. [37]010100011116
Pareja-Blanco et al. [38]010100011116
Rodiles-Guerrero et al. [39]010100011116
Rodríguez-Rosell et al. [34]110100011116
Rodríguez-Rosell et al. [40]110100011116
Sánchez-Moreno et al. [31]010100011116
Sánchez-Moreno et al. [33]010100011116
* According to the PEDro guidelines, the item 1 was not considered to calculate the total score.
Table 2. Characteristics of the included studies.
StudySampleResistance Training ProgramOutcomes
Size
(Initial RSR)
VL Actually
Incurred (%)
Total Volume
(reps)
Training
Velocity (m·s−1)
Load
(%1RM)
ExerciseDuration/
Frequency
StrengthAthletic
Galiano et al. [32]5%: 15 (1.4)
20%: 13 (1.3)
5%: 5.6 ± 0.6
20%: 20.1 ± 0.4
5%: 156.9 ± 25.0
20%: 480.5 ± 162.0
5%: 1.08 ± 0.03
20%: 0.92 ± 0.02
50Squat7 wk
2 sess/wk
1RM
Low loads
Mod/high loads
Sprint (20 m)
Jump (CMJ)
Pareja-Blanco et al. [37] 15%: 8 (1.3)
30%: 8 (1.3)
15%: 16.3 ± 1.3
30%: 28.6 ± 1.8
15%: 251.2 ± 55.4
30%: 414.6 ± 124.9
15%: 0.91 ± 0.01
30%: 0.84 ± 0.02
50–70Squat6 wk
3 sess/wk
1RMSprint (30 m)
Jump (CMJ)
Pareja-Blanco et al. [38]20%: 12 (1.4)
40%: 10 (1.4)
20%: 20.4 ± 1.5
40%: 41.9 ± 1.9
20%: 185.9 ± 22.2
40%: 310.5 ± 42.0
20%: 0.69 ± 0.02
40%: 0.58 ± 0.03
70–85Squat8 wk
2 sess/wk
1RM
Low loads
Mod/high loads
Sprint (20 m)
Jump (CMJ)
Pareja-Blanco et al. [35]10%: 14 (1.3)
20%: 13 (1.3)
40%: 14 (1.3)
10%: 10.6 ± 0.9
20%: 20.3 ± 1.5
40%: 41.9 ± 1.4
10%: 143.6 ± 40.2
20%: 168.5 ± 47.4
40%: 305.6 ± 81.7
10%: 0.71 ± 0.07
20%: 0.64 ± 0.06
40%: 0.58 ± 0.06
70–85Squat8 wk
2 sess/wk
1RM
Low loads
Mod/high loads
Local endurance
Sprint (20 m)
Jump (CMJ)
Pareja-Blanco et al. [36]15%: 16 (0.9)
25%: 15 (0.9)
50%: 16 (0.9)
15%: 16.3 ± 0.8
25%: 25.0 ± 0.7
50%: 51.9 ± 1.6
15%: 136.6 ± 17.8
25%: 191.1 ± 34.1
50%: 316.4 ± 65.1
15%: 0.52 ± 0.05
25%: 0.50 ± 0.07
50%: 0.40 ± 0.05
70–85Bench press8 wk
2 sess/wk
1RM
Low loads
Mod/high loads
Local endurance
-
Rodiles-Guerrero et al. [39]10%: 15 (1.0)
30%: 15 (1.1)
50%: 15 (1.0)
10%: 10.0
30%: 29.6
50%: 49.3
10%: 211.1 ± 17.3
30%: 398.1 ± 61.4
50%: 444.4 ± 51.9
10%: 0.50 ± 0.01
30%: 0.45 ± 0.01
50%: 0.37 ± 0.01
65–85Bench press5 wk
3 sess/wk
1RM
Low loads
Mod/high loads
-
Rodríguez-Rosell et al. [34]10%: 12 (1.3)
30%: 13 (1.3)
10%: 10.9 ± 0.8
30%: 29.4 ± 1.3
10%: 109.6 ± 12.0
30%: 228.0 ± 76.6
10%: 0.70 ± 0.01
30%: 0.63 ± 0.01
70–85Squat8 wk
2 sess/wk
1RM
Low loads
Mod/high loads
Local endurance
Sprint (10 m)
Sprint (20 m)
Jump (CMJ)
Rodríguez-Rosell et al. [40]10%: 11 (1.4)
30%: 11 (1.3)
45%: 11 (1.3)
10%: 10.9 ± 1.8
30%: 29.8 ± 3.6
45%: 42.1 ± 7.0
10%: 180.8 ± 29.0
30%: 347.9 ± 62.3
45%: 501 ± 106.8
10%: 0.91 ± 0.10
30%: 0.83 ± 0.13
45%: 0.76 ± 0.16
55–70Squat8 wk
2 sess/wk
1RM
Low loads
Mod/high loads
Local endurance
Sprint (10-m)
Sprint (20-m)
Jump (CMJ)
Sánchez-Moreno et al. [33]25%: 15 (1.5)
50%: 14 (1.5)
25%: 26.3 ± 4.1
50%: 50.5 ± 7.9
25%: 363.0 ± 84.6
50%: 556.3 ± 121.9
25%: 0.71 ± 0.11
50%: 0.56 ± 0.13
Body massPush up8 wk
2 sess/wk
1RM
Local endurance
-
Sánchez-Moreno et al. [31]15%: 11 (1.2)
45%: 11 (1.2)
15%: 17.1 ± 4.9
45%: 42.3 ± 4.3
15%: 177.1 ± 38.5
45%: 401.6 ± 121.1
15%: 0.76 ± 0.03
45%: 0.67 ± 0.02
60–80Squat8 wk
2 sess/wk
1RM
Low loads
Mod/high loads
Sprint (10-m)
Sprint (20-m)
Jump (CMJ)
RSR: relative strength ratio (1RM/Body mass, kg·kg−1); wk: week; sess: sessions; reps: repetitions; 1RM: one-repetition maximum; low loads: absolute loads lifted faster than 1.00 m·s−1 (squat) and 0.80 m·s−1 (bench press) at pre-training, ≤60% 1RM [35,36]; mod/high loads: absolute loads lifted slower than 1.00 m·s−1 (squat) and 0.80 m·s−1 (bench press) at pre-training, >60% 1RM [35,36]; CMJ: countermovement jump. Note: the sex of the participants was not detailed since all the studies included male-only samples.
Table 3. Characteristics of the sample and the resistance training (RT) programs conducted by Low-ModVL and Mod-HighVL thresholds.
ThresholdSampleResistance Training Program
kMean SizeInitial RSR
(kg·kg−1)
VL Actually Incurred
(%)
Total Volume
(reps)
Training Velocity (m·s−1)
Low-ModVL1313 ± 21.2 ± 0.216.1 ± 6.2 ***212.0 ± 102.3 ***0.73 ± 0.18
Mod-HighVL1113 ± 21.3 ± 0.239.8 ± 9.0384.0 ± 95.00.61 ± 0.16
Low-ModVL (≤25% intra-set VL); Mod-HighVL (>25% intra-set VL); k: number of groups; RSR: relative strength ratio (1RM/Body mass); reps: repetitions; *** significant differences between VL thresholds (p ≤ 0.001).
Table 4. Within-group analysis showing the pre-post training effects of Low-ModVL and Mod-HighVL thresholds.
Outcome or VL ThresholdkES95% CIp-ValueI2 (%)X2 (p-Value)
1RM
Low-ModVL 130.79[0.56 to 1.01]<0.0000100.87
Mod-HighVL110.59[0.35 to 0.83]<0.0000100.88
Mod/high loads
Low-ModVL112.39[1.97 to 2.81]<0.00001430.06
Mod-HighVL91.91[1.59 to 2.23]<0.0000100.59
Low loads
Low-ModVL111.33[1.07 to 1.58]<0.0000100.89
Mod-HighVL90.59[0.28 to 0.90]0.0002260.22
Local endurance
Low-ModVL71.50[1.08 to 1.93]<0.00001390.13
Mod-HighVL61.14[0.65 to 1.64]<0.00001510.07
Sprint
Low-ModVL140.35[0.14 to 0.57]0.00100.74
Mod-HighVL120.05[−0.18 to 0.29]0.6701.00
Jump
Low-ModVL90.59[0.31 to 0.86]<0.000101.00
Mod-HighVL70.36[0.05 to 0.68]0.0300.83
Low-ModVL (≤25% intra-set VL); Mod-HighVL (>25% intra-set VL); k: number of groups. Low loads: absolute loads lifted faster than 1.00 m·s−1 (squat) and 0.80 m·s−1 (bench press) at pre-training, ≤60% 1RM [35,36]; mod/high loads: absolute loads lifted slower than 1.00 m·s−1 (squat) and 0.80 m·s−1 (bench press) at pre-training, >60% 1RM [35,36].
Publisher’s Note: MDPI stays neutral with regard to jurisdictional claims in published maps and institutional affiliations.

