Article

An Intelligent Solution for Automatic Garment Measurement Using Image Recognition Technologies

by
Agne Paulauskaite-Taraseviciene
1,*,
Eimantas Noreika
1,
Ramunas Purtokas
1,
Ingrida Lagzdinyte-Budnike
1,
Vytautas Daniulaitis
1 and
Ruta Salickaite-Zukauskiene
2
1
Faculty of Infromatics, Kaunas University of Technology, Studentu 50, 51368 Kaunas, Lithuania
2
Noselfish MB, Slaito 4, 59204 Birstonas, Lithuania
*
Author to whom correspondence should be addressed.
Submission received: 25 March 2022 / Revised: 20 April 2022 / Accepted: 26 April 2022 / Published: 28 April 2022

Abstract

:
Global digitization trends and the application of high technology in the garment market are still too slow to integrate, despite the increasing demand for automated solutions. The main challenge is related to the extraction of garment information-general clothing descriptions and automatic dimensional extraction. In this paper, we propose the garment measurement solution based on image processing technologies, which is divided into two phases, garment segmentation and key points extraction. UNet as a backbone network has been used for mask retrieval. Separate algorithms have been developed to identify both general and specific garment key points from which the dimensions of the garment can be calculated by determining the distances between them. Using this approach, we have resulted in an average 1.27 cm measurement error for the prediction of the basic measurements of blazers, 0.747 cm for dresses and 1.012 cm for skirts.

1. Introduction

One of the most powerful and widely used types of artificial intelligence is computer vision, which aims to mimic some of the complexity of the human visual system and enable computers to detect and identify objects in images and videos. Computer vision techniques cover an increasing number of applications and engineering aspects of computing related to image recognition, including scientific work proposing innovative algorithms or solutions for commercial, industrial, military and biomedical applications. The increasing use of computer vision in everyday life contributes to the efficiency of various aspects of the field. Although the use of these technologies allows solving many complex tasks (automated object detection and identification, tracking), the detection of defects and anomalies is one of the most valuable investigations in medicine [1], bio-medicine [2], manufacturing [3] and agriculture [4]. For example, image recognition techniques based on deep learning can be used to enable advanced disease control in agriculture [5,6,7], to identify product defects and increase the quality control in manufacturing [8], automated assessment, prediction and assistance in medicine [9,10], increase the success rate of bio-medicine procedures [11], provide intelligent road safety solutions [12,13] and many others.
Online shopping is the most popular online activity worldwide, and the key value of intelligent image recognition solutions for e-commerce lies in the ability to identify products quickly and accurately. However, global digitization trends and the application of high technology in the garment market are still too slow to integrate, despite the increasing demand for automated solutions and the fact that the challenges are quite clear and already discussed in different researches. In principle, the main challenge is related to the extraction of garment information-general clothing descriptions, automatic dimensional extraction and textual information retrieval from the tags (size, brand, fabric composition, etc.). Currently, the accuracy and completeness of the information about garments on sales platforms still relies on a significant amount of manual and tedious work. Measuring a garment is extremely time-consuming and often requires multiple measurements to reduce measurement error. Artificial intelligence (AI) technologies have the potential to meet the demand to adopt the automation technology in this sector by increasing the speed and accuracy of garment measurement [14,15,16]. Given CNN’s success in a range of domains, the deep learning-based solution has also demonstrated its superiority in performing a variety of garment recognition tasks. The approach based RCNN has been proposed for the shirt attributes recognition task, including the Inception-ResNet V1 model with LSoftmax for images representation and identification of their categories [17]. The experimental results show an overall labelling rate of 87.77%, a precision of 73.59% and a recall of 83.84%. A fully convolutional network and SP-FEN architecture have been proposed to parse clothing in fashion images. The proposed model has shown accuracy in terms of the overall pixel-wise accuracy and clothes parsing performance (pixel accuracy of 92.67 and MIoU of 48.26) [18]. However, the main objective is to identify individual garments, which implies a semantic segmentation task by assigning a class label to each pixel of the image.
A review of relevant research has shown that it is much easier to measure clothes lying down than hanging (e.g., on a mannequin). In [19], special equipment to capture images of tiled garments has been proposed which enables automatic garment measurements. The shooting device consists of a digital camera, LED light, shooting stand and workbench. A garment template is employed to recognize garment types and feature points, which are used to calculate garment sizes. Experimental results show that the accuracy of the approach can meet the requirements of the apparel industry since the average relative error is  ∼2%. Tolerable error in the fashion industry is ∼2 cm. The authors in [20] present an idea and apps that allow measuring the lay-down of a garment placed on a marked board. The proposed app then shoots the garment using the top camera form above and automatically captures many of the garment’s standard measurement points. The basic strategy is to first detect key points of interest in the clothing item and then use known measurements from demarcations on the backdrop to infer distances between those points. To measure lying-down clothes a fuzzy edge-detection algorithm can be used to detect the edge of garment image [21]. Then a corner-detection algorithm based on Freeman code is invoked to locate the corner points. The experiment results show that the proposed approach can measure t-shirts with the related error from 0.73% to 2.84% depending on the measured points. The smallest error has been obtained for the garment length (less than 1%).
Measurement solutions with requirements for a fixed position of the garment may limit their use and application, although the accuracy of such solutions is quite high (up to 0.5 cm error) [22], because, under real-world conditions (non-laboratory or industrial-oriented), the position of different garments in each image can vary. This means that it is quite complicated to use pre-designed templates to extract the essential dimensions of a garment. Adherence to certain equipment or templates is more semi-automatic solutions that require additional calibration, widespread interruptions from distinct angles and specific positions (mobile apps). All this process takes a lot of time and therefore the essential goal of optimizing time by measuring the garment is lost. How to make automatic garment measurement as versatile and accurate as possible is also one of the most important issues for the autonomous retrieval of garments information. In this work, we focus on the challenge of automatically measuring the hanging garments (in this particular study, on the mannequin), without being restricted by space, background requirements, shooting distances or additional tags needed for measurements. The aim of this research is to create a solution by implementing an automatic clothing segmentation and measuring algorithm that would let us not only separate clothing into different groups but also measure their basic measurements such as distance between shoulders, length of a sleeve, etc. Identifying the main problems and limitations of both objectives—accurate segmentation and measurement—is also an essential task, as it can provide insights and avenues for further research.

2. Materials and Methods

Initially, in this study, 683 images of clothing were collected including different types of garments. As one of the objectives of this study is to investigate the feasibility of automatic garment sizing with household photographs that can be uploaded to different platforms (e.g., second-hand clothing platforms) photos taken under different conditions and with different mannequins or hanging on a hanger have been included. There are solutions for overcoming the effects of lighting and occlusion, but they are usually developed for specific groups of objects [12,23] or noises [24].
Initial experiments have shown that the distance from the camera to the object is quite an important aspect in the calculation of the size of the garment and can lead to a measurement error of 10 to 15 cm. This problem can be solved by adding a standard-sized object (e.g., a bank card) to the scale, but some requirements arise here as well. These include reflections, edge identification problems when the tag blends with the garment, etc. Many problems are caused by wrinkled, ruffled clothes, such as those that are the same colour as the background. Depending on the pose and condition of the garment, and the angle of the camera, difficulties arise, e.g., measuring the width of the sleeves, as they can look much narrower than they really are. In addition, it has been observed that the quality of the photos and the context vary considerably, including differences in shooting and lighting conditions, camera resolutions and clothing shooting angle, the appearance of multiple garments in one photo, redundant objects in the photo, more than 20 different types of clothing, etc. Given all these challenges, several iterations of data cleaning were carried out to improve the quality of the dataset. First of all, the variety of garments has been reduced to 13 classes according to [25], resizing all photos to 224 × 336 resolution retains information about the boundaries of the garment and reduces the resource requirements for size prediction methods. Finally, in order to have a stratified dataset, 330 images of clothing were selected including the same amount of blazers, skirts and dresses. This dataset has been divided into three parts: 70% for training, 15% for validation and 15% for testing.
More advanced exploration of the dataset has revealed that the application of classical methods to the segmentation task has a lot of potential, so it is appropriate to test other algorithms before employing deep learning architectures. The simplest way is therefore to use image processing techniques to extract information about the edges of the garment so that the location of the garment in the image can be determined and the size of the garment can be measured using an additional algorithm. The second way is to use the deep learning architecture (e.g., UNet family [26] model) to create the mask of the garment in the photo that would extract the position of the garment. Then using a classifier to determine the type of garment, pass the collected information to the specific algorithm to perform the final garment measurements prediction. Instead of a specific algorithm, all essential garment points can be predicted using deep learning models, whose provided output results allow calculating the distances between points and determining garment measurements. However, the identification of the most appropriate solution must focus not only on the accuracy but also on the complexity of implementation, computational resources and robustness to different environments.

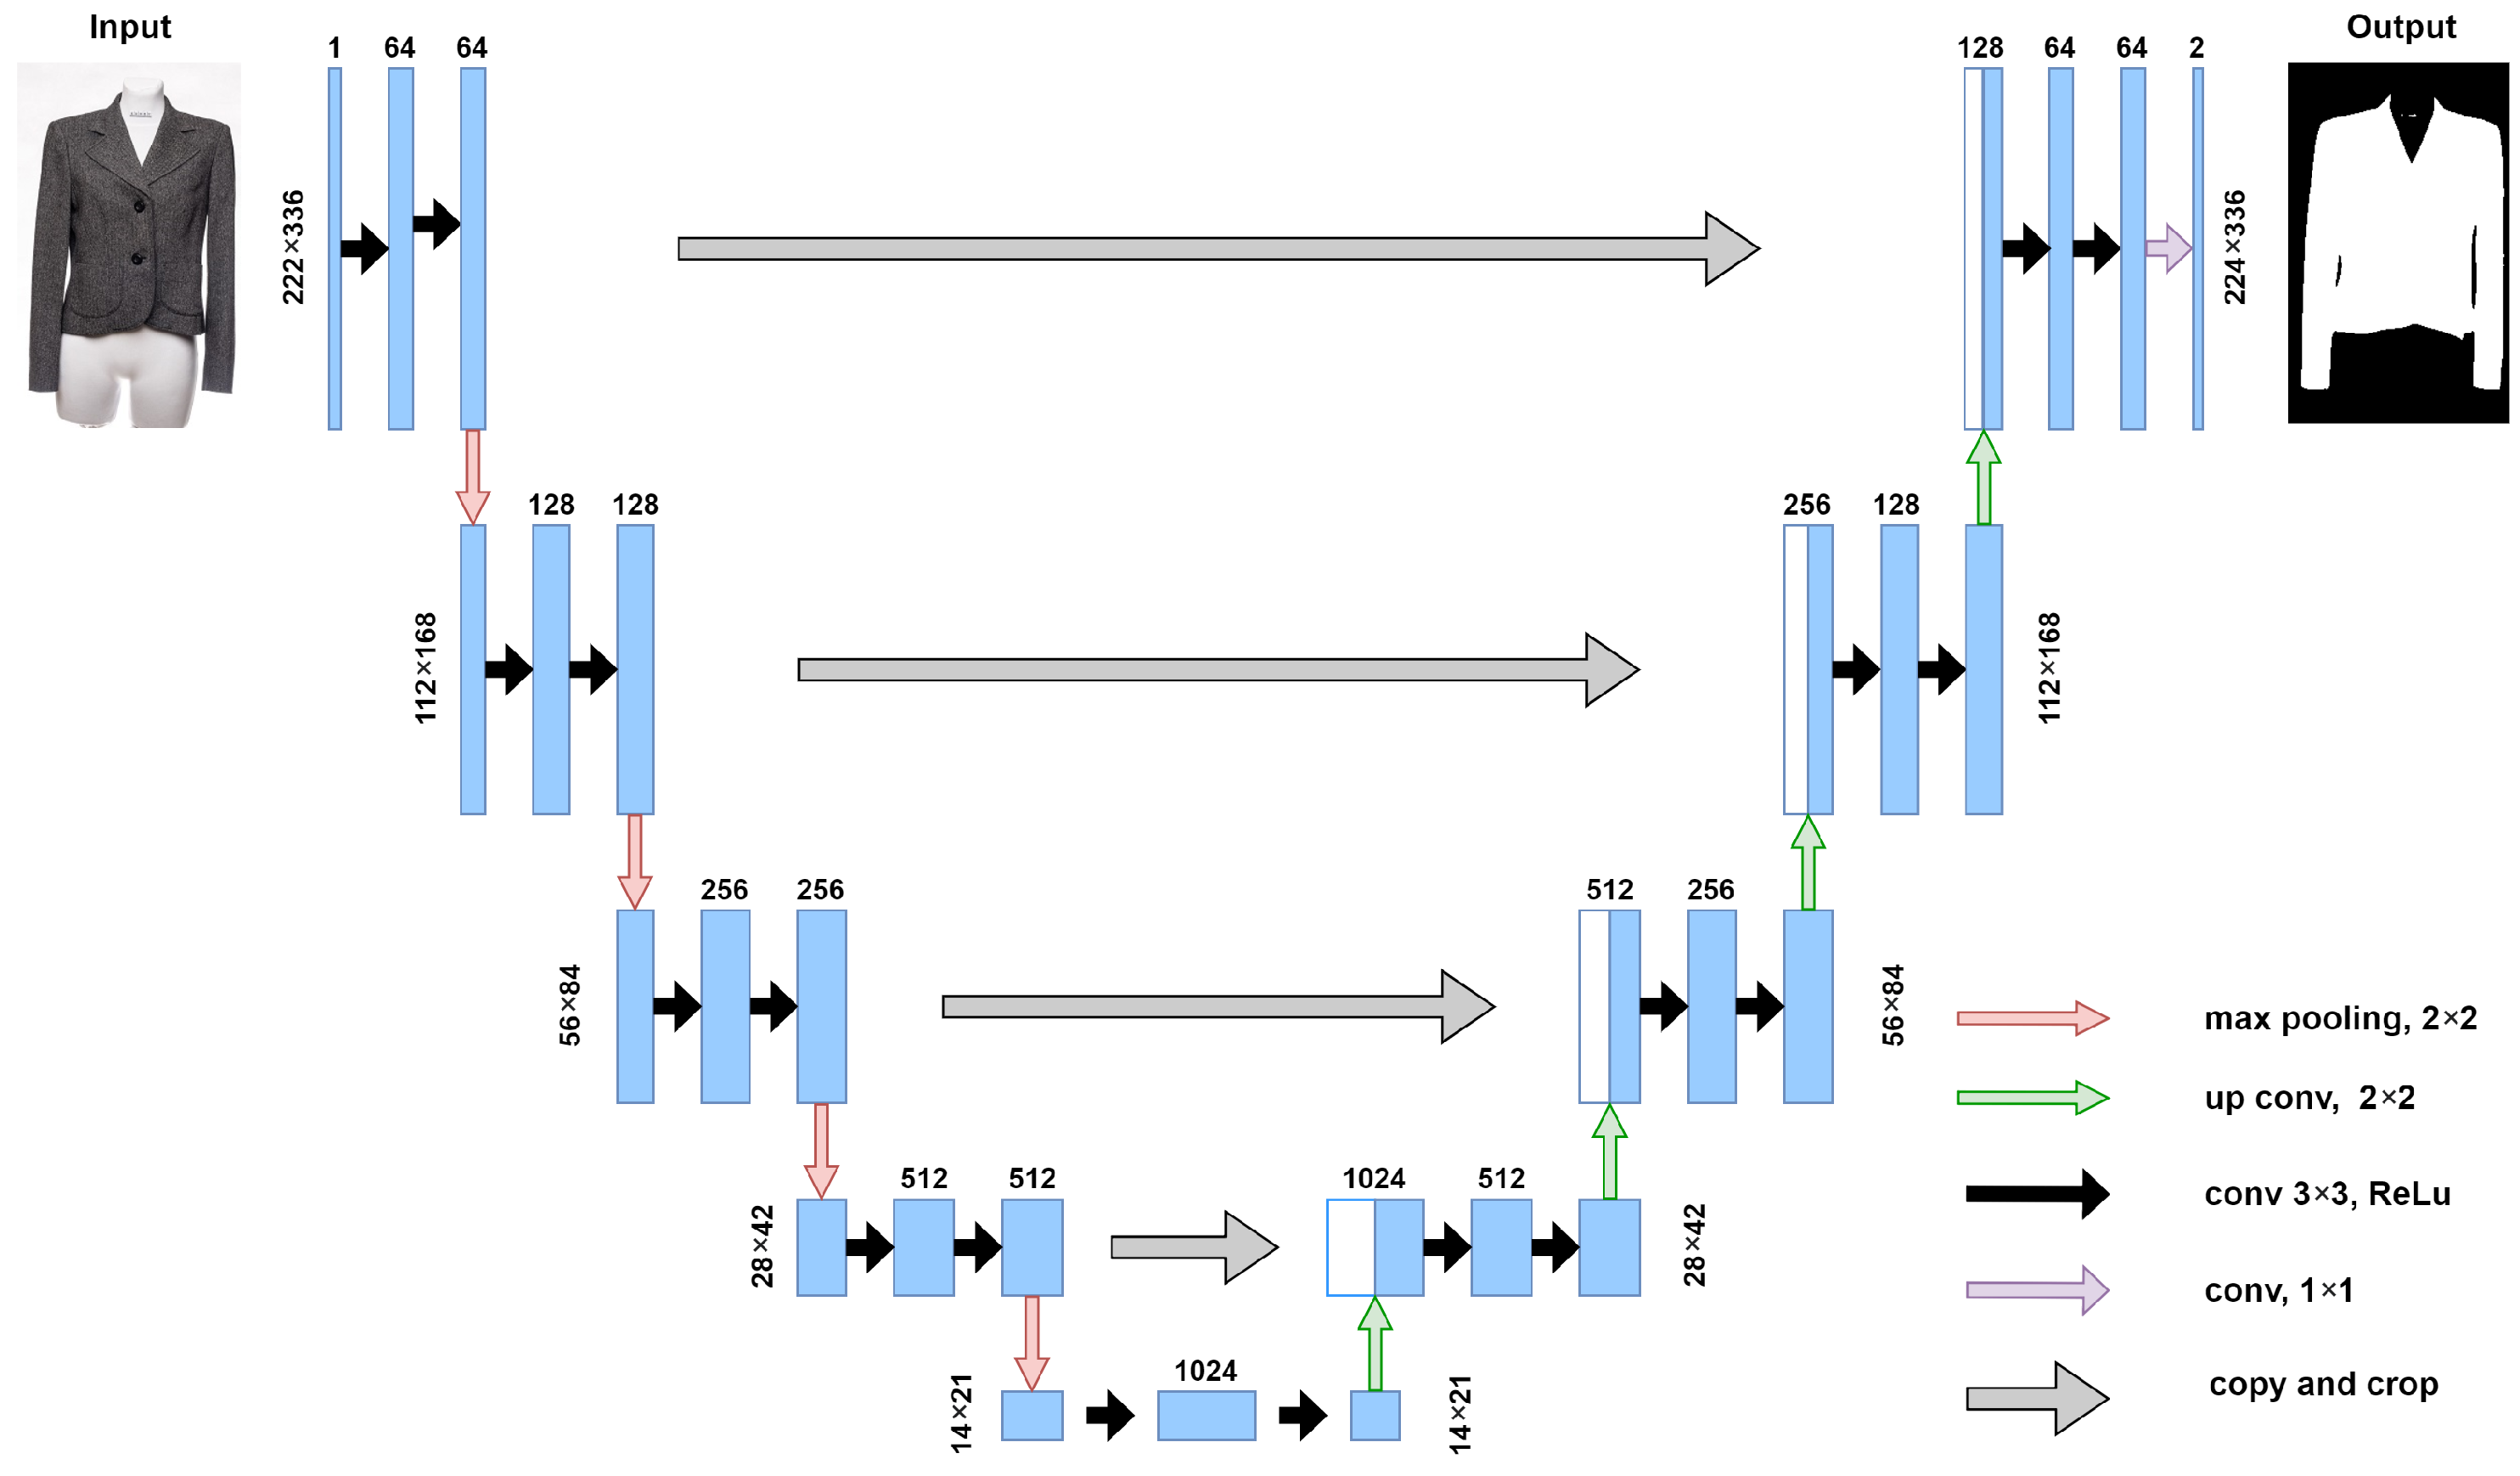
2.1. UNet Model-Based Extraction of Contours of the Garments’ Shape

Various image segmentation algorithms have been developed, but more recently, the success of deep learning models in various vision applications has led to a large number of studies on the development of image segmentation methods using deep learning architectures. U-Net is a convolution neural network [27] originally proposed for medical imaging segmentation, but various research has shown its potential for other segmentation tasks as well [28,29,30]. The U-Net network is fast, can segment a 512 × 512 image without the need for multiple runs and allows for learning with very few labelled images. This is an important feature in our case because the dataset is relatively small. Moreover, in this research, a network and training strategy that relies on the strong use of data augmentation is required in order to use the available annotated samples more efficiently.
As UNet model segmentation involves a masking process, therefore all masks were created using Open Source VGG Image Annotator version 2.0.10. The exported annotations were used to create a black and white image by drawing polygons for which there was only one in this study dataset.
In order to improve the segmentation results, the initial dataset has been expanded including the DeepFashion2 dataset [25]. There are no accurate measurements in the dataset, but there is clothing segmentation, which can improve the accuracy of the UNet model by defining the segmentation area and removing artefacts due to different environments. DeepFashion2 is a large dataset of photos collected from various fields and it contains 491,000 images of 13 popular clothing categories from commercial stores and consumers. It contains more than 800 K photos enabling it to extract dense landmarks and masks. However, in this study we aim to determine the size of the garment; therefore, this dataset can be used for segmentation purposes only. A filtering procedure was carried out to select suitable photos of clothing. Poor quality photos where the garment is covered, the garment is worn by a person, the garment is taken from the side or the back, there are several garments in a single photo, etc. were removed. A total of 18,000 images with only one garment visible from the front were identified as appropriate. The DeepFashion2 dataset does not provide clothing masks so using landmarks data we have developed an algorithm that creates masks. Finally, we obtained data similar to the original dataset that could be used to train the UNet model.
Few experiments with UNet models have been carried out in order to increase the segmentation results. First, the pre-trained UNet model (see Figure 1) with the classical structure has been employed and supplementary experiments have been performed with additional datasets, namely DeepFashion2 and Carvana datasets. However, this approach did not work well and the results were poor. Next, modified UNet architectures with the increased number of layers (added additional encoding and decoding layers) have been employed. Different size models pretrained with our small dataset have shown superiority compared to the classical UNet structure pre-trained with additional datasets. The included UNet family architectures, which differ in depth and in the different datasets on which they have been trained, are listed in Table 1.
The different models were compared on the basis of segmentation results. Image segmentation aims to classify each pixel of an image as representing a certain class, e.g., could be a garment, a mannequin, or a background in our case. There may be more or fewer classes depending on the task. Specific segmentation metrics (usually Pixel accuracy, Dice and Jaccard coefficients) are used to measure the success of the model [31,32]. Experimental results in this study were compared using the Dice similarity coefficient. The Dice coefficient, also called the overlap index, is the most common metric evaluating segmentation results [33]. This coefficient was used in order to evaluate the overlap between the predicted mask and the manually-labelled ground truth mask. During model training, the coefficient was used to calculate the loss value. The Dice value was calculated after the model received a predicted mask. Dice indices are bounded between 0 (when there is no overlap) and 1 (when predicted and true masks match perfectly). The Dice coefficient is 2× the overlap area divided by the total number of pixels in both images. In terms of the confusion matrix, the metrics can be reformulated into true/false positives/negatives statements:
Dice = 2 X Y X + Y = 2 T P 2 T P + F P + F N
where |X| and |Y| are the cardinalities of the two sets (i.e., the number of pixels in each area), X is the ground truth mask, while Y represents the predicted mask. The intersection ( X Y ) is comprised of the pixels found in both the prediction mask and the ground truth mask. T P —true positives pixels that exactly match the annotated ground truth segmentation, F P —false positives pixels that are segmented incorrectly, F N —false negatives pixels that have been missed.

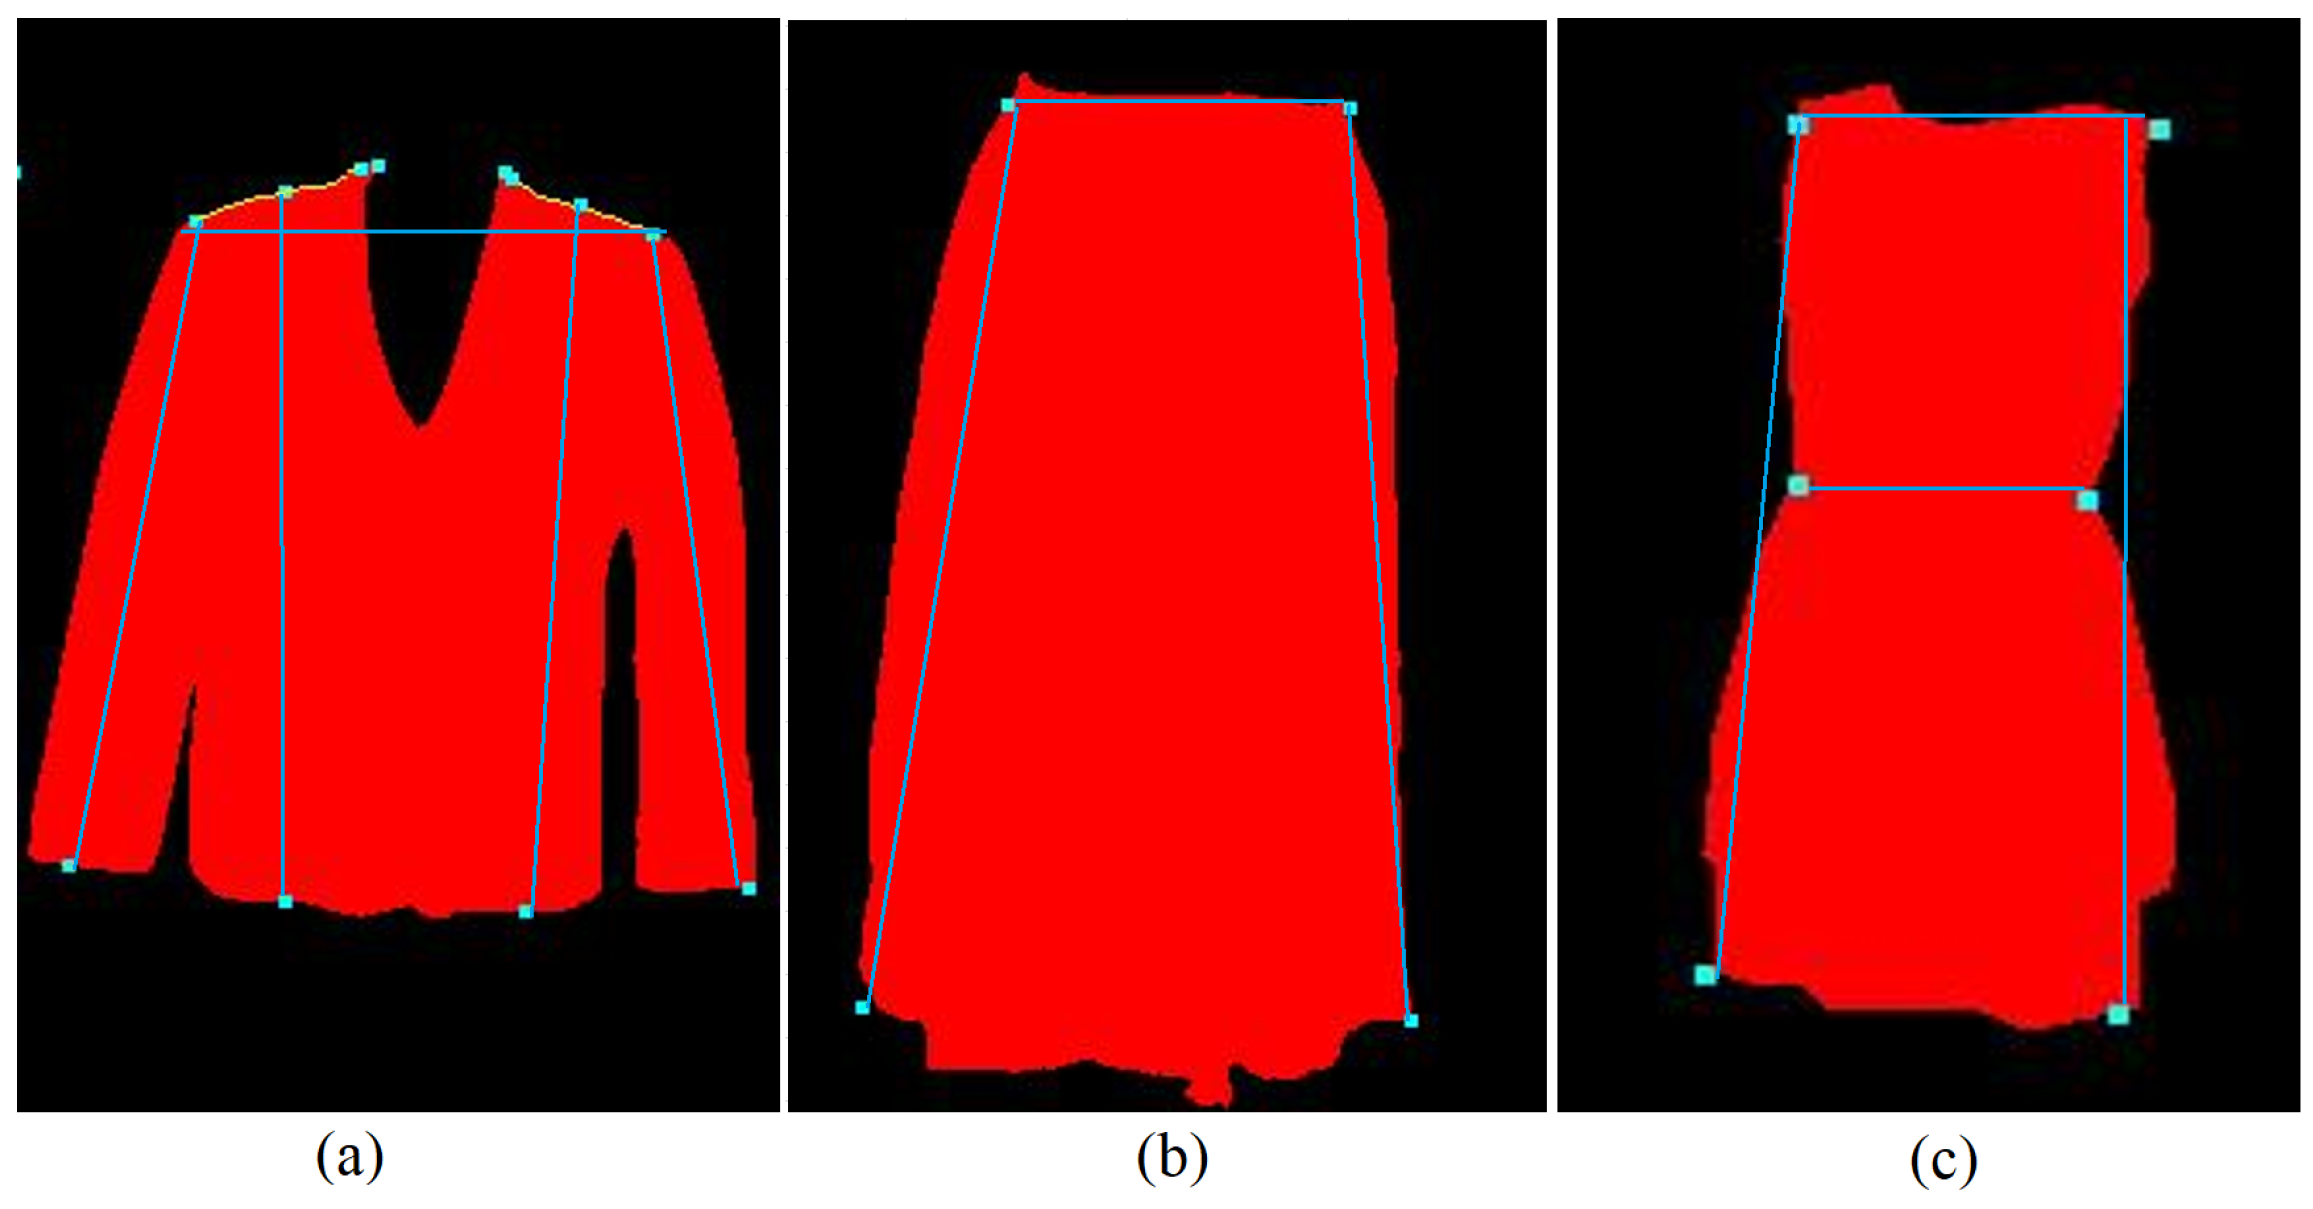
2.2. Garment Key Points Detection

The segmentation process is only the first step in determining the measurements of garments. Which measurements are relevant depends on the type of garment: for a skirt, for example, it is important to know the waist and length, but for a shirt or jacket you should also measure the length of the sleeves, the width of the shoulders, etc. Segmentation should then be followed by a classification task which allows identifying the necessary dimensions. Finally, once the type of garment has been identified, it is possible to identify the measurement key points which is the most challenging task and directly depends on segmentation results. An incorrect segmentation result can reduce the accuracy of key points detection or stop the algorithm altogether.
In this study different key points detection algorithms have been created. The principle of the developed algorithms is to identify the edge points of the garment in the image that are necessary to determine the relevant dimensions in certain areas. In Figure 2 the basic key points for blazers, skirts and dresses are provided. For the blazers, it is important to capture the left and right shoulders’ fall bottom points as the distance between these points (1 and 8) is the measure of shoulders width. To measure the total length of the blazer we need to find the midpoint of the shoulder strap and the midpoint of the bottom of the blazer. These points are captured on both sides, left (2,11) and right (7,10). Finally, the average value of these distances is calculated. Points 3 and 6 are used to determine where the shoulder line starts. To measure the length of the left and right sleeves we have the shoulders’ fall bottom points (1,8) and the mid-points on the bottom of the sleeves (12,9). To measure the neck width, points (4) and (5) are included. It can be noticed from Figure 2 that for the dresses and skirts fewer key points are required. For the sleeveless dresses, 6 key points are included in order to measure the shoulder width, waist and total length. In addition, the width of the bottom of the dress can be calculated from points 5 and 4. To obtain a measurement for the skirt only four points are included: (1) top left point; (2) top right point; (3) bottom right point and (4) bottom left point. These points are sufficient to calculate the skirt waist, overall bottom length and width.
Some general points that do not depend on the type of garment are included such as angle finder point, middle left and right points, bounding box, edge points, etc. The algorithms of such point detection can facilitate the finding process of the main key points. For example, the algorithm “ClothBoundariesCalculator” captures information on the position of the garment and the points of the bounding box. In this study we have performed experiments with the three types of garments, thus 26 key-point estimation algorithms have been created. The decisions in the algorithms are based on a threshold value applied for the pixel. For instance, Algorithm 1 represents the pseudo-code of the algorithm that finds the left and right side of the neckline with the generated mask and corresponds to the blazer’s key point (4).
This algorithm requires initial data on the position of the garment. All starting points have ( x , y ) coordinates indicating their position on the garment. The top point of the garment is defined as T x , y . The middle point of the garment on the left side is annotated as L x , y and the right as R x , y . The upper point of the collar on the left side is annotated as C L x , y and the right as C R x , y . The middle of the garment is defined as point M x , y . The set containing the garment mask is defined as G x , y . These points as resolved using additional algorithms which must be created separately.
To find the midpoint between the extreme point of the shoulder and the highest point of the neck, the algorithm needs to find the highest point on the neck collar first. The algorithm begins the search of the neckline from the middle of the garment with the aim to find the smallest x and smallest y coordinates for the left neck collar and the largest x and smallest y for the right collar which are return from algorithm as r point. The algorithms for finding measurement points for garments consist of 4 parts:
  • Identification of bounding box and the outermost points of the garment contour;
  • Detection of garment’s angles, shapes, and changes in ( x , y ) coordinates;
  • Key points prediction based on auxiliary algorithms that find the desired location;
  • Final prediction that sets the sensitivity factor for developed algorithms to adapt to the type of the garment. Then the pixel to cm ratio is calculated and the dimensions of the garment are produced.
Algorithm 1:  Pseudo-code for left and right neck line identification.
 Left
1.
   y = M y
2.
  WHILE y > T x
3.
    x = M x
4.
   WHILE x > L x
5.
    IF ( x , y ) G
6.
     IF C L x = 0 OR y < C L y
7.
       r = ( x , y )
8.
x
9.
y
10.
  return r
 Right
1.
y = M y
2.
   WHILE y > T x
3.
     x = M x
4.
    WHILE x > R x
5.
     IF ( x , y ) G
6.
      IF C R x = 0 OR y < C R y
7.
       r = ( x , y )
8.
x +
9.
y
10.
  return r

3. Results

3.1. Extraction of the Contours of the Garment Shape

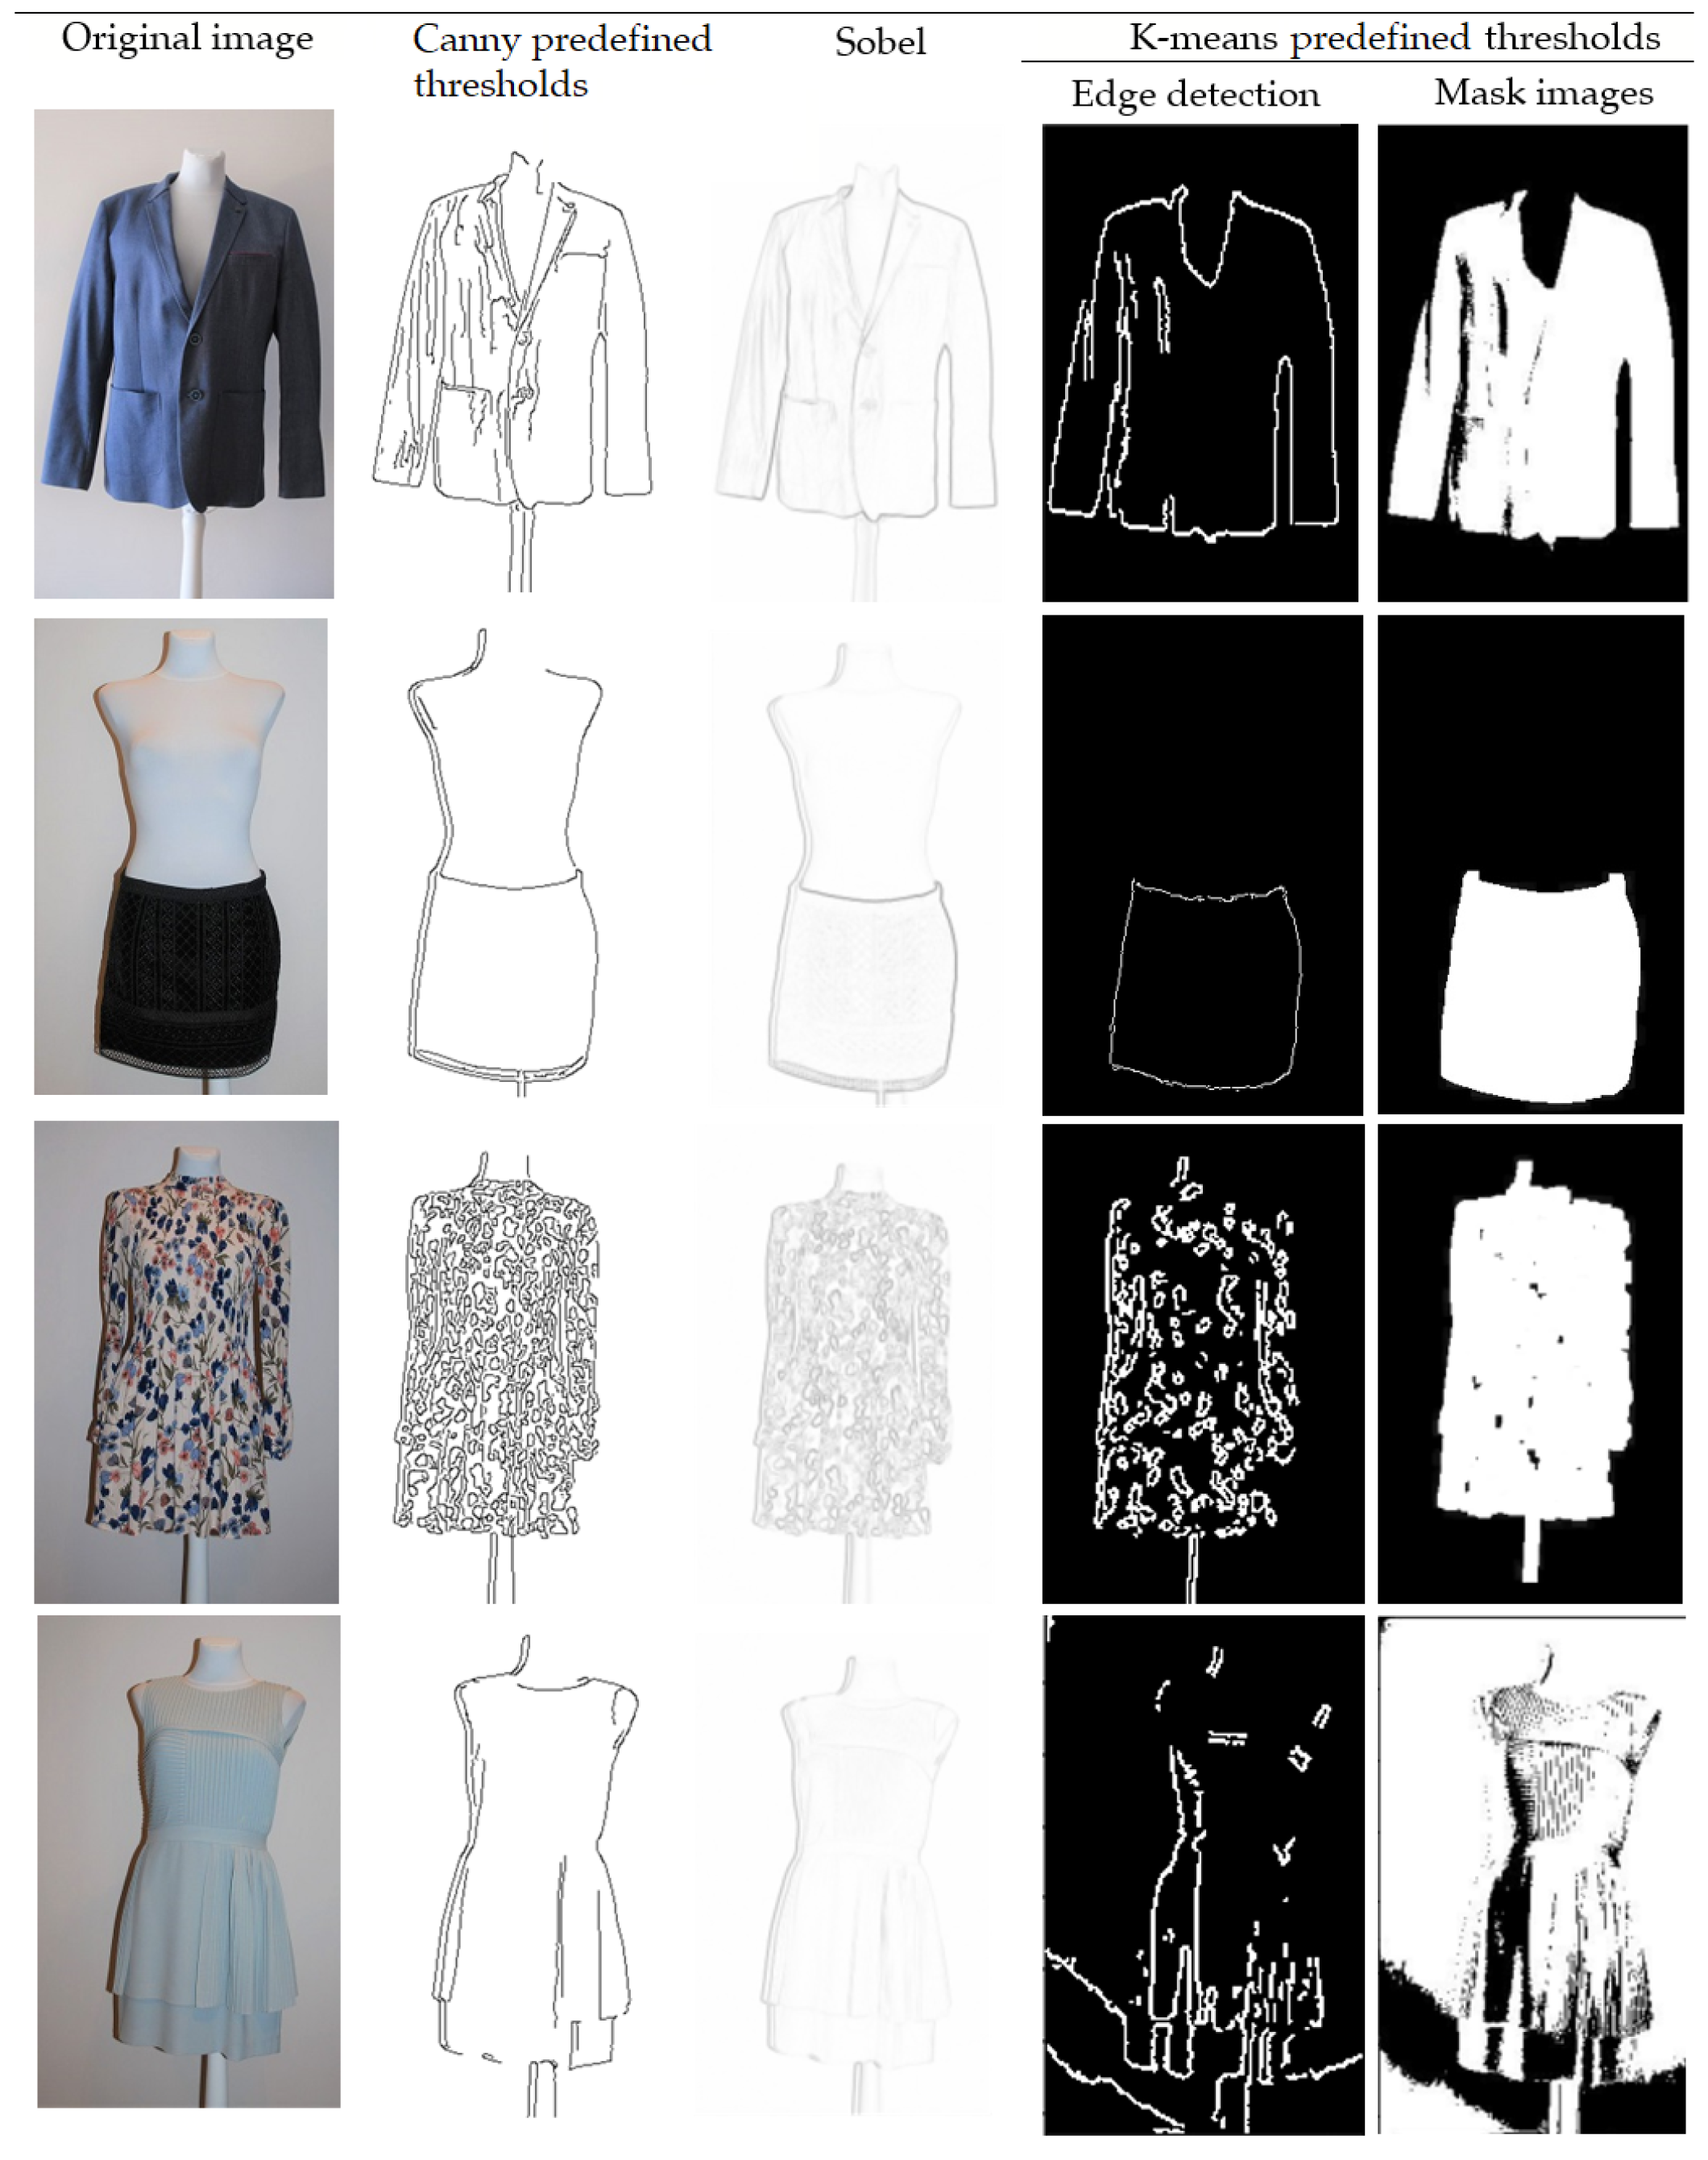
3.1.1. Edge Detection Techniques

The experiments performed in this study aim to determine whether widely used methods for edge detection can be applied to determine the edges of a garment. The photos collected during the study have a clear edge with the environment, but the main drawback is that these edges may be on the garment itself, which causes a problem that will require processing of the results. There is also a mannequin in each photo and there may be other objects. The detection of the edges of extraneous artefacts is a side factor complicating the use of the resulting edges. The common image contour detection pipeline includes the conversion of an RGB image to a grayscale format, a binary threshold setting (which converts the image to black-and-white based on a threshold value and highlights objects of interest) and finally contours identification. The latter step uses a method that can set the boundaries of the uniform intensity form. To find contours, we can also use the Canny edge detection algorithm [34]. The Canny algorithm consists of five main steps. As the algorithm is based on greyscale images, it is necessary to convert the image to greyscale before performing all of the steps. The first step is to reduce the noise by performing a Gaussian blurring on the image. The second step is to determine the intensity gradients using edge detection operators. In our case, the Sobel filter has been applied to get the intensity and edge direction matrices. The third step involves non-maximum suppression to thin out the edges. This function works by finding the pixels with the highest value in the edge directions. If the pixels are not part of a local maximum, they are set to zero (converted to a black pixel), otherwise, they are not modified. Because the resulted image after non-maximum suppression is not perfect (there is some noise in the image) double thresholding is applied in a fourth step. All pixels with a value higher than the predefined high threshold value are considered to be a strong edge and are likely to be edges. All pixels with a value less than the predefined low threshold value are set to 0. Values between the low and high threshold values are considered “weak” edges, in other words, it is not clear whether they are real edges or not edges at all. Finally, the fifth step, based on the threshold results, invokes edge tracking by hysteresis, which performs a transformation of weak pixels. “Weak” edges connected to strong edges are treated as true edges and those not connected to strong edges are removed. The results of canny edge detection with a predefined threshold are provided in Figure 3. Different clothing types and colours were used in the experiment.
Another very popular edge detection technique is Sobel [35], which is a gradient-based algorithm including manipulations to the x and y derivatives. Sobel algorithm converts the image into grayscale and employs two 3 × 3 kernels which are convolved with the original image to calculate approximations of the derivatives for horizontal and vertical changes. The Gaussian filter is used for reducing noise that makes blurred images.
Figure 3 shows that edge detection using the Canny or Sobel algorithms is quite precise despite the type, background and type of the clothing, but the edges of the mannequin are detected along with the garment. Moreover, the shadows visible in the original images are depicted as a double contour line in the resulting image. Changing the algorithm parameters did not provide the required result either, since we need to find the edges of the outer shape of the garment.

3.1.2. K-Means Clustering Approach

Many clustering methods have been developed for various purposes, usually unsupervised classification. K-means clustering is one of the instances of such type of algorithm that aims to divide N observations into K groups, with each observation belonging to the cluster with the closest mean. A cluster is a collection of data points that are clustered together due to similarities. For the image segmentation, including different colour spaces (RGB or L*a*b) clusters refers to different image colours [36,37]. The algorithm aims to minimize the Euclidean distance between observations and centroids. Single or few iteration thresholds can be used to segment the image adaptively and to filter the noise [38]. In general, the goal of the K-means approach is to find parameters that filter out the influence of the background on the image, so that the final segmentation result, the target object, is more accurately distinguished.
For segmentation of garment, K-means is used to identify the three most dominant colours in the image (e.g., background, mannequin and dominant colour of the garment) and calculate the thresholds in order to generate a binary image. The value of K should be specified in advance, and the correct selection of this value is not always straightforward. Values of K in the range from 2 to 6 have been experimentally tested. The best results were obtained when K = 2 or K = 3. However, with the given data the results are 6.8% better (in terms of mask accuracy) when K = 3. Therefore, based on the three values obtained (centroid-based thresholds), all pixels in the image are converted to black and white. It is observed that the resulted image after clustering is still noisy. The noise is reduced using a median filter. To smooth the image a few iterations of morphological operations-dilation and erosion are applied. These techniques are used not only for noise reduction but also for identifying holes in the image (which is very relevant when we have mottled clothes), isolating individual elements and joining disparate elements in the image. In our case, we use structured element matrices of size 5 (kernel size = (5, 5)) and we performed three iterations of both operations. Increasing the number of iterations (up to 5) is relevant for multi-coloured garments (as it fills the holes and creates a continuous mask), but may have a negative effect on single-coloured garments. Contours are detected using the concept of Canny edge detection. An iteration process (“cleaning up”) of the remaining weak edges was performed setting them to zero. Finally, as a result, an image mask is provided (see Figure 3). Although the result with dark-coloured clothes looks really promising (the mannequin is excluded as well), the algorithm performs badly with multi-coloured fabrics, and especially with light-coloured garments where the garment is hardly distinguishable from both the background and the mannequin (Figure 3). Ambient shadows also strongly influence the resulting images of the K-means algorithm.

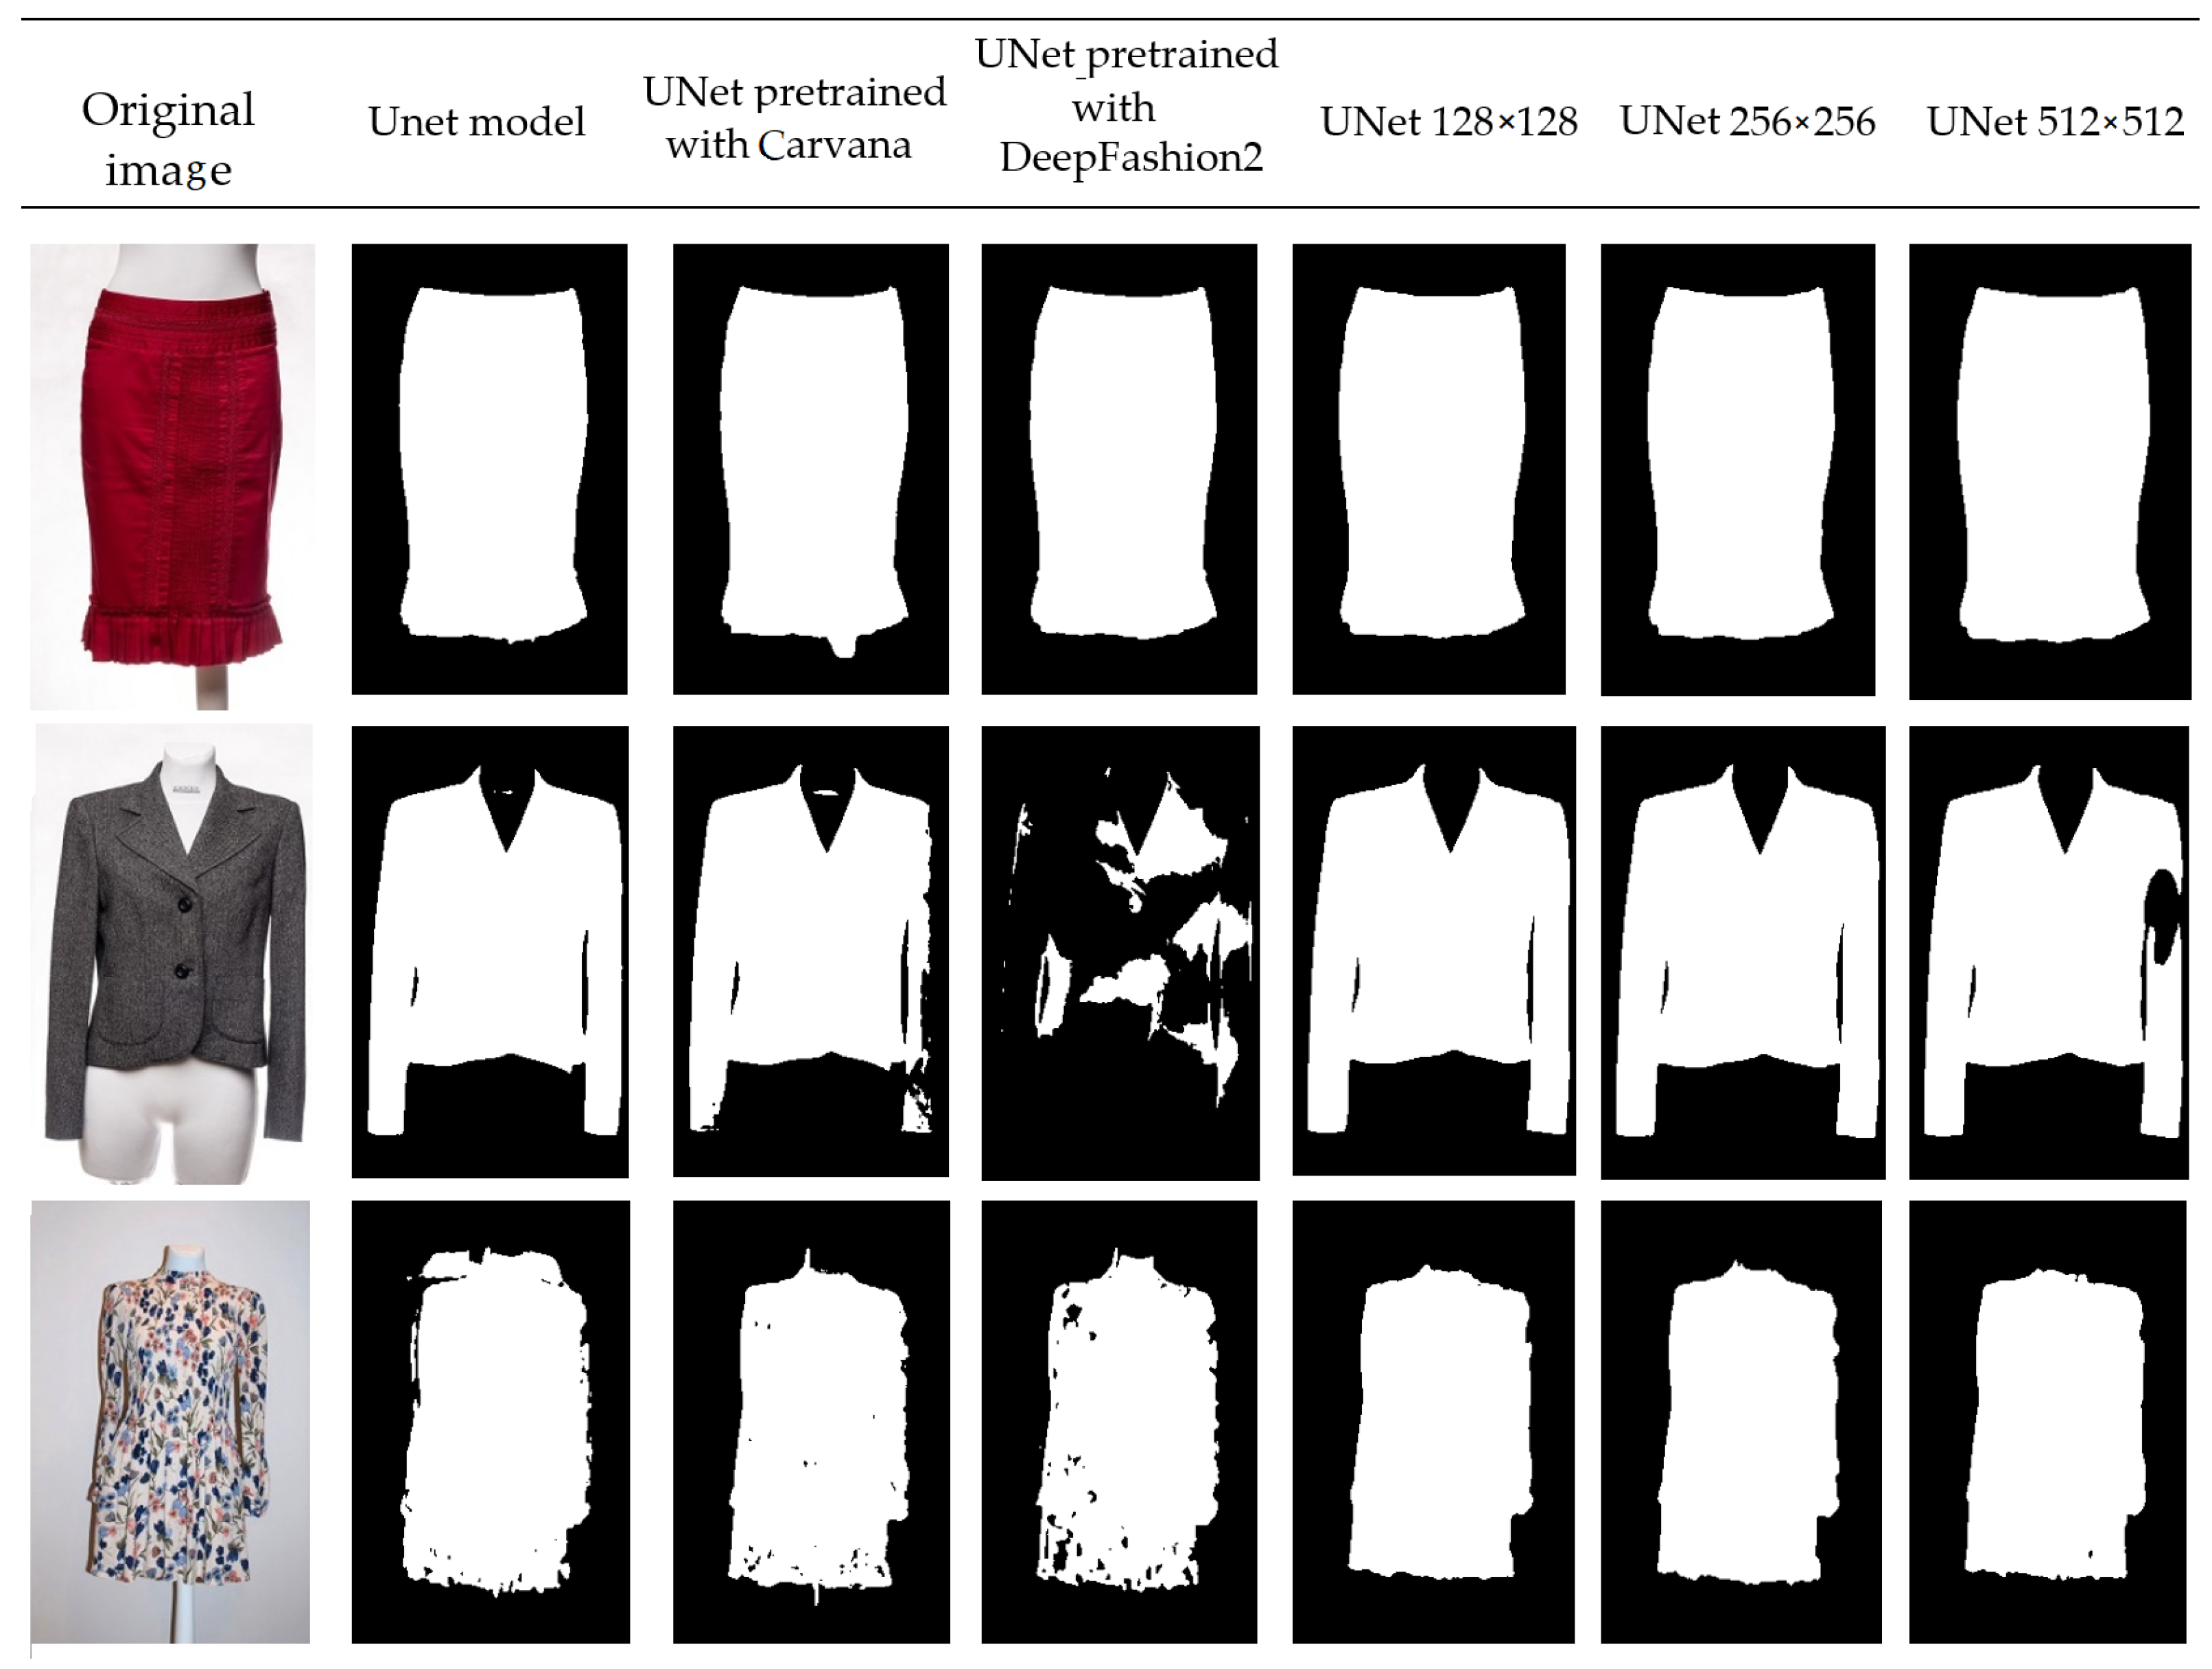
3.2. UNet-Based Segmentation

Figure 4 represents a few garment image segmentation results based on deep learning models described above. From the predicted masks we can see that UNet models pre-trained with DeepFashion2 and Carvana dataset have the lowest accuracy compared to other models. In the segmentation results, we can see that the clothing lines in the photos are not preserved and the entire shape of the garment is lost. However, as with all models, the segmentation of the skirt shows very good results due to the bright red colour. This indicates that the high contrast with the environment in the photos is an important factor. The best results in maintaining bright and smooth boundaries of clothing are obtained with UNet models including additional encoding and decoding layers.
Dice values show that used deep learning models were highly volatile during the training phase and Dice coefficients ranged from 0.02 to 0.979. Average and maximum values of Dice coefficient were calculated estimating the results of five experimental runs (see Table 2). Models that were trained with the Carvana dataset or DeepFashion2 showed no significant improvement in accuracy. The UNet 128 × 128 model with a maximum Dice accuracy of 0.979 demonstrated the highest accuracy results obtained through all five runs including augmentation. The average value of the Dice coefficient reaches 0.917 with augmentation and 0.899 without augmentation. However, it can be concluded that in choosing a UNet model, the variation in model depth should be rationally evaluated, as the classical UNet uses much less computational resources than models with additional layers, but compared to UNet 128 × 128 its average accuracy according to the Dice value is 0.113 lower including augmentation and 0.047 without augmentation.
One of the five training processes of all included models during 50 epochs is shown in Figure 5 providing the variation of Dice coefficient value throughout the process. It can be noticed that more stable results are gained using deeper UNet models, observing more significant Dice value variations only until the 15th epoch, while others had larger fluctuations around 0.2. The classical UNet model achieved an average DICE value of 0.860 without augmentation and 0.800 with augmentation. However, it has only stabilized in the last four epochs of the training process (see Figure 5). DICE values were calculated by estimating epochs from 10 to 50 and excluding the “warming period” of the first 10 epochs.

3.3. Obtained Measurement Results

With accurate segmentation results, which means the garment is accurately separated from the background, we can predict measurements using proposed algorithms for the key point detection (see Figure 6). Table 3 shows the obtained results of garments’ measurements providing mean absolute error (MAE). The best accuracy results have been achieved for the dresses with an average of 0.747 cm measurement error, when total length, waist and shoulders dimensions are considered. For dresses, the largest errors are observed in the measurements of the overall length of the dress. However, the predicted waist measurements are very similar to the actual ones, with an average error of only 0.3429 cm. Prediction results of waist dimensions are relatively precise for the skirts as well, because the MAE is 0.421 cm.
More difficulties were encountered in the measurement of blazers dimensions, with the largest errors (MAE = 1.826) predicting the width of shoulders. However, the sleeves are measured quite accurately (MAE = 0.652), even though the same blazers’ key point (1) is used in the algorithm. However, it should also be considered that such errors may occur due to measurement inaccuracies, as the algorithm for converting pixels to centimetres with different coefficients gives more accurate results. The highest errors in the measurement of the jacket shoulders can also be explained by the complexity of the jacket image set, which includes some cases where the shoulders are difficult to determine due to the small size of the mannequin, and the colour of the jacket, etc. A similar situation is seen with the skirts’ length measurements, where about 15% of them have tassels, a translucent top layer, a crooked cut and other issues (see Figure 7).

4. Discussion

For more extensive experimental purposes, three other convolutional neural network (CNN) models have been examined, namely MobileNetV2 [39], ResNet50 [40] and DeepPose [41] (see Figure 8). All models were trained with the same dataset and for the same time. Some models have employed pretrained weights while others used fixed, not trainable backbone part of neural network. Table 4 presents the experimental results including similarity metrics. Therefore, some widely accepted quantitative metrics are used in the study to measure the similarity between two images [42,43]. Mean squared error (MSE) is commonly used to estimate the difference between two images by directly computing the variation in pixel values. The smaller value of MSE represents better similarity. Its value is defined as:
MSE = ( x , y ) = sum ( L ) , L = { l 1 , , l N } , l n = x n y n 2 ,
where N is the batch size, x and y are tensors of arbitrary shapes with a total of n elements each and the reduction is the sum operation.
From the results, we can notice that the MobileNetV2 fully trained model has provided better results (MSE loss = 0.009 and Dice = 0.985) compared to the fixed MobileNetV2 model using pretrained data. The worst results have been achieved using DeepPose with MSE loss = 0.039, Dice = 0.935, Dice loss = 0.065 and RMSE = 0.190.
Clothing segmentation allows identifying the garment’s location and distinguishing it from other objects in the photos. However the key points detection approach can be used not after the segmentation, but instead of segmentation, thus omitting one step and facilitating the calculation of dimensions [44]. Determining the coordinates of tens of points is an easier task than classifying all the pixels in a photo. This allows the use of a smaller artificial neural network model and an output layer with fewer neurons. A few instances of the results of predicted key points positions are provided in Figure 8.

4.1. Limitations

The main drawback of our solution is that the developed algorithm cannot adapt to the different conditions that occur on exceptional terms when a garment mask is created poorly. Uneven edges and unfilled cavities can corrupt the results or completely stop the operation of the algorithm, as finding some points is necessary to calculate the final results for all dimensions of the garment. For this reason, we believe that a multi-level prediction could be more appropriate. The first step in creating a mask is to set the points according to the type of clothing and a simple algorithm to determine the distance between the points. This allows calculating the dimensions of garments if garments are photographed at the same distance and with the same camera. Since the ratio of pixels to centimetres does not change in the photos, the only thing needed is to measure a constant or train a neural network model. However, experimentation has shown that it is difficult to ensure exactly the same experimental conditions, such as the distance, angle, lens and resolution of the camera. One possible solution is to capture the garment together with an object of a fixed size. This could be a credit card, a geometric shape of a certain size, for example, a square, etc. These objects should also be recognized in the image and used for scaling. However, even universally sized objects (e.g., bank cards) can have different colours, reflected in the photograph, blending in with the clothing, which causes additional problems. For these reasons, printed templates are often used for scaling. They are easy to recognize in photographs and can be used to calculate an accurate scale regardless of the camera, the shooting angle and distance.
The other method of estimating the scale of the object is with an algorithm that utilizes continuous frames to estimate the camera’s pose [45]. This method has been implemented in smartphone apps (e.g., iPhone) thus users can determine object size and scale. However, this approach requires a video or some other references, therefore it is not suitable for scale estimation from clothing images.
The UNet-based solution developed in this study removes extraneous artefacts visible in the image and solves the problem of varying environmental conditions. UNet collects information about the garment position in the photo, which is used in the algorithm as a binary array. With this data, the algorithm can easily identify points on the garment that can be used to calculate the dimensions of the garment. The advantage of this solution is that it is possible to clearly identify the problems that cause the model to predict garment dimensions poorly. Such a division between mask prediction and algorithm makes it possible to achieve high accuracy, expandability and wide applicability. It is a flexible solution that does not require strict environmental conditions, and measurements can be made using different mannequins, photographing clothes on a person, hanging on a hanger or lying down.

4.2. Human Measurement Error

Writing down detailed information about each garment element is manual and time-consuming labour. By correctly identifying main clothing parts, such automated segmentation and measuring system could even improve over human-made measurements. Our empirical experiment has shown that human measurement error can be up to 3 cm, depending on the specific areas of the garment being measured. The experiment involved 20 people aged 22–58 years. Each of them was asked to measure two types of clothes. For skirts, they were asked to provide two dimensions-waist and skirt length, and for men’s jackets-shoulder width, overall jacket length and sleeves length. Even with prior instruction on how and what to measure, errors still occur, for example, up to 3.02 cm in the case of a jacket length measurement (see Figure 9).

5. Conclusions

This paper addresses the problem of automatic measurements of garments dimensions. The proposed solution consists of deep learning-based garment segmentation and the detection of key points needed to measure the main garment dimensions. Different UNet family architectures have been employed for segmentation tasks. The UNet 128 × 128 model with a Dice accuracy of 0.977 has demonstrated the highest accuracy results compared with other UNet models and showed the superiority over the UNet models pre-trained with the additional datasets. The key points detection process has been performed on the predicted masks obtained using the Unet 128 × 128 model. Separate algorithms (for the blazers, skirts and dresses) have been developed in this research to identify general and specific garment key points enabling us to measure the dimensions of the garment. Automatic measurements experiments including three types of garments (blazers, skirts and dresses) have resulted in an average 1.27 cm measurement error for the prediction of the basic measurements of blazers, 0.747 cm for dresses and 1.012 cm for the skirts. The results are promising, given that in the industry a measurement error of up to ∼2 cm is acceptable, while human measurement error can be up to 3.02.
The comparison of existing solutions is quite difficult due to the purpose of the proposed solution itself, diverse environmental conditions, individual datasets or evaluation metrics. Commercial solutions currently available on the market aim to make the process of purchasing clothes easier while reducing the number of returns. Therefore, the first and most important step is to obtain accurate body measurement data by integrating deep learning algorithms and other artificial intelligence techniques. The second objective of such systems (mobile apps) is to provide personalized clothing sizing recommendations to help eliminate sizing problems. Such systems can be called smart shopping assistants with quite clear objectives, including sustainability. The solution proposed in this study focuses on the automated extraction of garment information, i.e., the recognition of the type of garment and the accurate measurement of its dimensions, without being tied to the positioning of the garment (lying down, on a mannequin or on a hanger). One of the key goals of this research is to enable less-standardized garment photography, in contrast to current garment measurement systems which require fixed position setup, calibration, and/or dedicated infrastructure to ensure small error (∼0.318 cm). Although the quality of the photos is certainly important, our solution does not require the highest quality professional photos, so it can be used both in the industry and on online platforms selling second-hand or new clothes (e.g., “Ebay”, “Vinted”). The results presented in this study are related to the most important and challenging aspect of garment information identification—automated garment dimension measurement. However, the potential for extending such a solution is significant. A further objective is to automate the manual entering of all the information about the garment, such as what is the type, colour, size, etc. Moreover, additional solutions could be added to retrieve information from the label, which includes information on fabric composition, garment size and brand. Colour identification is one of the simplest tasks, but it is possible to develop a more sophisticated solution based on unsupervised learning algorithms to automatically identify a few dominant colours (in the case of a multi-coloured or patterned garment), and incorporate an adaptive and broad palette of colours, rather than a fixed and narrowly defined range of colours.

Author Contributions

Conceptualization, A.P.-T.; data curation: R.S.-Z., A.P.-T., I.L.-B. and E.N.; investigation, A.P.-T., V.D., E.N. and R.P.; methodology, A.P.-T., I.L.-B., E.N. and R.P.; software, A.P.-T., E.N., R.P. and I.L.-B.; resources A.P.-T., R.S.-Z., I.L.-B. and E.N.; validation A.P.-T., E.N., V.D. and R.P.; writing—original draft, A.P.-T., R.S.-Z., I.L.-B., V.D., E.N. and R.P.; writing—review and editing, A.P.-T., E.N., R.P. and I.L.-B.; supervision, A.P.-T.; funding acquisition, A.P.-T. and R.S.-Z. All authors have read and agreed to the published version of the manuscript.

Funding

This research was funded by MB (small partnership) NOSELFISH within the framework of the European Union-funded project “Technical Feasibility Study for the Adaptation of an Overlapping Object Detection and Classification System for the Identification of Clothing Characteristics” (No. 01.2.1-MITA-T-851-01-0201).

Institutional Review Board Statement

Not applicable.

Informed Consent Statement

Informed consent was obtained from all subjects involved in the study.

Data Availability Statement

The data are not publicly available due to commercial sensitivity and data privacy.

Conflicts of Interest

The authors declare no conflict of interest.

References

  1. Kumar, S.N.; Fred, A.L.; Varghese, P.S. An Overview of Segmentation Algorithms for the Analysis of Anomalies on Medical Images. J. Intell. Syst. 2020, 29, 612–625. [Google Scholar] [CrossRef]
  2. Cao, C.; Liu, F.; Tan, H.; Song, D.; Shu, W.; Li, W.; Zhou, Y.; Bo, X.; Xie, Z. Deep Learning and Its Applications in Biomedicine. Genom. Proteom. Bioinform. 2018, 16, 17–32. [Google Scholar] [CrossRef] [PubMed]
  3. Tang, Y.; Zhu, M.; Chen, Z.; Wu, C.; Chen, B.; Li, C.; Li, L. Seismic performance evaluation of recycled aggregate concrete-filled steel tubular columns with field strain detected via a novel mark-free vision method. Structures 2022, 37, 426–441. [Google Scholar] [CrossRef]
  4. Wu, F.; Duan, J.; Chen, S.; Ye, Y.; Ai, P.; Yang, Z. Multi-Target Recognition of Bananas and Automatic Positioning for the Inflorescence Axis Cutting Point. Front. Plant Sci. 2021, 12, 705021. [Google Scholar] [CrossRef]
  5. Gui, J.; Fei, J.; Wu, Z.; Fu, X.; Diakite, A. Grading method of soybean mosaic disease based on hyperspectral imaging technology. Inf. Process. Agric. 2021, 8, 380–385. [Google Scholar] [CrossRef]
  6. Chen, Z.; Wu, R.; Lin, Y.; Li, C.; Chen, S.; Yuan, Z.; Chen, S.; Zou, X. Plant Disease Recognition Model Based on Improved YOLOv5. Agronomy 2022, 12, 365. [Google Scholar] [CrossRef]
  7. Krishnamoorthy, N.; Prasad, L.N.; Kumar, C.P.; Subedi, B.; Abraha, H.B.; Sathishkumar, V.E. Rice leaf diseases prediction using deep neural networks with transfer learning. Environ. Res. 2021, 198, 111275. [Google Scholar] [CrossRef]
  8. Yang, J.; Li, S.; Wang, Z.; Dong, H.; Wang, J.; Tang, S. Using Deep Learning to Detect Defects in Manufacturing: A Comprehensive Survey and Current Challenges. Materials 2020, 13, 5755. [Google Scholar] [CrossRef]
  9. Pan, C.; Schoppe, O.; Parra-Damas, A.; Cai, R.; Todorov, M.I.; Gondi, G.; von Neubeck, B.; Böğürcü-Seidel, N.; Seidel, S.; Sleiman, K.; et al. Deep Learning Reveals Cancer Metastasis and Therapeutic Antibody Targeting in the Entire Body. Cell 2019, 179, 1661–1676.e19. [Google Scholar] [CrossRef]
  10. Xu, Y.; Hosny, A.; Zeleznik, R.; Parmar, C.; Coroller, T.; Franco, I.; Mak, R.H.; Aerts, H.J. Deep Learning Predicts Lung Cancer Treatment Response from Serial Medical Imaging. Clin. Cancer Res. 2019, 25, 3266–3275. [Google Scholar] [CrossRef] [Green Version]
  11. Vidas, R.; Agne, P.T.; Kristina, S.; Domas, J. Towards the automation of early-stage human embryo development detection. Biomed. Eng. 2019, 18, 1–21. [Google Scholar] [CrossRef] [Green Version]
  12. Tan, F.; Xia, Z.; Ma, Y.; Feng, X. 3D Sensor Based Pedestrian Detection by Integrating Improved HHA Encoding and Two-Branch Feature Fusion. Remote Sens. 2022, 14, 645. [Google Scholar] [CrossRef]
  13. Wang, J.; Yu, X.; Liu, Q.; Yang, Z. Research on key technologies of intelligent transportation based on image recognition and anti-fatigue driving. EURASIP J. Image Video Process. 2019, 33. [Google Scholar] [CrossRef]
  14. Gabas, A.; Corona, E.; Alenya, G.; Torras, C. Robot-Aided Cloth Classification Using Depth Information and CNNs. In Articulated Motion and Deformable; Perales, F.J., Kittler, J., Eds.; Springer International Publishing: Cham, Switzerland, 2016; pp. 16–23. [Google Scholar] [CrossRef]
  15. Nayak, R.; Padhye, R. 1-Introduction to Automation in Garment Manufacturing; Automation in Garment Manufacturing; Woodhead Publishing: Boca Raton, FL, USA, 2018; pp. 1–27. [Google Scholar] [CrossRef]
  16. A Report: Study of the Automatic Garment Measurement, Robocoast, Leverage from EU 2014-2020, Aarila-Dots Oy. 2019. pp. 1–13. Available online: https://new.robocoast.eu/wp-content/uploads/2020/09/Feasibility-study-Automatic-garment-measurement_Aarila-Dots.pdf (accessed on 5 February 2022).
  17. Xiang, J.; Dong, T.; Pan, R.; Gao, W. Clothing Attribute Recognition Based on RCNN Framework Using L-Softmax Loss. IEEE Access 2020, 8, 48299–48313. [Google Scholar] [CrossRef]
  18. Ihsan, A.M.; Loo, C.K.; Naji, S.A.; Seera, M. Superpixels Features Extractor Network (SP-FEN) for Clothing Parsing Enhancement. Neural Process. Lett. 2020, 51, 2245–2263. [Google Scholar] [CrossRef]
  19. Li, C.; Xu, Y.; Xiao, Y.; Liu, H.; Feng, M.; Zhang, D. Automatic Measurement of Garment Sizes Using Image Recognition. In Proceedings of the International Conference on Graphics and Signal Processing; Association for Computing Machinery: New York, NY, USA, 2017; ICGSP ’17; pp. 30–34. [Google Scholar]
  20. Brian, C.; Tj, T. Photo Based Clothing Measurements|Stitch Fix Technology—Multithreaded. Available online: https://multithreaded.stitchfix.com/blog/2016/09/30/photo-based-clothing-measurement/ (accessed on 10 February 2022).
  21. Cao, L.; Jiang, Y.; Jiang, M. Automatic measurement of garment dimensions using machine vision. In Proceedings of the 2010 International Conference on Computer Application and System Modeling (ICCASM 2010), Taiyuan, China, 22–24 October 2010; Volume 9, pp. 9–33. [Google Scholar] [CrossRef]
  22. Tailored-Garment Measuring App. 2022. Available online: https://www.thetailoredco.com/ (accessed on 4 March 2022).
  23. Zhou, S.; Nie, D.; Adeli, E.; Yin, J.; Lian, J.; Shen, D. High-Resolution Encoder–Decoder Networks for Low-Contrast Medical Image Segmentation. IEEE Trans. Image Process. 2020, 29, 461–475. [Google Scholar] [CrossRef]
  24. Hu, C.; Sapkota, B.B.; Thomasson, J.A.; Bagavathiannan, M.V. Influence of Image Quality and Light Consistency on the Performance of Convolutional Neural Networks for Weed Mapping. Remote Sens. 2021, 13, 2140. [Google Scholar] [CrossRef]
  25. Ge, Y.; Zhang, R.; Wu, L.; Wang, X.; Tang, X.; Luo, P. A Versatile Benchmark for Detection, Pose Estimation, Segmentation and Re-Identification of Clothing Images. arXiv 2019, arXiv:1901.07973. [Google Scholar]
  26. Adaloglouon, N. An Overview of Unet Architectures for Semantic Segmentation and Biomedical Image Segmentation. 2021. Available online: https://theaisummer.com/unet-architectures/ (accessed on 9 January 2022).
  27. Ronneberger, O.; Fischer, P.; Brox, T. U-Net: Convolutional Networks for Biomedical Image Segmentation. In Medical Image Computing and Computer-Assisted Intervention—MICCAI 2015; Springer: Cham, Switzerland, 2015; pp. 234–241. [Google Scholar] [CrossRef] [Green Version]
  28. Jing, J.; Wang, Z.; Ratsch, M.; Zhang, H. Mobile-Unet: An efficient convolutional neural network for fabric defect detection. Text. Res. J. 2020, 92, 30–42. [Google Scholar] [CrossRef]
  29. Roy, K.; Chaudhuri, S.S.; Pramanik, S. Deep learning based real-time Industrial framework for rotten and fresh fruit detection using semantic segmentation. Microsyst. Technol. 2021, 27, 3365–3375. [Google Scholar] [CrossRef]
  30. Wang, A.; Togo, R.; Ogawa, T.; Haseyama, M. Defect Detection of Subway Tunnels Using Advanced U-Net Network. Sensors 2022, 22, 2330. [Google Scholar] [CrossRef] [PubMed]
  31. Wang, Z.; Wang, E.; Zhu, Y. Image segmentation evaluation: A survey of methods. Artif. Intell. Rev. 2020, 53, 5637–5674. [Google Scholar] [CrossRef]
  32. Taha, A.A.; Hanbury, A. Metrics for evaluating 3D medical image segmentation: Analysis, selection, and tool. BMC Med. Imaging 2015, 15, 29. [Google Scholar] [CrossRef] [PubMed] [Green Version]
  33. Yao, A.D.; Cheng, D.L.; Pan, I.; Kitamura, F. Deep Learning in Neuroradiology: A Systematic Review of Current Algorithms and Approaches for the New Wave of Imaging Technology. Radiol. Artif. Intell. 2020, 2, e190026. [Google Scholar] [CrossRef]
  34. Ding, L.; Goshtasby, A. On the Canny edge detector. Pattern Recognit. 2001, 34, 721–725. [Google Scholar] [CrossRef]
  35. Vincent, O.R.; Folorunso, O. A Descriptive Algorithm for Sobel Image Edge Detection. In Proceedings of the Informing Science & IT Education Conference, Macon, GA, USA, 12–15 June 2009; pp. 1–11. [Google Scholar]
  36. Burney, S.M.A.; Tariq, H. K-Means Cluster Analysis for Image Segmentation. Int. J. Comput. Appl. 2014, 96, 1–8. [Google Scholar]
  37. Dhanachandra, N.; Manglem, K.; JinaChanu, Y. Image Segmentation Using K-means Clustering Algorithm and Subtractive Clustering Algorithm. Procedia Comput. Sci. 2015, 54, 764–771. [Google Scholar] [CrossRef] [Green Version]
  38. Zheng, X.; Lei, Q.; Yao, R.; Gong, Y.; Yin, Q. Image segmentation based on adaptive K-means algorithm. EURASIP J. Image Video Process. 2018, 68, 1–10. [Google Scholar] [CrossRef]
  39. Sandler, M.; Howard, A.; Zhu, M.; Zhmoginov, A.; Chen, L.C. MobileNetV2: Inverted Residuals and Linear Bottlenecks. In Proceedings of the 2018 IEEE/CVF Conference on Computer Vision and Pattern Recognition, Salt Lake City, UT, USA, 18–23 June 2018; pp. 4510–4520. [Google Scholar] [CrossRef] [Green Version]
  40. He, K.; Zhang, X.; Ren, S.; Sun, J. Deep Residual Learning for Image Recognition. In Proceedings of the IEEE Conference on Computer Vision and Pattern Recognition, Las Vegas, NV, USA, 27–30 June 2016; pp. 770–778. [Google Scholar]
  41. Toshev, A.; Szegedy, C. DeepPose: Human Pose Estimation via Deep Neural Networks. In Proceedings of the 2014 IEEE Conference on Computer Vision and Pattern Recognition, Columbus, OH, USA, 23–28 June 2014; pp. 1653–1660. [Google Scholar] [CrossRef] [Green Version]
  42. Jadon, S. A survey of loss functions for semantic segmentation. In Proceedings of the 2020 IEEE Conference on Computational Intelligence in Bioinformatics and Computational Biology (CIBCB), Via del Mar, Chile, 27–29 October 2020; pp. 1–6. [Google Scholar] [CrossRef]
  43. Ma, J.; Chen, J.; Ng, M.; Huang, R.; Li, Y.; Li, C.; Yang, X.; Martel, A.L. Loss odyssey in medical image segmentation. Med. Image Anal. 2021, 71, 102035. [Google Scholar] [CrossRef]
  44. Qian, S.; Lian, D.; Zhao, B.; Liu, T.; Zhu, B.; Li, H.; Gao, S. KGDet: Keypoint-Guided Fashion Detection. Proc. Aaai Conf. Artif. Intell. 2021, 35, 2449–2457. [Google Scholar]
  45. Lu, Y. Automatically Measure Your Clothes on a Smartphone with AR, Mercari Engineering. 2022. Available online: https://engineering.mercari.com/en/blog/entry/2020-06-19-150222/ (accessed on 5 January 2022).
Figure 1. UNet model architecture used for clothes segmentation task.
Applsci 12 04470 g001
Figure 2. The basic key points of measurements for different type of garment: (a) blazer with 12 key points, (b) skirt with 4 key points and (c) dress with 6 key points.
Applsci 12 04470 g002
Figure 3. Results of different contour detection techniques: Canny algorithm with predefined threshold values, Sobel algorithm and K-means based thresholding algorithm providing edge and mask images.
Applsci 12 04470 g003
Figure 4. Different Unet models’ segmentation results for selected clothes: skirt, jacket and dress.
Applsci 12 04470 g004
Figure 5. Dice coefficient value variation during the training process of different UNet architectures (with augmentation and without denoted maximum coefficient values).
Applsci 12 04470 g005
Figure 6. The instances of measurements predicted key points for different types of garments: (a) blazer, (b) skirt and (c) dress.
Applsci 12 04470 g006
Figure 7. Examples of specific cases: (a) in the blazers dataset regarding to shoulders line and (b) in skirts dataset regarding to the bottom line.
Applsci 12 04470 g007
Figure 8. The comparison of different CNN architectures for keypoints detection.
Applsci 12 04470 g008
Figure 9. The error of manual measurement for two different types of clothes: skirts and men’s jackets.
Applsci 12 04470 g009
Table 1. UNet models with different pre-trained datasets.
UNet ModelPretraining Dataset
UNetDeepFashion2+ our dataset
UNetCarvana + our dataset
UNetour dataset
UNet 128 × 128our dataset
UNet 256 × 256our dataset
UNet 512 × 512our dataset
Table 2. Different UNet models’ 5 run validation results including maximum and average values of Dice coefficients.
With AugmentationWithout Augmentation
UNet ModelMAX DiceAVG DiceMAX DiceAVG Dice
UNet0.9180.8040.9190.852
UNet (DeepFashion2)0.9060.8570.8250.824
UNet (Carvana)0.8910.8350.8790.827
UNet 128 × 1280.9790.9170.9430.899
UNet 256 × 2560.9760.8180.9220.818
UNet 512 × 5120.9710.8650.9060.855
Table 3. Garment measurement errors given in centimetres.
Total LengthWaistShouldersSleevesAverage Error
Dresses1.1130.3430.783-0.747
Blazers0.903-1.8260.6521.127
Skirts1.6500.421--1.012
Table 4. Values of accuracy metrics.
ModelMSE LossDiceDice LossRMSE
MobileNetV2 (fixed)0.0320.9440.0560.186
ResNet50 (fixed)0.0320.9480.0520.181
MobileNetV20.0090.9850.0150.095
ResNet500.0220.9620.0380.150
DeepPose0.0390.9350.0650.199
Publisher’s Note: MDPI stays neutral with regard to jurisdictional claims in published maps and institutional affiliations.

