Article

Numerical Study on the Effect of Large Deep Foundation Excavation on Underlying Complex Intersecting Tunnels

1
Jiangsu Non-Ferrous Metals Huadong Geological Survey Bureau 807 Team, Nanjing 211109, China
2
Nanjing Exploration Engineering Co., Ltd., Nanjing 211109, China
3
School of Civil Engineering, Southeast University, Nanjing 211189, China
*
Author to whom correspondence should be addressed.
Submission received: 4 April 2022 / Revised: 24 April 2022 / Accepted: 26 April 2022 / Published: 29 April 2022
(This article belongs to the Special Issue Recent Progress on Advanced Foundation Engineering)

Abstract

:
The effect of large deep foundation excavations on the surrounding existing tunnels is a problem that cannot be avoided in the current construction background. This effect is difficult to assess precisely, especially when the geometry of the tunnels and pits is complex. In this paper, a three-dimensional (3D) finite element model has been developed based on a case containing four complex intersecting tunnels and a large deep foundation pit. The model used the hardening soil model with small-strain stiffness (HSS) and the Hoek–Brown (HB) model to describe the mechanical properties of the soil and rock, and various methods including the standard penetration test (SPT) and heavy dynamic penetration test (HDPT) were used to determine the model parameters. The results of the analysis are as follows: the excavation of the foundation pit caused the tunnels to heave and the heave deformation conforms to the normal distribution; the maximum heave of numerical simulation is 3.1 mm which is consistent with the field data; the horizontal displacement, horizontal convergence, and vertical convergence of the tunnels caused by the excavation of the pits are small, and all kinds of deformations meet the control requirements; the intersection of multiple tunnels shows obvious stress concentration when the tunnels were constructed, and the lining stress slightly decreases as excavation progresses.

1. Introduction

With the expansion and renovation of cities, it is common to excavate deep foundation pits around existing tunnels. The construction of the pits inevitably has an effect on tunnels, and it is difficult to accurately assess whether this effect is within acceptable limits [1,2,3,4,5]. Even in similar cases, tunnels may respond differently. Tan et al. observed settlement of the tunnel after excavation [6], while Liu et al. observed substantial tunnel heave [7]. An increase in tunnel lining stress or excessive displacement can cause cracking, leakage, train speed reduction, and even collapse, so an accurate assessment of the effect of excavation on the tunnels is very important [8,9].
Over the years, many scholars have used theoretical analysis and numerical simulation to study the effect of excavation on tunnels and have had fruitful results. Among the existing theoretical methods, the elastic foundation beams theory is the most widely used [10]. Its basic principle is to simplify the tunnel as an elastic foundation beam to calculate the tunnel deformation, and the excavation is simplified as unloading [11]. The unloading is determined by the Boussinesq or Mindlin theoretical stress solution [12,13]. However, using the theoretical method, it is difficult to calculate the tunnel deformation response in non-uniform soil strata, so many scholars use numerical simulation to study this problem. Li et al. established a 3D model for the excavation of the Shanghai subway tunnel and the foundation pits are adjacent to the subway station [14]. The numerical results are in good agreement with the field data. Yang et al. used the finite element method to study the effect of excavation sequence on tunnel heave [15]. Wang et al. studied the effect in sand and cobble strata [16]. Shi et al. developed a simplified method to calculate tunnel deformation and additional stress based on finite element calculation results [17]. Moreover, for planar problems, a large number of two-dimensional models were developed [11,18,19,20]. However, most of the tunnel axes in the above studies are straight, and the deformation and stress response of intersecting curving tunnels are less studied. The complexity of the shape of tunnels makes it more difficult to predict the effect of excavation on the tunnels.
In this paper, a 3D numerical model is established through the finite element software PLAXIS3D V20, based on a case of the tunnel hub of Nanjing metro line 2. Four tunnels are under the excavation pits and intersect each other with a complex shape. Advanced constitutive models, HSS and HB models, and input parameter determination methods are applied in this study. The numerical analysis results are compared with the field data. Attention is paid to the analysis of displacement characteristics and stress changes in the tunnel under the effect of excavation. This study will deepen the understanding of the effect of foundation excavation on intersecting tunnels, optimize monitoring arrangements, and provide a basis for excavation for an increasing number of similar projects in the future.

2. Background

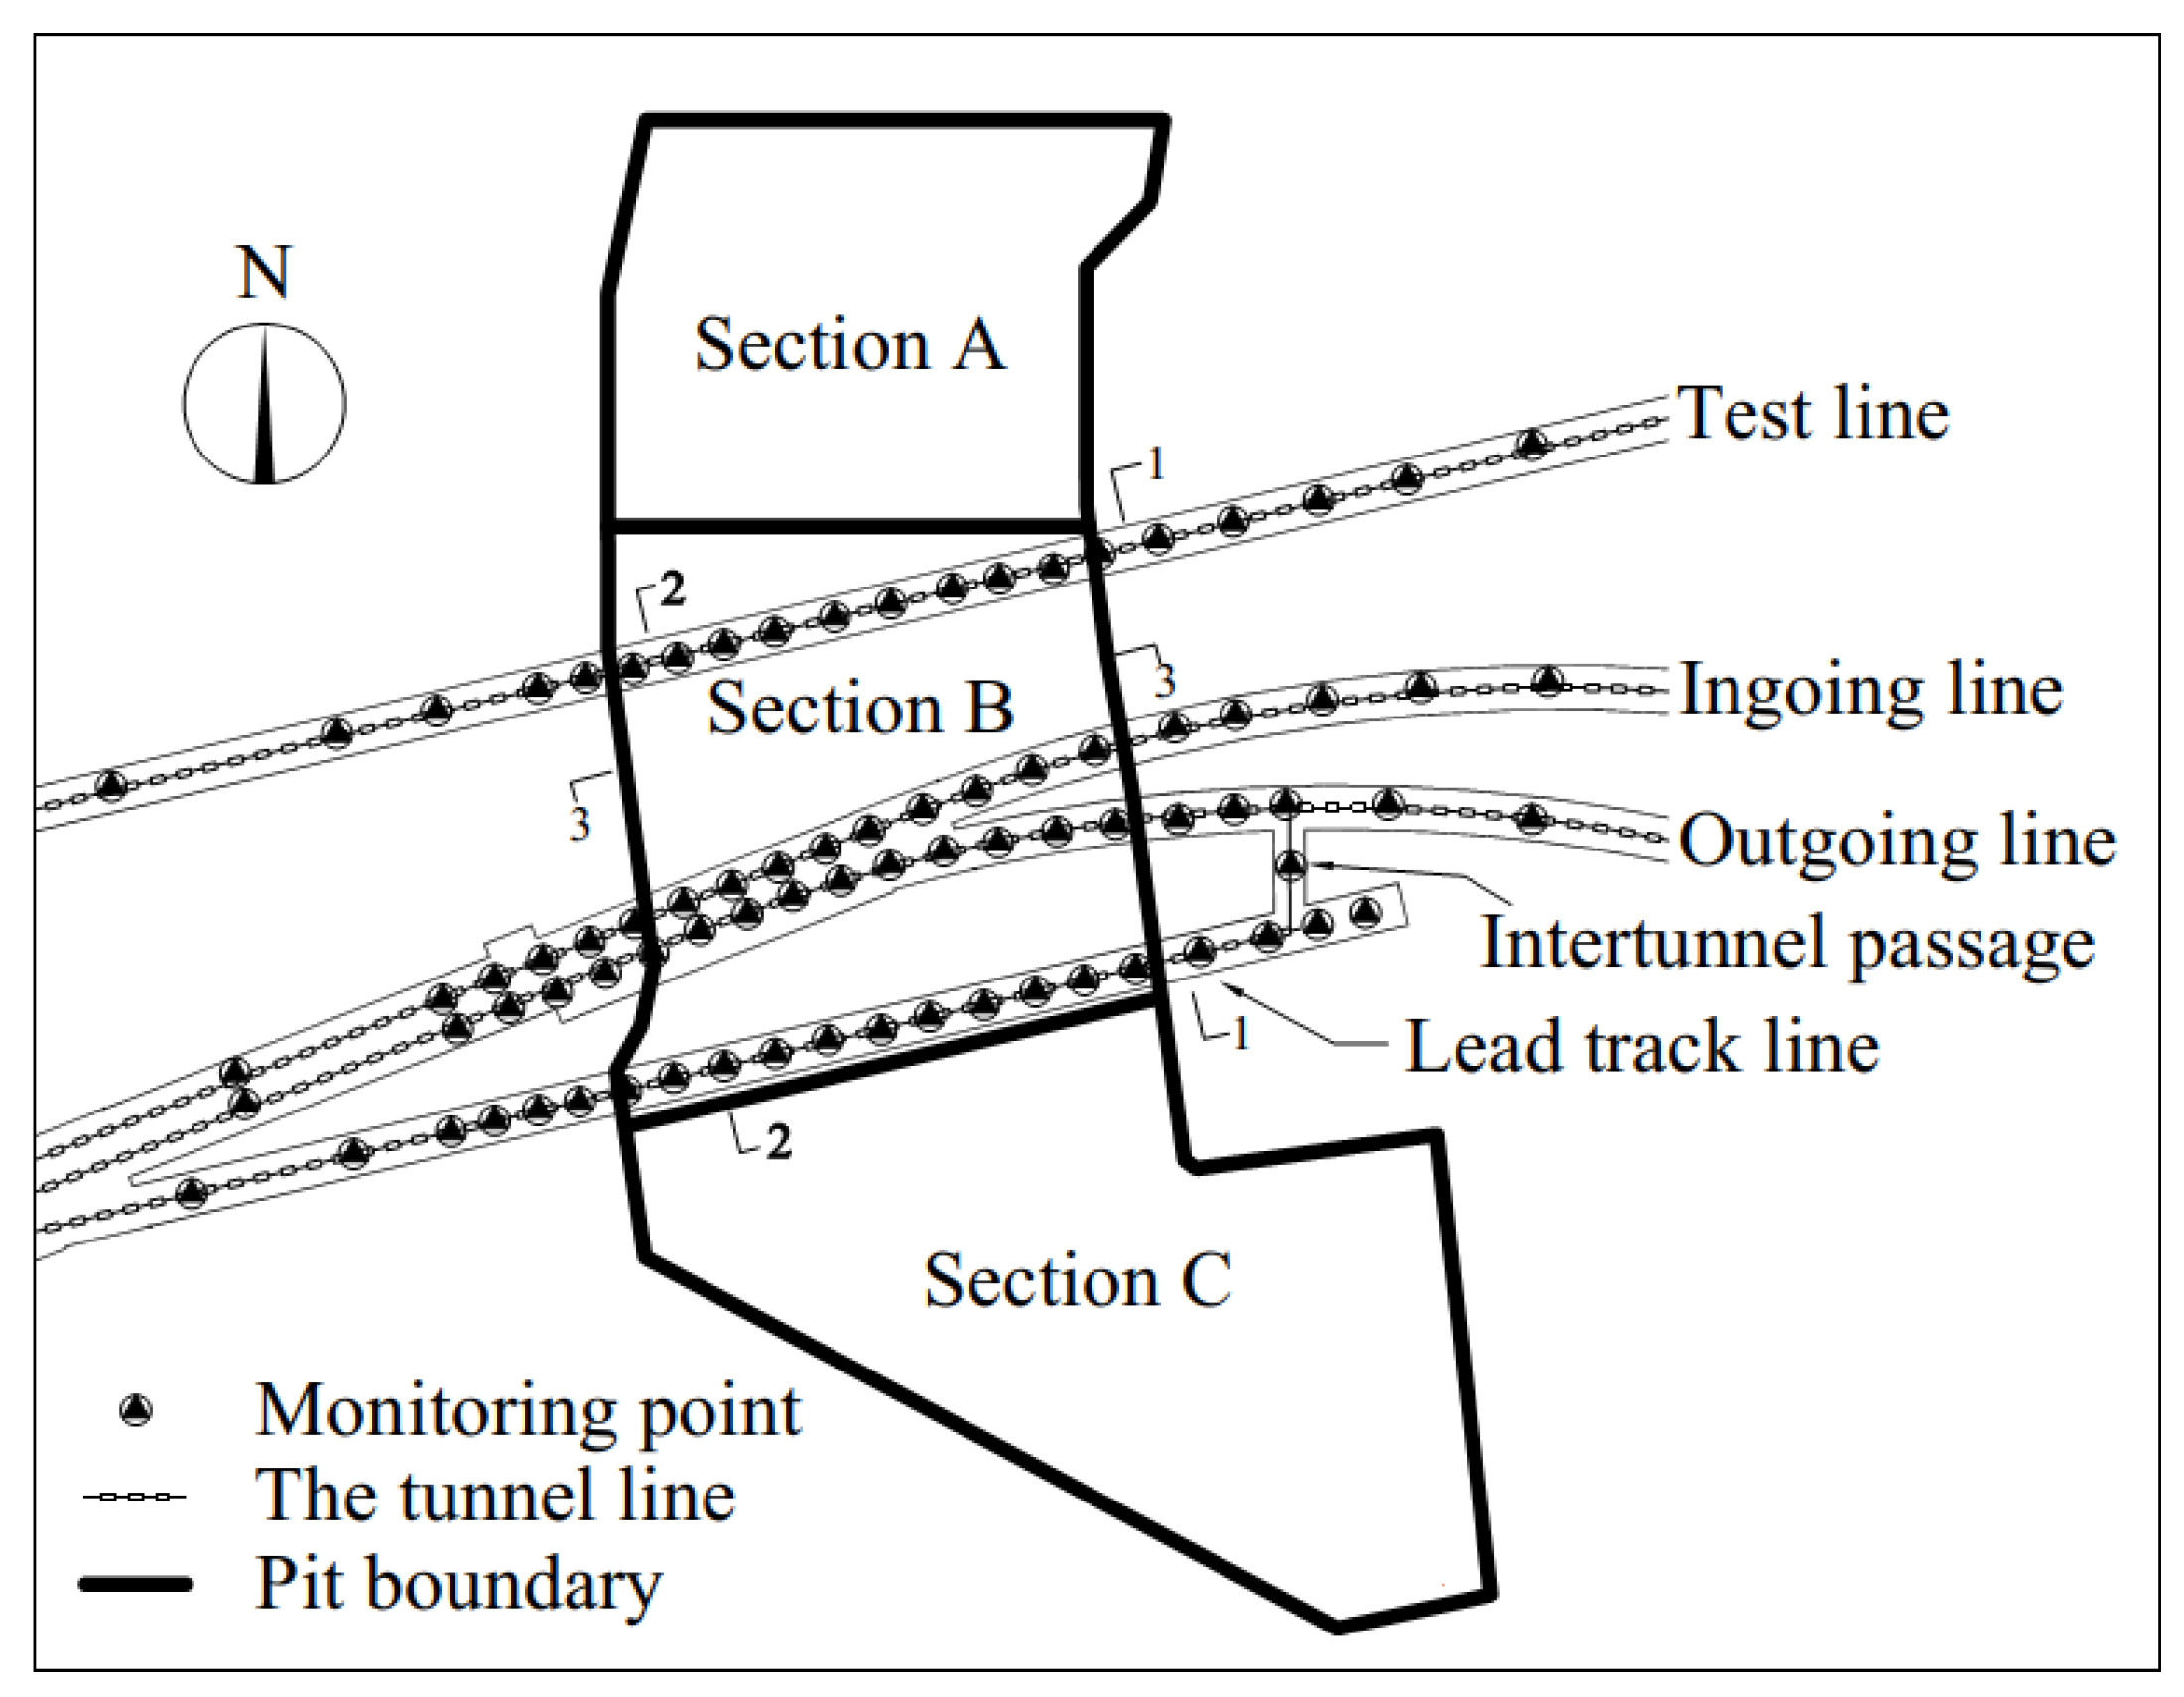
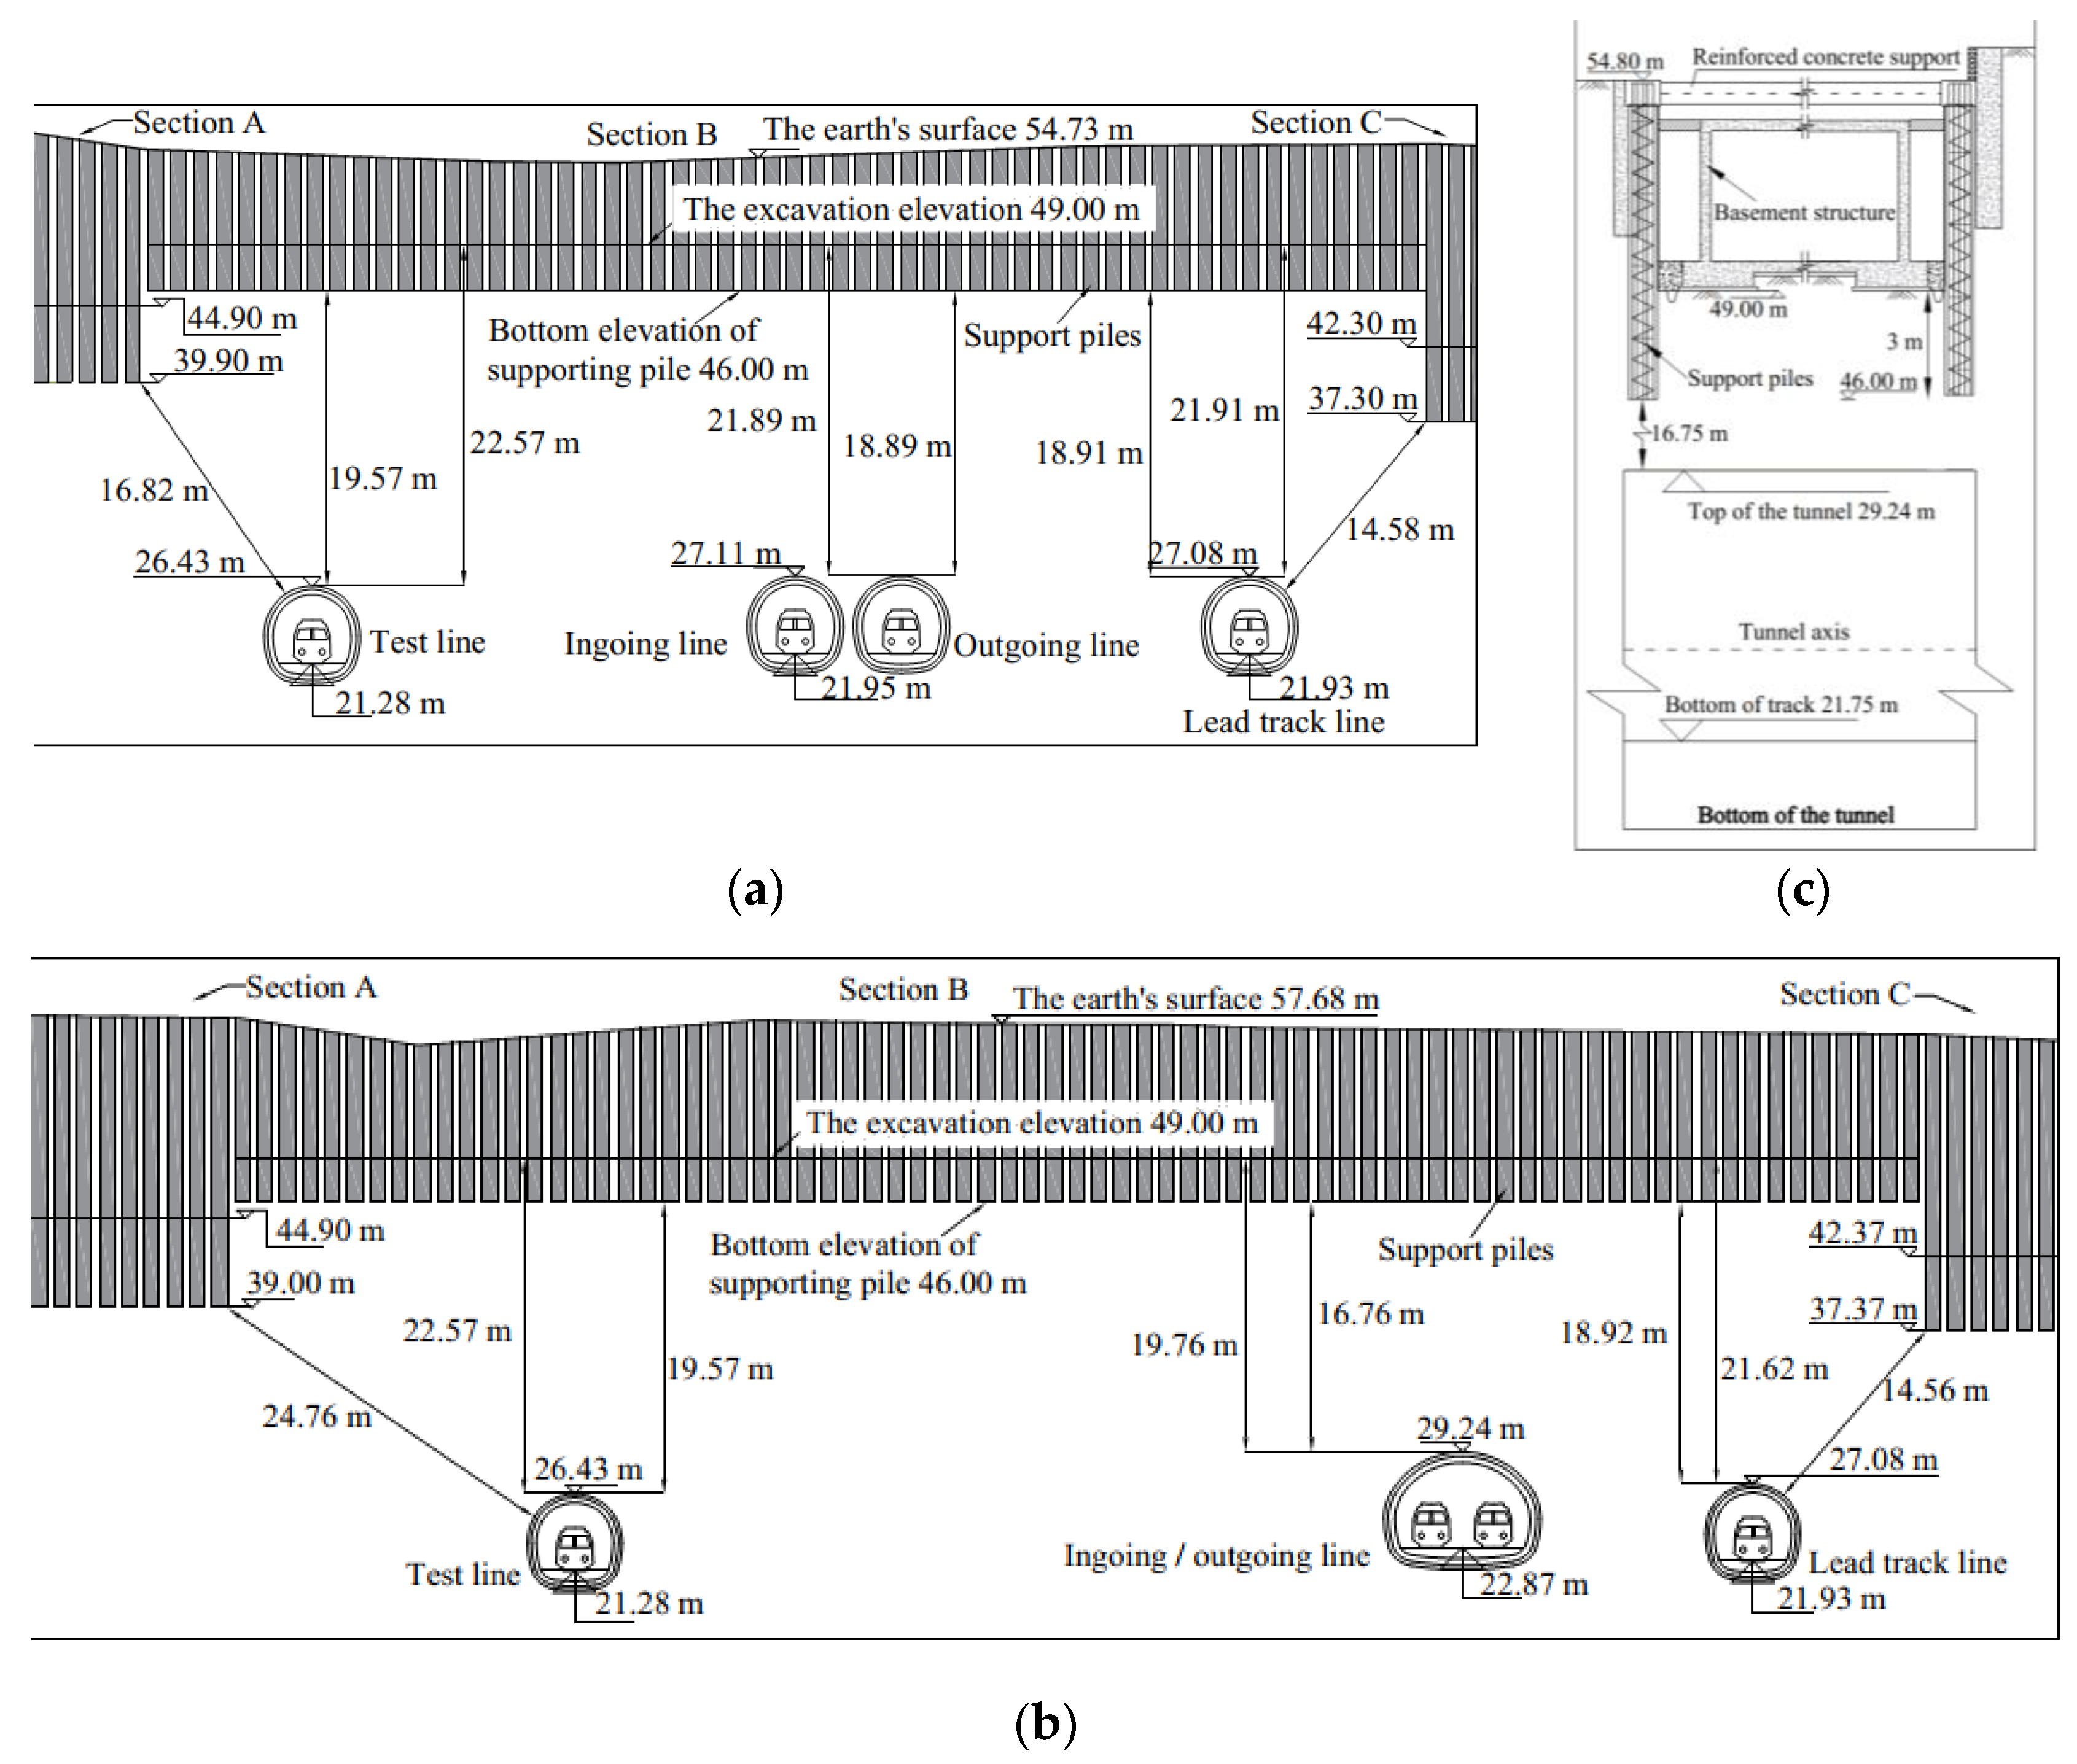
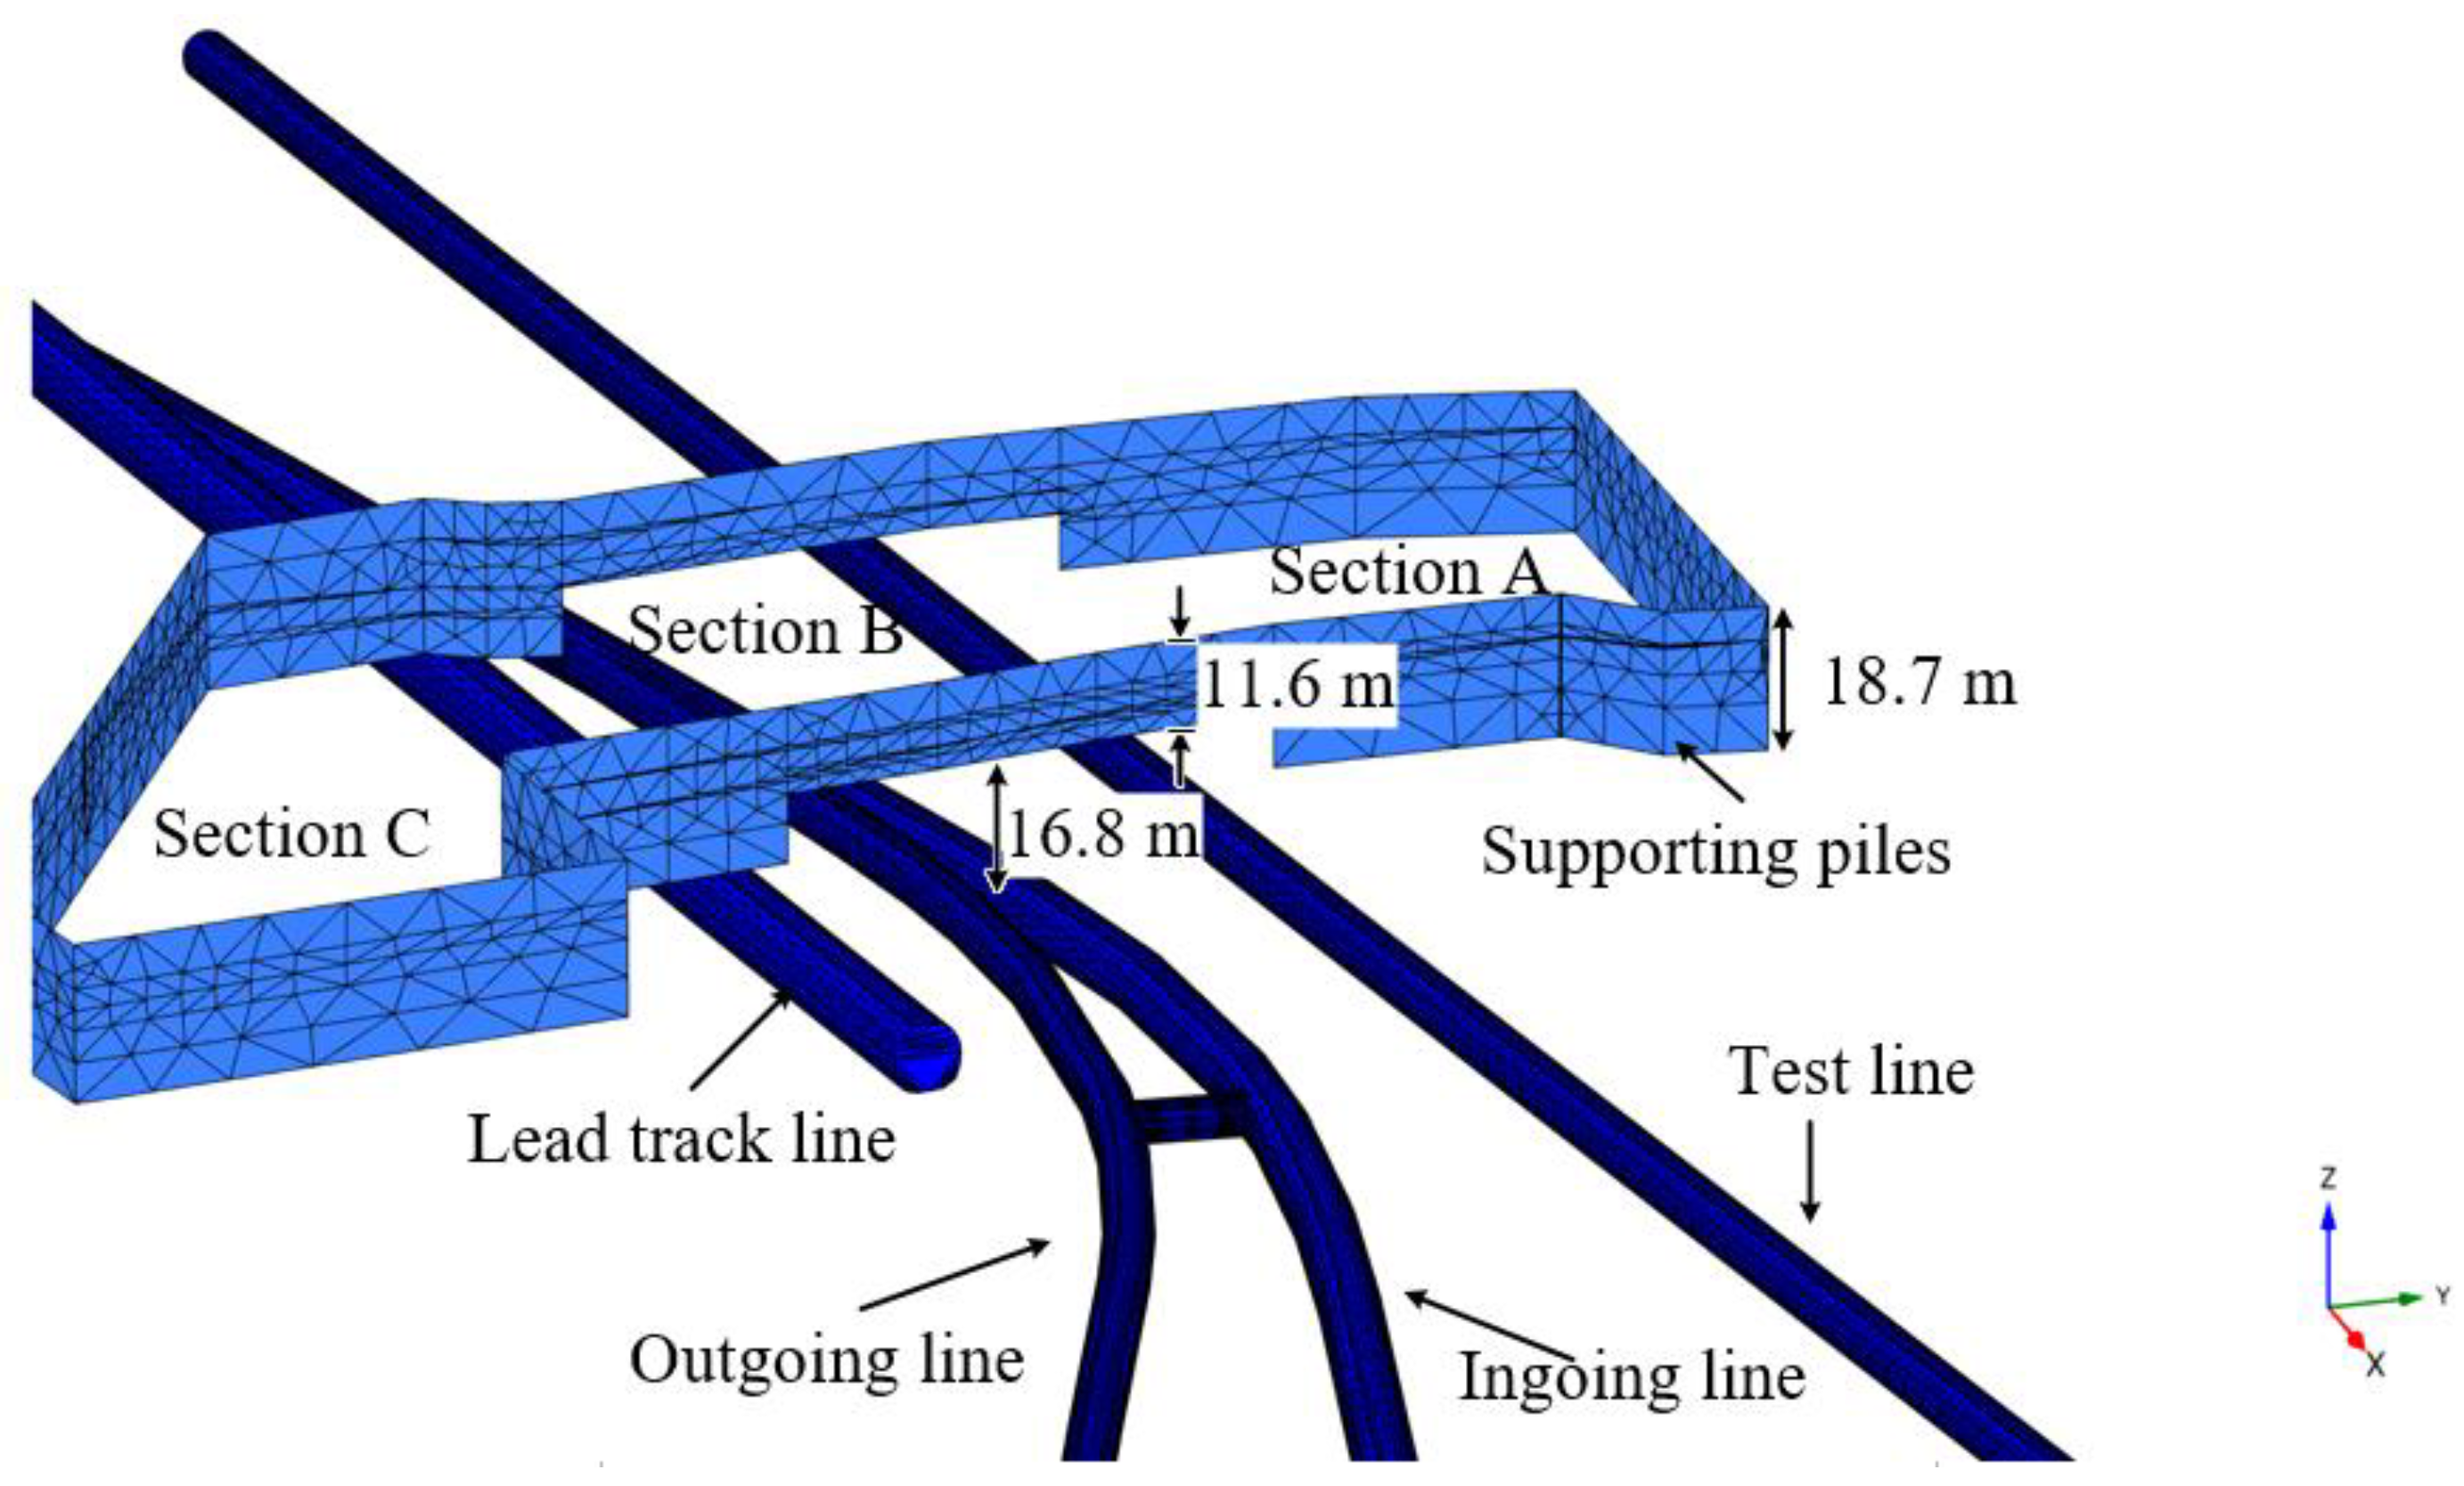
2.1. Excavation and the Metro Line

The hub of Nanjing metro line 2 has four tunnels including the test line, outgoing line, ingoing line, and the lead track line. The outgoing, ingoing, and lead track lines intersect at a small angle. The outgoing and lead track lines are connected by an additional passage. The tunnel size becomes larger at the intersections, where the test and lead track lines are straight and the outgoing and ingoing lines are curved. A large, irregularly shaped pit with a width of 82 m and a length of 225 m exists above four tunnels. The pit was excavated in three sequential sections. The plan layout of the pit and the tunnel is shown in Figure 1. As the pit is close to the tunnels, the soil displacement caused by the excavation is likely to influence the tunnels, so the deformation of the tunnel is monitored during the construction process. A total of 62 monitoring points were deployed to measure the vertical displacement, horizontal displacement, vertical convergence, and horizontal convergence of the tunnel lining. The excavation sequence of the pit is illustrated in Table 1. Sections A and C were excavated deeper than the basement of the main building, while section B was shallower because it is closest to the tunnels. The foundation pit used rotary grouted piles as a retaining structure, and the piles are 1100 mm in diameter and 1300 mm apart. The pile length is 8.73 m~20.38 m, the excavation depth is 5.73 m~15.38 m, and the tops of the piles are connected by crown beams.
Figure 2 shows three typical profiles in construction, profiles 1–1 and 2–2 show the layout of the eastern and western parts of the foundation pit respectively. The tunnel profile is irregularly circular, with a minimum width of 6.3 m and a maximum width of 10.4 m, a minimum height of 6.6 m, and a maximum height of 7.8 m. The shortest distance from the tunnel to the support piles and the pit bottom is 14.56 m and 19.76 m, respectively. A layer of reinforced concrete support exists on top of some of the support piles, and profile 3–3 shows the relationship between this support, pit, and tunnels.

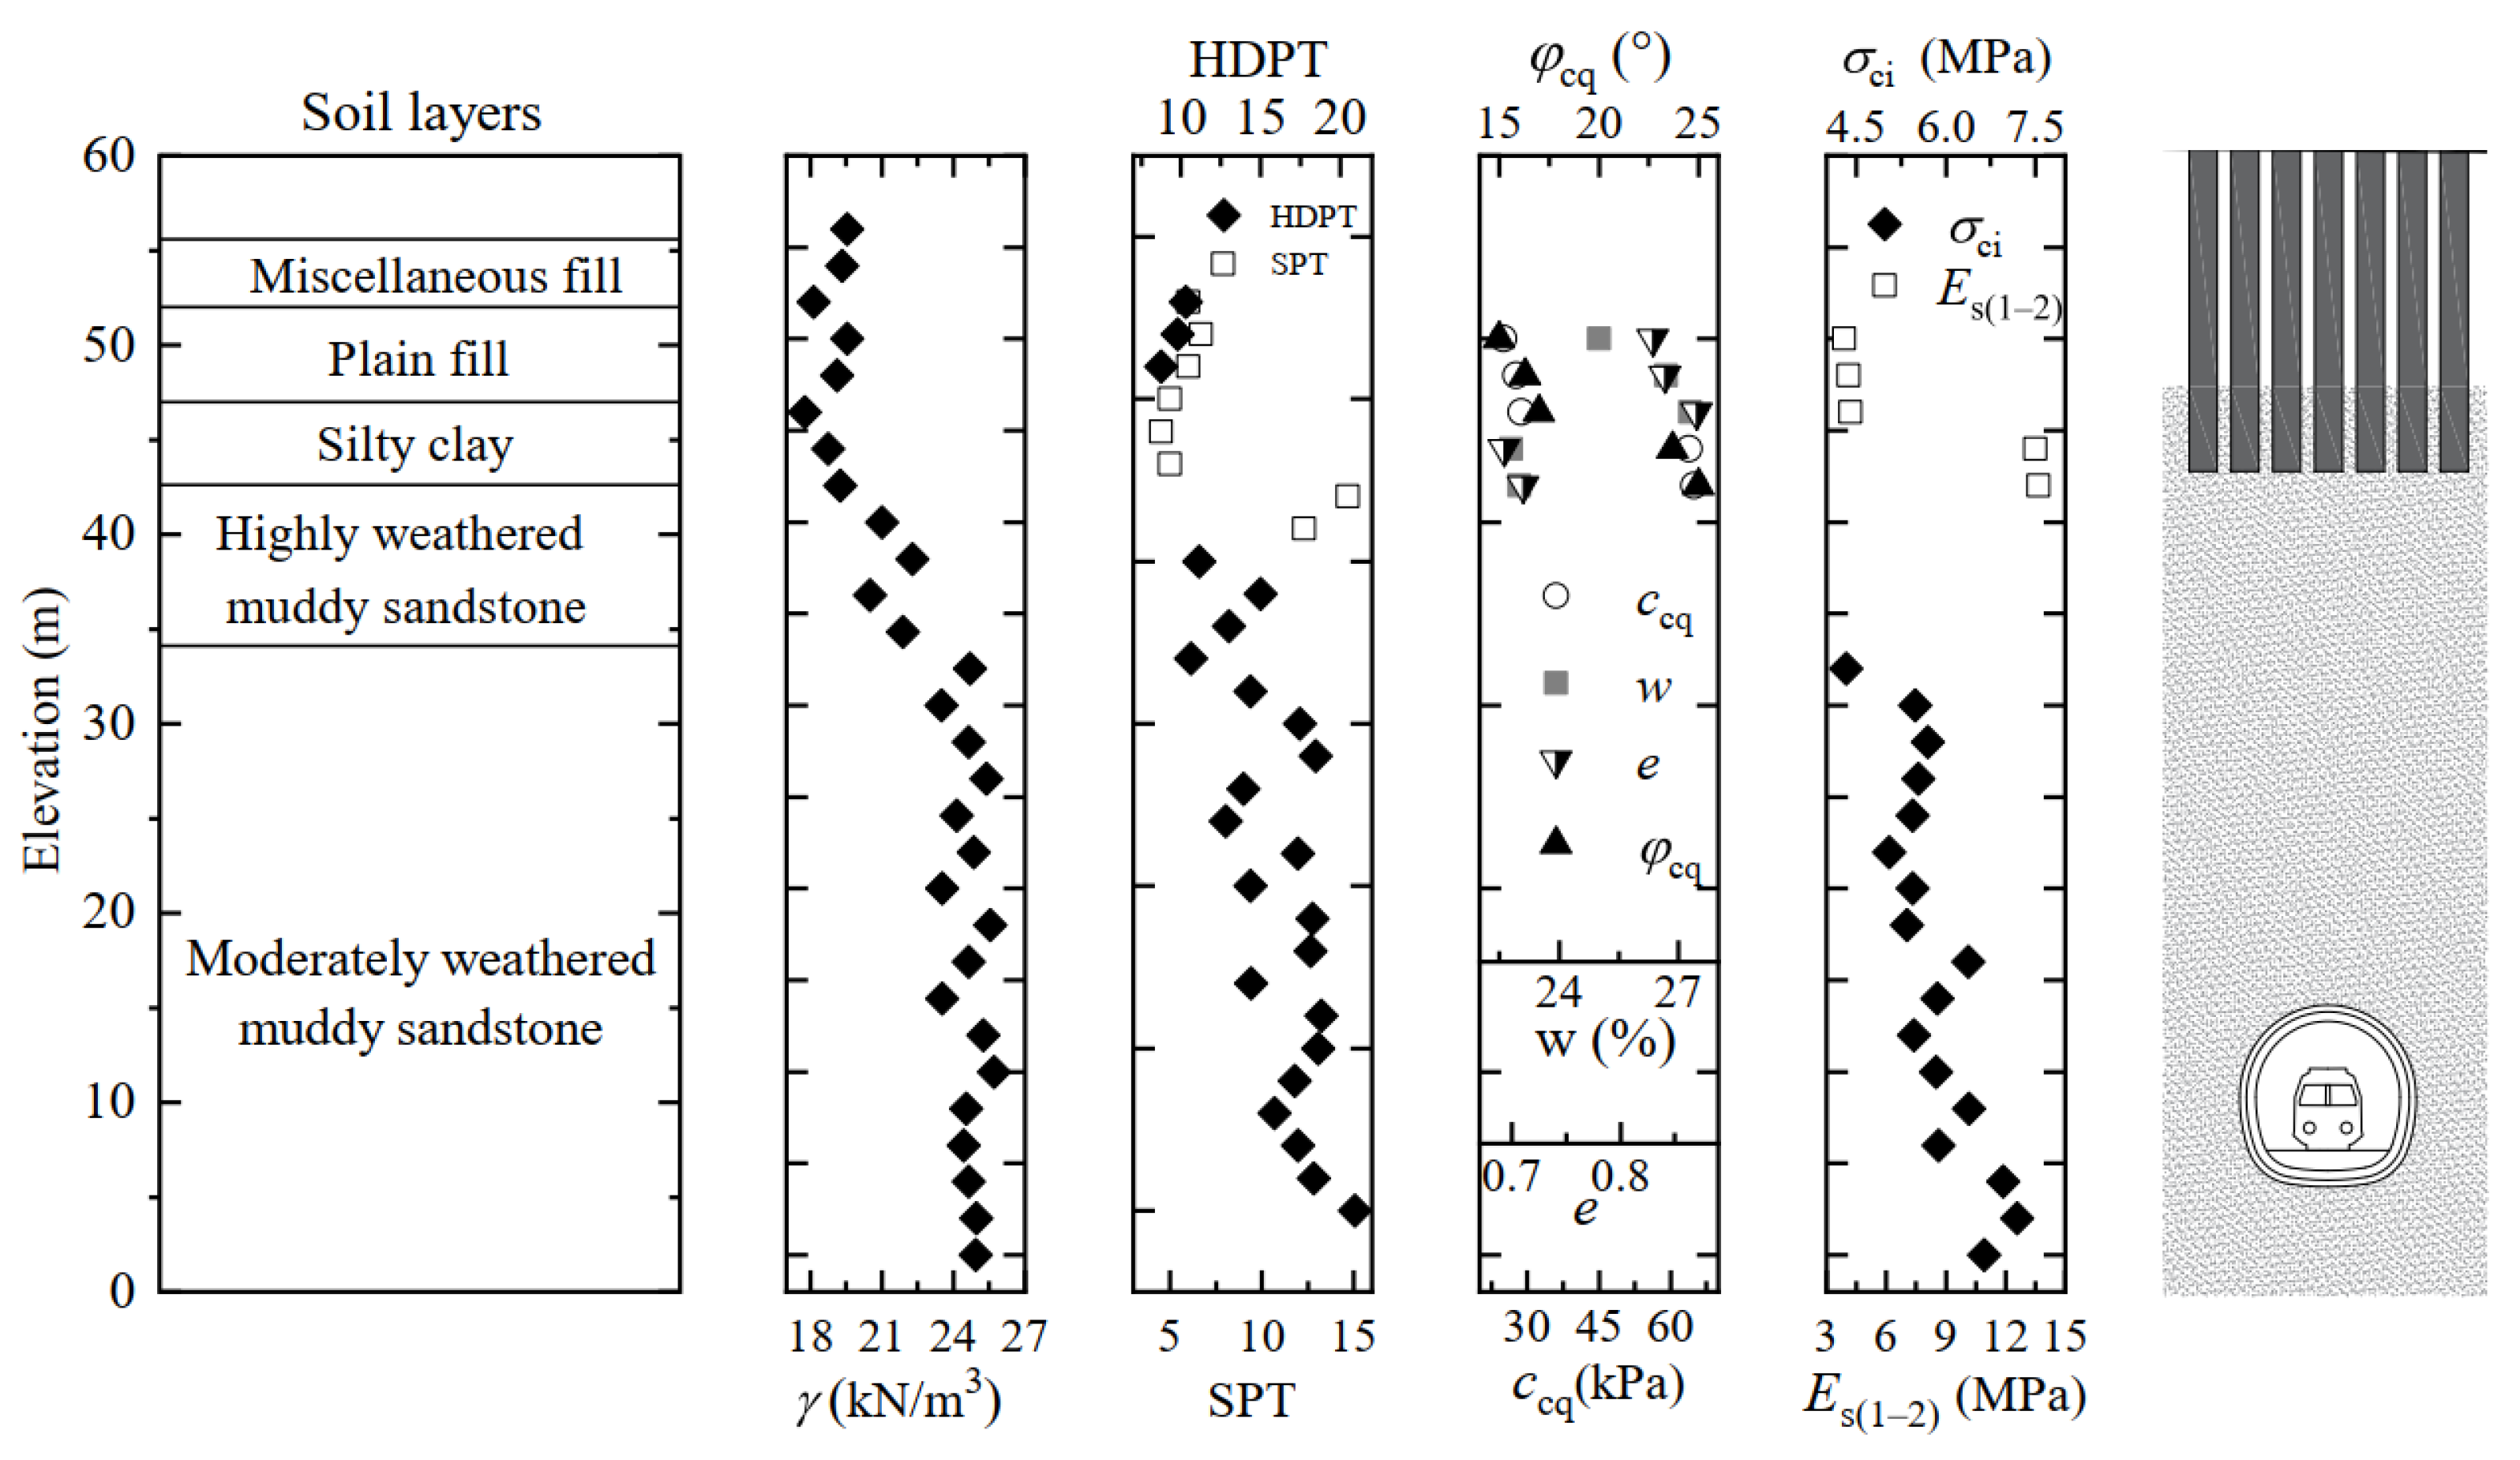
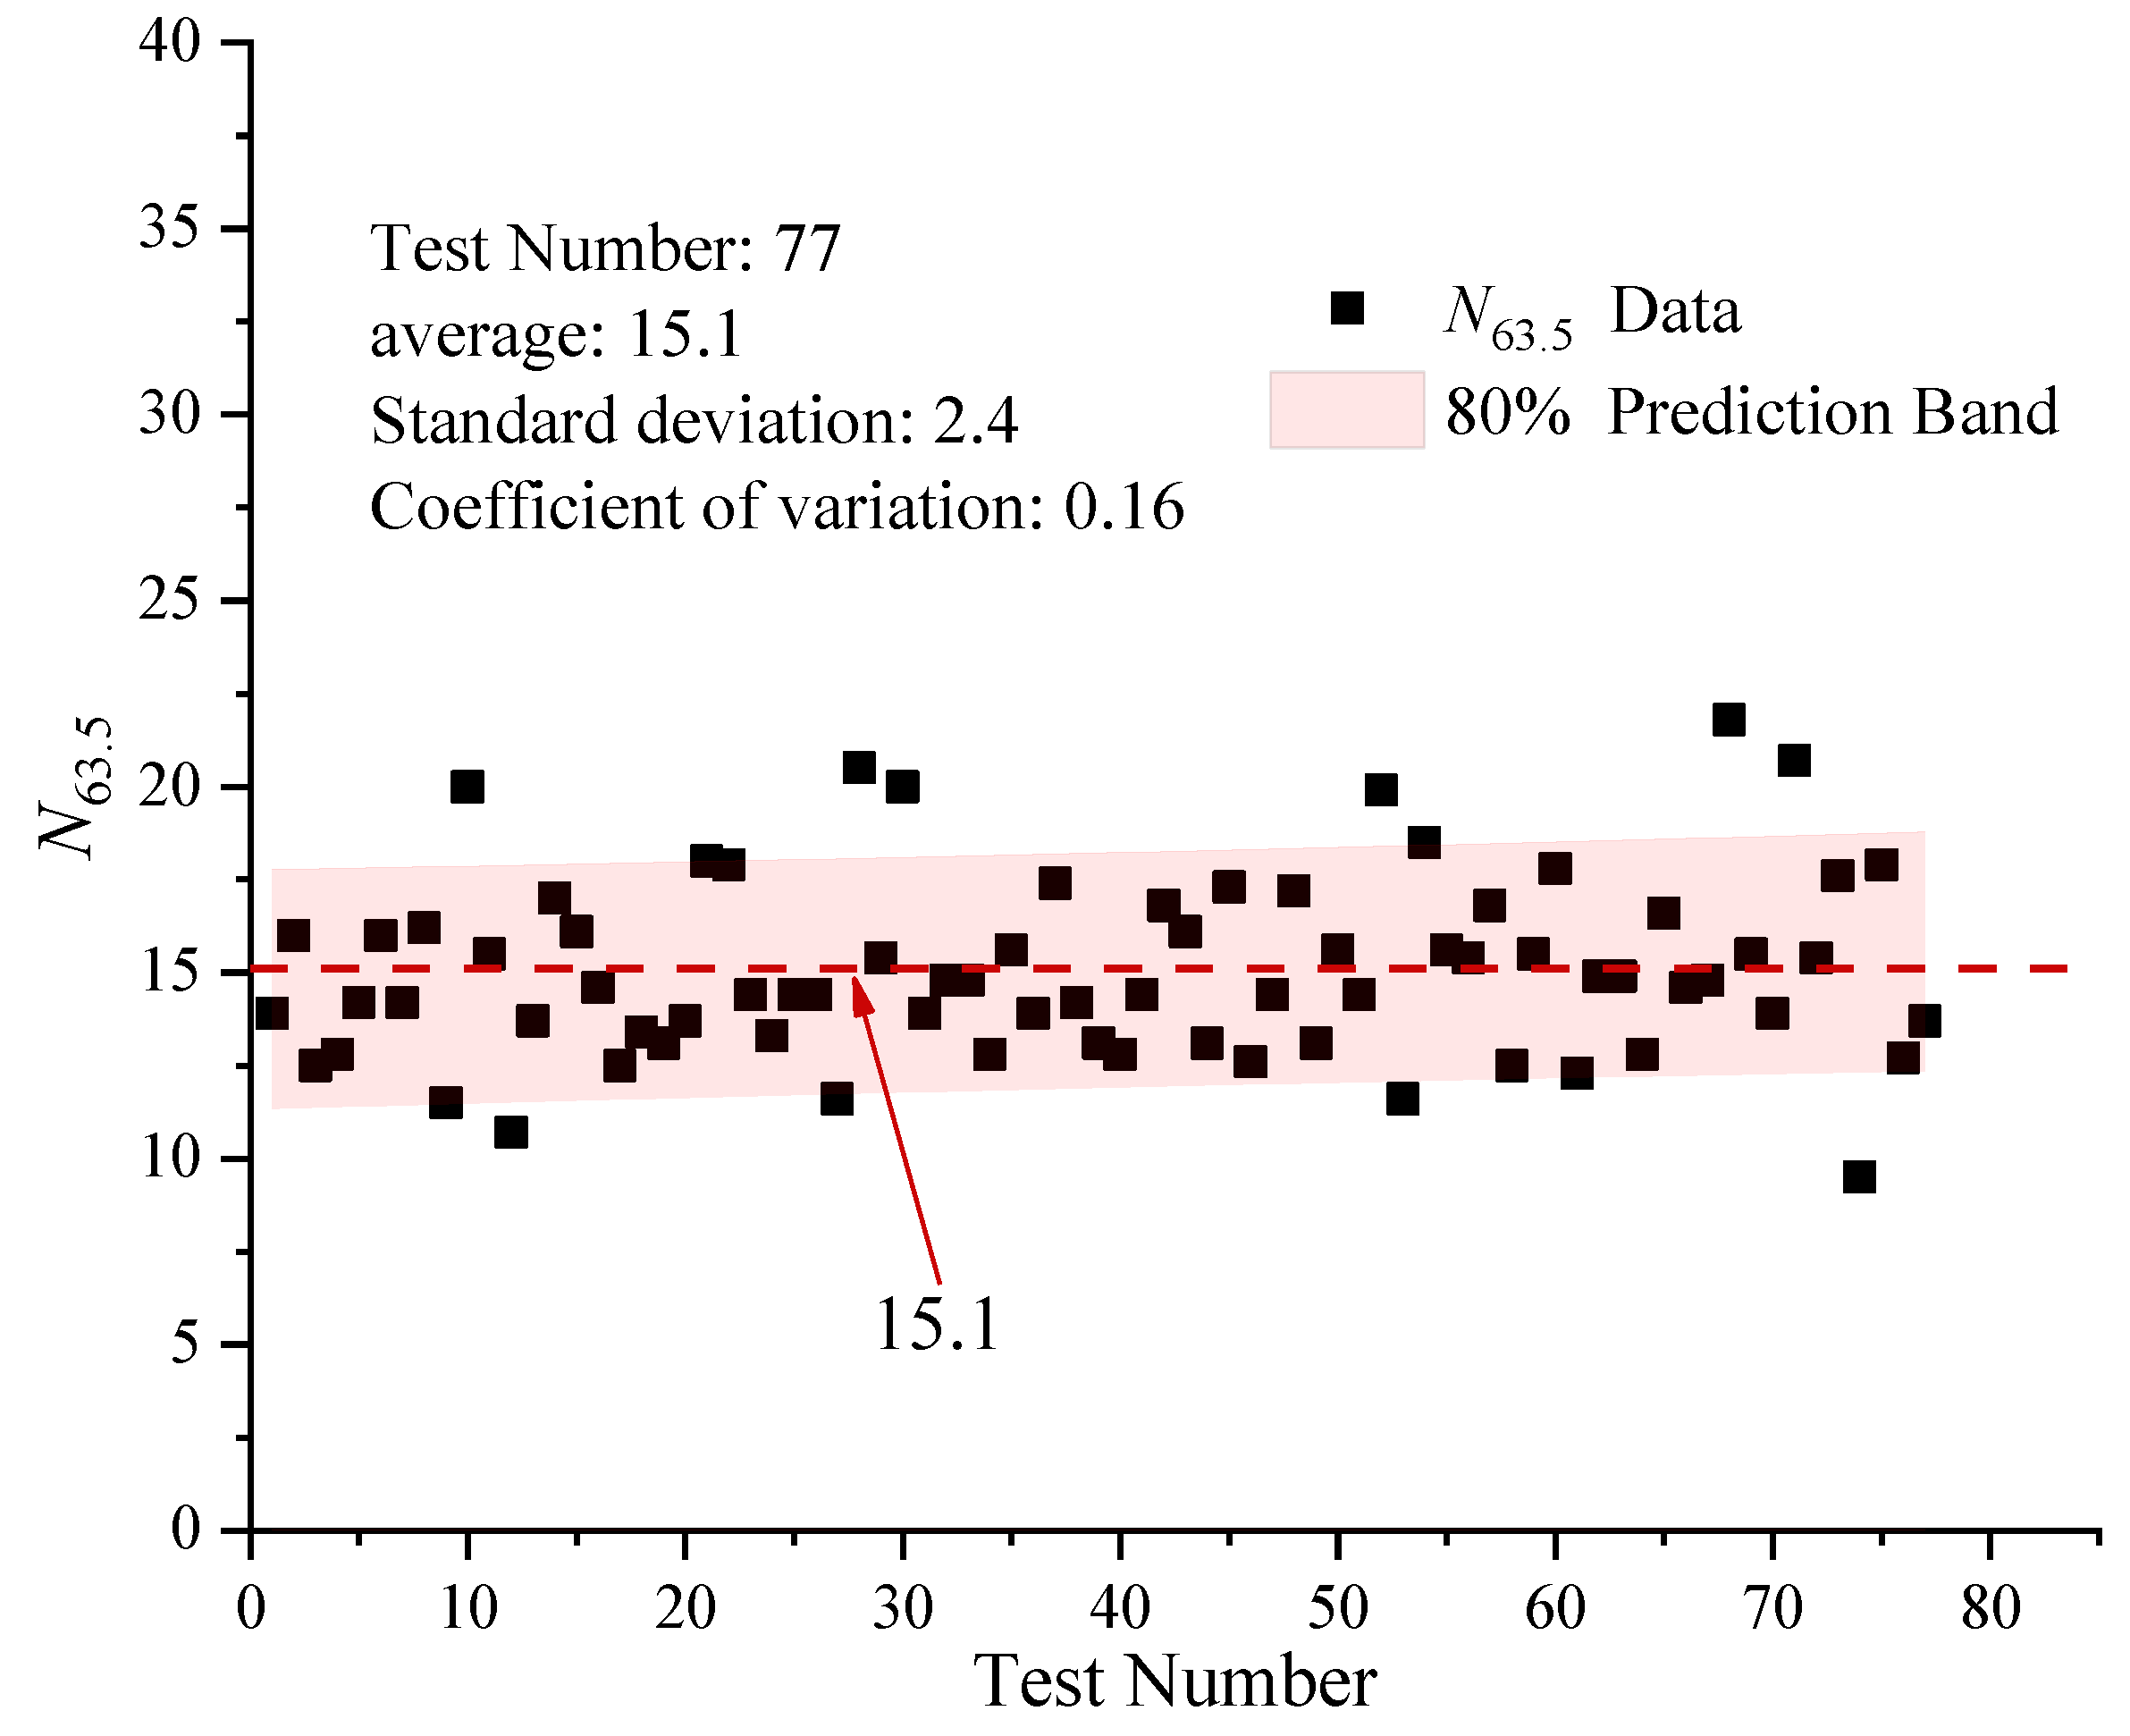
2.2. Geotechnical Profile and Properties

The site soil mainly includes silty clay, highly weathered muddy sandstone, moderately weathered muddy sandstone, where moderately weathered muddy sandstone accounts for the largest proportion, and the tunnel is all located in this stratum. The ground surface is miscellaneous fill, elevation 52.4~60.1 m (China 1985 national elevation data), with obvious undulation. The survey depth is about 50 m. Due to the high surface elevation, no groundwater was involved in the construction process. The previous geological investigation, including in situ and indoor tests, mainly obtained the heaviness of each soil layer γ, consolidation fast shear cohesion ccq, internal friction angle φcq, water content w, pore ratio e, SPT count, and compression modulus Es(1–2) of the soil, uniaxial compressive strength σci, and the HDPT count of the rock. Figure 3 shows the detailed geotechnical profile information and properties obtained from the geological investigation report.

3. Numerical Study

In this paper, the complex response of the tunnels under realistic conditions was investigated by using the HSS and HB models for the soil and rock respectively through the finite element software PLAXIS3D, and the the model mesh is shown in Figure 4.

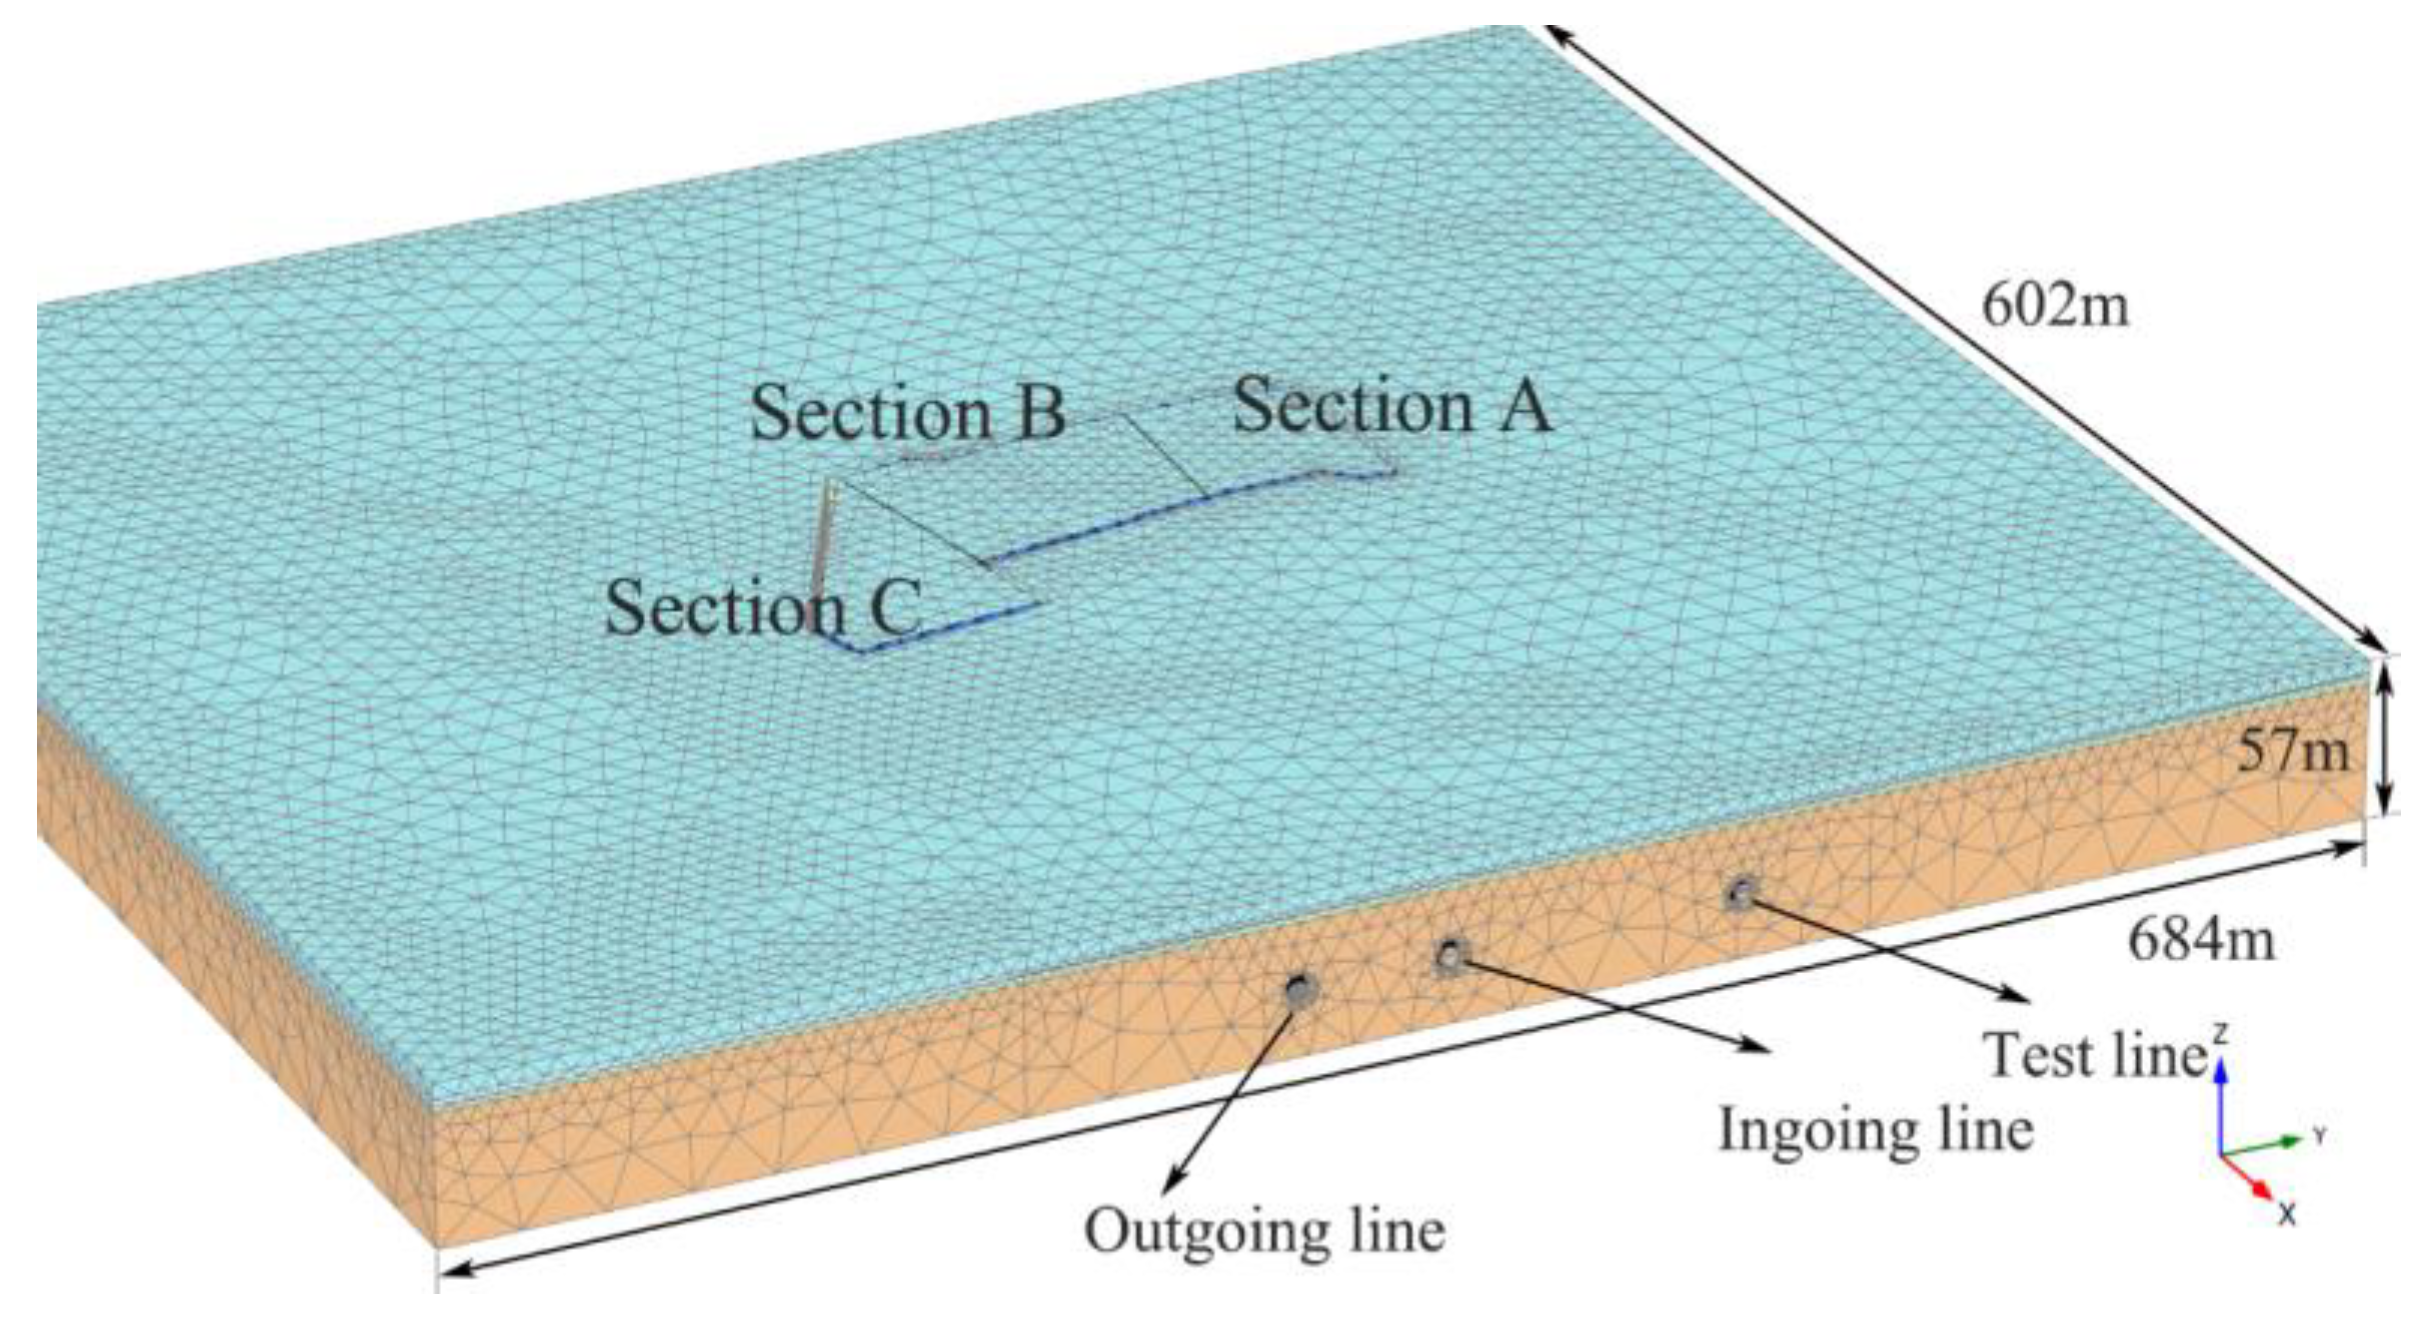
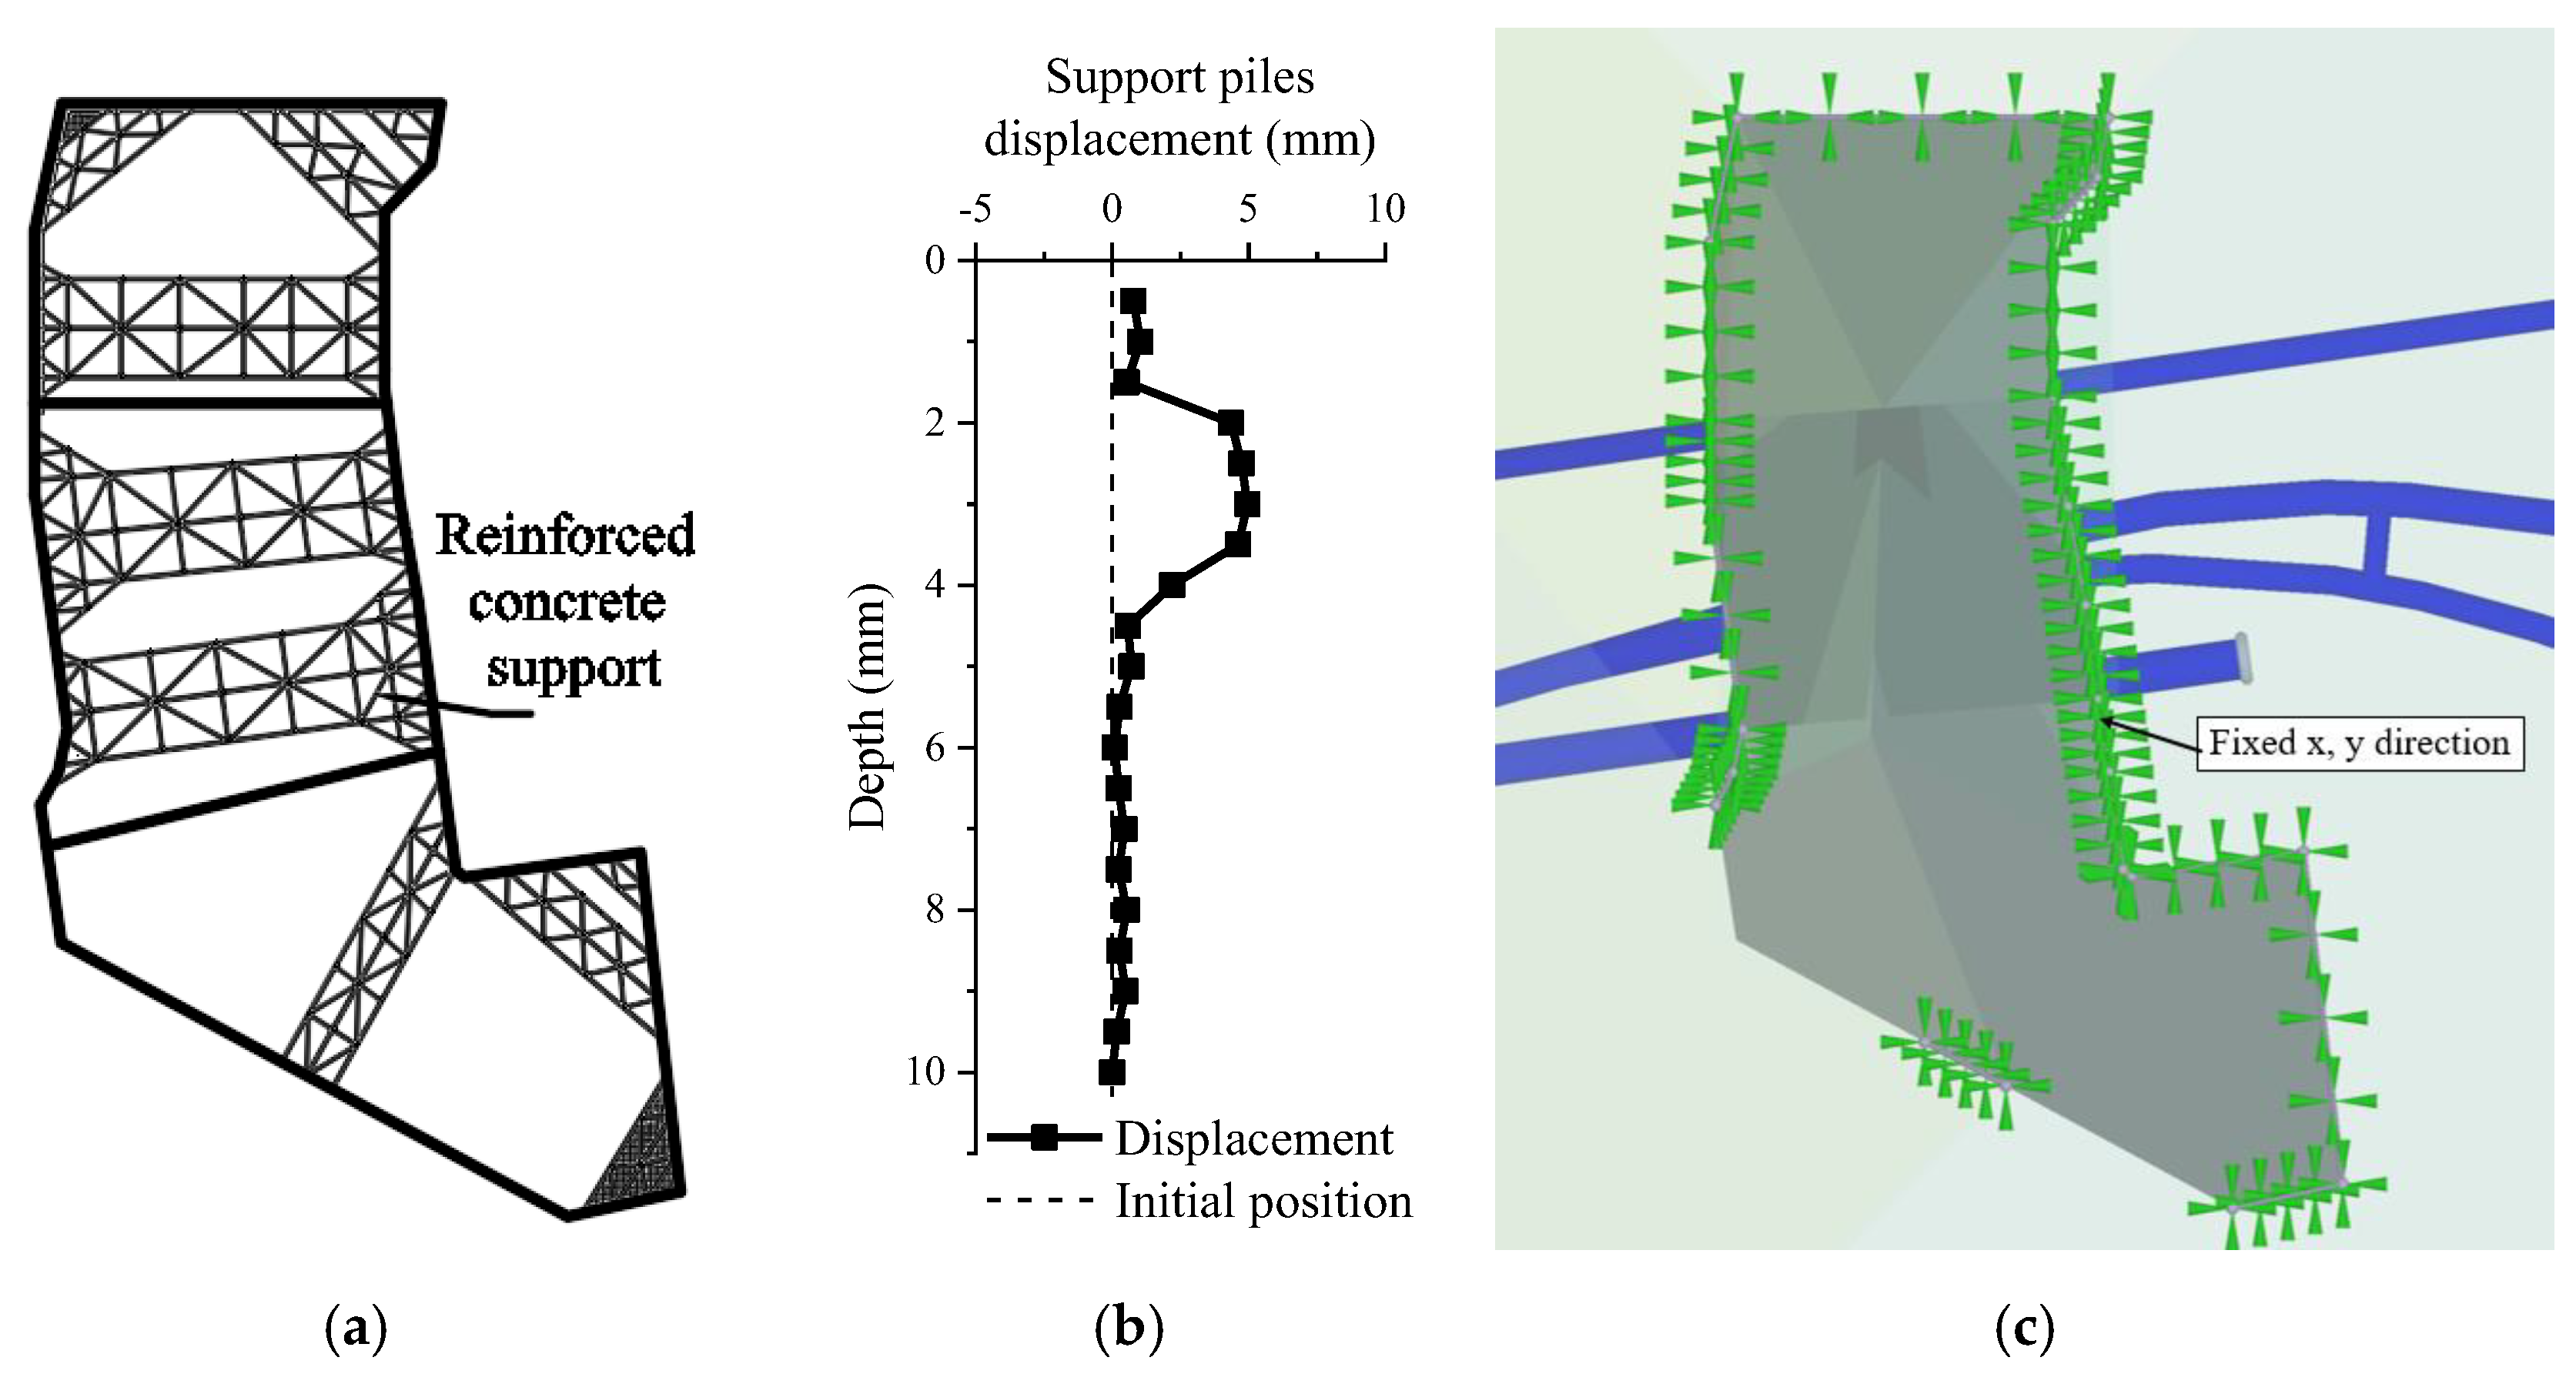
3.1. Model Description

Considering the complexity of the shape of the tunnels and the pit, the 2D model cannot reflect an accurate effect, so it is necessary to establish a 3D model. The model includes five strata, and the thickness of them is determined by eight geotechnical boreholes around the pit. The main structures in the model are the tunnel lining and the pit support piles. The tunnels were built according to the real size and parameters, and the support piles were simplified to reinforced concrete walls based on the stiffness equivalence principle. The model mesh was appropriately encrypted near the structures and contained a total of 211,636 elements. The fixed boundary (position fixed, rotation free) was set at the bottom of the model, the roller boundaries (normal direction fixed, tangential direction free) were set around the model, and the free boundary was set at the top surface. The ground surface is undulating, but considering that the surface change has a little effect on structures response, the surface was set as a uniform elevation. Due to the boundary effect of the numerical model, the pit boundary is kept at a distance of more than 3 times the width of the pit from the model boundary, and the distance is at least 15 times the excavation depth. After the trial calculation, we were fairly sure that the model boundary completely covered the excavation effect area.
To simplify the model, all the bottoms of the four tunnels were set to an elevation of 20.08 m and the lining thickness was 0.35 m. The pit was divided into three sections: sections A, B, and C, each with different excavation depths and pile lengths, as illustrated in Figure 5. At the construction site, a layer of reinforced concrete supports was placed on top of the support piles, and the support layout is shown in Figure 6a. Figure 6b shows the measured horizontal displacement results of the pile top under the horizontal restriction of the internal support, and the results illustrate the significant effect of the internal support. The horizontal displacement within 1.5 m of the top of the supported pile tends to be 0. Therefore, to reduce the calculation, the internal support is simplified to the displacement limitation of the pile top. The horizontal displacement of the pile top, which is connected to the support, is fixed, and the vertical displacement is kept free.

3.2. Material Model and Input Parameters

3.2.1. Soil Constitutive Model and Parameters

This study is concerned with the deformation of the surrounding soil caused by the excavation of the foundation pit and the effect on the existing tunnel. The HSS model is a mature advanced model with complete correspondence between the model parameters and common engineering test parameters. The HSS model not only describes the mechanical behavior of soil under loading, unloading, and consolidation but also introduces small-strain properties for more accurate soil deformation prediction [21]. In the conventional numerical analysis of geotechnical engineering, the soil deformation results calculated by the HSS model are most consistent with the actual engineering. It is significantly better than other soil ontological models, such as the commonly used the Mohr–Coulomb model, modified Cam–Clay model, and Duncan–Chang model [22]. Therefore, in this study, the HSS model is used as the constitutive model of soil and it has 10 main parameters, including heaviness γ, strength parameters c and φ, and seven stiffness-related parameters. Among them, E50ref is the triaxial drainage cutline stiffness, Eoedref is the lateral limit compression test reference tangential stiffness, Eurref is the unloading and reloading stiffness, and G0ref is the small-strain shear modulus. These four stiffness parameters together determine the deformation characteristics of the soil. However, the geological investigation report generally only gives the lateral limit compression modulus Es(1–2), and based on engineering experience it is roughly assumed that the proportional relationship between these five stiffness parameters is as shown in Equation (1).
E s ( 1 2 ) : E oed ref : E 50 ref : E ur ref : G 0 ref = 1 : 1 : 1 : 1 : 3
However, the literature [22] showed that the above relations are not applicable to all soil and gave updated relations as in Equations (2)–(4) depending on the stiffness of the soil. In this study, Equations (2)–(4) were used to determine the soil stiffness parameters.
E s ( 1 2 ) : E oed ref : E 50 ref : E ur ref : G 0 ref = 1 : 1 : 1.5 : 8 : 20   ( for   2 M P a E s ( 1 2 ) 3 M P a )
E s ( 1 2 ) : E oed ref : E 50 ref : E ur ref : G 0 ref = 1 : 1 : 1 : 5 : 10   ( for   6 M P a E s ( 1 2 ) 8 M P a )
E s ( 1 2 ) : E oed ref : E 50 ref : E ur ref : G 0 ref = 1 : 1 : 1 : 3 : 5 ( for   E s ( 1 2 ) 18 M P a )
Nevertheless, only the Es(1–2) of the plain fill and silty clay are provided in the geological investigation report, the Es(1–2) of the other soils need to be obtained from the SPT and HDPT data. Empirical formulas for calculating the friction angle φ and cohesion c of the soil using the modified blow count N60 of the SPT are given in Equations (5) and (6), in which the Ip and p are plasticity index and fines content of soil [23]. The literature [24] gives the relationship between N60 and Es(1–2) in Equation (7).
c =   0.00054   ×   I p + 0.005 × N 60 + 0.09
φ = 0.24 × N 60 + 0.0061 × I p 0.313 × p + 43.42
E s ( 1 2 ) = 4.6 + 0.21 N 60 ( for   c φ   soil ,   and   3 N 60 15 )
Figure 7 illustrates 77 sets of data of the HDPT blow count N63.5 for the highly weathered muddy sandstone. The average of N63.5 is 15.1, and the coefficient of variation is 0.16. Although the range of the data is large, most of the data are concentrated around the average value of N63.5 which can reflect the soil strength and stiffness when the number of tests is large enough. Treating the strongly weathered rock as cohesionless soil according to the weathering products, the deformation modulus E0 and internal friction angle φ of this soil layer can be obtained using Table 2 and Table 3 [25], and then E0 is converted to compression modulus Es(1–2) using Poisson’s rate μ and the theoretical conversion equation is Equation (8) [26].
E s = E 0 1 μ ( 1 + μ ) ( 1 2 μ )
In addition, the HSS is required to provide the stress-related power index m and the shear strain-related parameter γ0.7. The m takes values in the range of 0.5 to 1, and the larger the soil stiffness, the smaller the m. Based on engineering experience γ0.7 is generally taken as 0.0001 [22]. Table 4 lists the soil parameters used for the HSS model and the color indicates the source of the data.

3.2.2. Rock Constitutive Model and Parameters

The HB model is a common empirical model used to predict the deformation and damage of rock masses, and it has been validated by many engineering cases. In Plaxis3D, four models can be used to simulate rock masses, among which the linear elastic model is a crude first-order approximation, the Mohr–Coulomb model is a reasonable model, and the jointed rock model and HB model are the best standard models. The jointed rock model is used to simulate rock masses that are stratified or clearly anisotropy, and the HB model is applicable to general rock masses. The moderately weathered muddy sandstone involved in this study has no obvious joints, so the HB model is used. There are seven main parameters in the HB model, including heaviness γ, Poisson’s ratio ν, Young’s modulus E, uniaxial compressive strength σci, intact rock material constant mi, geological strength index GSI, and disturbance factor D. Among them, σci is measured by tests. ν mi, GSI, and D are taken from the literature references according to the rock type and degree of weathering [27]. E is determined based on Equation (9) [28].
E = M R σ ci ( 0.02 + 1 D / 2 1 + e [ ( 60 + 15 D + G S I ) / 11 ] )
where MR is taken as 275 on account of rock type, joint development, and degree of weathering. Table 5 lists the rock parameters used for the HB model.

3.2.3. Structural Constitutive Model and Parameters

The underground structures involved in the numerical model include tunnel linings and support piles, both of which are made of reinforced concrete. To reduce the calculation, rows of piles are converted into walls depending on the principle of flexural stiffness equivalence. Solving Equation (10) gives the thickness of the walls.
b h 3 12 = π d 4 64
where b is the pile spacing of 1.3 m, h is the required wall thickness, and d is the support pile diameter of 1.1 m. After the conversion of support piles, both the tunnels and the piles are treated as reinforced concrete plats with a weight of 25 kN/m3, Young’s is modulus set to 30 GPa, and Poisson’s ratios of 0.2 and 0.25 are set for the tunnels and walls, respectively. The thickness of the tunnel lining and retaining walls is 0.35 m and 0.87 m.

3.2.4. Interface Constitutive Model and Parameters

During the interaction between the structure and the soil, the deformation of both is not the same due to the existence of the interface. Therefore, in order to accurately simulate the deformation of the structure and the soil, the numerical model sets up interface elements at the junction of the structure and soil, and the stiffness and strength of the interface elements are obtained from the shear modulus of the adjacent soil. In PLAXIS3D, the most important parameter of the interface element is the reduction factor Rinter. It is generally considered that the strength and stiffness of the interface are smaller than the parameters of the surrounding soil body, so this property of the interface can be reacted by setting Rinter [29]. The elastic deformation of the interface element obeys Equations (11)–(15).
s n = σ K n = σ t i E oed , i
s s = τ K s = τ t i G i
E oed , i = 2 G i 1 υ i 1 2 υ i
G i = R inter 2 G soil G soil
υ i = 0.45
where Gi is the shear modulus of the interface, Eoed,i is the one-dimensional compression modulus of the interface, ti is the virtual thickness of the interface, generally taken as 0.1 m, Kn is the normal stiffness of the interface, Ks is the tangential stiffness of the interface, Rinter is taken as 0.75 in this study [27,30], Gsoil is the shear modulus of the adjacent soil, and νi is Poisson’s ratio of the interface, which is a fixed value of 0.45. The strength parameters of the interface are determined by Equation (16).
c i = R inter c soil tan φ i = R inter tan φ soil tan φ soil }
where ci is the interface cohesion, csoil is the adjacent soil cohesion, φi is the interface internal friction angle, and φsoil is the adjacent soil internal friction angle.

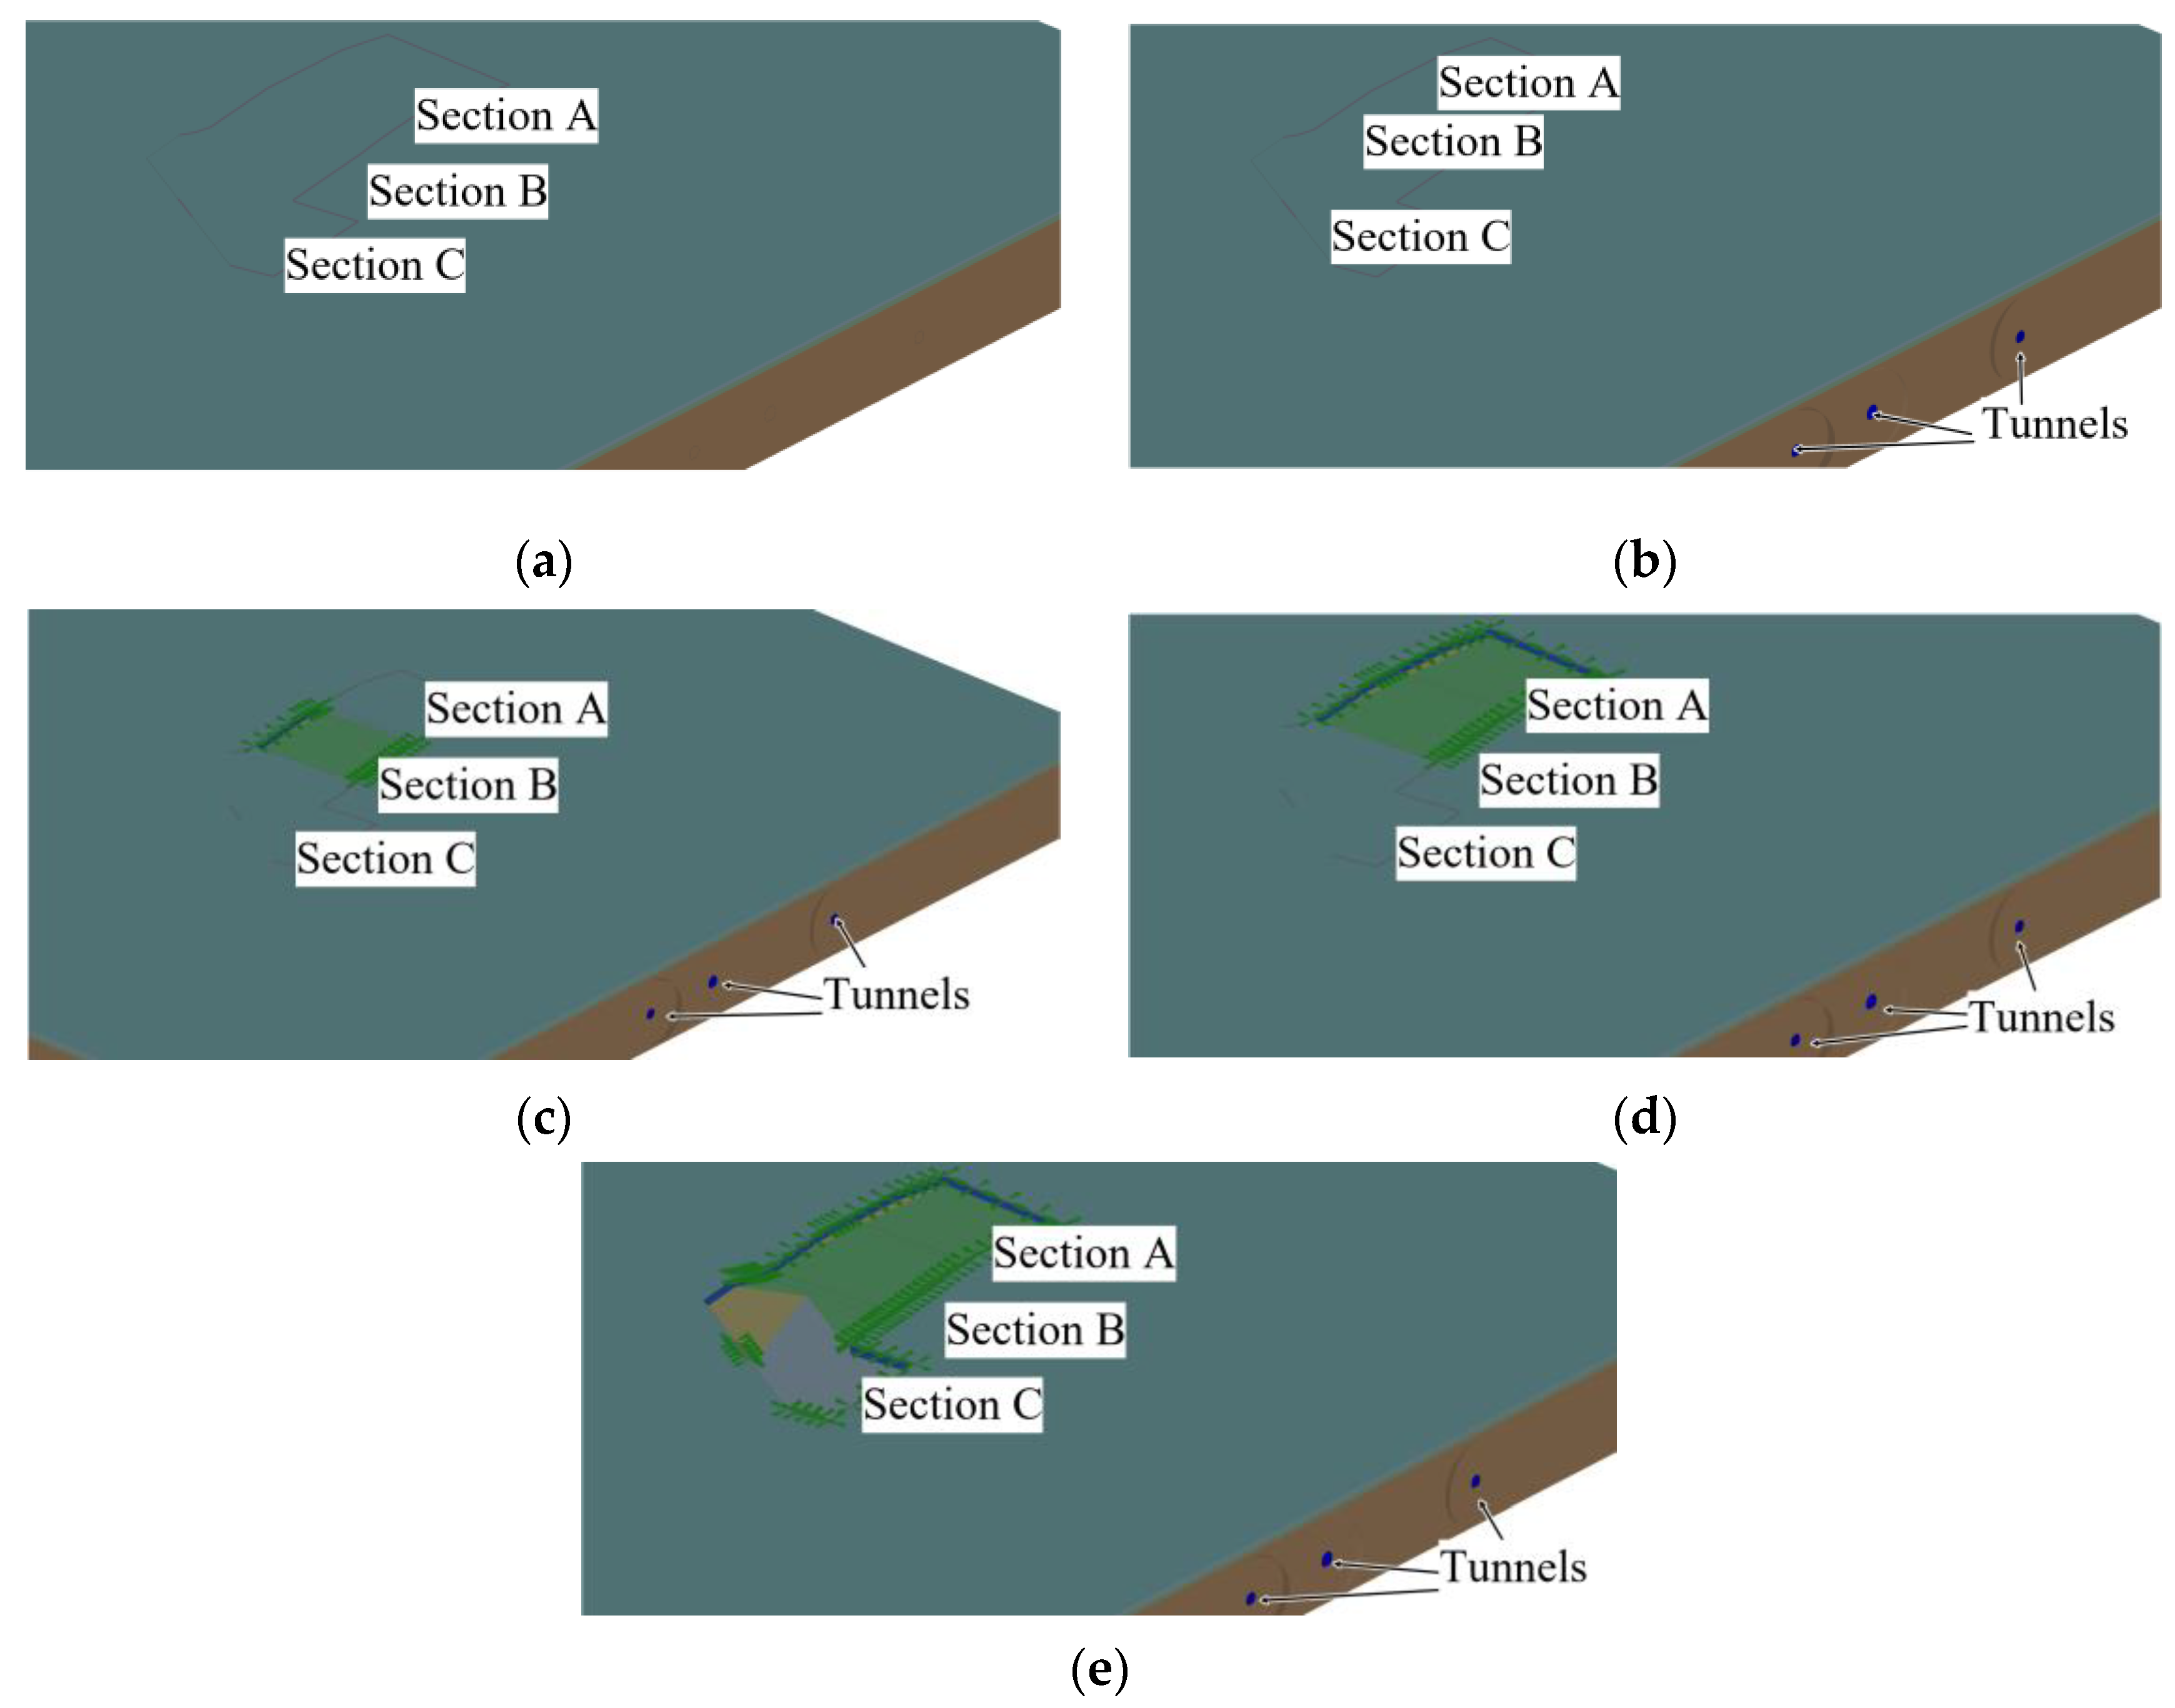
3.3. Simulation of Construction Process

The simulation process is divided into five steps: earth stress equilibrium, tunnel excavation, section B excavation, section A excavation, and section C excavation as illustrated in Figure 8. In the first stage, the soil is equilibrated under its own weight. In the second stage, the soil inside the tunnel is frozen and the plate elements representing the lining and support piles as well as the contact units are activated to simulate the tunnel excavation and support pile construction process. Since this study focuses on the effect of the pit excavation on the tunnel, the strain of the soil and structure calculated in stages 1 and 2 are reset to 0 at the start of stage 3 so that the deformations due to the excavation can be observed clearly. The stress state is not reset because the pre-stress will affect the subsequent deformation level. In stages 3 to 5, the three sections of the pit are excavated sequentially, and the displacement limits at the top of piles are activated while the excavated soil is frozen in each stage.

4. Analyses of Responses of the Metro Line

Excessive tunnel displacements can lead to lining cracking, water leakage, train speed reduction, and even tunnel collapse. Therefore, the tunnel operator carried out long-term monitoring of tunnel deformation, including vertical displacement, horizontal displacement, vertical convergence, and horizontal convergence. In addition, the operator has proposed displacement limits for tunnels according to Technical Specification for Monitoring Measurement of Orhan Rail Transit Engineering in Jiangsu Province [31]. The limits are that tunnel settlement should not exceed 10 mm, heave should not exceed 5 mm, horizontal displacement should not exceed 10 mm, and convergence should not exceed ±10 mm.

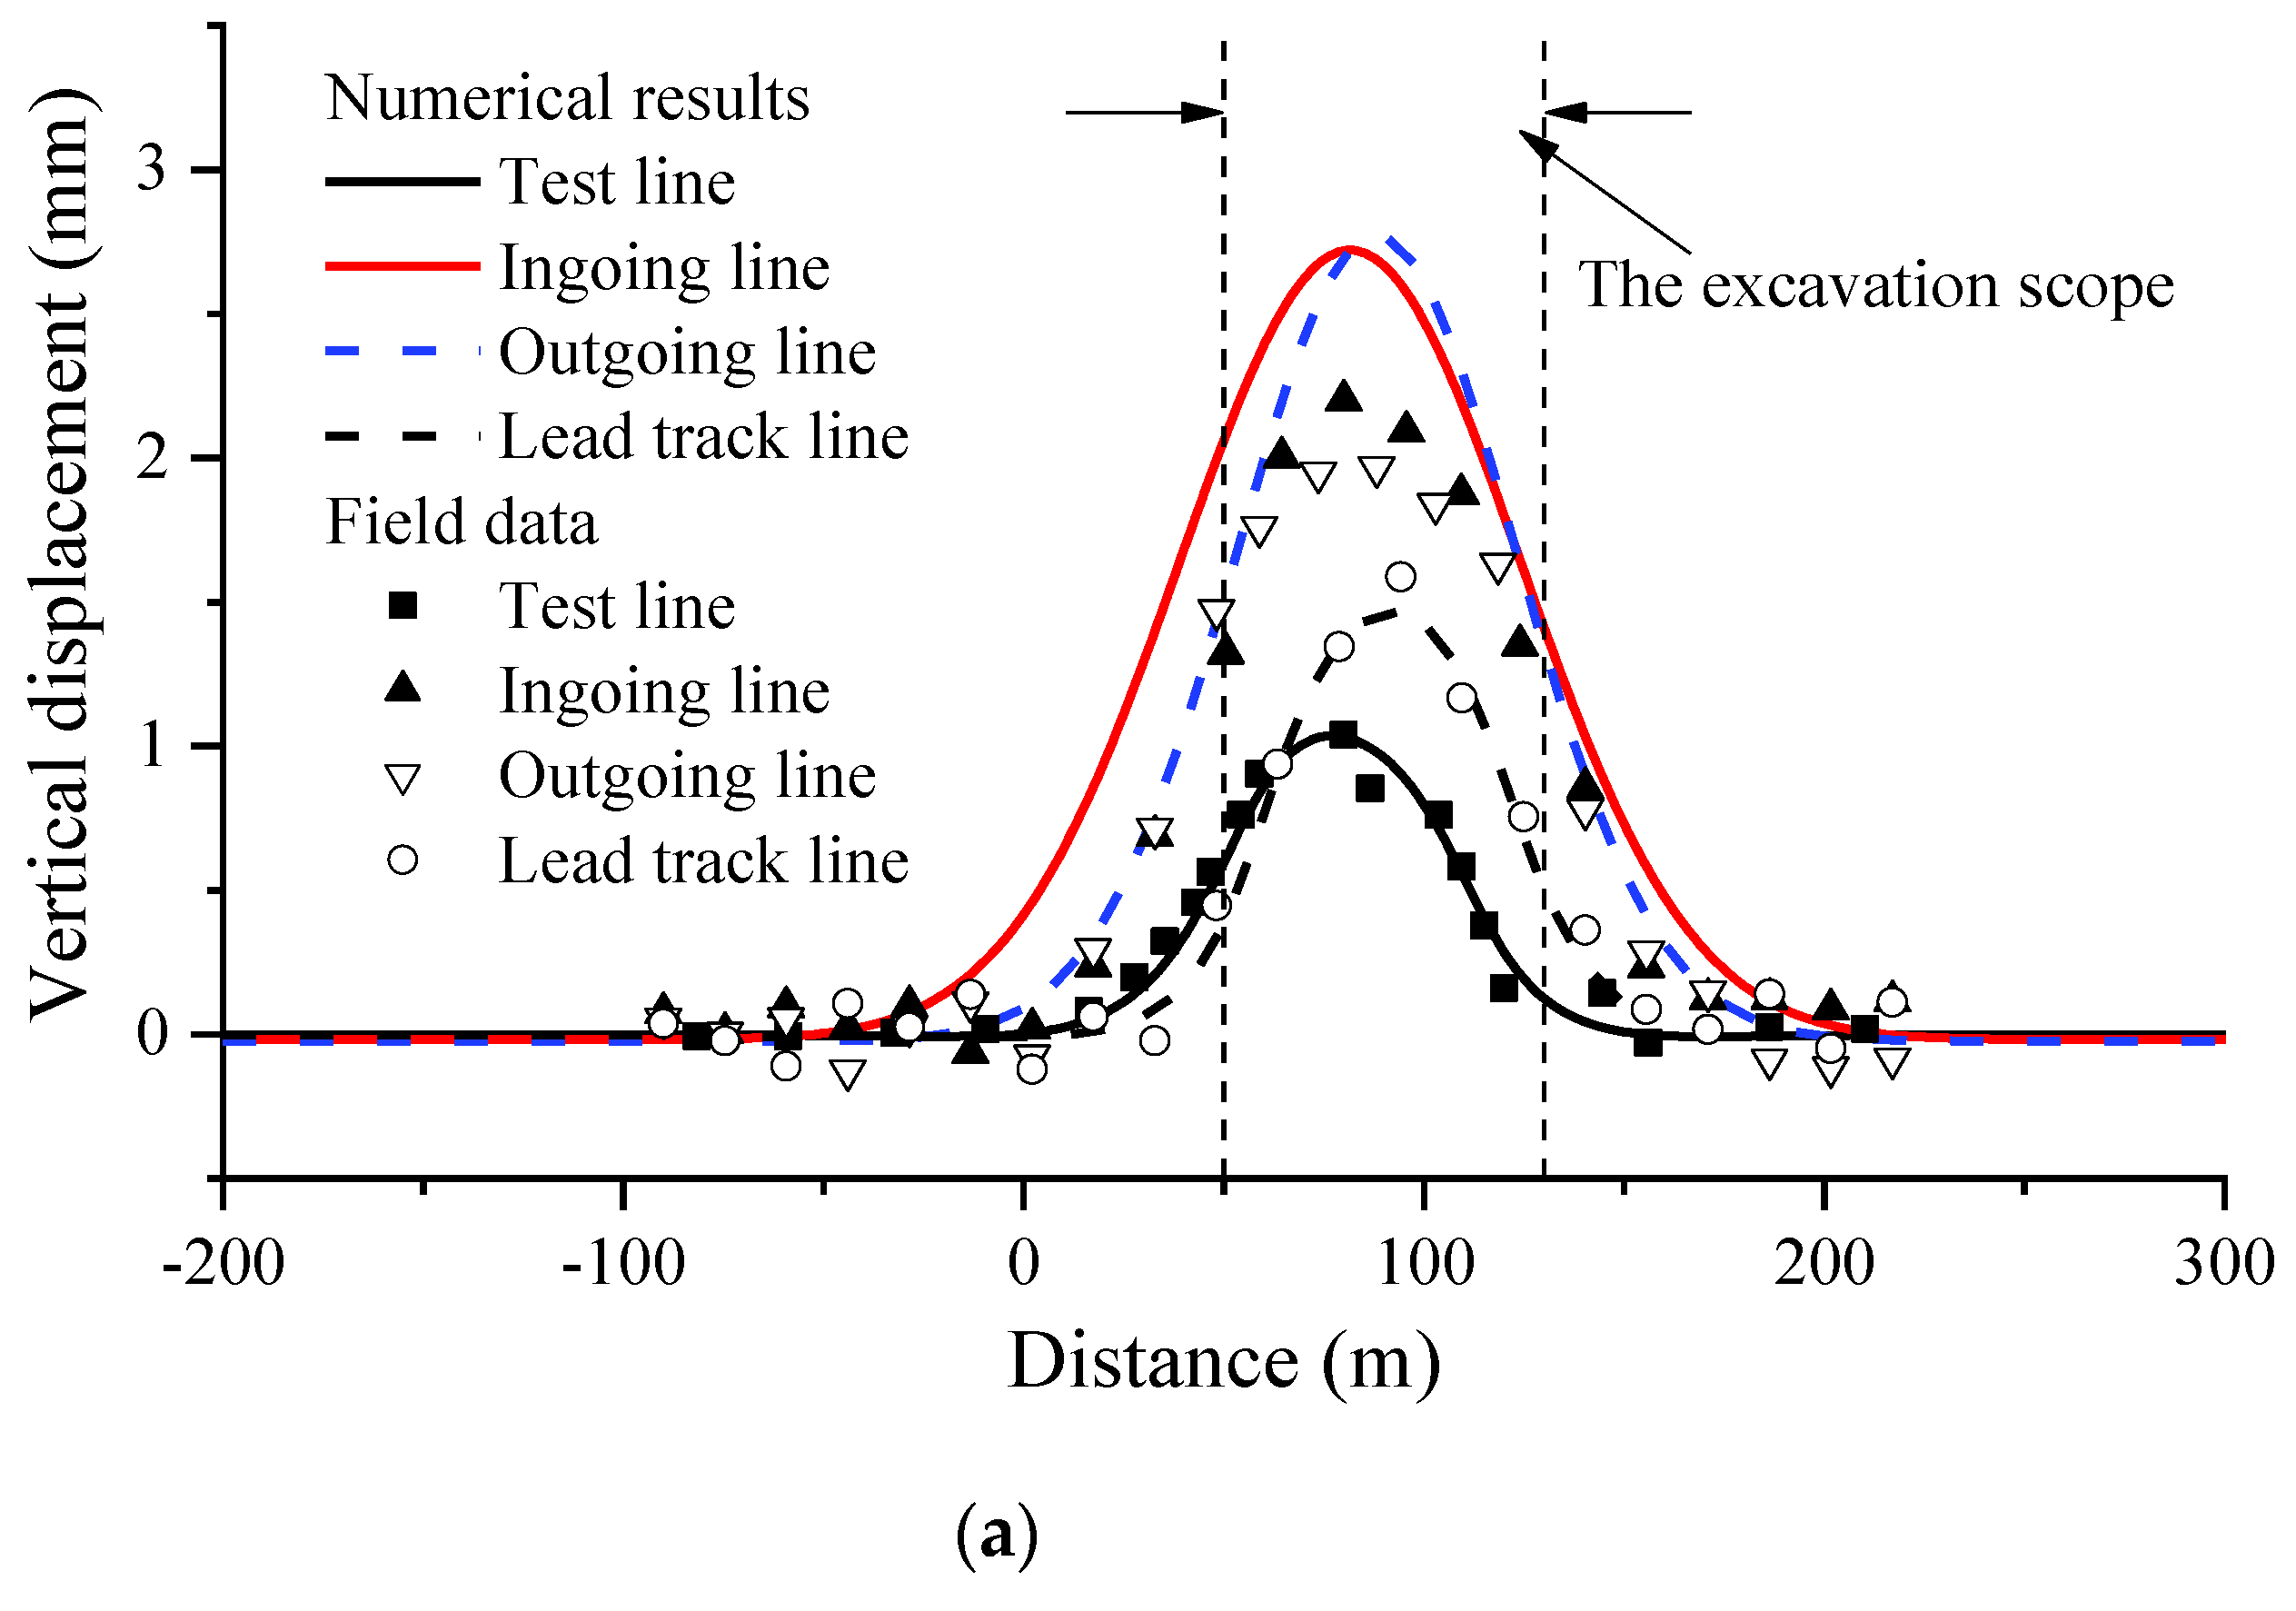
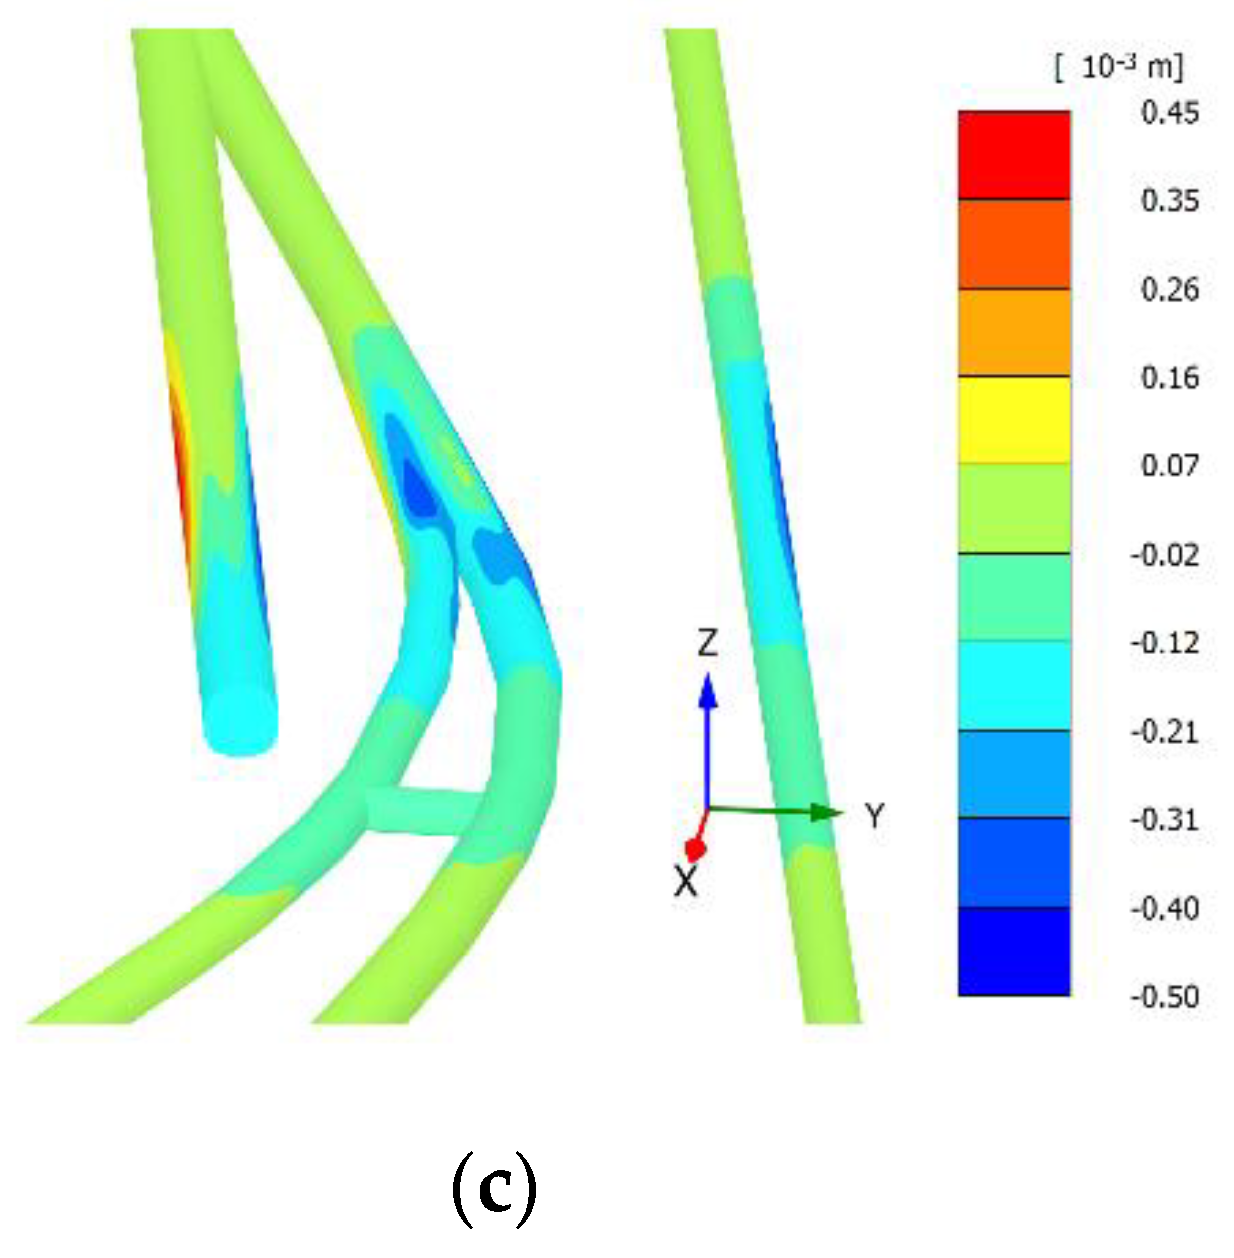
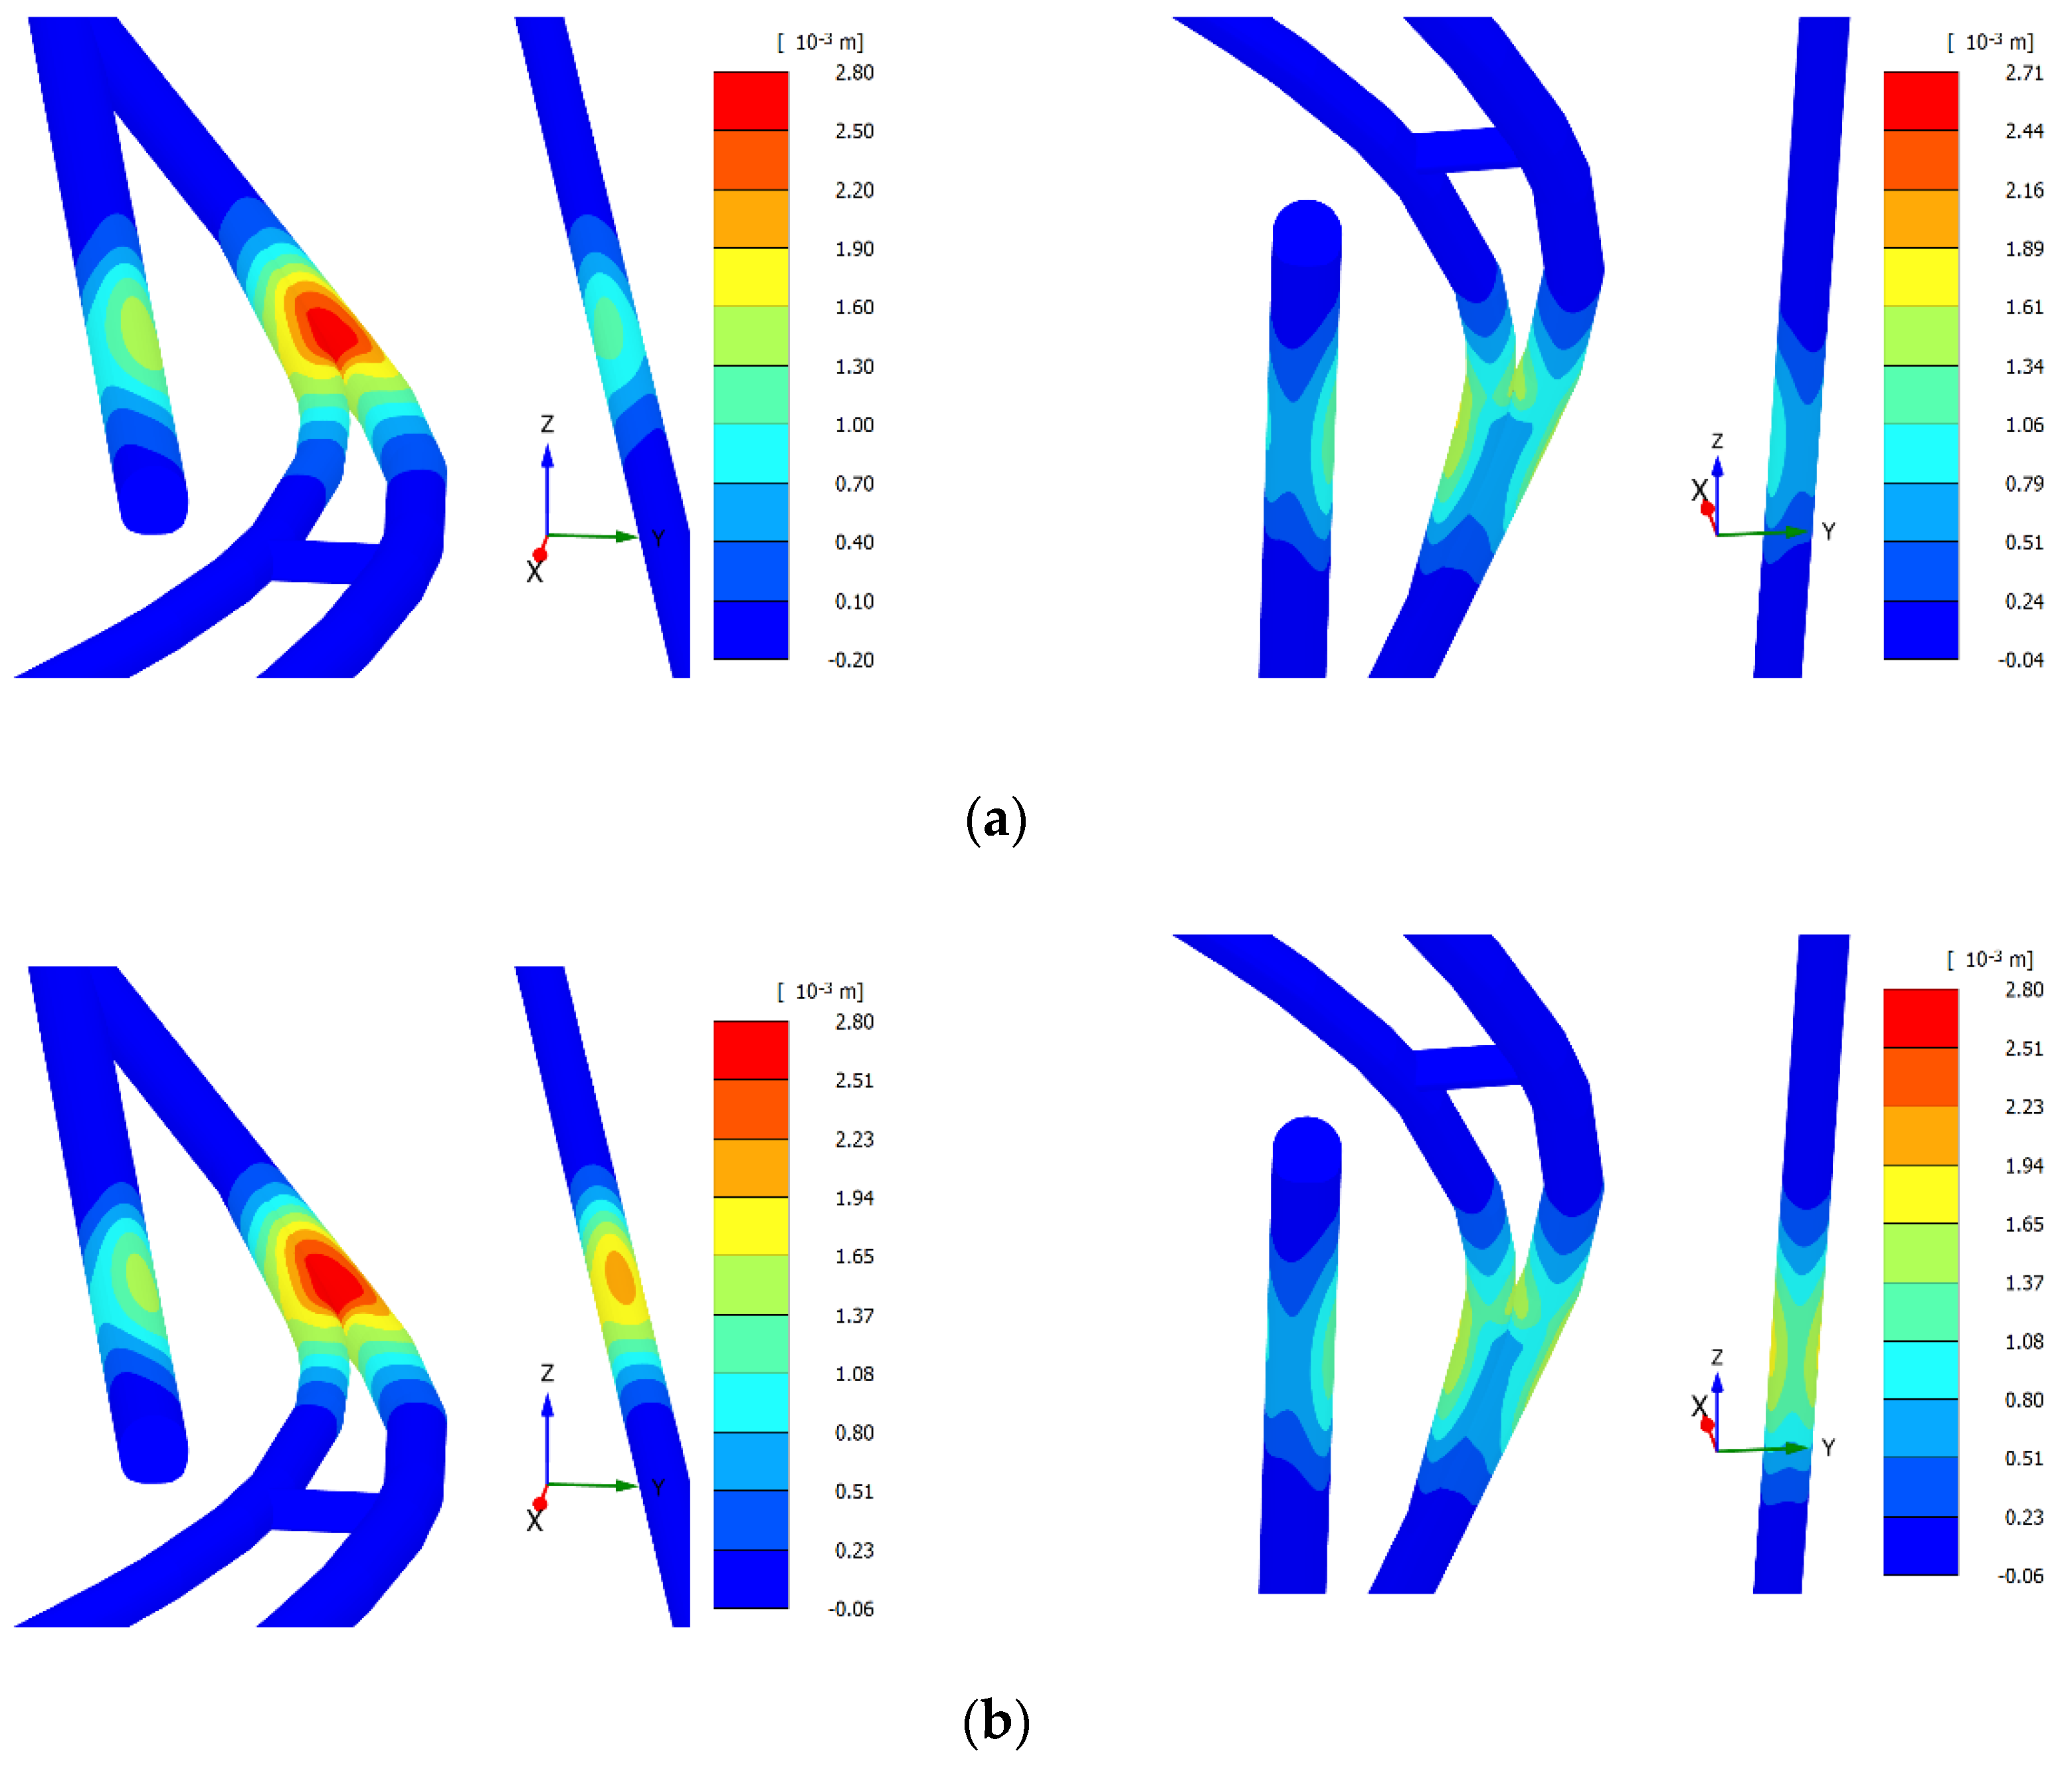
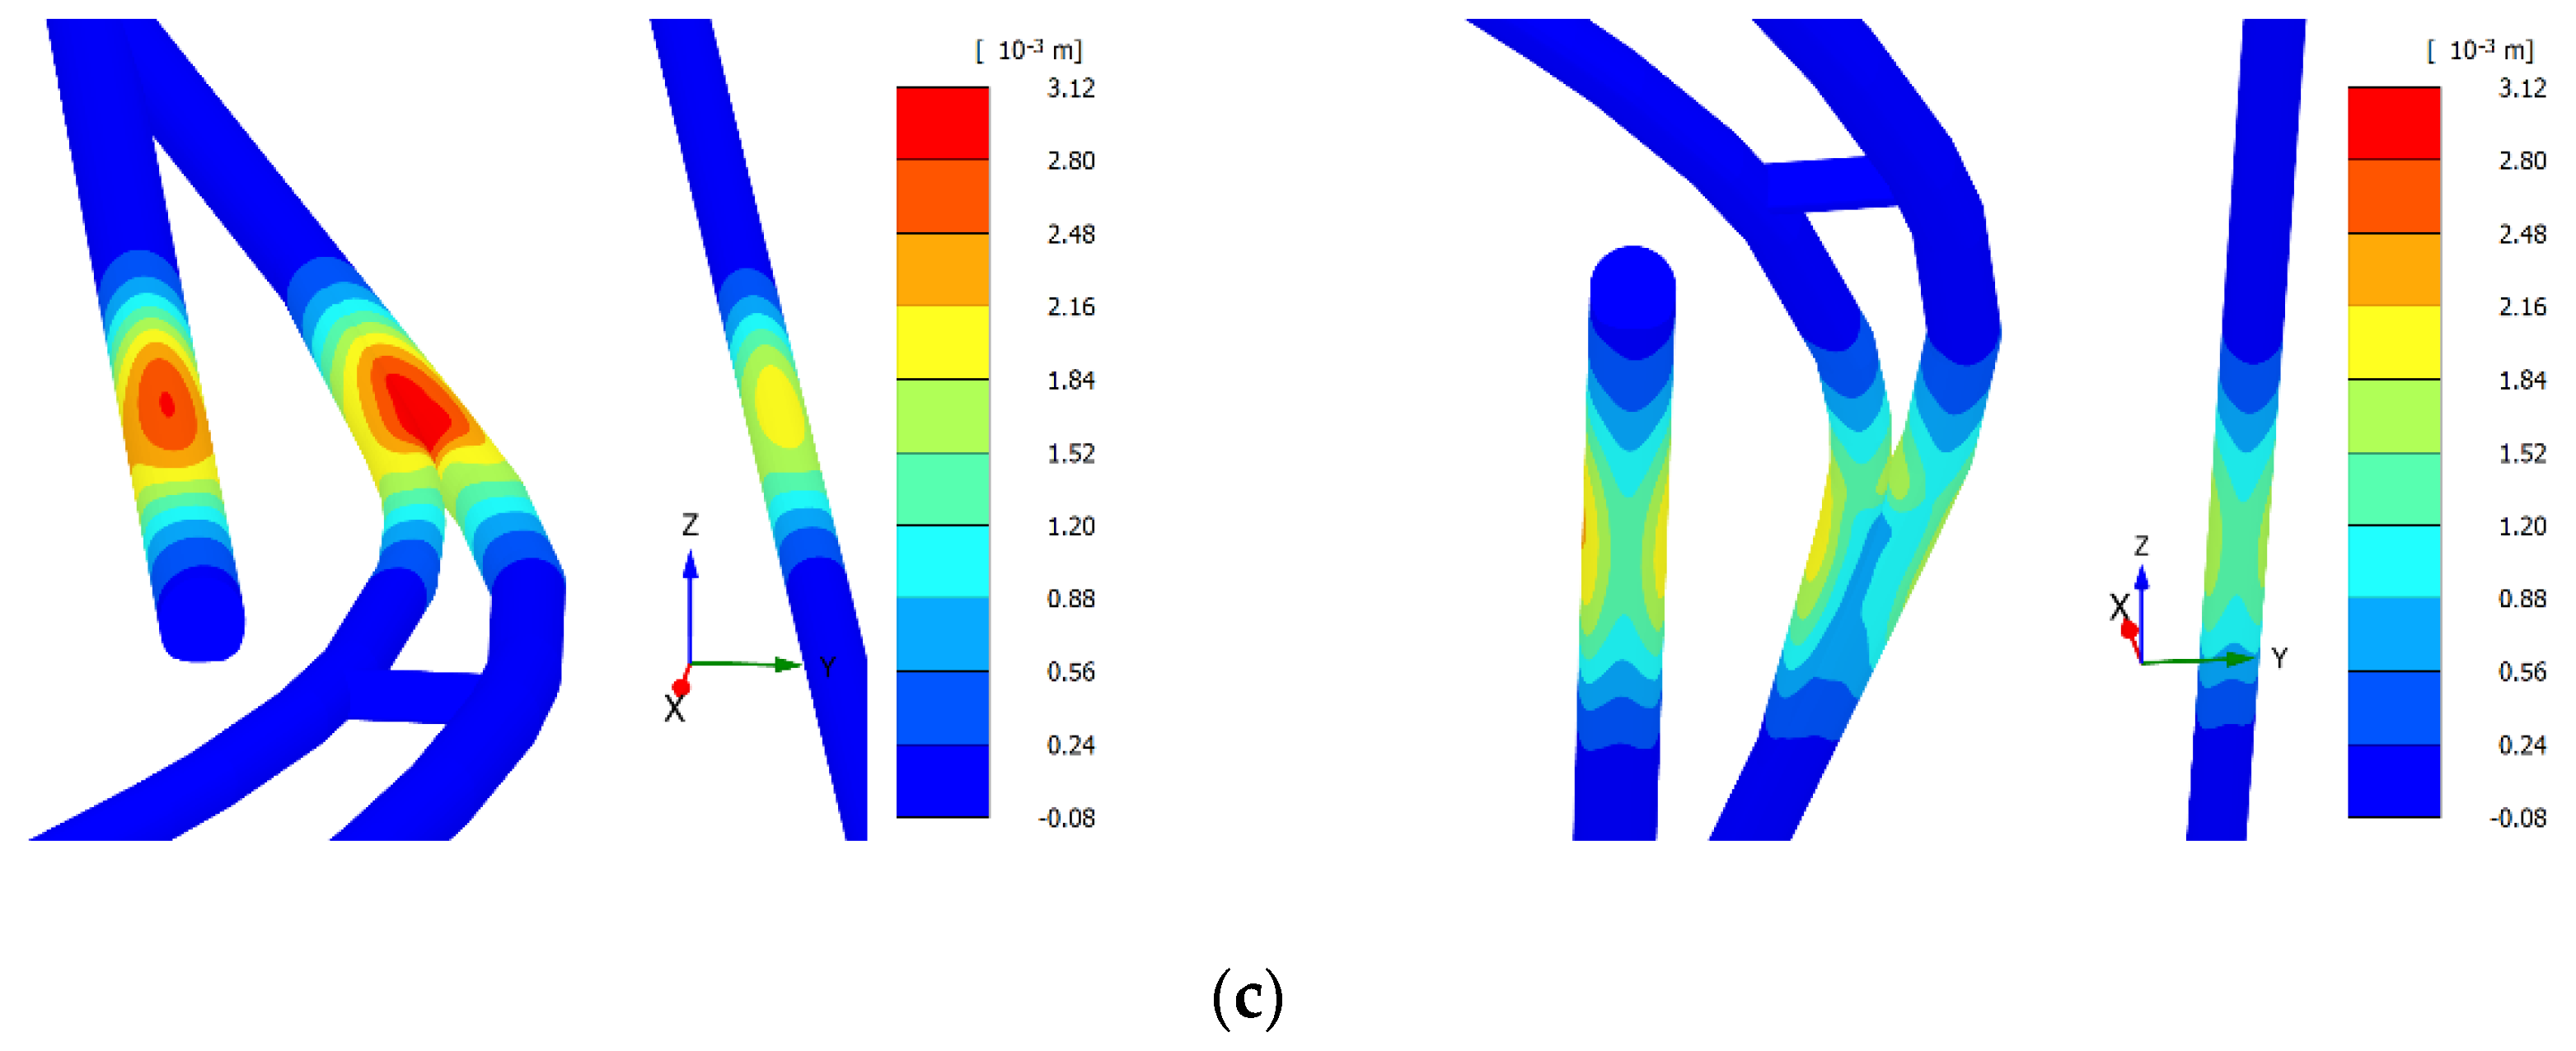
4.1. Tunnel Vertical Displacement

Figure 9 illustrates the development of vertical displacement at the top of the tunnel during the excavation of the foundation pit. It can be seen that the vertical displacement is greater than 0 in most cases, both in simulated and measured results, indicating that the deformation of the tunnels caused by the excavation is dominated by the heave deformation and there is almost no settlement. The maximum heave displacement of 3.1 mm is less than the displacement limit of 5 mm in all three stages. Comparing the field and simulated results, it can be found that in stage 3, the maximum heave of 2.7 mm is simulated and 2.2 mm is monitored, with a difference of 23%. The change trend and magnitude of the simulated and field data in the rest of the stages are basically the same, which suggests that the parameters of the numerical model are accurate. Comparing the variation of the outgoing and ingoing lines in the three stages, both tunnels show a high degree of approximation in both the range and the peak of variation. This result is consistent with the spatial proximity of the two tunnels. The outgoing and ingoing lines always have the largest heave displacement compared to the test and lead track lines, and the displacement development is concentrated in stage 3. In stages 4 and 5, the outgoing and ingoing line displacement increases very little. The test and lead track lines produced a heave of about 1 mm to 1.5 mm in stage 3, a significant increase in the test line heave in stage 4, and a significant increase in the lead track line heave in stage 5. The heave displacement curves of all four tunnels showed a normal distribution, affecting about twice the width of the excavation.

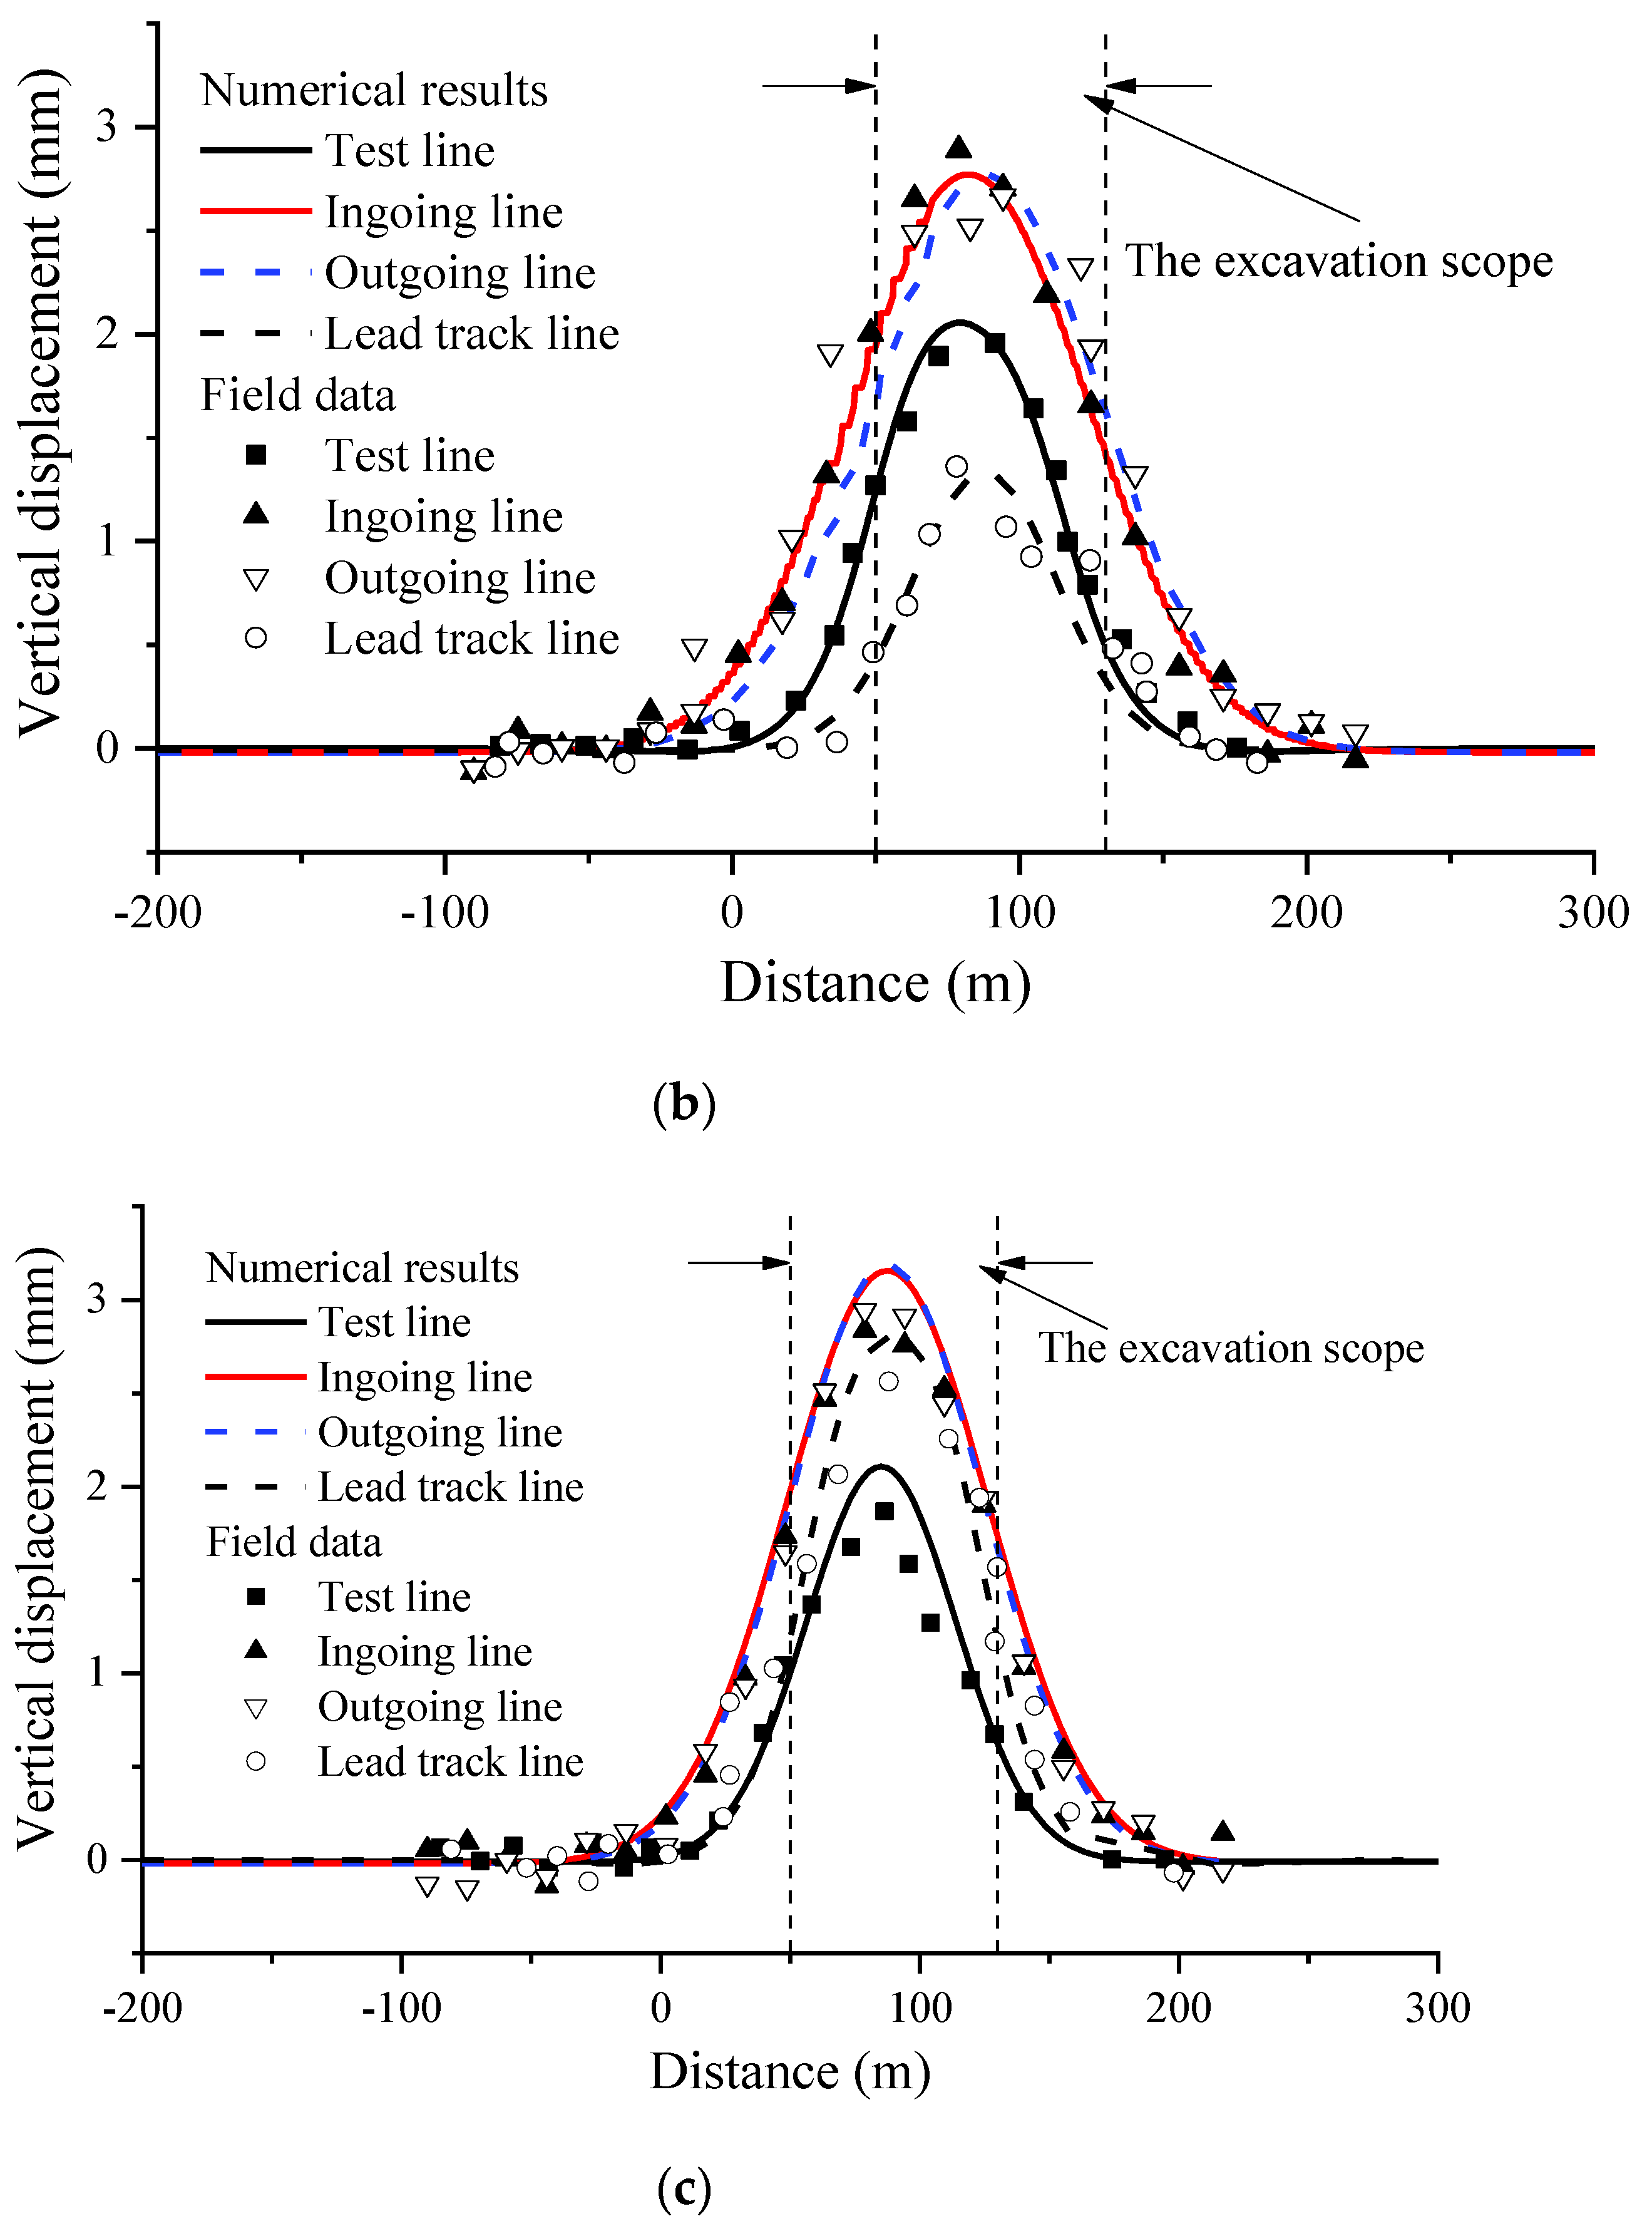
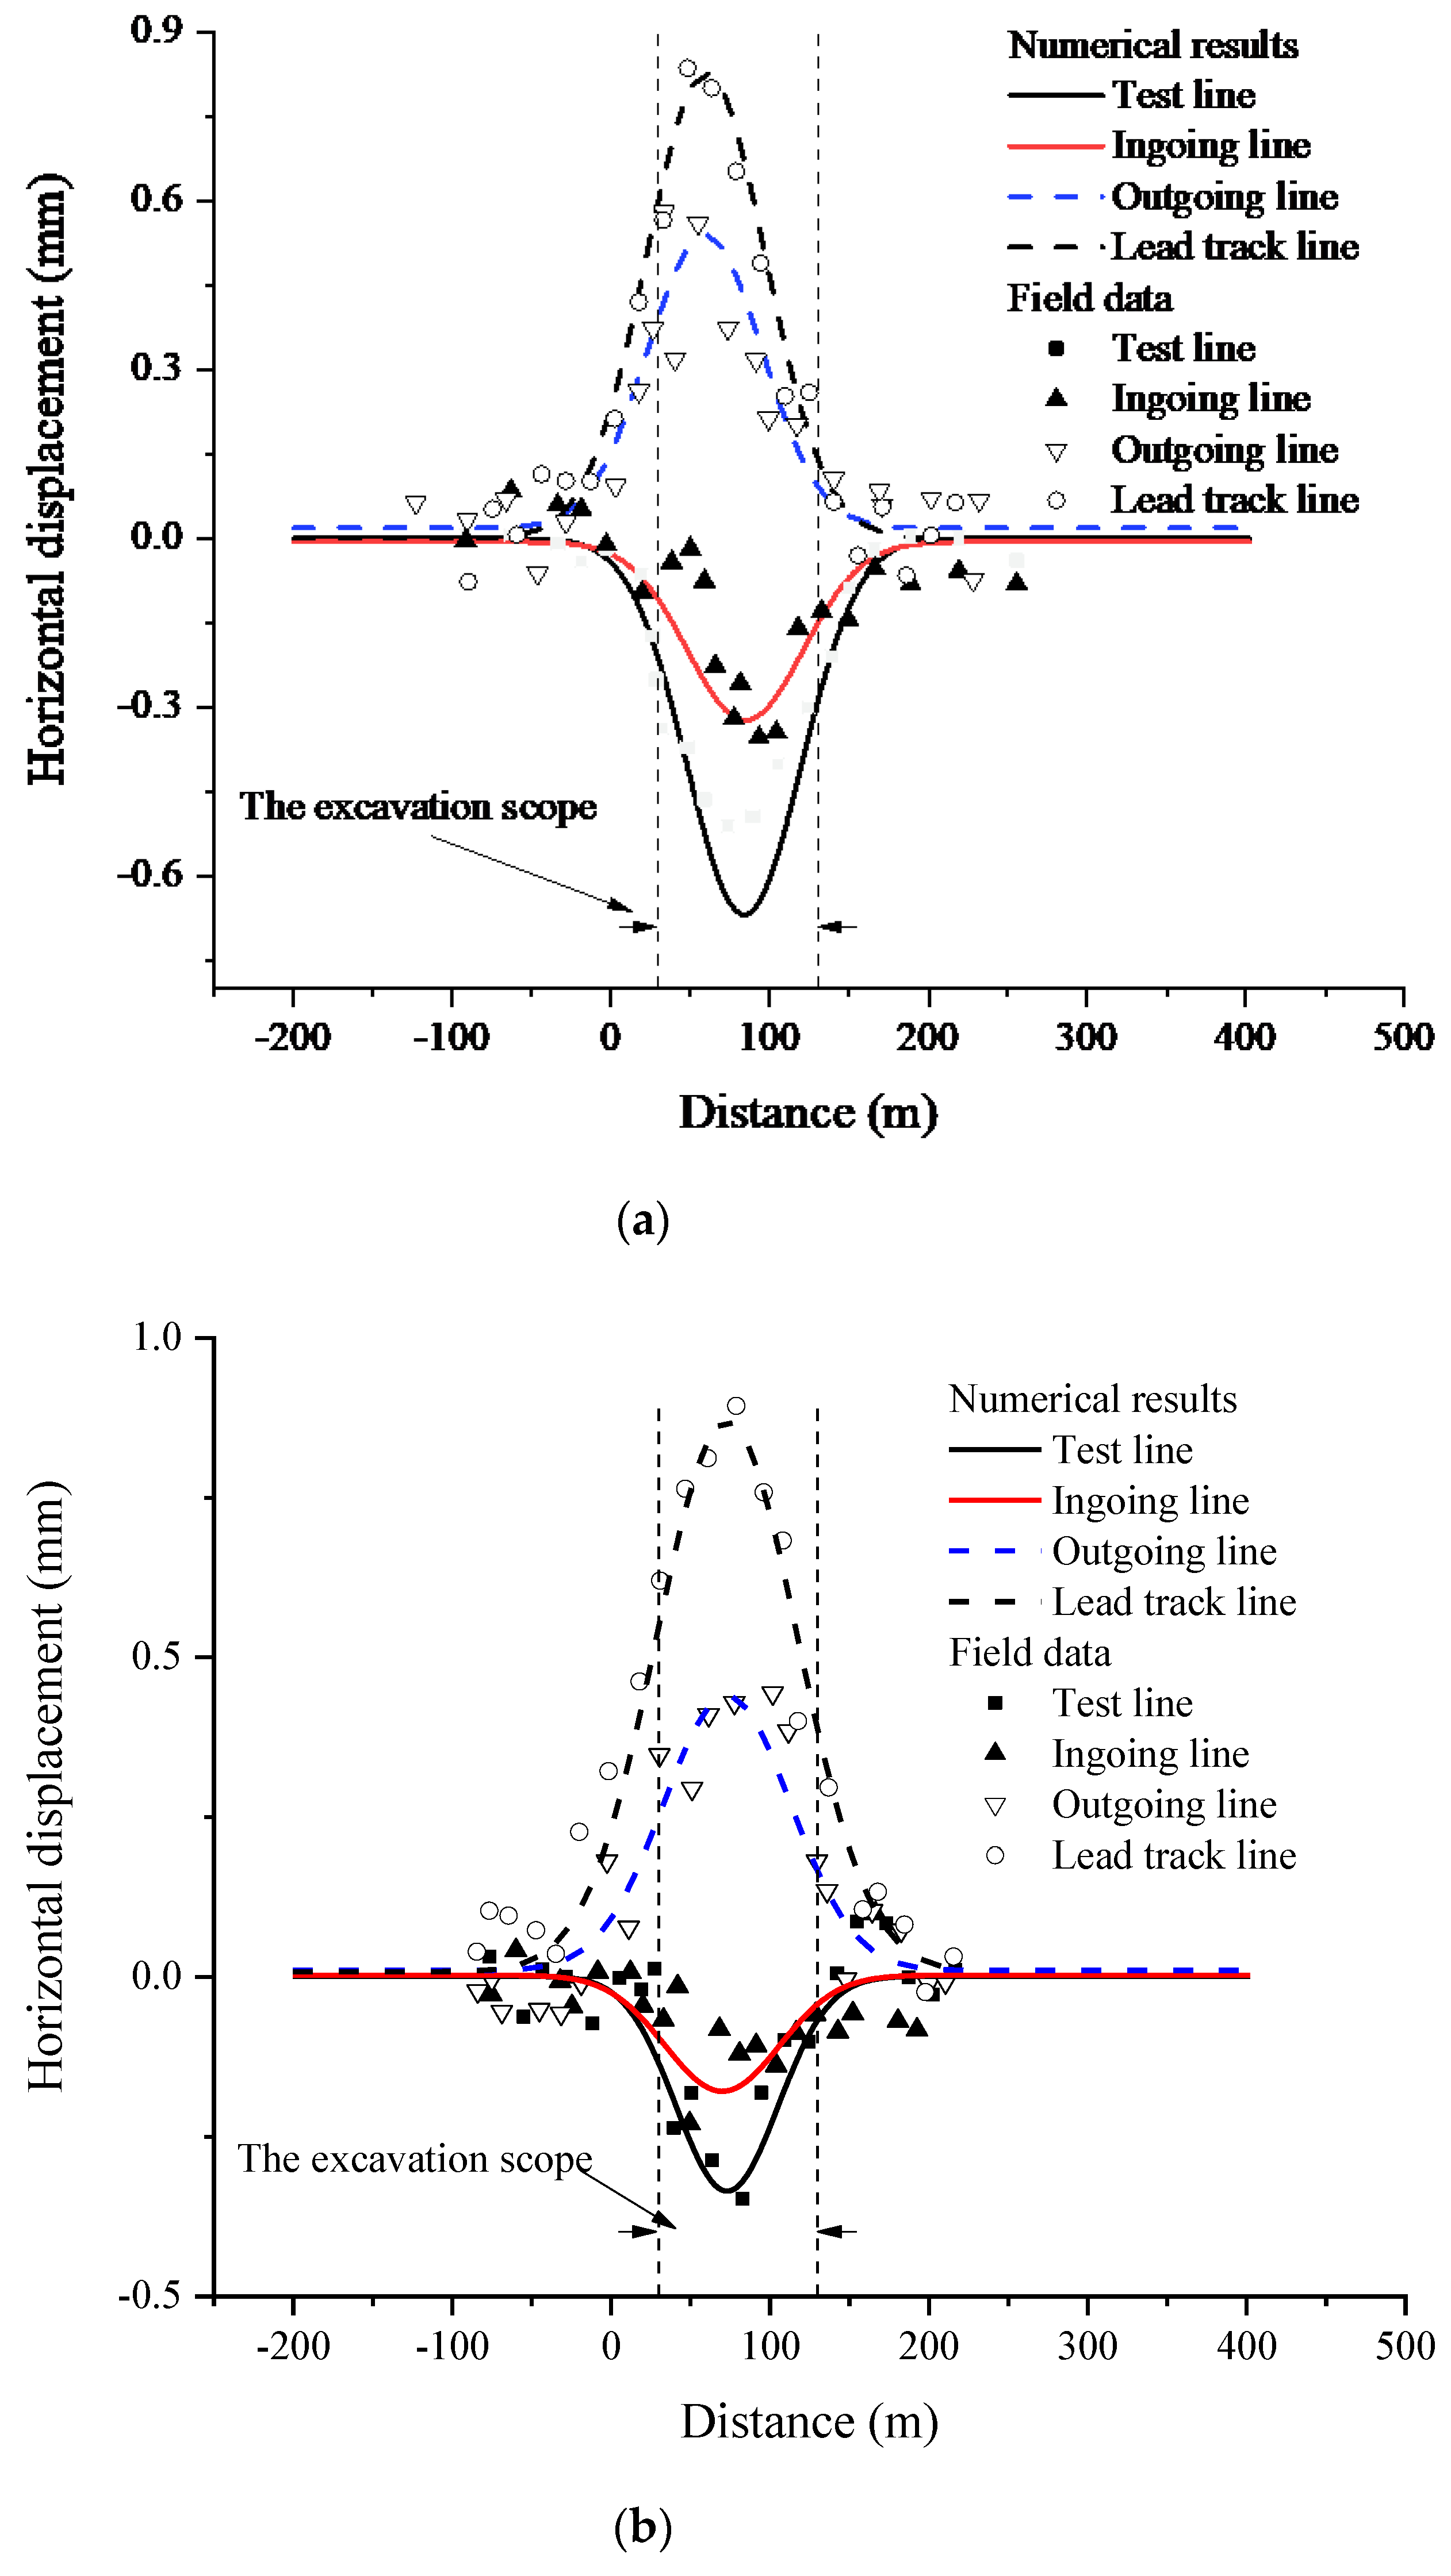
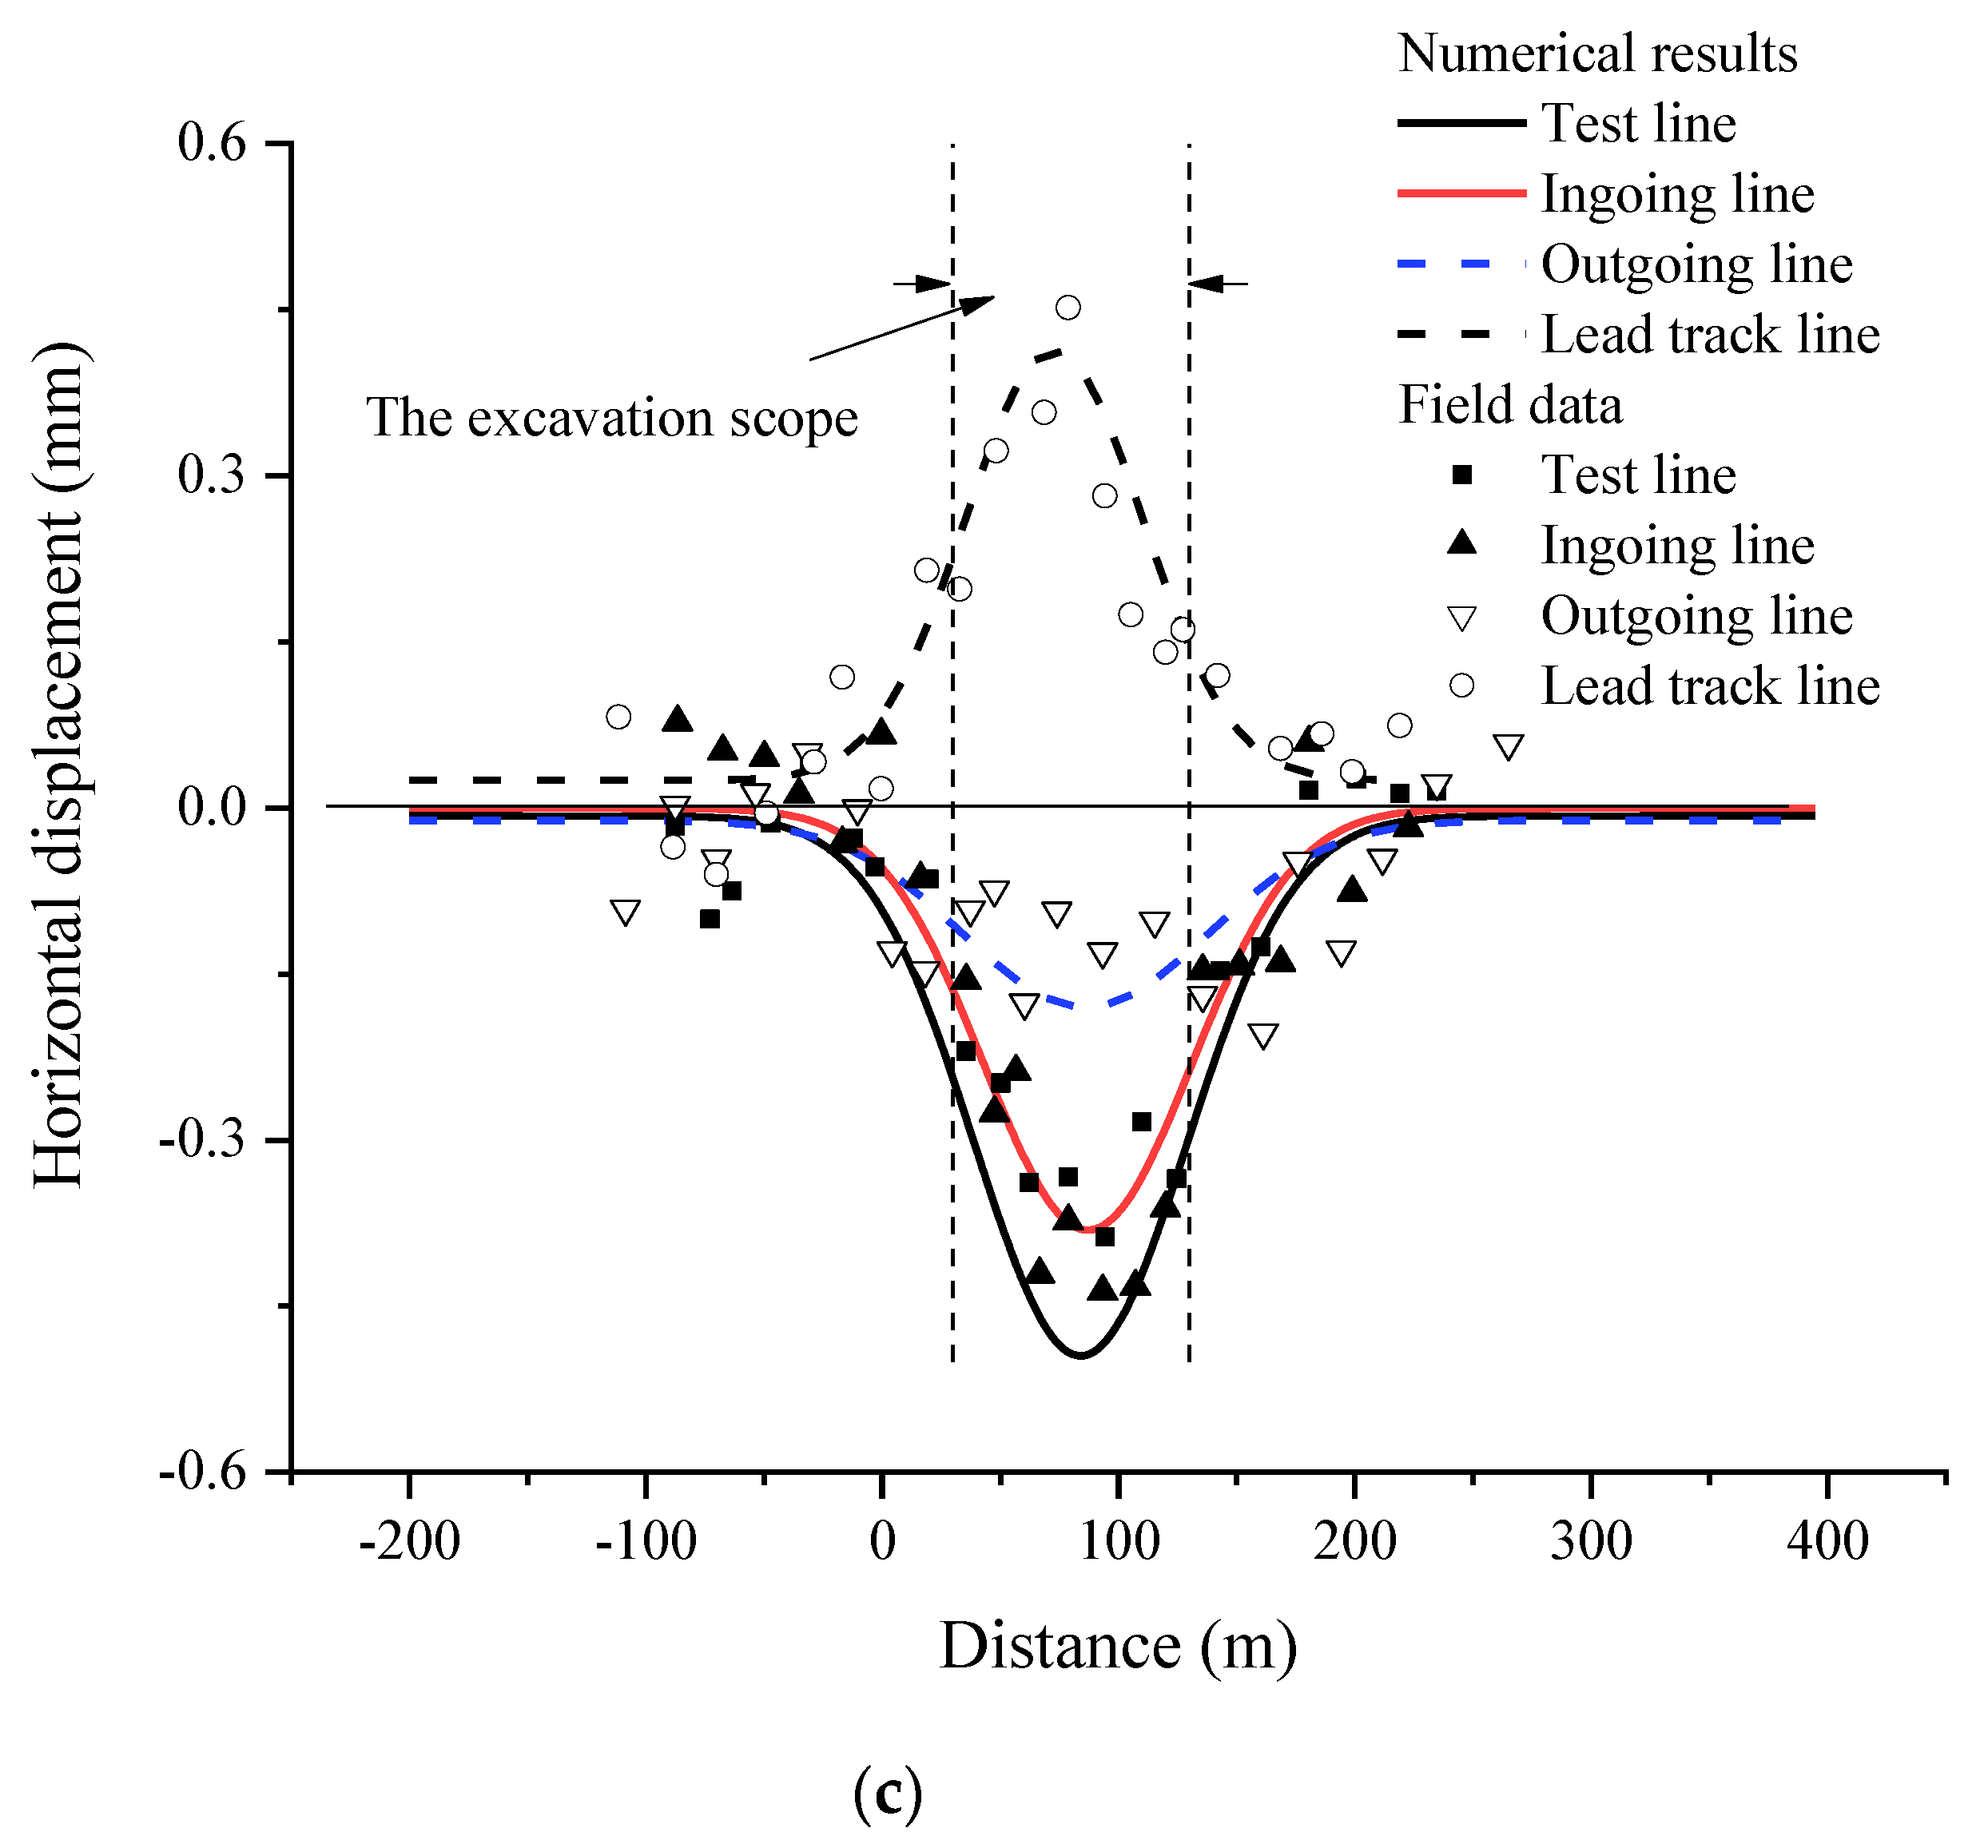
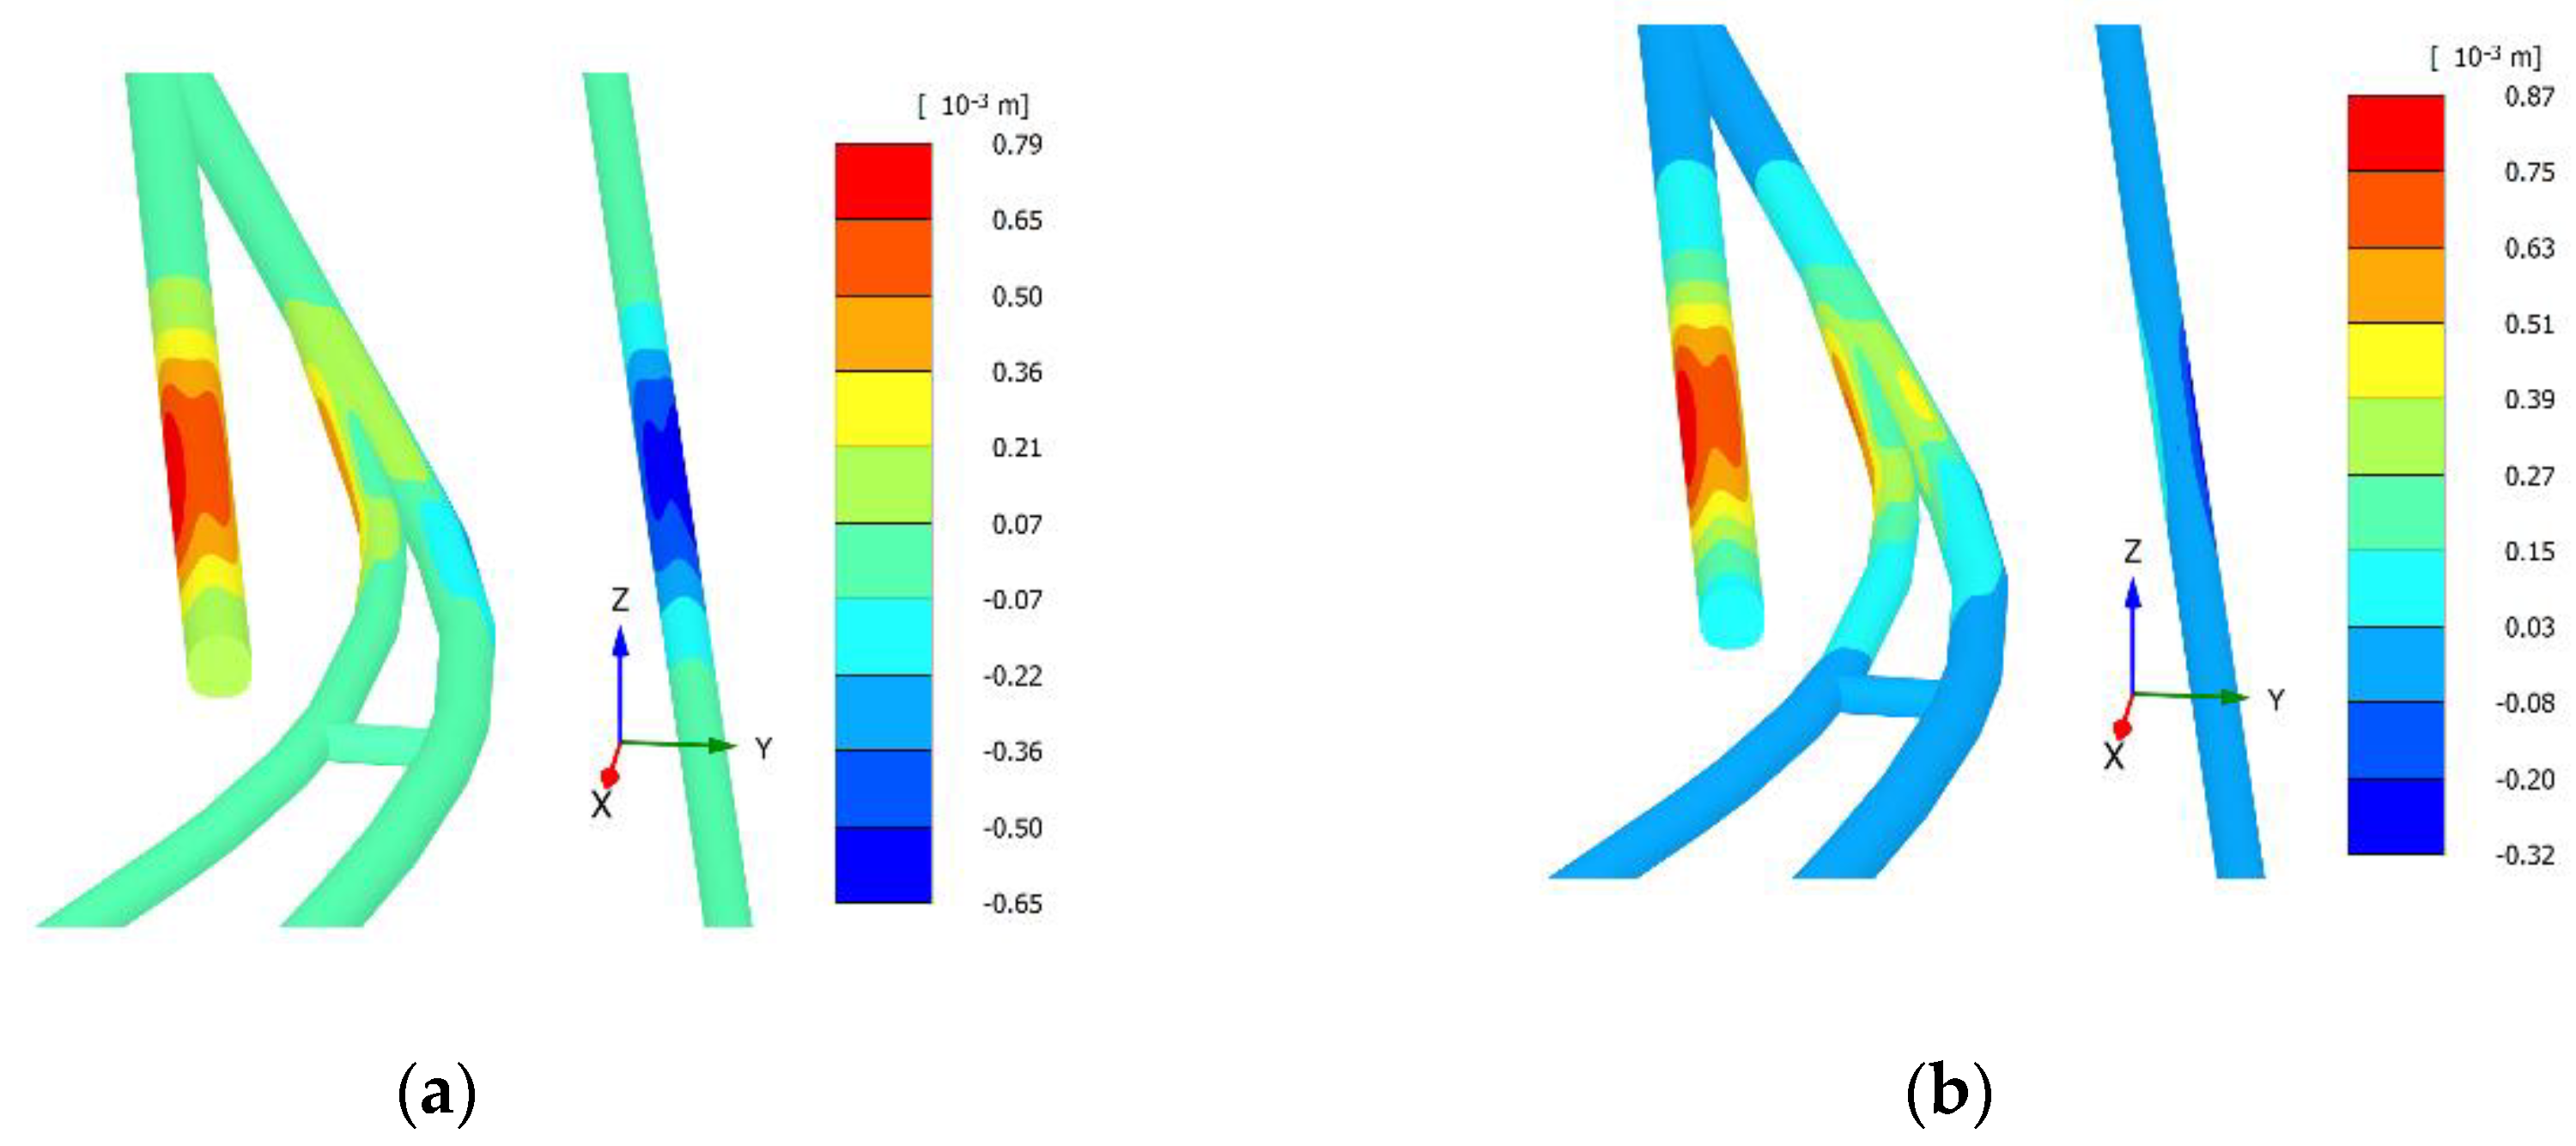
4.2. Horizontal Displacement of the Tunnel

Figure 10 demonstrates the development of horizontal displacement of the tunnel during the excavation of the foundation pit. The horizontal displacement is less than 1 mm in all stages, which is much smaller than the horizontal displacement limit of 10 mm, and the simulated and monitored results take the same values basically. In stage 4, the horizontal displacement of the outgoing line and the lead track line decreases. In stage 5, the displacement of the test line and the ingoing line decreases. The maximum horizontal displacement occurs in the first excavation stage. Figure 10a shows that during the excavation of section B, the horizontal displacements of both tunnels below section B are small, while both tunnels away from section B produce larger displacements. Combining the excavation sequence of the pit and the horizontal displacement development pattern of the four tunnels, the horizontal displacement of the soil directly below the pit is small, while the soil on the sides will produce a larger horizontal displacement pointing to the pit.

4.3. Horizontal Convergence of the Tunnel

Figure 11 demonstrates the simulated nephogram of the horizontal displacement of the tunnel, and the horizontal convergence distribution can be seen from the horizontal displacement on both sides of the tunnel. Figure 11a shows that in stage 3, the outgoing and ingoing line intersection shows obvious horizontal convergence, while the other two tunnels mainly show horizontal movement instead of convergence. In stage 4, the convergence of the test line is slight, but the maximum convergence of 1.2 mm is still at the intersection of the outgoing and ingoing lines. In stage 5, the maximum convergence of 0.9 mm gets weakened and is observed in the lead track line. Taking into account the excavation sequence and the convergence changes, it can be concluded that the excavation has a greater effect on the convergence of the tunnel directly below it, while it has a smaller effect on the tunnels farther out. The convergence of the four tunnels is much less than the limit of 10 mm.

4.4. Vertical Convergence of the Tunnels

The nephogram of the vertical displacement of the tunnel demonstrated in Figure 12 reveals that the tunnel vertical convergence is negative in all three stages, which means that the tunnel is elongated in the vertical direction. The change in the absolute value of the vertical convergence is similar to the horizontal convergence. In stage 3, the vertical convergence is most obvious at the intersection of the outgoing and ingoing lines. The absolute value of convergence increases in stage 4 and stage 5 for the test and lead track lines, respectively. The most significant convergence occurs at the intersection of the outgoing and ingoing lines in stage 5, with a convergence of −2.6 mm, which is less than the limit of ±10 mm.

4.5. Tunnel Stress

Figure 13 shows the tunnel lining moment distribution at stage 2. When the tunnels are constructed, there is a significant stress concentration at the intersection of multiple tunnels. The lining moment gradually decreases as excavation proceeds. Although the reduction of the moment is small, about 4.1% of the lining moment at stage 2, the excavation did cause the unloading of the lining. Figure 14 shows the deformation of the lining at the time of the tunnel accomplished and after the excavation of the pit. There is a tendency for the tunnel to be flattened at the time of tunnel completion, while there is a tendency for the tunnel to be pulled up at the time of pit excavation, so these two deformation patterns are diametrically opposed. This explains the reduction of the lining moment due to excavation. Equation (17) defines the tunnel stress variation rate Rs, where Minitial is the moment of the tunnel lining at the beginning of the construction and Mpost is the moment after the excavation of the corresponding stage. Figure 15 shows the variation of Rs under each excavation stage for the non-intersection tunnel. The decreasing trend of the lining bending moment at the three parts of the lead track line is illustrated in Figure 15. The most significant decrease is found at the side of the tunnel, where the bending moment decreases by 42% after all excavation is completed. The bottom of the tunnel is the least sensitive to excavation, with a maximum drop of only 6%. In addition, the Rs reduction is larger during section B and c excavation, while the Rs variation is smaller during section A excavation. This is because section A is farthest from the lead track line, which also indicates that the excavation-induced unloading has the greatest effect on the structures below the excavation, while it has almost no effect on the structures farther away in the horizontal distance.
R s = M p o s t M i n i t i a l M i n i t i a l × 100 %

5. Conclusions

In this paper, a 3D finite element model with complex shapes was developed using HSS and HB constitutive models to study the effect of large deep foundation excavation on the underlying complex intersecting tunnels. The model uses multiple methods to determine the geotechnical parameters and it was rationalized based on the field data. The simulated and measured results are in good agreement for all three stages. The deformation and internal force response of the tunnel are analyzed in depth. Based on the above, the following results were obtained.
  • The effect of excavation on the tunnel is mainly distributed near the excavation area and has a normal distribution trend. The displacement of the tunnel below the center of the excavation is the largest, and the tunnel outside the 2 times excavation scope is almost unaffected. Therefore, the tunnel monitoring points should be arranged within the 2 times the excavation scope and encrypted at the center. In addition, the maximum vertical displacement of the tunnel is 3.1 mm and the maximum horizontal displacement is 0.87 mm, so the monitoring should focus on the vertical displacement of the tunnel.
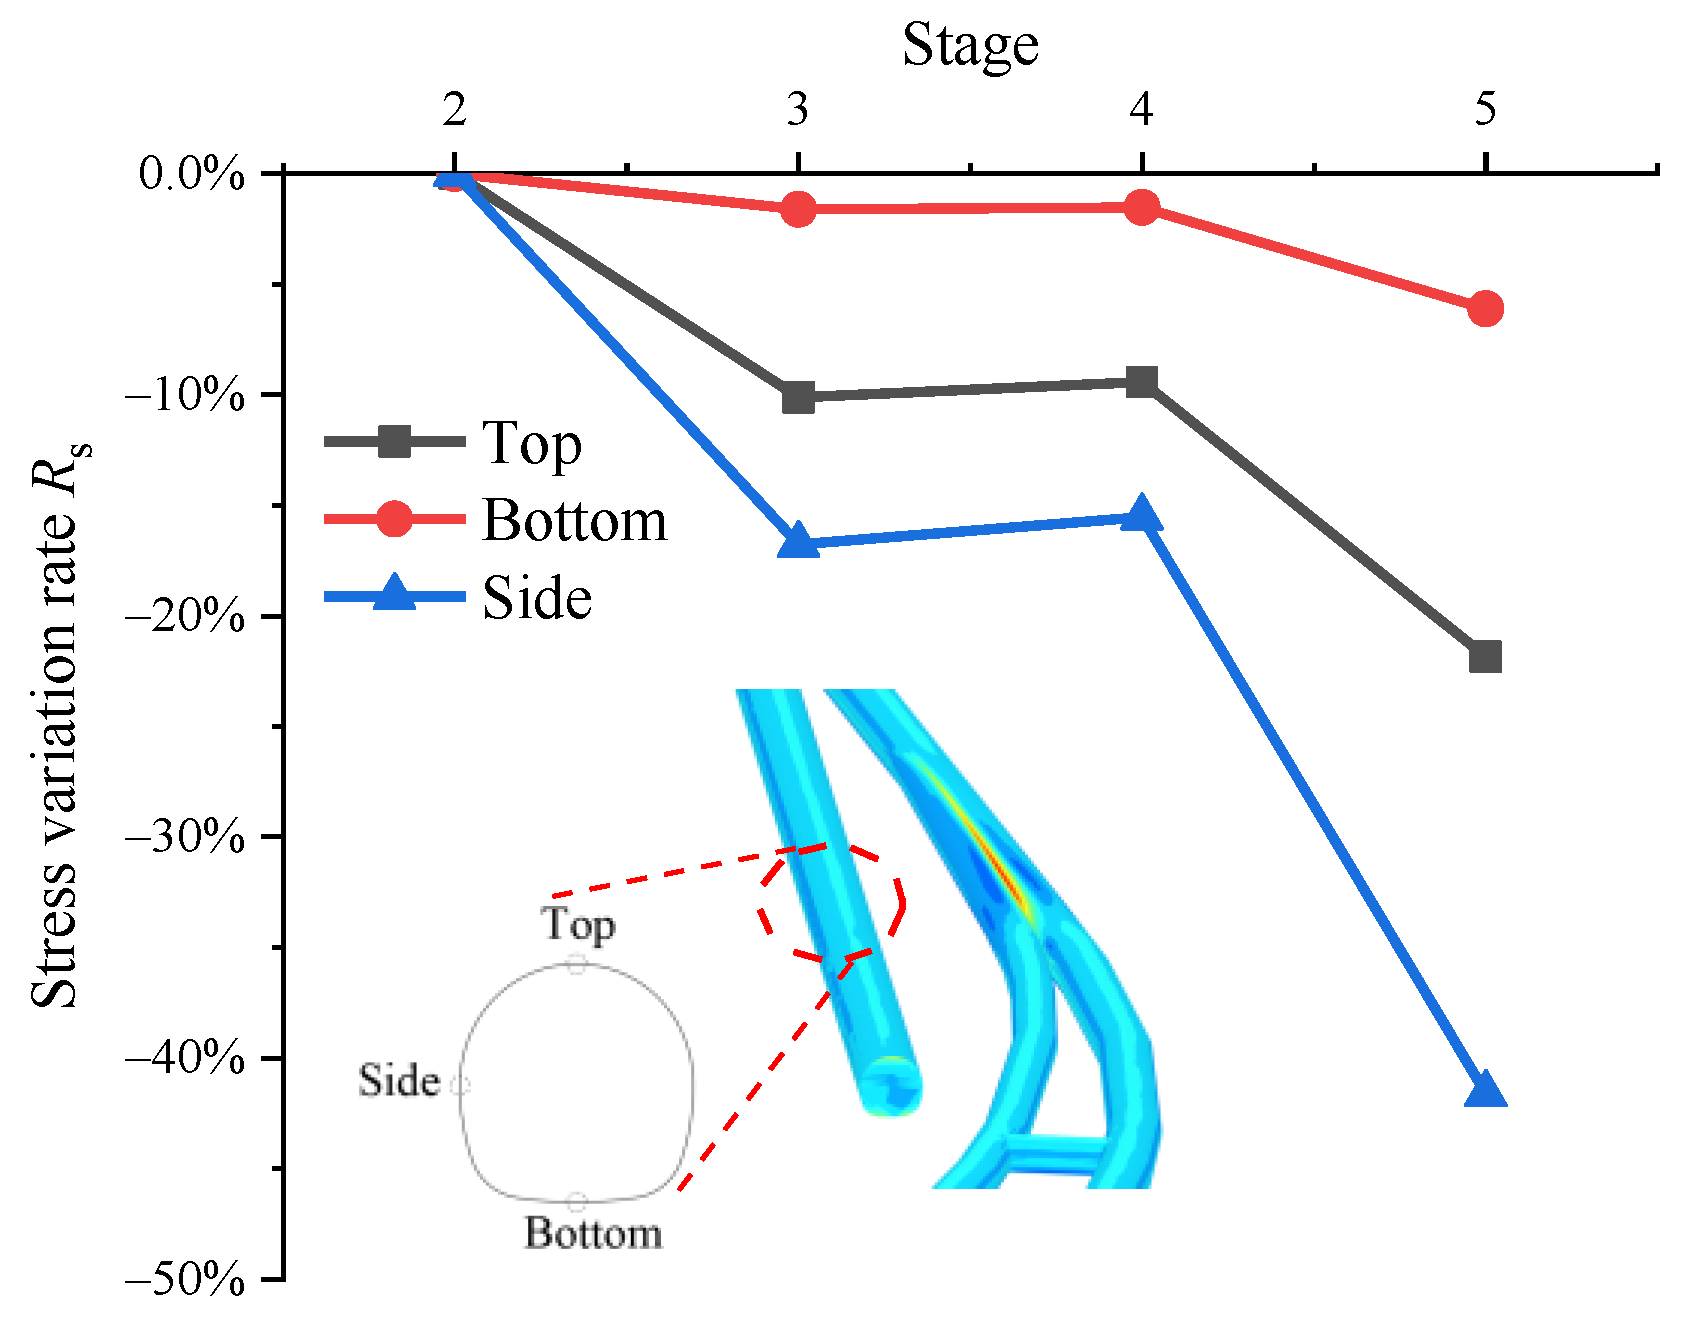
  • In the tunnel section, the displacement distribution is not uniform, and the uplift of the top of the tunnel is much larger than the bottom, so the monitoring points of vertical displacement should be mostly distributed at the top. The stress analysis of the tunnel section shows that the stress change in the tunnel side lining is the largest, followed by the top of the tunnel. Therefore, the tunnel cracks and stress monitoring points should be located at the side and top of the tunnel.
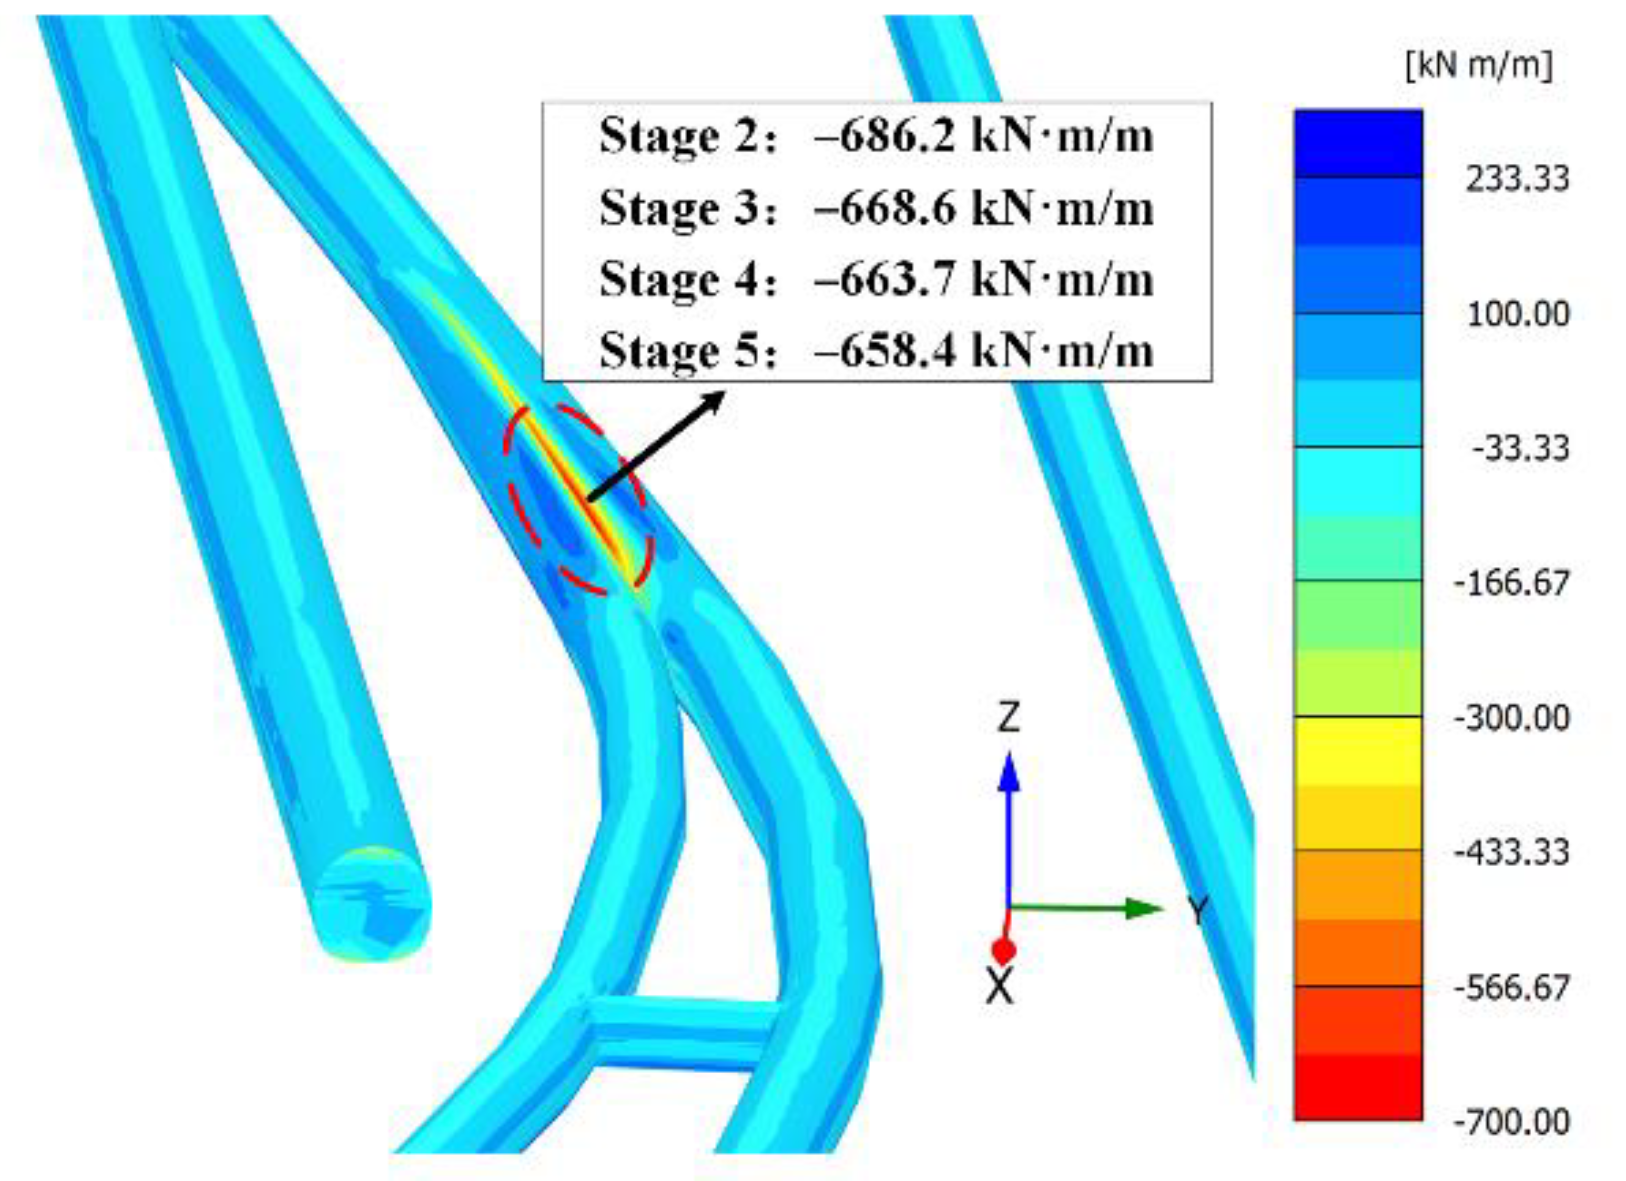
  • There are stress concentrations and larger deformations in the tunnel intersection area. This is because the flat profile of the intersection zone is more prone to deformation under unloading than the nearly circular profile of the non-intersection zone. Therefore, the stress and displacement in the intersection zone should be closely monitored.
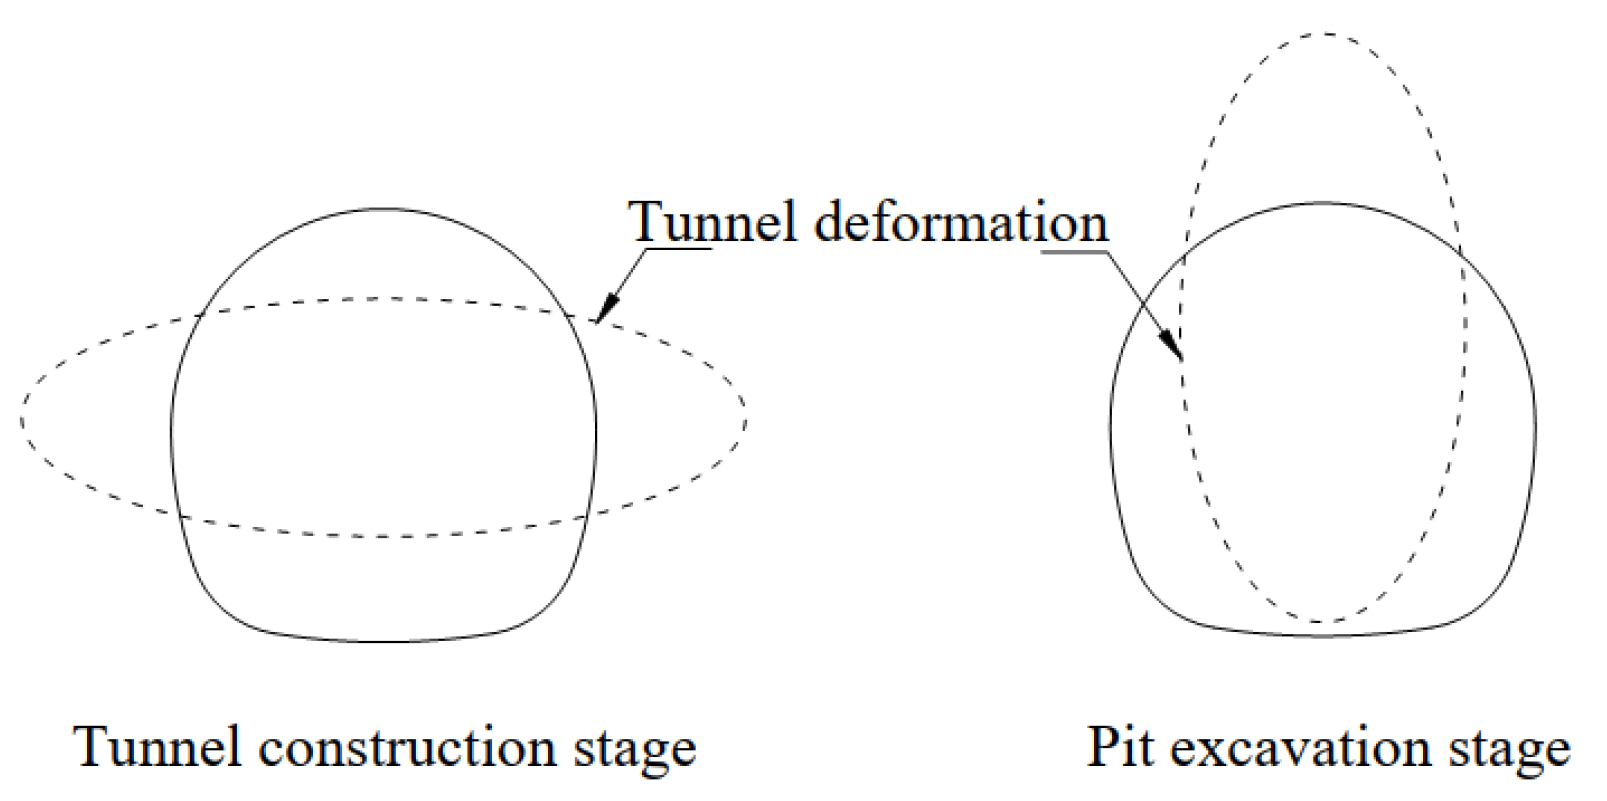
  • The tunnel is flattened by earth pressure at the beginning and then slightly pulled up during excavation. These two deformation patterns are diametrically opposed and cause significant changes in the top displacement and side lining stresses of the tunnel.
  • Future studies could consider in more detail the effects of pit dewatering, pit support forms, excavation sequence, and tunnel support methods on tunnel stresses and displacements.

Author Contributions

Conceptualization, G.D. and Z.L.; methodology, Z.L.; validation, G.D.; formal analysis, H.W. and Z.Y.; investigation, X.Z.; resources, X.Z.; data curation, S.C.; writing—original draft preparation, Z.L.; writing—review and editing, G.D.; project administration, X.Z. All authors have read and agreed to the published version of the manuscript.

Funding

This research was funded by the Science and Technology Research and Development Project of CSCEC (CSCEC-2020-Z-21), and the National Natural Science Foundation of China (NSFC Grant No.s 52078128, 51878160).

Institutional Review Board Statement

Not applicable.

Informed Consent Statement

Not applicable.

Data Availability Statement

Data are contained within the article.

Conflicts of Interest

The authors declare no conflict of interest.

References

  1. Wu, C.-J.; Ye, G.-L.; Zhang, L.-L.; Bishop, D.; Wang, J.-H. Depositional environment and geotechnical properties of Shanghai clay: A comparison with Ariake and Bangkok clays. Bull. Eng. Geol. Environ. 2014, 74, 717–732. [Google Scholar] [CrossRef]
  2. Li, M.-G.; Wang, J.-H.; Chen, J.-J.; Zhang, Z.-J. Responses of a Newly Built Metro Line Connected to Deep Excavations in Soft Clay. J. Perform. Constr. Facil. 2017, 31, 04017096. [Google Scholar] [CrossRef]
  3. Ye, G.-L.; Lin, N.; Bao, X.-H.; Gu, L.; Yadav, S.K. Effect of Quaternary transgression and regression on the engineering properties of Shanghai soft clays. Eng. Geol. 2018, 239, 321–329. [Google Scholar] [CrossRef]
  4. Devriendt, M.; Doughty, L.; Morrison, P.; Pillai, A. Displacement of tunnels from a basement excavation in London. Proc. Inst. Civ. Eng.-Geotech. Eng. 2010, 163, 131–145. [Google Scholar] [CrossRef]
  5. Li, M.-G.; Chen, J.-J.; Wang, J.-H.; Zhu, Y.-F. Comparative study of construction methods for deep excavations above shield tunnels. Tunn. Undergr. Space Technol. 2018, 71, 329–339. [Google Scholar] [CrossRef]
  6. Tan, Y.; Li, X.; Kang, Z.; Liu, J.; Zhu, Y. Zoned Excavation of an Oversized Pit Close to an Existing Metro Line in Stiff Clay: Case Study. J. Perform. Constr. Facil. 2015, 29, 04014158. [Google Scholar] [CrossRef]
  7. Liu, G.B.; Huang, P.; Shi, J.W.; Ng, C.W.W. Performance of a Deep Excavation and Its Effect on Adjacent Tunnels in Shanghai Soft Clay. J. Perform. Constr. Facil. 2016, 30, 04016041. [Google Scholar] [CrossRef]
  8. Liang, R.Z.; Xia, T.D.; Huang, M.S.; Lin, C.G. Simplified analytical method for evaluating the effects of adjacent excava-tion on shield tunnel considering the shearing effect. Comput. Geotech. 2017, 81, 167–187. [Google Scholar] [CrossRef]
  9. Ng, C.W.W.; Sun, H.S.; Lei, G.H.; Shi, J.W.; Masin, D. Ability of three different soil constitutive models to predict a tun-nel’s response to basement excavation. Can. Geotech. J. 2015, 52, 1685–1698. [Google Scholar] [CrossRef]
  10. Zheng, J.; He, S.; Li, Y.; He, J.; He, J. Longitudinal Deformation of Deep Shield Tunnels Caused by Upper Load Reduction. Materials 2021, 14, 3629. [Google Scholar] [CrossRef]
  11. Zhang, Z.; Huang, M.; Wang, W. Evaluation of deformation response for adjacent tunnels due to soil unloading in exca-vation engineering. Tunn. Undergr. Space Technol. 2013, 38, 244–253. [Google Scholar] [CrossRef]
  12. Liang, R.; Xia, T.; Hong, Y.; Yu, F. Effects of above-crossing tunnelling on the existing shield tunnels. Tunn. Undergr. Space Technol. 2016, 58, 159–176. [Google Scholar] [CrossRef]
  13. Zhang, X.; Ou, X.; Yang, J.; Fu, J. Deformation Response of an Existing Tunnel to Upper Excavation of Foundation Pit and Associated Dewatering. Int. J. Geomech. 2017, 17, 04016112. [Google Scholar] [CrossRef]
  14. Li, M.-G.; Xiao, X.; Wang, J.-H.; Chen, J.-J. Numerical study on responses of an existing metro line to staged deep excava-tions. Tunn. Undergr. Space Technol. 2019, 85, 268–281. [Google Scholar] [CrossRef]
  15. Yang, T.; Tong, L.; Pan, H.; Wang, Z.; Chen, X.; Li, H. Effect of Excavation Sequence on Uplift Deformation of Underlying Existing Metro Tunnel. J. Perform. Constr. Facil. 2021, 35, 04021003. [Google Scholar] [CrossRef]
  16. Wang, K.; Miao, M.; Zhou, H. Effects of Large-Scale Unloading on Existing Shield Tunnels in Sandy Gravel Strata. Geotech. Geol. Eng. 2021, 39, 3401–3416. [Google Scholar] [CrossRef]
  17. Shi, J.; Ng, C.W.; Chen, Y. A simplified method to estimate three-dimensional tunnel responses to basement excavation. Tunn. Undergr. Space Technol. 2017, 62, 53–63. [Google Scholar] [CrossRef]
  18. Chen, J.; Wang, J.; Du, Y.; Wen, S.; Xiang, G. Movement of the Shallow Operating Tunnel due to Adjacent Deep Excavation on Both Sides. Chin. J. Undergr. Space Eng. 2011, 7, 1163–1167, 1173. [Google Scholar]
  19. Liu, H.; Li, P.; Liu, J. Numerical investigation of underlying tunnel heave during a new tunnel construction. Tunn. Undergr. Space Technol. 2011, 26, 276–283. [Google Scholar] [CrossRef]
  20. Huang, X.; Schweiger, H.F.; Huang, H.-W. Influence of Deep Excavations on Nearby Existing Tunnels. Int. J. Geomech. 2013, 13, 170–180. [Google Scholar] [CrossRef]
  21. Benz, T. Small-strain Stiffness of Soils and its Numerical Consequences. Ph.D. Thesis, University Stuttgart, Stuttgart, Germany, 2007. [Google Scholar]
  22. Liu, Z.X. Plaxis Advanced Application Tutorial, 3rd ed.; China Machine Press: Beijing, China, 2015; pp. 1–20. [Google Scholar]
  23. Dalai, S.; Patra, C. Prediction of Angle of Internal Friction Based on SPT N Values. In Proceedings of the Indian Geotechnical Conference 2019: Lecture Notes in Civil Engineering, Singapore, 21 December 2019; pp. 471–477. [Google Scholar]
  24. Chang, S.B.; Zhang, S.M. Engineering Geology Handbook, 4th ed.; China Construction Industry Press: Beijing, China, 2006; pp. 170–194. [Google Scholar]
  25. Lidar. Technical Code for Building Foundatiaon, 1st ed.; Liaoning Science and Technology Press: Shenyang, China, 2015; pp. 220–221. [Google Scholar]
  26. Zhang, K.G.; Liu, S.Y. Geotechnics; China Construction Industry Press: Beijing, China, 2011; p. 136. [Google Scholar]
  27. Manoj, R.B.J.B.L.M.Z.N.R. PLAXIS CONNECT Edition V20; PLAXIS Company: Amsterdam, The Netherlands, 2019; pp. 987–1280. [Google Scholar]
  28. Hoek, E.; Diederichs, M.S. Empirical estimation of rock mass modulus. Int. J. Rock Mech. Min. Sci. 2006, 43, 203–215. [Google Scholar] [CrossRef]
  29. Van Langen, H.; Vermeer, P.A. Interface elements for singular plasticity points. Int. J. Numer. Anal. Methods Geomech. 1991, 15, 301–315. [Google Scholar] [CrossRef]
  30. Naji, A.M.; Rehman, H.; Emad, M.Z.; Yoo, H. Impact of Shear Zone on Rockburst in the Deep Neelum-Jehlum Hydropower Tunnel: A Numerical Modeling Approach. Energies 2018, 11, 1935. [Google Scholar] [CrossRef] [Green Version]
  31. Jodhpur Development Authority. Technical Specification for Monitoring Measurement of Urhan Rail Transit Engineering in Jiangsu Province, 1st ed.; Jiangsu Phoenix Science and Technology Press: Nanjing, China, 2008; pp. 231–256. [Google Scholar]
Figure 1. Plan layout of tunnels and pit.
Applsci 12 04530 g001
Figure 2. Profile of tunnels and deep excavations: (a) profile 1–1, (b) profile 2–2, (c) profile 3–3.
Applsci 12 04530 g002
Figure 3. Geotechnical profile and properties of soil and rock.
Applsci 12 04530 g003
Figure 4. The model mesh.
Applsci 12 04530 g004
Figure 5. Mesh of tunnels and support piles.
Applsci 12 04530 g005
Figure 6. Simplification treatment of support structure: (a) reinforced concrete support layout; (b) support pile displacement; (c) simplified model.
Applsci 12 04530 g006
Figure 7. N63.5 data for the highly weathered muddy sandstone.
Applsci 12 04530 g007
Figure 8. Simulation stages: (a) stage 1: earth stress equilibrium, (b) stage 2: tunnel excavation, (c) stage 3: section B excavation, (d) stage 4: section A excavation, (e) stage 5: section C excavation.
Applsci 12 04530 g008
Figure 9. Numerical results and field data of vertical displacement of the tunnel: (a) stage 3, (b) stage 4, (c) stage 5.
Applsci 12 04530 g009aApplsci 12 04530 g009b
Figure 10. Numerical results and field data of horizontal displacement of the tunnel: (a) stage 3, (b) stage 4, (c) stage 5.
Applsci 12 04530 g010aApplsci 12 04530 g010b
Figure 11. Nephogram of the horizontal displacement (y-direction) of the tunnels: (a) stage 3, (b) stage 4, (c) stage 5.
Applsci 12 04530 g011aApplsci 12 04530 g011b
Figure 12. Nephogram of vertical displacement of tunnels: (a) stage 3, (b) stage 4, (c) stage 5.
Applsci 12 04530 g012aApplsci 12 04530 g012b
Figure 13. Nephogram of tunnel lining moment.
Applsci 12 04530 g013
Figure 14. Tunnel deformation diagram.
Applsci 12 04530 g014
Figure 15. Non-intersection tunnel stress reduction.
Applsci 12 04530 g015
Table 1. Excavation information.
SequenceExcavation SectionDepth of Piles (m)Depth of Excavation (m)Date (dd/mm/yy)Days (d)
1Section B8.73–11.685.73–8.683 March 2021–2 July 2021121
2Section A14.83–18.689.83–12.7821 June 2021–22 October 2021123
3Section C17.43–20.3812.43–15.3812 October 2021–25 January 2022105
Table 2. Empirical relationship between N63.5 and E0 for rubble.
N63.5246810121416
E0 (MPa)14.319.725.230.736.241.647.152.6
N63.518202224262830
E0 (MPa)58.163.569.074.580.085.491.0
Table 3. Empirical relationship between N63.5 and φ for rubble.
N63.524681012
φ (°)32.033.535.036.037.038.0
N63.5141618202530
φ (°)39.040.041.042.045.048.0
Table 4. Parameters in the HSS model.
γ/
(kN/m3)
Es(1–2)/
(kPa)
Eoedref/
(kPa)
E50ref/
(kPa)
Eurref/
(kPa)
mc/(kPa)φ (°)G0ref/
(kPa)
γ0.7
Miscellaneous fill18.760496049604930,2450.75131.022.660,4901 × 10−4
Plain fill18.541007772410020,500127.716.341,0001 × 10−4
Silty clay19.513,51013,51013,51054,0400.7563.923.794,5701 × 10−4
Highly weathered muddy sandstone21.559,82059,82059,820179,4600.50.039.5299,1001 × 10−4
Geotechnical reportTheoretical calculationSolidification fast shear testSPTHDPTLateral limit compression test
The color of the table represents the source of the data.
Table 5. Parameters in the HSS model.
γ/(kN/m3)νE/(kN/m3)σci/(kN/m3)miGSID
Moderately weathered muddy sandstone24.60.25679.254.7525600
Geotechnical reportuniaxial compressive testTheoretical calculationLiterature Recommendations
The color of the table represents the source of the data.
Publisher’s Note: MDPI stays neutral with regard to jurisdictional claims in published maps and institutional affiliations.

