
Clustering of Road Traffic Accidents as a Gestalt Problem


1
Department of Information Technology, University of Criminal Investigation and Police Studies, Cara Dušana 196, 11080 Belgrade, Serbia
2
Ministry of the Interior of the Republic of Serbia, Kneza Miloša 101, 11000 Belgrade, Serbia
3
School of Electrical and Computer Engineering, Academy of Technical and Art Applied Studies, Vojvode Stepe 283, 11000 Belgrade, Serbia
*
Author to whom correspondence should be addressed.
Appl. Sci. 2022, 12(9), 4543; https://0-doi-org.brum.beds.ac.uk/10.3390/app12094543
Submission received: 28 March 2022
/
Revised: 27 April 2022
/
Accepted: 27 April 2022
/
Published: 29 April 2022
(This article belongs to the Special Issue Applied Cognitive Sciences)
Abstract
:This paper introduces and illustrates an approach to automatically detecting and selecting “critical” road segments, intended for application in circumstances of limited human or technical resources for traffic monitoring and management. The reported study makes novel contributions at three levels. At the specification level, it conceptualizes “critical segments” as road segments of spatially prolonged and high traffic accident risk. At the methodological level, it proposes a two-stage approach to traffic accident clustering and selection. The first stage is devoted to spatial clustering of traffic accidents. The second stage is devoted to selection of clusters that are dominant in terms of number of accidents. At the implementation level, the paper reports on a prototype system and illustrates its functionality using publicly available real-life data. The presented approach is psychologically inspired to the extent that it introduces a clustering criterion based on the Gestalt principle of proximity. Thus, the proposed algorithm is not density-based, as are most other state-of-the-art clustering algorithms applied in the context of traffic accident analysis, but still keeps their main advantages: it allows for clusters of arbitrary shapes, does not require an a priori given number of clusters, and excludes “noisy” observations.
1. Introduction
Road traffic accidents represent a global health and social problem. It is estimated that approximately 1.35 million people die each year in traffic accidents, up to 50 million are injured, and the costs for countries are approximately equal to three percent of their annual gross domestic product [1]. In the EU, 22,700 people die each year in traffic accidents and 120,000 are seriously injured, while the external cost of road traffic accidents represents approximately two percent of the EU’s annual gross domestic product [2].
It comes as no surprise that significant research efforts have already been devoted to the question of automatic detection of traffic-accident-prone areas. In this paper, we consider a somewhat more specific question. One way to increase traffic safety is by traffic monitoring and managing. However, in circumstances of limited human or technical resources, it is necessary to select “critical” road segments to be the subject of monitoring or managing. For example, Figure 1 provides a map of traffic accidents with injuries or death that occurred in “inner” Belgrade, Serbia, over the one-year period from January 2021 to December 2021. It shows a relatively dense distribution with no clear cluster separation. The research question considered in this paper can be stated as follows: given data on traffic accidents, how we should conceptualize, cluster, and select “critical” road segments? Thus, the reported study makes novel contributions at three levels:
- At the specification level, we conceptualize “critical segments” as road segments of spatially prolonged and high traffic accident risk (cf. Section 2);
- At the methodological level, we propose a two-stage approach to traffic accident clustering and selection (cf. Section 3);
- At the implementation level, we report on a prototype system and illustrate its functionality using publicly available real-life data (cf. Section 4).
The point of departure for this study is that spatial clustering of traffic accidents is a Gestalt problem. One of the traditional problems considered by Gestalt psychologists is related to the question of how humans naturally group points on a two-dimensional plane. The approach presented in this paper is psychologically inspired to the extent that it introduces a clustering criterion based on the Gestalt principle of proximity. In line with this, the proposed algorithm is not density-based, as are most other state-of-the-art clustering algorithms applied in the context of traffic-accident analysis. On the other hand, it keeps their main advantages: it allows for clusters of arbitrary shapes, does not require an a priori given number of clusters, and excludes “noisy” observations.
The rest of this paper is organized as follows. Section 2 provides an overview of related work and describes the main idea underlying this study. Section 3 formally introduces a novel approach to spatial clustering and selection of road traffic accidents. Section 4 illustrates the functionality of a prototype system. Section 5 discusses the approach from the perspective of other relevant studies inspired by the Gestalt principles. Section 6 concludes the paper.
2. Related Work and Main Idea
The research question of traffic accident clustering has been devoted significant research attention [3,4,5,6]. For a more comprehensive overview, the reader may consult [3,7,8]. Here, we reflect on selected methodological aspects and emphasize the main idea of this particular study.
Some of the widely applied clustering algorithms (e.g., k-means type algorithms [9,10]) take the number of clusters as an input parameter (cf. also [11]). In practice, the observed data are clustered repetitively by varying the input number of clusters; then, the optimal number of clusters is selected with respect to some criterion. One of such criteria is based on the pooled within-cluster sum of squares around the cluster means [12]:
where t is the number of clusters, is the ith cluster, is the number of observations assigned to cluster , and is the pairwise distance between observations j and k. A plot of the within-cluster dispersion versus the applied number of clusters typically contains an elbow that indicates the optimal number of clusters [12]. An alternative method to determine the optimal number of clusters is described in [13].
In general, the requirement that the number of clusters should be given a priori represents a limitation. In addition, the k-means algorithm considers the entire dataset and generates spherical shape clusters that are not necessarily suitable to represent traffic-accident-prone areas [8]. To address these limitations, the density-based DBSCAN algorithm [14] is aimed at eliminating noise from data and allowing for clusters of arbitrary shapes. Instead of an a priori given number of clusters, this algorithm accepts two different parameters: the maximum neighborhood radius and the minimum number of points required to form a dense region. The OPTICS algorithm [15] is an extension of the DBSCAN algorithm that produces a density-based clustering structure of a dataset.
It is shown in [8] that the density-based clustering algorithms perform better than the k-means algorithm in the context of traffic-accident analysis. Similarly to them, the algorithm introduced in this paper allows for clusters of arbitrary shapes and does not require that the number of clusters is given in advance. The proposed clustering approach is not density-based, but inspired by the Gestalt principle of proximity [16]. According to this principle, when humans are confronted with a number of the same visual stimuli (e.g., points on a two-dimensional plane), the most natural form of grouping involves the smallest interval. For example, for the set of points given in Figure 2i, the most natural arrangement would be abc/def/ghi, while for the set in Figure 2ii the natural grouping would be adg/beh/cfi. It is important to note that the natural grouping is by no means impeded by increasing the number of points [16].
We build on the Gestalt principle of proximity and introduce a novel approach to automatic spatial clustering of road traffic accidents. At the level of specification, our study aims at detecting road segments of spatially prolonged and high traffic accident risk. A road segment is considered to be of spatially prolonged risk if it is related to a nonempty set N of traffic accident locations, which can be considered close to each other by means of transitive closure. More precisely, let R be a relation defined on N as follows:
where is a spatial threshold and is spatial distance between traffic accidents and . A cluster is formed as a transitive closure of R, and detection of road segments of spatially prolonged risk is achieved by means of clustering, as explained in Section 3.2. Spatial threshold is an input parameter to the introduced clustering algorithm, and the selection of its particular value is discussed in Section 4.2.
In addition, a road segment is considered to be of high traffic accident risk if it can be considered dominant in terms of number of accidents. The adaptive selection of high-risk road segments are introduced in Section 3.3. Thus, our approach can be represented as a two-stage algorithm. The first stage is devoted to spatial clustering of road traffic accidents. The second stage is devoted to selection of dominant clusters.
3. Methods
In this section, we formally introduce our two-stage approach to road traffic accident clustering and selection. Section 3.1 introduces the basic notions. Section 3.2 describes a graph-based approach to spatial clustering of traffic accidents, and Section 3.3 introduces an approach to adaptive selection of clusters that are dominant with respect to the number of traffic accidents.
3.1. Basic Notions
A road traffic accident is represented as follows:
where
- is a unique identification number of ;
- and are positional coordinates of , i.e., latitude and longitude expressed in radians, respectively.
Spatial distance between traffic accidents and is calculated based on the haversine formula [17]:
where
function atan2 is an adoption of the arctangent function designed to calculate an unambiguous angle value, and (i.e., mean Earth radius). In addition, let be a spatial threshold value representing an input parameter to the clustering algorithm, and let be a set of traffic accidents that occurred in a given period.
3.2. The Clustering Algorithm
The proposed clustering approach adapts the graph-based image segmentation algorithm introduced in [18] (cf. also [19]) and can be described as follows:
- Throughout the algorithm execution, current clustering results are represented by integer array:where and represents the identification number of a cluster to which traffic accident is currently assigned. In Step 1, each traffic accident is assigned to its own cluster, i.e.,
- Let be a set of all combinations of two traffic accidents (i.e., a set of all unordered pairs of traffic accidents) whose mutual distance is less than or equal to the threshold value . In other words, set contains pairs of traffic accidents that are considered close to each other and are thus candidates to be in the same cluster. Without loss of generality, set can be defined as
- We generate a sequence that contains all elements from ordered by nondecreasing distance between traffic accidents.
- We iterate through sequence from the first to the last position. For each ordered pair in , if traffic accidents and belong to different clusters and , then those clusters are merged, i.e.,Thus, the clustering is performed by means of transitive closure of the undirected graph over set N defined in Step 3 (cf. sequence ).
The clustering results are represented by array after Step 4 is completed. In general, array generated in this algorithm stage contains information on t clusters, where (i.e., the number of cluster is equal to the number of distinct values in ).
3.3. Cluster Selection
In the second algorithm stage, a subset of clusters that are dominant with respect to the number of traffic accidents is adaptively selected. Let be the histogram of array , i.e.,
where
- is the identification number of a cluster contained in array ,
- is the number of traffic accidents assigned to cluster ,
- and .
The adaptive cluster selection algorithm represents an adaptation of the method of threshold selection for image binarization introduced in [20] (pp. 120–121; cf. also [21]) and can be described as follows.
- The starting threshold value is set to the average number of traffic accidents per cluster:
- Given a current threshold value , where , set is divided into two disjoint subsets based on :and the subsequent threshold value is calculated as
- If the change in threshold is not significant, i.e.,the calculation is completed and the final threshold is set to . Otherwise, the process returns to Step 2.
Finally, a subset of clusters that are dominant with respect to the number of traffic accidents is adaptively derived by applying the calculated threshold value :
4. Results
This section reports on the prototype system and describes the results obtained when it was applied to real-life data.
4.1. Tools
A prototype system based on the approach introduced in Section 3 is implemented in the Racket programming language. To graphically represent spatial data and estimate areas covered by clusters, we applied the ArcMap component of the Esri’s ArcGIS suite.
4.2. Spatial Threshold Selection
Spatial threshold introduced in Section 3.2 represents an input parameter to the clustering algorithm. We set threshold to 200 m for the following reason. The national urban speed limit is set to [22] (cf. article 43). However, to account for the relationship between the posted speed limit and actual speeds in urban areas, we consider the minimum speeding offense of exceeding the speed limit by up to [22] (cf. article 333). Therefore, we assume a driver operating her or his vehicle at a speed of and define the spatial threshold as the distance traveled by this vehicle in ten seconds (i.e., ).
Although spatial threshold is assigned a particular value, we recall that it is introduced as an input parameter. In general, its value is intended to be set according to external criteria, which may vary with the application context. Thus, the spatial threshold is not learned as a hyperparameter in the sense typically found in the field of machine learning. Instead, it is intentionally left to the practitioner to decide on the spatial threshold value, i.e., on the maximum distance between two traffic accident locations that are considered close to each other.
4.3. Data
We resort to a publicly available dataset on traffic accidents provided by the Ministry of Interior of the Republic of Serbia. To illustrate the functionality of the prototype system (cf. Section 4.4), we use a part of this dataset containing details on 15,366 road traffic accidents that occurred in Belgrade, the capital of Serbia, over the one-year period from January 2021 to December 2021 [23]. Those accidents can be divided in three groups:
- 11,294 road traffic accident with material damage;
- 3996 road traffic accidents with injuries;
- 76 road traffic accidents with death.
We consider only severe road traffic accidents from the last two groups, i.e., 4072 (3996 + 76) accidents with injuries or death. For each accident, the prototype system considers only its unique identification number and positional coordinates (i.e., latitude and longitude). The map showing a subset of road traffic accidents with injuries or death that occurred in “inner” Belgrade during 2021 is given in Figure 1.
To estimate the stability of results through time (cf. Section 4.5), the algorithm is applied to data on traffic accidents with injuries or death that occurred in one of the “inner” Belgrade municipalities—i.e., the municipality of Zvezdara—over the three-year period from January 2019 to December 2021 [23,24,25].
4.4. Algorithm Execution
In the first algorithm stage, 4072 traffic accidents are divided into 1439 clusters. The average number of accidents per cluster is , with a standard deviation of . In the second algorithm stage, only ten clusters are selected as dominant with respect to the number of traffic accidents. The average number of accidents per cluster is , with standard deviation of (cf. Table 1).
The map representation of the selected clusters is given in Figure 3. Although the map shows only “inner” Belgrade, it contains all ten clusters selected when the prototype system was applied to data on traffic accidents in the entire city. The numbers of traffic accidents assigned to each cluster are provided in the second row of Table 2. The cluster identification numbers given in this table correspond to those given in the legends of Figure 3 and Figure 4.
There is a set of well-established measures that are often applied to analyze results of traffic accident clustering by means of evaluating the tightness and separation of clusters: the silhouette coefficient [13], Calinski–Harabasz index [26], Davies–Bouldin index [27], etc. However, these measures are rather general (i.e., task-independent). Consequently, validation approaches based on these measures lack task-related criteria. In contrast to them, we apply a qualitative evaluation based on traffic-related criteria.
In line with this, the obtained results can be considered promising: ten selected clusters covering approximately percent of the city area (i.e., 3.65 km out of approximately 3233 km, cf. Table 2) capture 18 percent of all traffic accidents (i.e., 733 out of 4072, cf. Table 1).
For the purpose of further illustration, we compare the clustering results with the locations of traffic camera poles derived from the publicly available information provided by the Ministry of Interior of the Republic of Serbia [28]. To justify this decision, it is important to clarify the following:
- The locations of camera poles are determined by a third party, independent of this study.
- The introduced algorithm is agnostic of the camera pole locations, i.e., they are not considered in the clustering process.
- The traffic accident data used to generate clusters are collected during 2021. At the moment of conducting this study (i.e., March 2022), the considered traffic cameras still have not been put into use, i.e., they did not influence the traffic behavior in the observed period.
Thus, the particular camera pole locations can serve as an indirect “response” variable. Out of 464 camera poles installed in Belgrade, seventy are located within the selected clusters. The numbers of camera poles within each cluster are provided in Table 2. The map representation of the selected clusters and camera poles within them is given in Figure 4. It can be observed that the ten selected clusters, which cover 0.11 percent of the city area, capture 15 percent of the camera poles.
4.5. Stability of Results through Time
To estimate the stability of results through time, the introduced algorithm is applied to data collected in the same spatial area at different periods. The previous section considers the entire city of Belgrade, which has a surface area of approximately 3233 km. In this section, the same spatial threshold (i.e., = 200 m) is applied to just one of the “inner” Belgrade municipalities—the municipality of Zvezdara—which has a surface area of approximately 31.11 km (i.e., 9.6 percent of the city surface area). In line with our goal to introduce an approach suitable for application in circumstances of limited human or technical resources for traffic monitoring and management, this municipality was selected as one of the “inner” municipalities with fewest camera poles. It contains only 16 out of 464 camera poles installed in Belgrade.
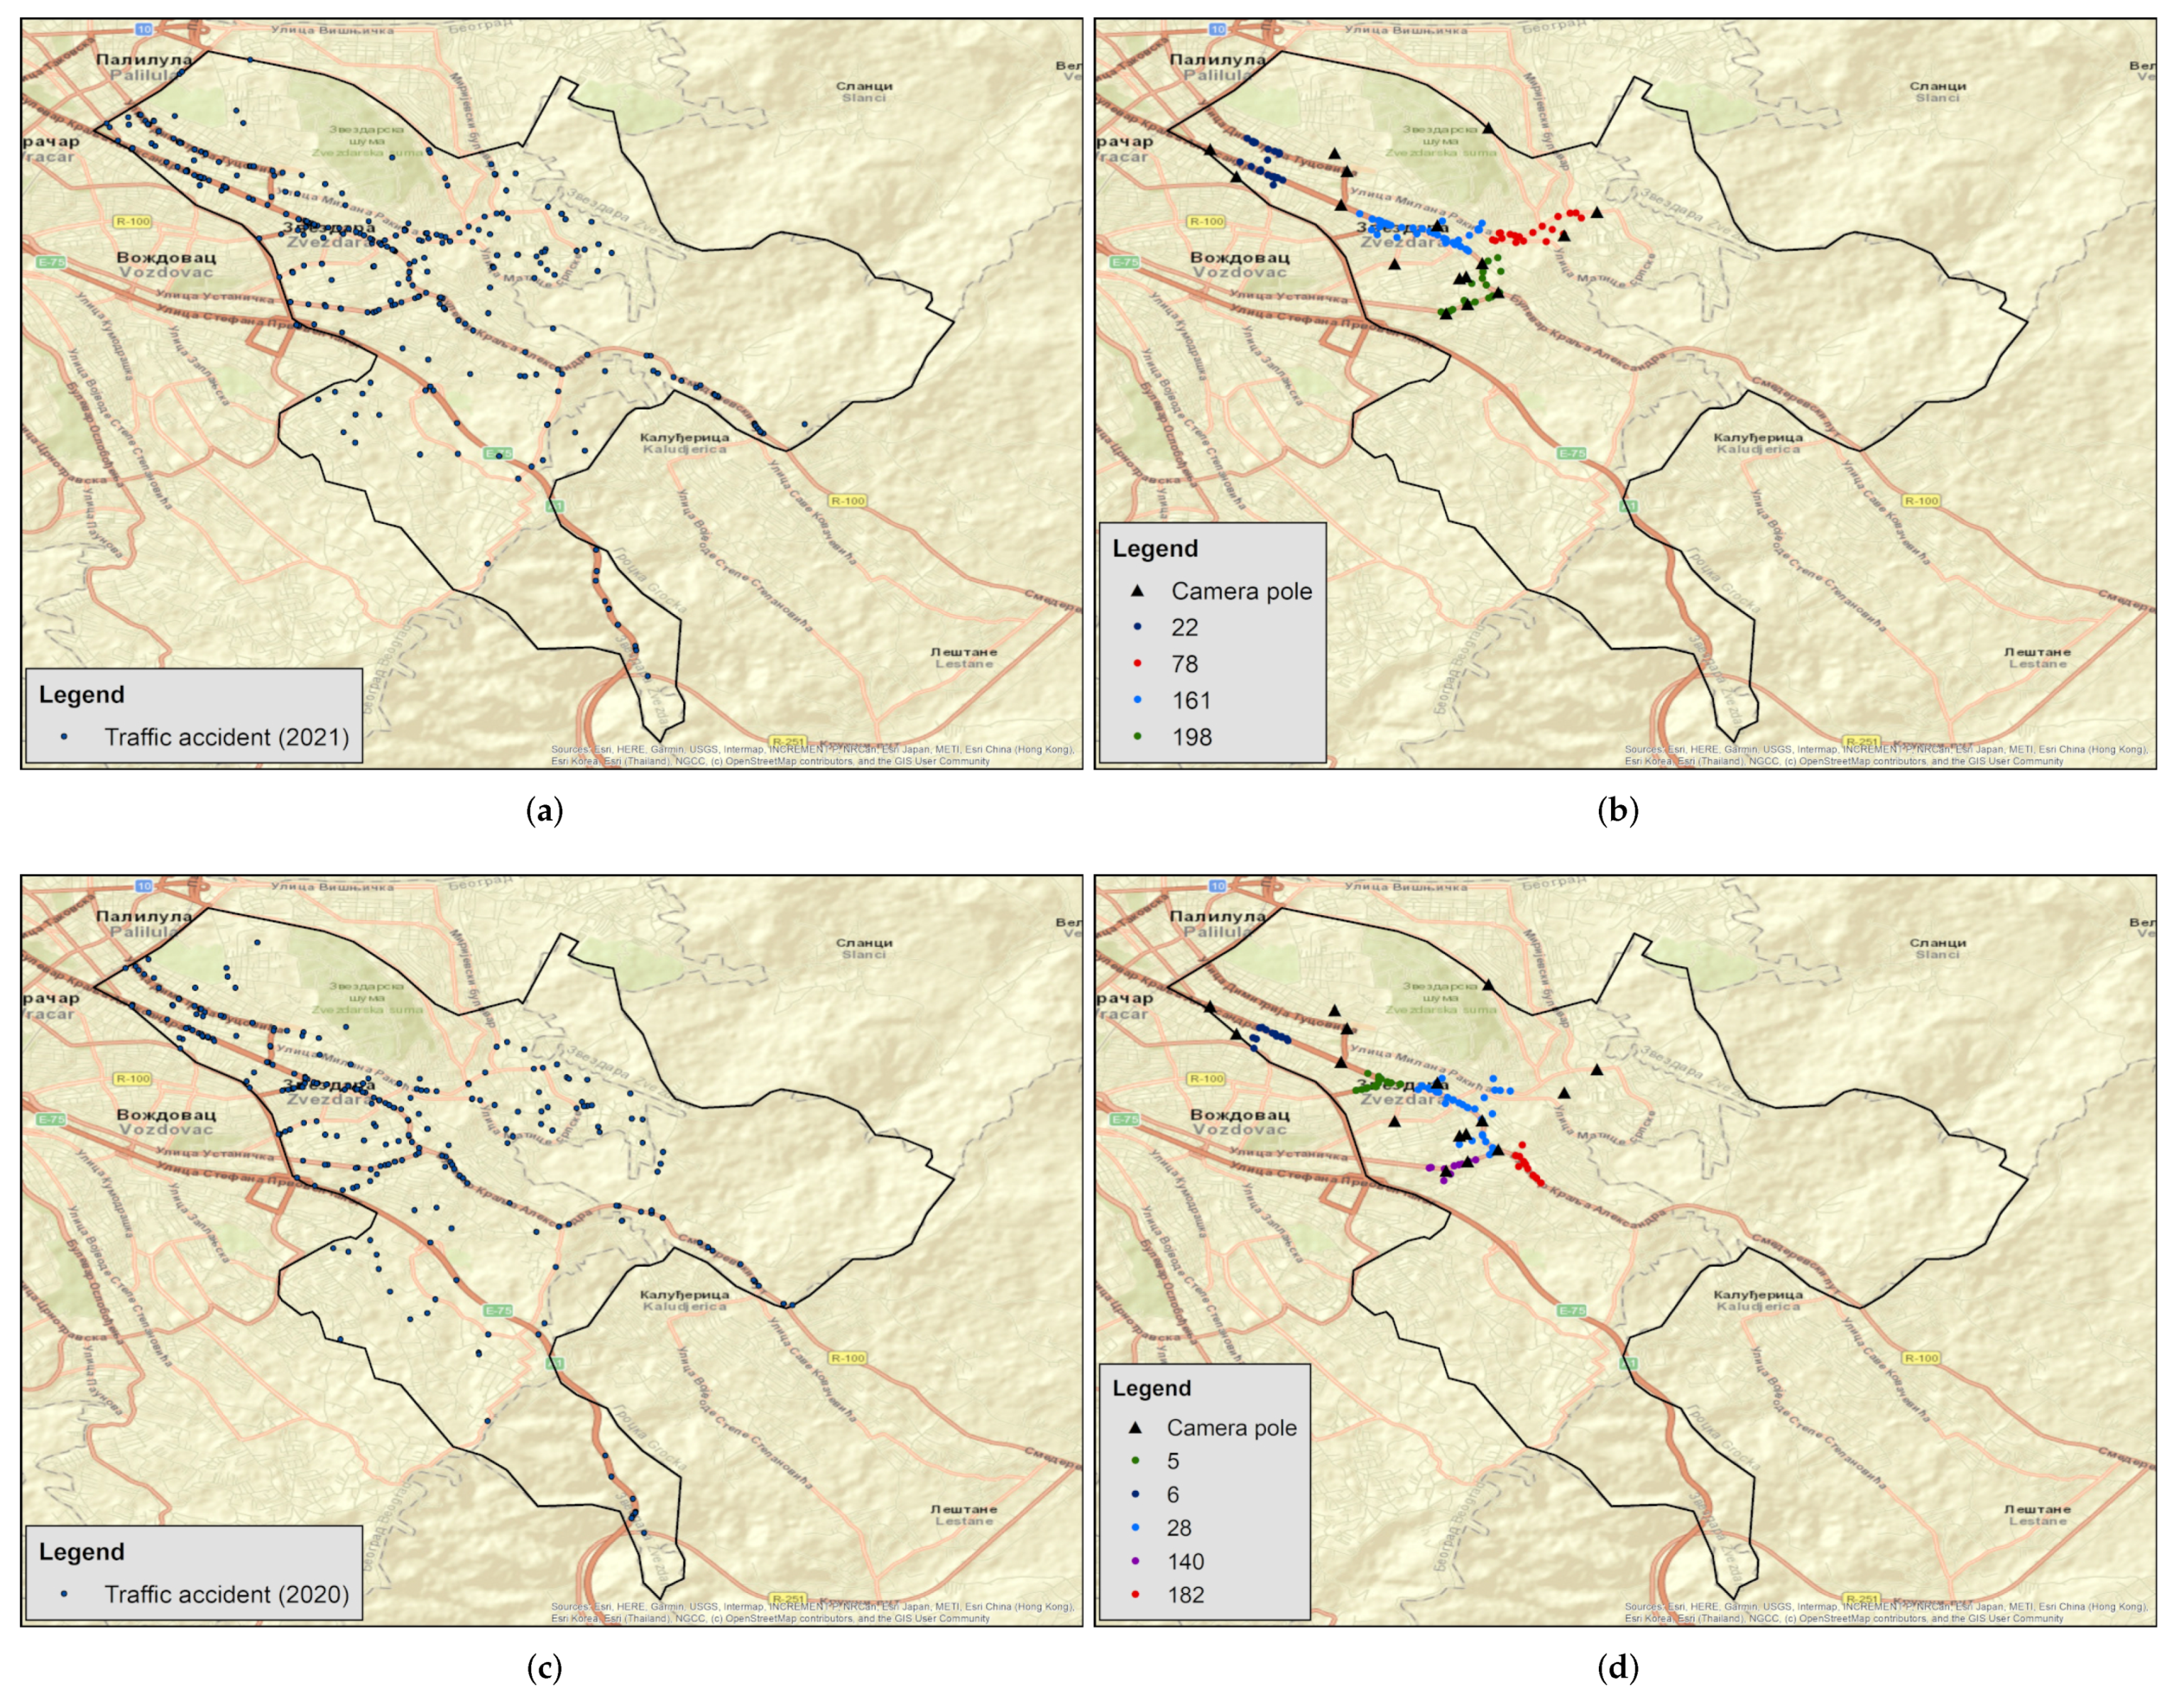
The algorithm is applied to publicly available data on traffic accidents with injuries or death that occurred in the municipality of Zvezdara over the three-year period from January 2019 to December 2021. The maps showing road traffic accidents that occurred in this municipality during 2021, 2020, and 2019 are given in Figure 5a,c,e, respectively. The corresponding map representations of the selected clusters are given in Figure 5b,d,f, respectively. The camera pole locations (March 2022) are represented for the purpose of completeness. A summary of the clustering and selection results is given in Table 3. The selected clusters are described in Table 4.
The stability of results through time is considered in two aspects: the share of traffic accidents belonging to the selected clusters, and the overlapping surface area between the selected clusters in all three years. With regard to the first aspect, the following can be observed:
- In 2021, four selected clusters covering approximately 2.2 percent of the municipality surface area (i.e., 0.685 km out of 31.11 km) capture 36.59 percent of all traffic accidents (i.e., 116 out of 317).
- In 2020, five selected clusters covering approximately 2.06 percent of the municipality surface area (i.e., 0.64 km out of 31.11 km) capture 35.82 percent of all traffic accidents (i.e., 101 out of 282).
- In 2019, five selected clusters covering approximately 4.33 percent of the municipality surface area (i.e., 1.346 km out of 31.11 km) capture 38.97 percent of all traffic accidents (i.e., 136 out of 349).
Thus, the share of traffic accidents belonging to the selected clusters is steady through the given three-year period (i.e, 36.59, 35.82, and 38.97 percent, respectively).
With regard to the second aspect, a significant overlapping between the selected clusters in all three years can be observed. The overlapping surface area is 0.353 km, which makes 51.53 percent of the selected surface area in 2021, 55.15 percent of the selected surface area in 2020, and 26.23 percent of the selected surface area in 2019.
5. Discussion
In addition to reporting the algorithm results, we discuss the introduced approach from the perspective of other relevant studies inspired by the Gestalt principles. The idea of applying human cognitive judgments reflecting the principles of visual Gestalt perception is not new. E.g., Ref. [29] introduces a clustering algorithm based on local k-dimensional neighbors of each point, allowing for an arbitrary number of clusters and arbitrary clusters shapes. However, their implicit conceptualization of proximity differs from the conceptualization adopted in our study. According to the conceptualization adopted in [29], the pattern of points given in Figure 6i contains three clusters: two large clusters and one “chain” cluster between them. In our approach, the proximity of points (i.e., locations) is defined by means of transitive closure, so the same pattern contains only one cluster (cf. Figure 6ii).
More recently, two different approaches to saliency detection in digital images based on the Gestalt principles are proposed in [30,31]. Particularly, related to the Gestalt principle of proximity, these approaches consider color distance between image regions and implicitly include the transitive closure. However, both approaches restrict the selected image regions only to neighbors of a currently salient image region. Even the image segmentation algorithm introduced in [18], on which we build in this contribution, includes a pairwise region comparison predicate. In our approach, this restriction is not present and we comment briefly on this.
In [18], the difference between segments and is defined as the minimum weight edge connecting them, i.e.,
where and are two neighboring pixels (i.e., ) belonging, respectively, to segments and , and represents the color distance between and . In our approach, we consider spatial distance between traffic accident locations, but define the distance between two clusters in the same manner. On the other hand, to detect evidence of a boundary between segments and , the approach introduced in [18] assumes that their difference must be greater than their internal differences and :
where threshold values are defined as inversely proportional to the size of a segment, i.e., . We relax this condition in our approach: in order to detect evidence of a boundary between two clusters, their distance must be greater than a constant threshold value (cf. Equation (8) in Section 3.2). The justification for this decision is related to the domain of this study. In line with our aim to detect road segments of spatially prolonged traffic accident risk, we do not require stronger evidence for boundary of relatively smaller clusters (and, therefore, do not consider internal cluster differences). The input parameter threshold allows for controlling the scale of observation: a larger threshold value causes a preference for larger clusters.
6. Conclusions
This paper introduced an approach to automatically detecting and selecting road segments of spatially prolonged and high traffic accident risk, intended for application in circumstances of limited human or technical resources for traffic monitoring and management. It also reported on a prototype system and illustrated its functionality using publicly available real-life data on road traffic accidents that occurred in Belgrade. The approach was positively evaluated in two aspects: (i) comparing the clustering results with the locations of traffic camera poles installed a posteriori; (ii) the stability of results through time.
To conclude, we first reflect on the comprehensiveness of the feature set that represents a traffic accident. Machine-learning-based approaches to traffic accident clustering typically deal with a number of features, including road features (e.g., road, surface, road type, vehicle type, etc.), environmental features (e.g., date, time, weather, etc.), and human features (e.g., participant’s age and gender, violation of law, etc.) [3,7,32]. The application of those approaches assumes the existence of a dataset that is rather comprehensive in terms of features. However, the comprehensiveness of available datasets varies between different geographical areas and time periods. In contrast, a traffic accident in our approach is represented by two positional coordinates only, i.e., latitude and longitude, which increases the possibility of its application.
Related to the time complexity of the proposed approach, the clustering algorithm introduced in Section 3.2 represents the dominant component. Its running time can be factored as follows. Step 1 takes constant time. In Step 2, for a given set containing k traffic accidents, there are candidate elements for set , i.e., this step takes time. In the example given in Section 4, the number of traffic accidents was , which means that approximately million candidate pairs were considered. However, the number of elements in set , which corresponds to the memory footprint of Step 2, does not necessarily follow this pattern. E.g., set produced in the example contained only pairs. In general, the size of set depends on threshold value . Finally, it was shown in [18] that Steps 3 and 4 can be implemented in and time, where is the very slow-growing inverse Ackerman’s function.
Author Contributions
Conceptualization, M.G.; methodology, M.G.; software, M.G. and N.M.; validation, N.M. and D.J.; formal analysis, N.M. and D.J.; investigation, M.G. and I.K.; resources, I.K.; data curation, I.K.; writing—original draft preparation, M.G.; writing—review and editing, I.K., N.M. and D.J.; visualization, I.K. All authors have read and agreed to the published version of the manuscript.
Funding
This research received no external funding.
Institutional Review Board Statement
Not applicable.
Informed Consent Statement
Not applicable.
Data Availability Statement
Conflicts of Interest
The authors declare no conflict of interest.
References
- Arora, P. Final Report. Independent Evaluation of the United Nations Road Safety Trust Fund (UNRSF) Secretariat. 8 April 2021. DeftEdge Corporation. Available online: https://unece.org/sites/default/files/2021-04/TRANS_FinalReportUNRSF_Apri21_0.pdf (accessed on 25 March 2022).
- European Parliament. EU Road Safety Policy Framework 2021–2030—Recommendations on Next Steps Towards “Vision Zero”, P9_TA(2021)0407, Text Adopted. 6 October 2021. Available online: https://www.europarl.europa.eu/doceo/document/TA-9-2021-0407_EN.pdf (accessed on 25 March 2022).
- Jeong, H.; Kim, I.; Han, K.; Kim, J. Comprehensive Analysis of Traffic Accidents in Seoul: Major Factors and Types Affecting Injury Severity. Appl. Sci. 2022, 12, 1790. [Google Scholar] [CrossRef]
- Manap, N.; Borhan, M.N.; Yazid, M.R.M.; Hambali, M.K.A.; Rohan, A. Identification of Hotspot Segments with a Risk of Heavy-Vehicle Accidents Based on Spatial Analysis at Controlled-Access Highway. Sustainability 2021, 13, 1487. [Google Scholar] [CrossRef]
- Santos, D.; Saias, J.; Quaresma, P.; Nogueira, V.B. Machine Learning Approaches to Traffic Accident Analysis and Hotspot Prediction. Computers 2021, 10, 157. [Google Scholar] [CrossRef]
- Sun, Y.; Wang, Y.; Yuan, K.; Chan, T.O.; Huang, Y. Discovering Spatio-Temporal Clusters of Road Collisions Using the Method of Fast Bayesian Model-Based Cluster Detection. Sustainability 2020, 12, 8681. [Google Scholar] [CrossRef]
- Bokaba, T.; Doorsamy, W.; Paul, B.S. Comparative Study of Machine Learning Classifiers for Modelling Road Traffic Accidents. Appl. Sci. 2022, 12, 828. [Google Scholar] [CrossRef]
- Islam, M.R.; Jenny, I.J.; Nayon, M.; Islam, M.R.; Amiruzzaman, M.; Abdullah-Al-Wadud, M. Clustering algorithms to analyze the road traffic crashes. In Proceedings of the 2021 International Conference on Science & Contemporary Technologies (ICSCT), Dhaka, Bangladesh, 5–7 August 2021. [Google Scholar]
- Lloyd, S. Least squares quantization in PCM. IEEE Trans. Inf. Theory 1982, 28, 129–137. [Google Scholar] [CrossRef] [Green Version]
- Selim, S.Z.; Ismail, M.A. K-means-type algorithms: A generalized convergence theorem and characterization of local optimality. IEEE Trans. Pattern Anal. Mach. Intell. 1984, PAMI-6, 81–87. [Google Scholar] [CrossRef] [PubMed]
- Dukan, P.; Kovari, A. Cloud-based smart metering system. In Proceedings of the 2013 IEEE 14th International Symposium on Computational Intelligence and Informatics (CINTI), Budapest, Hungary, 19–21 November 2013; pp. 499–502. [Google Scholar]
- Tibshirani, R.; Walther, G.; Hastie, T. Estimating the number of clusters in a data set via the gap statistic. J. R. Stat. Soc. Ser. B 2001, 63, 411–423. [Google Scholar] [CrossRef]
- Rousseeuw, P.J. Silhouettes: A graphical aid to the interpretation and validation of cluster analysis. J. Comput. Appl. Math. 1987, 20, 53–65. [Google Scholar] [CrossRef] [Green Version]
- Ester, M.; Kriegel, H.-P.; Sander, J.; Xu, X. A density-based algorithm for discovering clusters in large spatial databases with noise. In Proceedings of the Second International Conference on Knowledge Discovery and Data Mining (KDD’96), Portland, OR, USA, 2–4 August 1996; pp. 226–231. [Google Scholar]
- Ankerst, M.; Breunig, M.M.; Kriegel, H.-P.; Sander, J. OPTICS: Ordering points to identify the clustering structure. In Proceedings of the ACM SIGMOD International Conference on Management of Data, Philadelphia, PA, USA, 31 May–3 June 1999; pp. 49–60. [Google Scholar]
- Wertheimer, M. Laws of organization in perceptual forms. In A Source Book of Gestalt Psychology; Ellis, W.D., Kegan, P., Eds.; Trench, Trubner & Company: London, UK, 1938; pp. 71–88. [Google Scholar]
- Sinnott, R.W. Virtues of the Haversine. Sky Telesc. 1984, 68, 158–159. [Google Scholar]
- Felzenszwalb, P.F.; Huttenlocher, D.P. Efficient Graph-Based Image Segmentation. Int. J. Comput. Vis. 2004, 59, 167–181. [Google Scholar] [CrossRef]
- Gnjatović, M.; Maček, N.; Adamović, S. A non-connectionist two-stage approach to digit recognition in the presence of noise. In Proceedings of the 10th IEEE International Conference on Cognitive Infocommunications (CogInfoCom), Naples, Italy, 23–25 October 2019; pp. 15–20. [Google Scholar]
- Shih, F.Y. Image Processing and Pattern Recognition: Fundamentals and Techniques; John Wiley and Sons: Hoboken, NJ, USA, 2010. [Google Scholar]
- Gnjatović, M.; Tasevski, J.; Borovac, B.; Maček, N. An entropy-based approach to automatic detection of critical changes in human-machine interaction. In Proceedings of the 9th IEEE International Conference on Cognitive Infocommunications (CogInfoCom), Budapest, Hungary, 22–24 August 2018; pp. 175–178. [Google Scholar]
- National Assembly of the Republic of Serbia. Law on Road Traffic Safety. Off. Gaz. Repub. Serb. no. 41/2009-3, 53/2010-12, 101/2011-270, 32/2013-22 (decision of the Constitutional Court), 55/2014-61, 96/2015-106 (other law), 9/2016-178 (decision of the Constitutional Court), 24/2018-70, 41/2018-122, 41/2018-32 (other law), 87/2018-26, 23/2019-3, 128/2020-3 (other law). Available online: http://www.pravno-informacioni-sistem.rs/SlGlasnikPortal/eli/rep/sgrs/skupstina/zakon/2009/41/1/reg/20201026 (accessed on 1 March 2022).
- Republic of Serbia. Data on Traffic Accidents for 2021 for the Territory of all Police Administrations and Municipalities. Available online: https://data.gov.rs/s/resources/podatsi-o-saobratshajnim-nezgodama-po-politsijskim-upravama-i-opshtinama/20220125-085458/nez-opendata-2021-20220125.xlsx (accessed on 1 March 2022).
- Republic of Serbia. Data on Traffic Accidents for 2020 for the Territory of all Police Administrations and Municipalities. Available online: https://data.gov.rs/s/resources/podatsi-o-saobratshajnim-nezgodama-po-politsijskim-upravama-i-opshtinama/20210208-095135/nez-opendata-2020-20210125.xlsx (accessed on 1 March 2022).
- Republic of Serbia. Data on Traffic Accidents for 2019 for the Territory of all Police Administrations and Municipalities. Available online: https://data.gov.rs/s/resources/podatsi-o-saobratshajnim-nezgodama-po-politsijskim-upravama-i-opshtinama/20200127-133136/nez-opendata-2019-20200125.xlsx (accessed on 1 March 2022).
- Caliński, T.; Harabasz, J. A dendrite method for cluster analysis. In Communications in Statistics; Taylor & Francis: Oxfordshire, UK, 1974; Volume 3, pp. 1–27. [Google Scholar]
- Davies, D.L.; Bouldin, D.W. A Cluster Separation Measure. IEEE Trans. Pattern Anal. Mach. Intell. 1979, PAMI-1, 224–227. [Google Scholar] [CrossRef]
- Ministry of Interior, Republic of Serbia. Camera Locations within Belgrade (In Serbian). Available online: http://www.mup.gov.rs/wps/wcm/connect/b152c15f-16eb-47b3-b9a4-c7f32c2cc1ba/Lokacij+Bg.pdf?MOD=AJPERES&CVID=n-sczZB (accessed on 25 March 2022).
- Osbourn, G.C.; Martinez, R.F. Empirically defined regions of influence for clustering analyses. Pattern Recognit. 1995, 28, 1793–1806. [Google Scholar] [CrossRef]
- Wang, Z.; Li, B. A two-stage approach to saliency detection in images. In Proceedings of the 2008 IEEE International Conference on Acoustics, Speech and Signal Processing, Las Vegas, NV, USA, 31 March–4 April 2008; pp. 965–968. [Google Scholar]
- Wu, J.; Zhang, L. Gestalt saliency: Salient region detection based on Gestalt principles. In Proceedings of the the 2013 IEEE International Conference on Image Processing, Melbourne, VIC, Australia, 15–18 September 2013; pp. 181–185. [Google Scholar]
- Kovari, A. Study of Algorithmic Problem-Solving and Executive Function. Acta Polytech. Hung. 2020, 17, 241–256. [Google Scholar] [CrossRef]
Figure 1.
The map of road traffic accidents with injuries or death that occurred in “inner” Belgrade over the one-year period from January 2021 to December 2021. The map was generated using the ArcMap component of the Esri’s ArcGIS suite (https://www.esri.com).
Figure 1.
The map of road traffic accidents with injuries or death that occurred in “inner” Belgrade over the one-year period from January 2021 to December 2021. The map was generated using the ArcMap component of the Esri’s ArcGIS suite (https://www.esri.com).

Figure 2.
Illustration of the Gestalt principle of proximity. The most natural arrangement in (i) would be abc/def/ghi; the most natural arrangement in (ii) would be adg/beh/cfi (inspired by [16]).
Figure 2.
Illustration of the Gestalt principle of proximity. The most natural arrangement in (i) would be abc/def/ghi; the most natural arrangement in (ii) would be adg/beh/cfi (inspired by [16]).

Figure 3.
The map representation of the selected clusters, Belgrade, 2021. The map was generated using the ArcMap component of the Esri’s ArcGIS suite (https://www.esri.com).
Figure 3.
The map representation of the selected clusters, Belgrade, 2021. The map was generated using the ArcMap component of the Esri’s ArcGIS suite (https://www.esri.com).

Figure 4.
The map representation of the selected clusters (Belgrade, 2021) and camera poles (March 2022). The map was generated using the ArcMap component of the Esri’s ArcGIS suite (https://www.esri.com).
Figure 4.
The map representation of the selected clusters (Belgrade, 2021) and camera poles (March 2022). The map was generated using the ArcMap component of the Esri’s ArcGIS suite (https://www.esri.com).

Figure 5.
On the left: the maps showing road traffic accidents with injuries or death that occurred in the Municipality of Zvezdara during (a) 2021, (c) 2020, and (e) 2019. On the right: the corresponding map representations of the obtained clusters. The camera pole locations (March 2022) are represented for the purpose of completeness. (a) Traffic accidents, Zvezdara, 2021. (b) Selected clusters, Zvezdara, 2021. (c) Traffic accidents, Zvezdara, 2020. (d) Selected clusters, Zvezdara, 2020. (e) Traffic accidents, Zvezdara, 2019. (f) Selected clusters, Zvezdara, 2019. The maps were generated using the ArcMap component of the Esri’s ArcGIS suite (https://www.esri.com).


Figure 6.
Emphasizing the difference in the conceptualization of the Gestalt principle of proximity in (i) the approach introduced in [29] and (ii) our approach.
Figure 6.
Emphasizing the difference in the conceptualization of the Gestalt principle of proximity in (i) the approach introduced in [29] and (ii) our approach.


Table 1.
A summary of the clustering and selection results obtained when the introduced algorithm was applied to publicly available data on traffic accidents with injuries or death that occurred in Belgrade during 2021.
Table 1.
A summary of the clustering and selection results obtained when the introduced algorithm was applied to publicly available data on traffic accidents with injuries or death that occurred in Belgrade during 2021.
| First Stage (Clustering) | Second Stage (Selection) | |
|---|---|---|
| Number of traffic accidents: | 4072 | 733 |
| Number of clusters: | 1439 | 10 |
| Average num. of accidents per cluster: | ||
| Standard deviation: |
Table 2.
Description of the selected clusters obtained when the introduced algorithm was applied to publicly available data on traffic accidents with injuries or death that occurred in Belgrade during 2021. The cluster identification numbers given in this table correspond to those given in the legends of Figure 3 and Figure 4.
| Cluster ID: | 1762 | 1730 | 2397 | 1556 | 3680 | 457 | 1233 | 3665 | 3522 | 624 |
| Number of Traffic Accidents: | 279 | 66 | 62 | 58 | 53 | 45 | 44 | 44 | 43 | 39 |
| Area (): | 1.75 | 0.30 | 0.33 | 0.22 | 0.20 | 0.06 | 0.23 | 0.15 | 0.13 | 0.29 |
| Number of Camera Poles: | 33 | 4 | 2 | 7 | 4 | 6 | 3 | 5 | 1 | 5 |
Table 3.
A summary of the clustering and selection results obtained when the introduced algorithm was applied to publicly available data on traffic accidents with injuries or death that occurred in the municipality of Zvezdara during 2021, 2020, and 2019, respectively.
Table 3.
A summary of the clustering and selection results obtained when the introduced algorithm was applied to publicly available data on traffic accidents with injuries or death that occurred in the municipality of Zvezdara during 2021, 2020, and 2019, respectively.
| Year | Summary Data | First Stage (Clustering) | Second Stage (Selection) |
|---|---|---|---|
| 2021 | Number of traffic accidents: | 317 | 116 |
| Number of clusters: | 97 | 4 | |
| Average num. of accidents per cluster: | 29 | ||
| Standard deviation: | |||
| 2020 | Number of traffic accidents: | 282 | 101 |
| Number of clusters: | 95 | 5 | |
| Average num. of accidents per cluster: | |||
| Standard deviation: | |||
| 2019 | Number of traffic accidents: | 349 | 136 |
| Number of clusters: | 93 | 5 | |
| Average num. of accidents per cluster: | |||
| Standard deviation: |
Table 4.
Description of the selected clusters obtained when the introduced algorithm was applied to publicly available data on traffic accidents with injuries or death that occurred in the municipality of Zvezdara during 2021, 2020, and 2019, respectively.
Table 4.
Description of the selected clusters obtained when the introduced algorithm was applied to publicly available data on traffic accidents with injuries or death that occurred in the municipality of Zvezdara during 2021, 2020, and 2019, respectively.
| 2021 | Cluster ID: | 161 | 22 | 198 | 78 | |
| Number of Traffic Accidents: | 43 | 28 | 25 | 20 | ||
| Area (km): | 0.132 | 0.193 | 0.171 | 0.189 | ||
| 2020 | Cluster ID: | 28 | 5 | 6 | 140 | 182 |
| Number of Traffic Accidents: | 42 | 19 | 16 | 12 | 12 | |
| Area (km): | 0.272 | 0.073 | 0.065 | 0.121 | 0.109 | |
| 2019 | Cluster ID: | 194 | 72 | 192 | 116 | 80 |
| Number of Traffic Accidents: | 50 | 23 | 22 | 21 | 20 | |
| Area (km): | 0.486 | 0.235 | 0.317 | 0.163 | 0.145 |
Publisher’s Note: MDPI stays neutral with regard to jurisdictional claims in published maps and institutional affiliations. |
© 2022 by the authors. Licensee MDPI, Basel, Switzerland. This article is an open access article distributed under the terms and conditions of the Creative Commons Attribution (CC BY) license (https://creativecommons.org/licenses/by/4.0/).
Share and Cite
MDPI and ACS Style
Gnjatović, M.; Košanin, I.; Maček, N.; Joksimović, D. Clustering of Road Traffic Accidents as a Gestalt Problem. Appl. Sci. 2022, 12, 4543. https://0-doi-org.brum.beds.ac.uk/10.3390/app12094543
AMA Style
Gnjatović M, Košanin I, Maček N, Joksimović D. Clustering of Road Traffic Accidents as a Gestalt Problem. Applied Sciences. 2022; 12(9):4543. https://0-doi-org.brum.beds.ac.uk/10.3390/app12094543
Chicago/Turabian StyleGnjatović, Milan, Ivan Košanin, Nemanja Maček, and Dušan Joksimović. 2022. "Clustering of Road Traffic Accidents as a Gestalt Problem" Applied Sciences 12, no. 9: 4543. https://0-doi-org.brum.beds.ac.uk/10.3390/app12094543
Note that from the first issue of 2016, this journal uses article numbers instead of page numbers. See further details here.