Article

Nuclear Magnetic Resonance Spectroscopy Analysis of Anaerobic Microbial Metabolic Response to Benzalkonium Chloride Disinfectant

1
School of Environmental Sciences, University of Guelph, Guelph, ON N1G 2W1, Canada
2
Geosyntec Consultants, Waterloo, ON N2L 6R5, Canada
3
Geosyntec Consultants, Guelph, ON N1G 3Z2, Canada
4
Geosyntec Consultants, Toronto, ON M8X 2X9, Canada
*
Author to whom correspondence should be addressed.
Submission received: 22 March 2022 / Revised: 27 April 2022 / Accepted: 29 April 2022 / Published: 4 May 2022
(This article belongs to the Special Issue Energy Optimization for Agriculture and Agroengineering Systems)

Abstract

:

Featured Application

An NMR spectroscopic analysis of an anaerobic digestion can simultaneously detect the presence of quaternary ammonium compounds and the effects of these compounds in the microbial metabolic profile before impacts on biogas production can be measured. This approach may provide an early warning indicator for future microbial upset resulting from exposure to these disinfectant compounds.

Abstract

Quaternary ammonium compounds (QACs) are disinfection agents used in industrial cleaning processes that are known to interfere with the proper functioning of anaerobic waste digestion directly impacting the quality and quantity of the biogas produced (i.e., CO2 and CH4). While the impact of these contaminants on waste digestors are well known, the impact these compounds have on the metabolic profile of an anaerobic digestor is less understood. This paper describes the use nuclear magnetic resonance (NMR) spectroscopy as a non-targeted tool to monitor variations in the metabolic profile of anaerobic bioreactor microcosms simulating the treatment of food production wastewater exposed to benzalkonium chloride (BAC), a key QAC. Using NMR, the variation in the metabolic profile of these wastewater microcosms is compared to variations in the quality and quantity of the biogas produced. A clear development of propionic, isobutyric, isovaleric, and other volatile fatty acids (VFAs) is observed indicating a disruption to the overall ability of the system to convert fatty acids to methane. The ability of NMR to successfully identify the overall metabolic profile, the occurrence of the individual VFAs, and the occurrence of BAC itself in one analysis helps to provide valuable information on the metabolic pathways involved in the disruption of these anaerobic processes.

1. Introduction

Anaerobic digestion (AD) is a biological process in which microorganisms biodegrade and stabilize complex organic matter in the absence of oxygen, yielding treated effluent and methane for energy recovery [1,2]. AD has historically been used for waste management and wastewater treatment and has recently emerged as a promising solution for food waste reduction, energy recycling, and nutrient recovery [2,3]. The process of AD consists of four phases. First, hydrolysis breaks down complex organic matter (proteins, carbohydrates, and fats) into soluble organic molecules (amino acids, sugars, and fatty acids). Second, acidogenesis converts these products into alcohols, carbonic acid, and volatile fatty acids. Third, acetogenesis generates acetic acid, carbon dioxide, and hydrogen. Finally, methanogenesis occurs to produce biogas (typically 60% methane, 40% CO2) [1,2,3,4,5].
Anaerobic bioreactors are complex, multi-variable systems, as during their operation, substrates are consumed and products and intermediate metabolites are formed [6]. The development of volatile fatty acids (VFAs) is a key intermediate in the process of AD; however, the production and accumulation of specific VFA concentrations have shown the ability to be inhibitory, ultimately limiting biogas generation [3,4,7]. Murto et al. suggest that only VFAs can be considered reliable for process monitoring; therefore, successful identification of the individual VFAs formed is vital [4], as it can supply valuable information on the different metabolic pathways involved in the process. The typical operation of bioreactors is based on the routine monitoring of several key parameters including: biogas production, biochemical oxygen demand (BOD5), chemical oxygen demand (COD), total organic carbon (TOC), pH, and measurements of specific nutrients and by-products, such as carbohydrates, VFAs, amino acids, and ammonium [8,9]. These traditional methodologies used for monitoring are costly, time-consuming and only provide a narrow snapshot of the process, providing limited information on the chemical composition of the organic matter present [8,10]. As such, there are benefits to exploring new analytical approaches to characterize anaerobic digestion in order to give an improved analysis of the key chemical parameters governing the system.
Microorganisms are the driving force behind the complex biological process of AD [3], with the microbiome being extremely sensitive and heavily dependent upon the environmental conditions present within the bioreactor [11]. The disruption of a digester can be costly and result in heavy losses of biogas production. Quaternary ammonium compounds (QACs) are commonly used industrial disinfectants and are known to interfere with the proper functioning of the AD process. Disinfectants may enter an anerobic digestion system through contamination from the use of disinfectants in other parts of a food processing facility, or by improper cleaning of the digestion system itself. The impact of QACs on the anaerobic microbiome, and in particular their impact on specific metabolic pathways, are not yet fully understood [12,13]. Benzalkonium chloride (BAC), which is a mixture of alkyl benzyl dimethyl ammonium chlorides with chain lengths C8–C18 [14,15], is the most frequently found QAC in municipal wastewaters worldwide and is perceived to be recalcitrant under anaerobic conditions [14,16,17,18,19]. Studies exploring the impact of BAC on anaerobic digestors show this impact primarily through the measured reduction in biogas production and do not explicitly explore the metabolomic profile of the anaerobic digestion process [17,18,19,20]. This limited knowledge of how QACs impact anaerobic microbial processes limits the ability to determine the extent to which QACs have impacted the digestion processes.
The measurement of QACs in wastewater is a key step for monitoring potential impacts on AD and have been performed in the past using various technologies, but each with their own limitations. QACs can be measured spectrophotometrically using anionic dyes or chromogenic reagents [21,22]. While quick and simple, this technique can be influenced by the presence of anionic surfactants as QACs have a higher affinity for them than the dyes [23]. Moreover, this technique is unable to identify individual QAC structures, limiting its widespread use [13]. High-performance liquid chromatography (HPLC) is promising for screening BAC, but this technique is limited by its inability to analyze non-chromatic surfactants, as they are unable to absorb ultra-violet (UV) [13,24]. Gas chromatography/mass spectrometry (GC/MS) has been used for qualitative determination of BAC in river water and sewage effluent [24,25]; however, a complex pre-treatment is required [13,25].
Nuclear magnetic resonance (NMR) spectroscopy is a powerful non-targeted analytical tool used to obtain high-resolution molecular-level data relating to the makeup of complex mixtures of organic compounds with minimal sample preparation [26,27,28]. Compared to other conventional analytical tools, including HPLC, GC, and MS, NMR is able to unambiguously identify multiple organic structures in a complex sample while simultaneously providing the means to quantify those compounds through comparison with a common internal standard of known concentration. Compared to traditional approaches based on HPLC or mass spectrometry, an approach based on NMR is able to provide a non-biased, non-targeted and fully quantitative approach that has the potential to quickly and simultaneously monitor VFA development, additional metabolomic responses due to chemical stresses imposed from BAC, and the BAC itself without the need for individual standards. Considerable efforts are being undertaken to develop spectroscopic methods for monitoring and quantifying key parameters involved in wastewater treatment processes, including volatile fatty acid production, BOD5, COD, and TOC [9]; however, the use of NMR, specifically in the field of bioprocess control, is relatively unexplored in comparison to other spectroscopic techniques [6].
This study is designed to explore the changes in the microbial metabolomic profile of an anaerobic system as part of efforts to improve our understanding of the effects QACs may have on bioreactor systems. This is performed by preparing microcosm bottles with sludge from a functioning anaerobic washwater digestor used to treat washwater produced during potato production. Here, we expose the microcosms to different levels of QAC, and compare changes in the metabolic signal to changes in the production of CO2 and CH4. Metabolomics is emerging as a powerful tool to study sub-lethal responses to toxic substances before typical endpoints can be observed. Concentrations of QAC used in this study are chosen to elicit a wide range of responses in the anaerobic metabolome rather than to specifically identify the inhibitory limits of QAC exposure. The overall goal of this research is to further develop the use of NMR spectroscopy as a tool to provide both a qualitative and quantitative analysis of the metabolic footprint generated from the interaction between BAC and the bioreactor samples and by doing so be able to recognize deviations away from normal operating procedures.

2. Materials and Methods

2.1. Microcosm Preparation

Anaerobic washwater digestion microcosms were prepared using mixed sludge provided from an operating food production washwater anaerobic digestor. Microcosms were prepared inside a LABstar Glove Box Workstation (MBraun, Stratham, United States) under a 100% argon atmosphere in order to prevent the mixed sludge from oxygen exposure. In addition, 15 mL of mixed sludge were placed into 24 individual 40 mL glass bottles with 24 mm miniert valves (Supelco, Bellefonte, United States). The bottles were then divided into 4 sets of 6 bottles for tests of exposure to 0, 16.7, 33.3, and 66.7 mg/L benzalkonium chloride (BAC) (Sigma Aldrich, Oakville, Canada). These concentrations were chosen to elicit a wide range of metabolomic response from BAC exposure rather than to explicitly identify the inhibitory limits for BAC. BAC was added to each bottle using 15 mL of a 0.01 M pH 7 phosphate buffer (Sodium phosphate monobasic dihydrate/Sodium phosphate dibasic, Sigma Aldrich) containing the appropriate amount of BAC to achieve the desired concentrations. A buffered solution was used to control the pH to help improve the analysis of water from these microcosms by NMR.
Microcosm bottles were placed into an Innova 3100 water bath shaker (New Brunswick Scientific, Stevenage, United Kingdom) and left to incubate at a temperature of 35°C and a shake rate of 75 rpm until being tested on days 1, 2, 5, 9, 12, and 18. Samples were vented through Miniert lid valves daily to alleviate built up biogas. The CO2 and CH4 composition of the biogas produced was measured at specified time points by GC FID. The headspace of each bottle was analyzed using a syringe through the Miniert valve in order to limit the introduction of oxygen into the bottle. Each treatment and timepoint in the study is represented by a single bottle that was sacrificed to extract the water sample for NMR analysis. This approach was chosen as the removal of water from the microcosms needed for analysis would disrupt the equilibrium and negate differences in metabolite levels observed at different points in the study.

2.2. NMR Analysis

Samples were prepared for NMR analysis by transferring 10 mL of water from a microcosm and into a 15 mL centrifuge tube. Samples were then placed in a Sorvall Legend X1R Centrifuge (Thermo Scientific, Mississauga, Canada) and spun at 5000 rpm for 5 min. In addition, 600 μL of the supernatant were passed through a 0.45 μm syringe filter to remove the fine particulates and combined with 60 μL of deuterium oxide (D2O, Sigma Aldrich) that included 0.05 (w/v) 3-(trimethylsilyl)-propionic-2,2,3,3-d4 acid, sodium salt (DSS, Sigma Aldrich) as both an internal concentration standard and chemical shift reference. Samples were transferred into a 5 mm diameter glass NMR tube (Wilmad) for the analysis to be carried out within 1 h of sampling.
All NMR experiments were carried out on a Bruker Avance III 600 MHz NMR spectrometer equipped with a Bruker TCI cryoprobe. 1D 1H Metabolomics-Nuclear Overhauser Spectroscopy (METNOESY) experiments were acquired using a 90° excitation pulse, 256 transients, and a 2 s delay with pre-saturation. 2D 1H-1H Total Correlation Spectroscopy (TOCSY) experiments with excitation sculpting water suppression were acquired using 32 transients and 256 increments, 1.5 s recycle delay, and DIPSI (Decoupling in the presence of scalar interactions) mixing time of 80 ms. TOCSY spectra were processed with 1024 points in the F2 dimension, 1024 in the F1 dimension and phase corrected manually, then readjusted with an automatic phase correction.
Chenomx NMR Suite 8.3 professional (Chenomx Inc., Edmonton Canada), was used to identify and quantify compounds in each spectrum using reference spectra. 2D 1H-1H TOCSY measurements were used to verify the structure of identified metabolites.

2.3. Gas Chromatography Analysis

The CO2 and CH4 content in the headspace of each sample vials was measured at the various testing points using an SRI 8610C Gas Chromatograph (SRI Instruments, Torrance, United States) equipped with a 6 ft Haysep D packed column and a flame ionization detector (FID) with a methanizer, utilizing nitrogen as the carrier gas, and a sample loop of 20 μL. Peak simple chromatography acquisition and integration software (SRI Instruments) were used to process the data, with peaks being measured by area [29].

3. Results and Discussion

3.1. Identification of BAC in Wastewater Effluent

Figure 1 shows the structure of BAC and the 1H-1H TOCSY NMR spectrum of water from a selected microcosm (33.3 mg/L BAC at 18 days). The signals corresponding to BAC are highlighted in red in the TOCSY NMR spectrum. The TOCSY spectrum shows clear correlations between the alkyl signals at around 1.5 ppm, the signals from CH2 groups between the aromatic ring and the amine functional group at around 3 ppm, and the aromatic signals at 8 ppm [30]. This signal pattern, which is observed in all microcosm samples (see Figure S6–S9 in the supplementary information), including the control, increases with increasing dosage of BAC and is consistent with the general structure of BAC. The presence of multiple similar BAC structures is evidence that the BAC being used is a technical mixture comprising multiple similar structures. The presence of BAC in the control is attributed to the source of the sludge being a bioreactor system that was known to be previously impacted by QAC contamination.

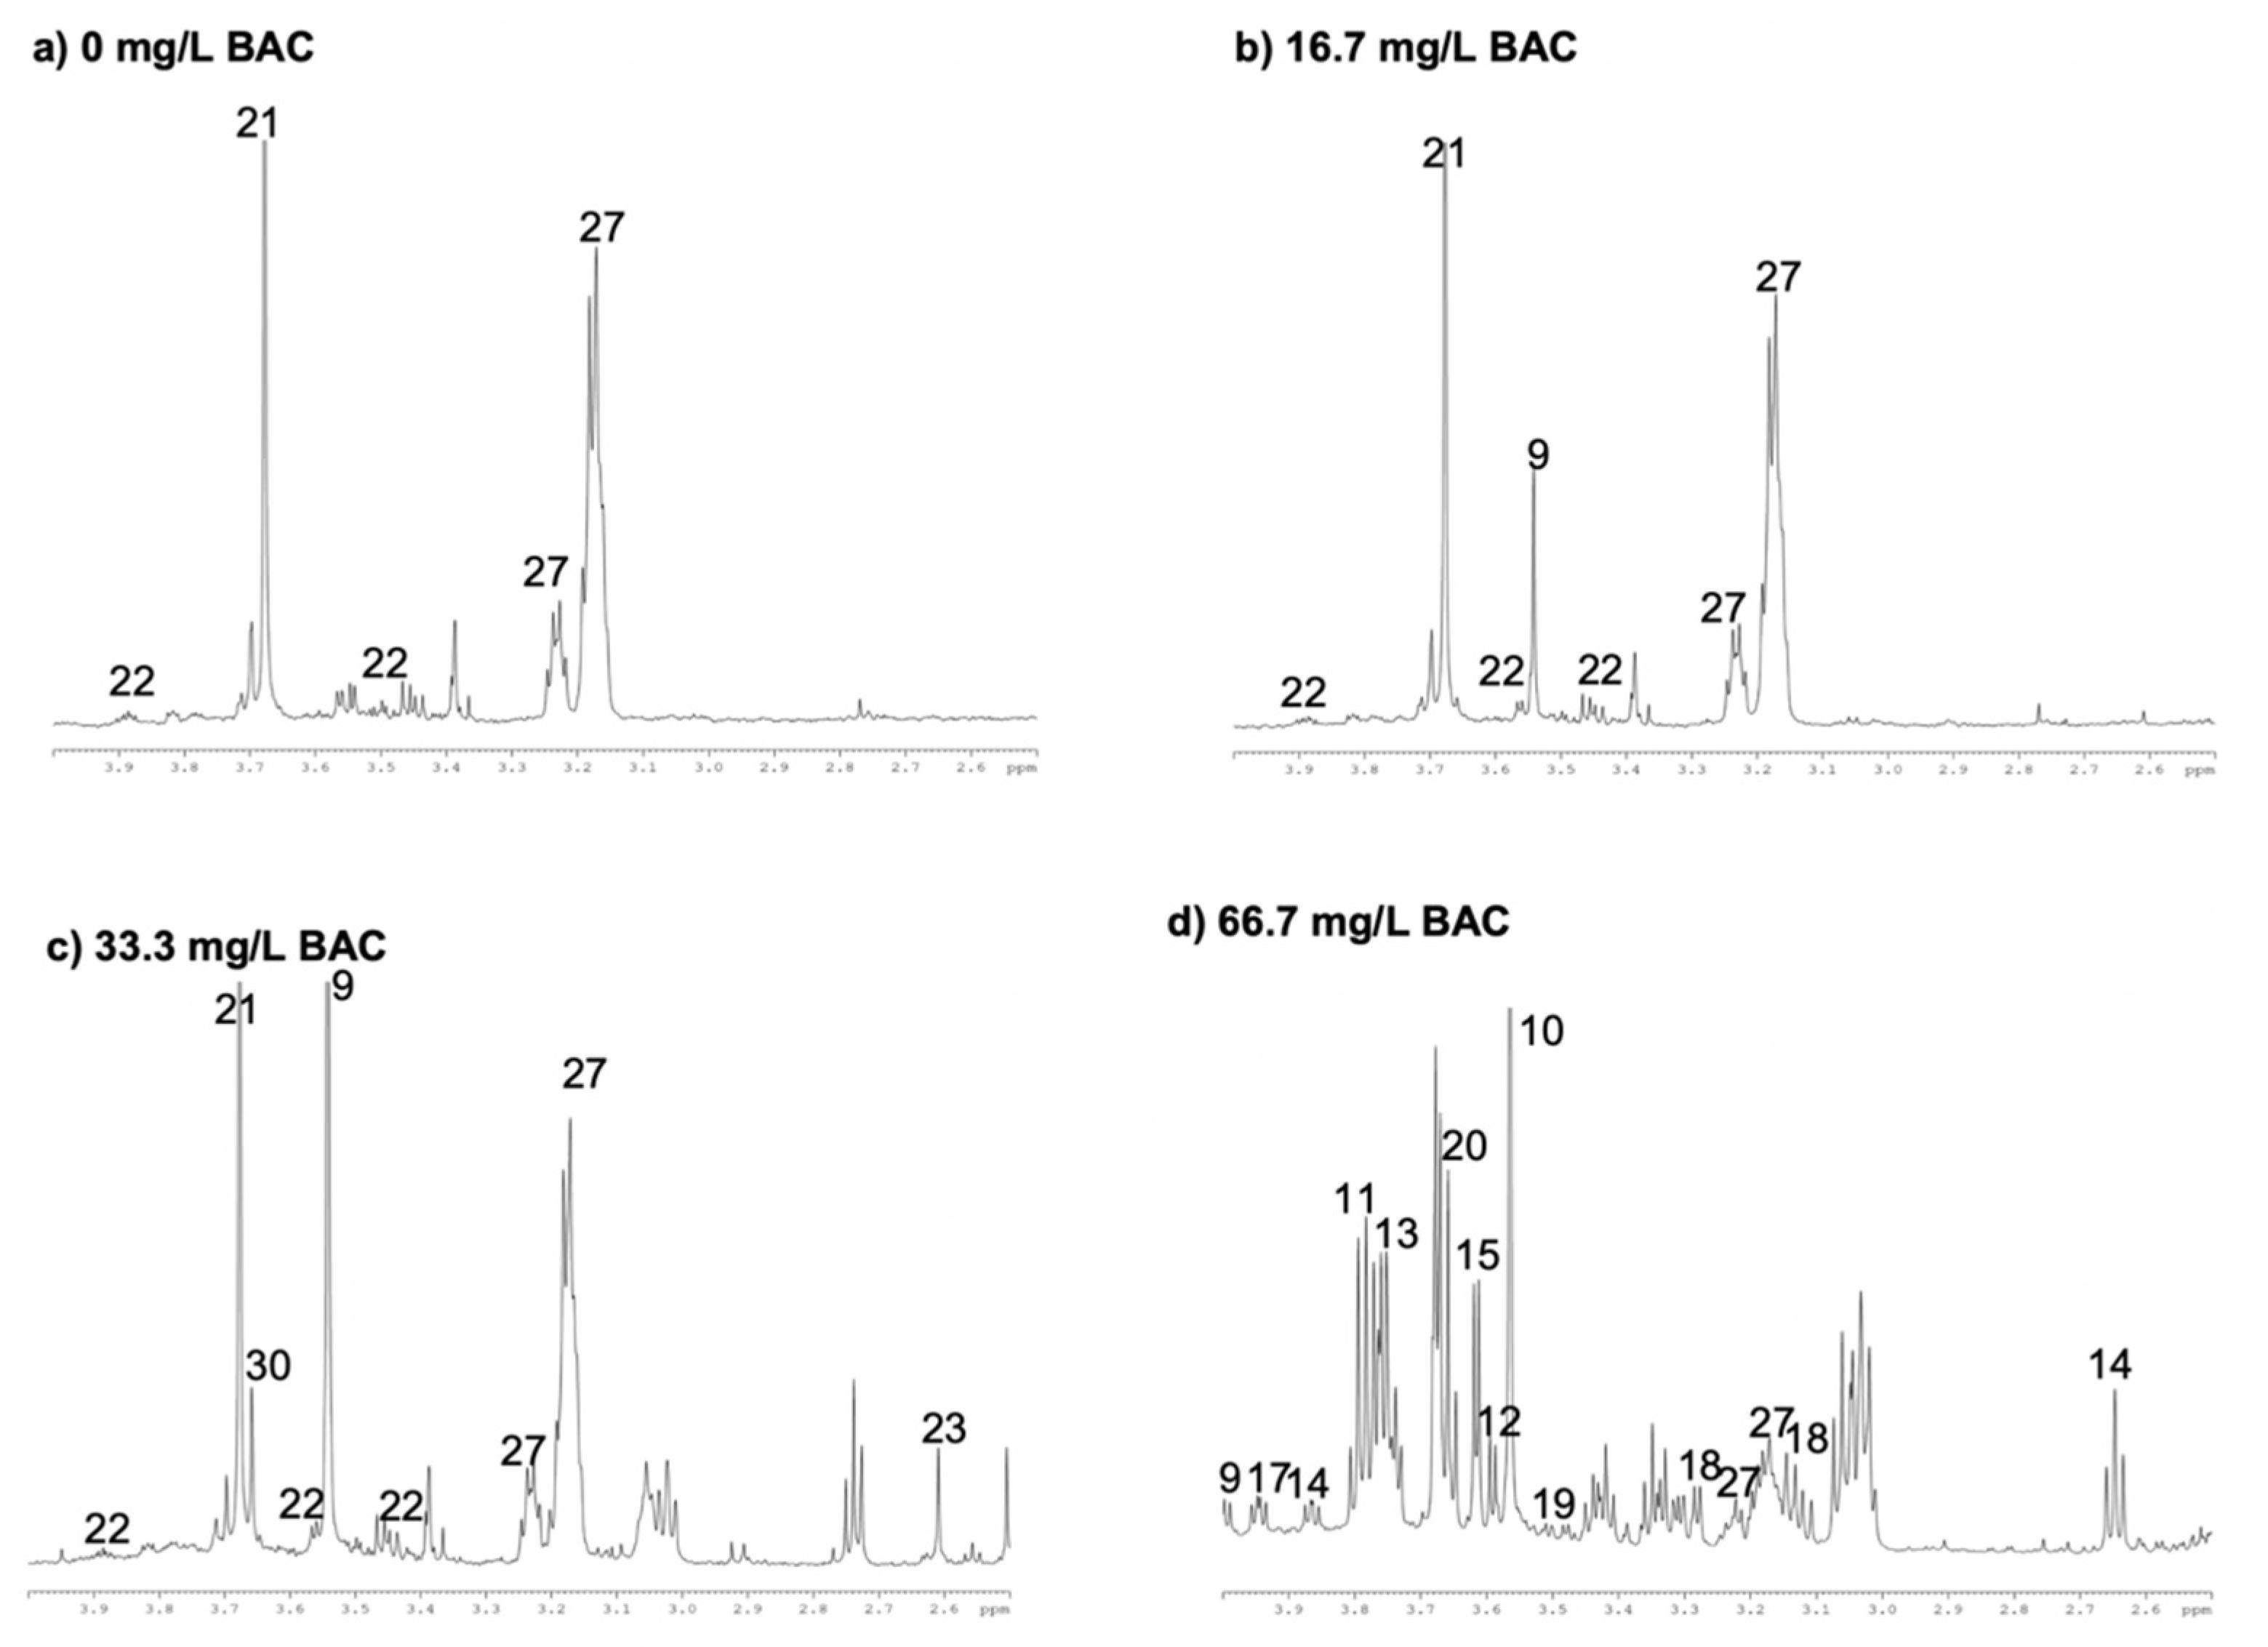
3.2. Metabolite Characterization

The 1H NMR spectrum of water samples from different treatments on day 18 of the study are shown in Figure 2, Figure 3 and Figure 4. The 1H NMR spectra for each microcosm bottle are presented in the supplementary information (See Figures S1–S4). Figure 2 presents the alkyl (0–2.5 ppm) region of the spectrum that corresponds primarily to CH3 and CH2 signals from alkyl chains. Figure 3 shows the functionalized alkyl (2.5–4 ppm) region of the NMR spectrum that corresponds primarily to CH2 signals adjacent to carbonyl, amino, and hydroxyl functional groups and is where key signals from amino acids and fatty acids appear. Figure 4 shows the aromatic regions (6.5–9 ppm) of the 1H NMR spectra, and corresponds to select amino acids and to key signals from BAC itself. Spectra are shown for microcosms on day 18 as these represent the widest divergence in the spectra for each treatment. The labelled structures were initially identified by comparison with standard spectra in the CHENOMX metabolite database and confirmed using 2D 1H-1H TOCSY NMR, which are shown in Figure 5 for microcosm samples after 18 days of exposure to BAC. Figure 5 highlights the occurrence of different structural classes (linear fatty acids, branched fatty acids, amino acids, and alcohols) in each microcosm treatment as different colors. Additional TOCSY spectra for each treatment on day 18 are shown in the supplementary information (see Figure S6–S9). Key fatty acids, amino acids, and related compounds confirmed in the TOCSY spectra are identified in Figure 2, Figure 3 and Figure 4 and listed in Table 1.

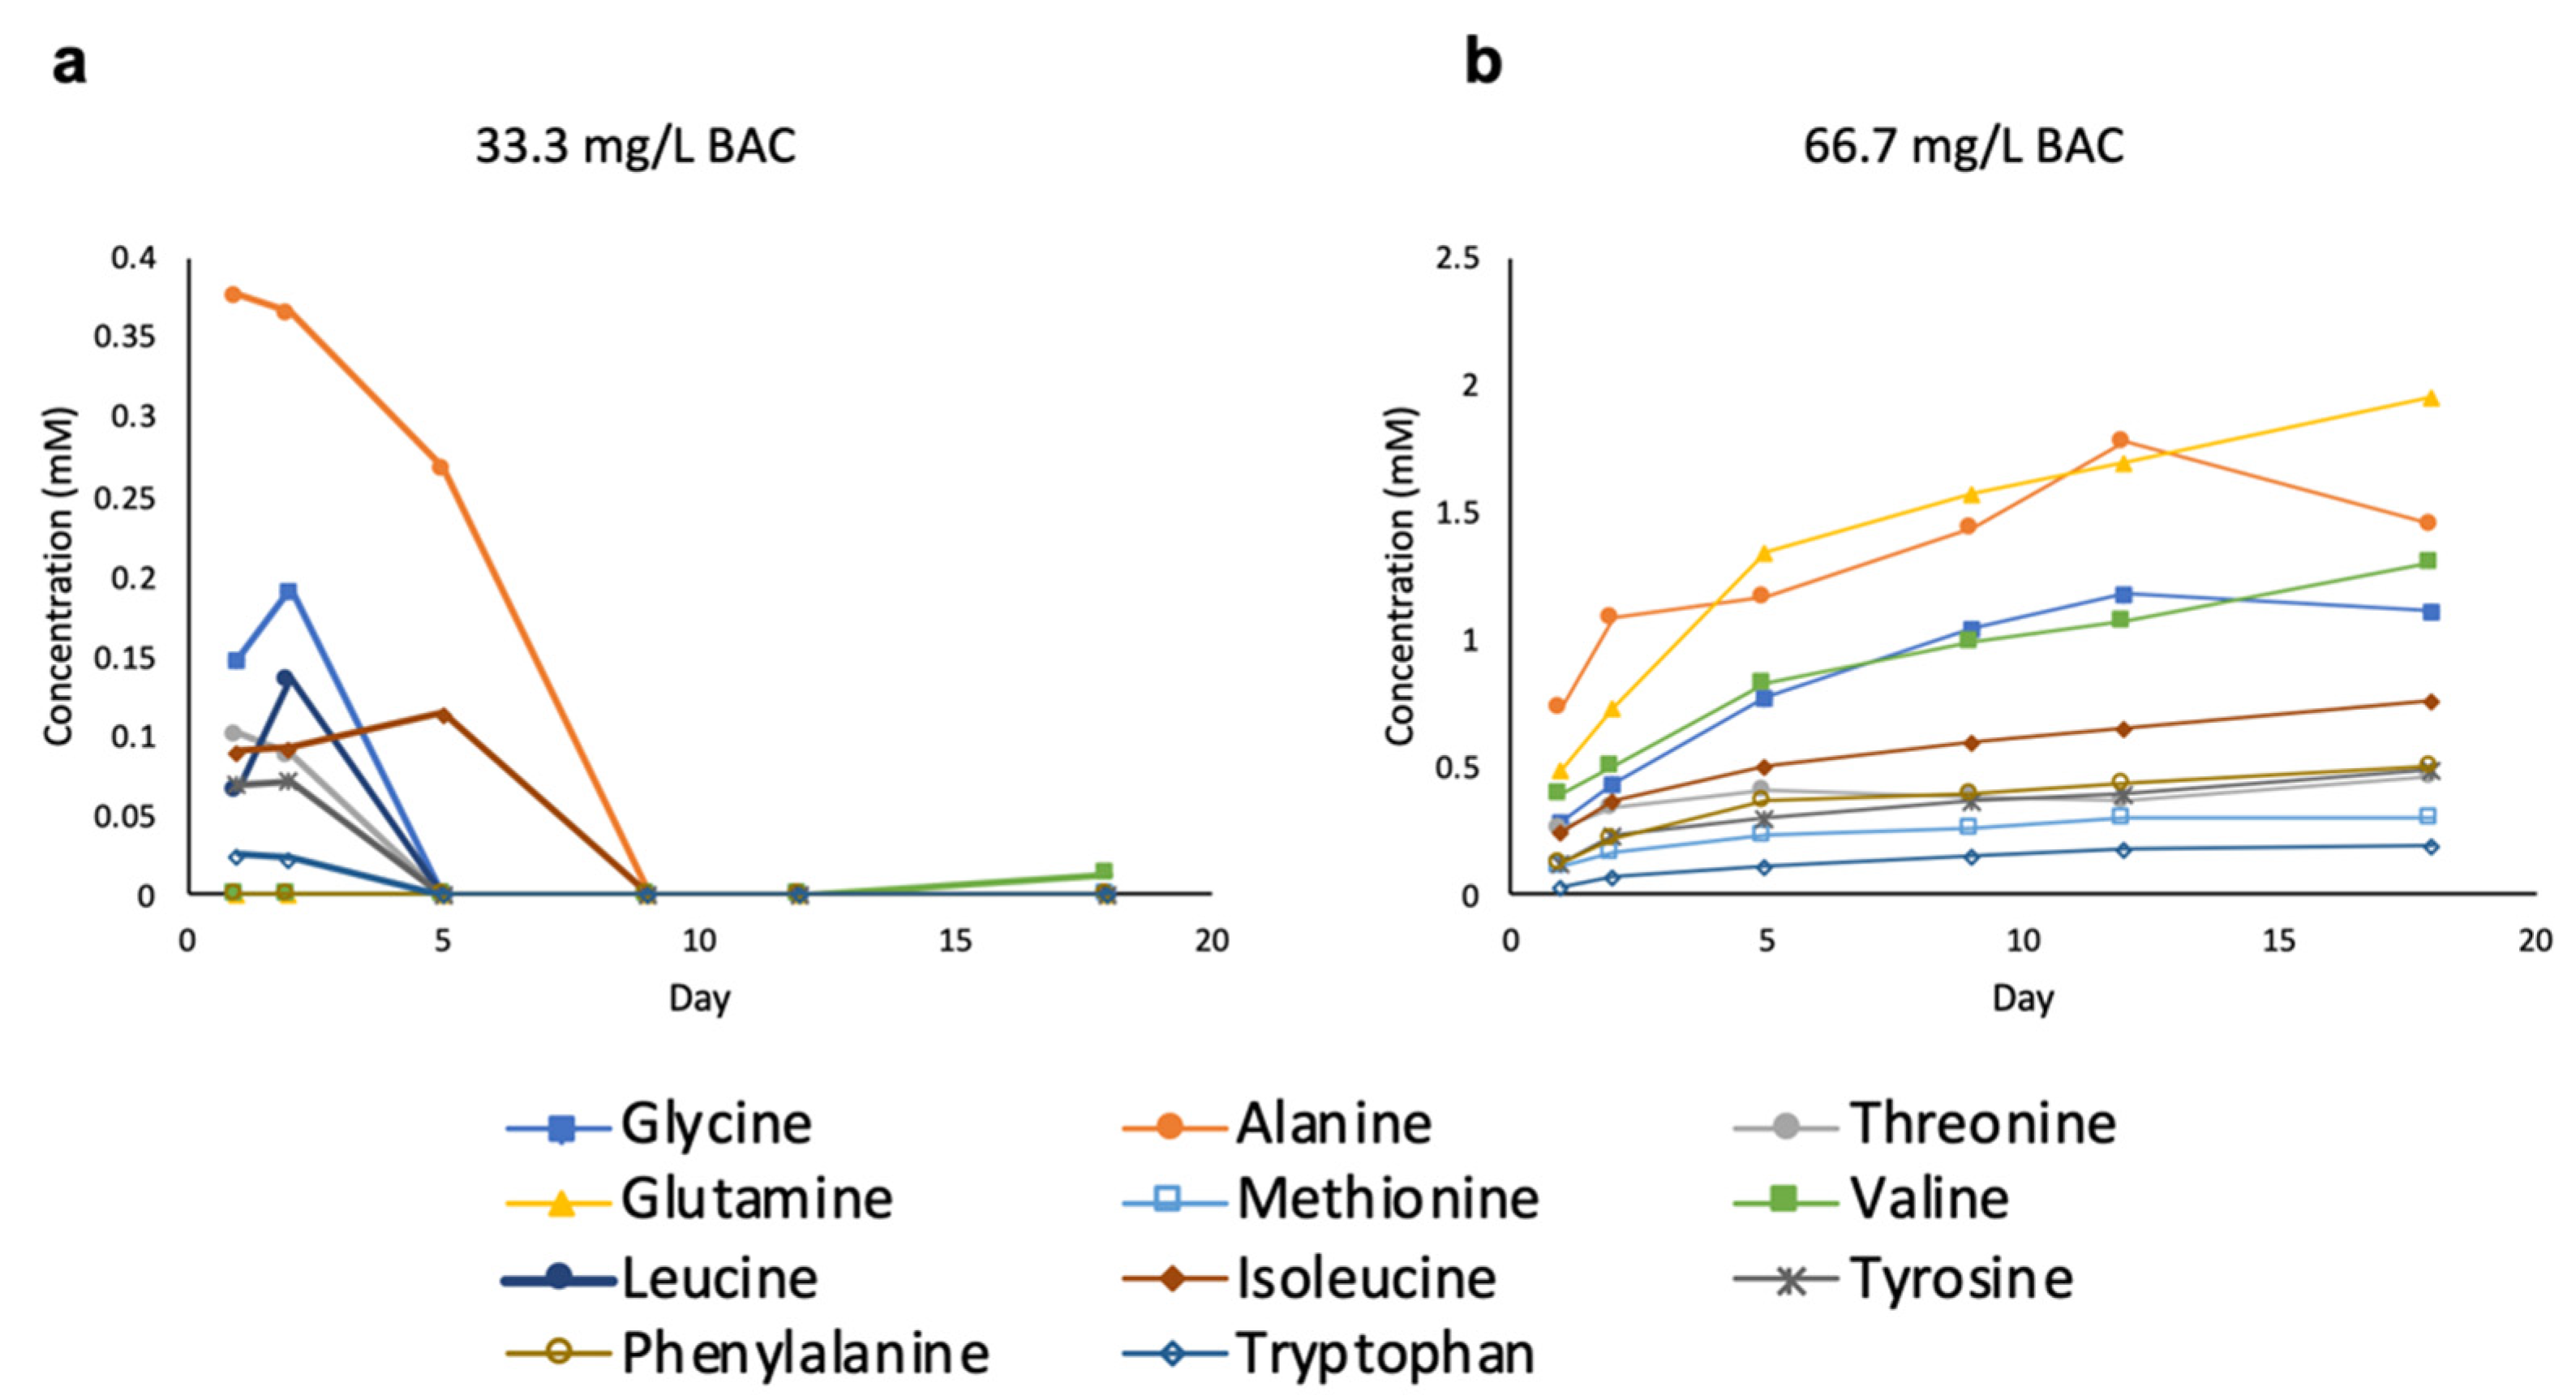
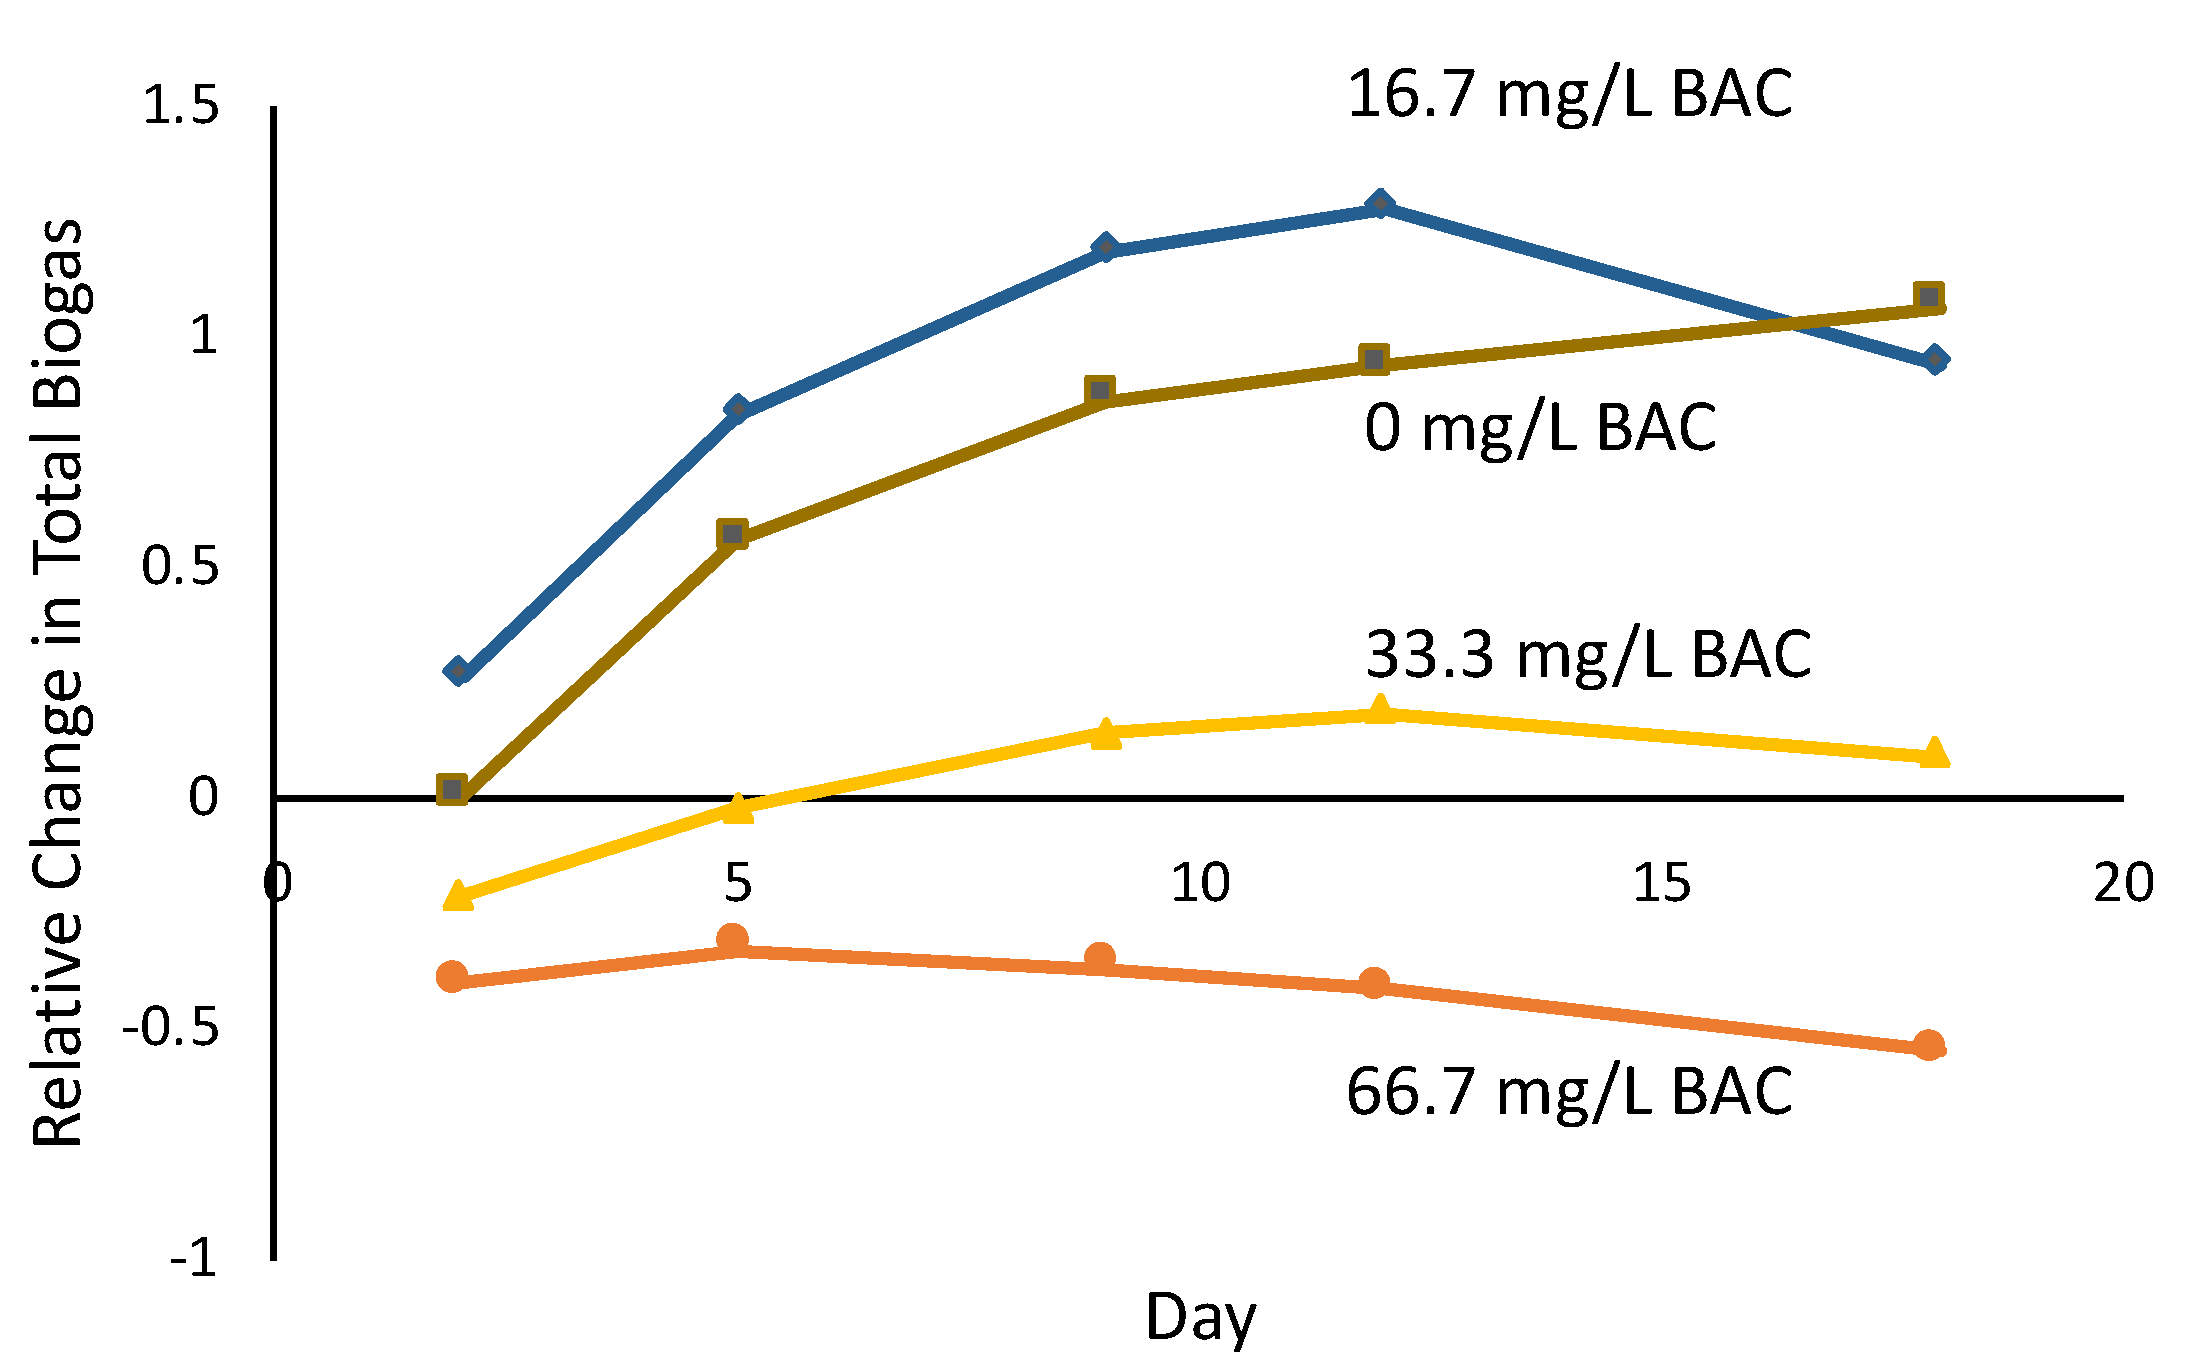
3.3. Evolution of Microbial Metabolites after Initial BAC Exposure

Once signals were identified in the 1H NMR spectra, CHENOMX was used to quantify selected fatty acids and amino acids by spectral deconvolution and comparison to an internal concentration standard, DSS, included in each sample at a known concentration. Figure 6 compares the progression of fatty acid concentrations for each microcosm treatment over time. In the control microcosm, only acetic acid and formic acid were observed. The concentrations of these two VFAs were constant throughout, apart from the measurements on day 18 at which acetic acid increased and formic acid decreased. The observation of these two VFAs is consistent with a normal anaerobic digestion process. In the BAC treatment microcosms, the concentrations of most identified VFAs, including both linear and branched VFAs, were observed to increase over the course of the study, indicating disruption of the anaerobic digestion. Figure 7 compares the progression of amino acid concentrations over time for the 33.33 mg/L and 66.7 mg/L BAC microcosms. Amino acid signals were not detected in the 0 or 16.7 mg/L microcosm treatments and as such these treatments are excluded from Figure 7. Here, the measured concentrations of amino acids are observed to decrease to non-detect in the 33.3 mg/L BAC treatment, while the amino acid concentrations are observed to increase over the study period in the 66.7 mg/L BAC treatment.
Measurements of CO2 and CH4 in the microcosm headspace were performed by GC-FID immediately before NMR measurements were performed. Figure 8 compares the % contribution of CH4 to the biogas for each microcosm treatment over the duration of the experiment starting on day 2 as a measure of the relative proportion of CH4 compared to CO2. Figure 9 compares the change in the combined CO2 and CH4 biogas relative to the day 2, 0 mg/L BAC control microcosm as a measure of total gas production in response to the different BAC treatments.
In the microcosms prepared with 0 mg/L BAC, the formation and persistence of additional fatty acids, aside from acetic acid and formic acid, were not observed in the NMR spectra throughout the study (see Figure 6), even though a low-level of BAC was observed throughout due to previous contamination. For these microcosms, the initial composition of CH4 in the headspace was ~65 %, which increases to ~70% after 5 days (see Figure 8). This level remains constant for the duration of the study. The combined CO2 and CH4 in the headspace also increase significantly in these microcosms over the duration of the study (see Figure 9). The gradual increase in CH4 and CO2 in the microcosm headspace, and the higher proportion of CH4 after initial construction, is likely due to the establishment of equilibrium after the microbial community was disturbed during the construction of the microcosms, resulting in possible exposure to oxygen [31].
The inclusion of 16.7 mg/L BAC does not affect the CH4 and CO2 in the microcosm headspace, with the levels of these gases in the 0 mg/L and 16.7 mg/L BAC microcosms being consistent throughout the experiment (see Figure 8 and Figure 9). Nevertheless, the fatty acid profile of these two microcosms treatments do vary from each other (see Figure 6). While the formic acid levels in the 0 and 16.7 mg/L BAC microcosms are similar, the acetic acid levels in the 16.7 mg/L treatments increase after 5 days by levels that are 100 times those observed in the 0 mg/L BAC microcosms. Additionally, isovalerate and isobutryate are observed in the microcosms with 16.7 mg/L BAC but not in the 0 mg/L control. This change indicates that fatty acid metabolism is being affected by the presence of increased levels of BAC even though the amount and quality of the biogas production remains unchanged. As the measurement of biogas composition does not show a significant difference between the 0 and 16.7 mg/L BAC microcosms, this suggests that the NMR measurements are able to detect and diagnose metabolic stress due to BAC exposure, as well as detecting BAC itself, before the biogas production is affected.
Significant deviations from optimal conditions are observed for the microcosms with 33.3 and 66.7 mg/L BAC. In the 33.3 mg/L microcosm, the total acetic acid concentration is now two times that of the 16.7 mg/L microcosm, while propionic acid, butyric acid, valeric acid, isobutyric acid, and isovalerate are also measured at increased levels. Obligate H2-producing acetogenic bacteria are responsible for oxidizing VFAs to acetate, CO2, and H2 [32,33]. The buildup of VFA concentrations indicates that these syntrophic acetogenic bacteria are unable to facilitate further degradation in order to form acetate and hydrogen [3,34,35,36]. In the microcosms with 66.7 mg/L BAC, the fatty acid concentrations are lower than in the microcosms with 33.3 mg/L BAC, with only acetic acid and formic acid being observed at significant concentrations. Succinic acid is also observed in the 66.7 mg/L BAC microcosms indicating a significant disturbance in the metabolism of the microbial communities. Succinic acid is a key intermediate in the citric acid cycle and an integral part of the electron transport chain, from which oxidative phosphorylation produces ATP [37,38]. The connection between succinic acid metabolism and ATP synthase indicates that the higher BAC concentration directly inhibits regular cellular activity [37,38]. Amino acids are measured in the 33.3 mg/L BAC microcosms up until 10 days, after which these metabolites are no longer observed (see Figure 7). In the 66.7 mg/L BAC microcosms, the concentration of amino acids increases over the course of the experiment. The lack of fatty acids and the presence of amino acids in the 66.7 mg/L BAC microcosms indicate a serious disturbance of the metabolisms of the anaerobic bacteria. The biogas production in the 33.3 and 66.7 mg/L BAC microcosms is also significantly impacted compared to the 0 and 16.7 mg/L treatment microcosms. Both treatment series shows less total biogas (see Figure 9), of which a significantly smaller contribution is due to CH4 (see Figure 8). The changes in biogas production due to exposure to higher BAC concentrations is consistent with the disturbance in the microbial metabolism as measured using NMR.
In general, the concentration of BAC added to each microcosm is correlated to the reduction in CH4 production in agreement with previous studies conducted [12,39,40]. BAC is known to be inhibitory to fermentation and methanogenesis [15,17,39,41]. The accumulated levels of VFAs in the 16.7 and 33.3 mg/L microcosms indicate that BAC seems to affect the acetate consumers, which have previously been proven to be inhibited by BAC [15,42]. This means that BAC toxicity and resistance to biodegradation in anaerobic biological systems will ultimately result in its environmental persistence [12].
Marchaim and Krause (1993) suggested that common indicators, such as VFAs, gas composition, and pH, were useful for monitoring gradual changes but did not directly reflect the current metabolic status of the active organisms in the system. Our findings show that NMR data coupled with biogas measurements give a sufficient reflection of the current metabolic state enabling the identification of a disruption and allowing for a possible response.

4. Conclusions

This study has shown that NMR spectroscopy provides an improved approach for the monitoring and diagnostics of anaerobic processes after exposure to the disinfection agent, benzalkonium chloride. The NMR spectra of anaerobic microcosms provide a rapid and high-resolution molecular characterization of the full organic composition of wastewater samples, including fatty acids, amino acids, other metabolites, and the BAC itself in a single analysis. This approach allows for a detailed investigation of the ways in which BAC affects the microbial metabolism, leading to less-than-optimal biogas production, both in terms of total biogas and biogas composition. Improved understanding of the metabolic impacts of stressors on anaerobic digestion, as well as a rapid tool for monitoring and diagnostics, will lead to the future development of more efficient and effective operation of anaerobic digestors by giving us the ability to better identify and respond to potential fouling events.

Supplementary Materials

The following supporting information can be downloaded at: https://0-www-mdpi-com.brum.beds.ac.uk/article/10.3390/app12094620/s1, Figure S1: 1H NMR spectra of the 0 mg/L BAC series day 1, 2, 5, 9, 12, and 18. (a) Aromatic Region. (b) Functionalized Alkyl Region. (c) Alkyl Region.; Figure S2: 1H NMR spectra of 16.7 mg/L BAC series day 1, 2, 5, 9, 12, and 18. (a) Aromatic Region. (b) Functionalized Alkyl Region. (c) Alkyl Region.; Figure S3: 1H NMR spectra of 33.3 mg/L BAC series day 1, 2, 5, 9, 12, and 18. (a) Aromatic Region. (b) Functionalized Alkyl Region. (c) Alkyl Region.; Figure S4: 1H NMR spectra of 66.7 mg/L added BAC series day 1, 2, 5, 9, 12, and 18. (a) Aromatic Region. (b) Functionalized Alkyl Region. (c) Alkyl Region.; Figure S5: 1H - 1H TOCSY NMR spectra of control day 18.; Figure S6: 1H - 1H TOCSY NMR spectra of 16.7 mg/L added BAC day 18.; Figure S7: 1H - 1H TOCSY NMR spectra of 33.3 mg/L added BAC day 18.; Table S1: Biogas composition (CO2/CH4) of control, 16.7 mg/L added BAC, 33.3 mg/L added BAC, and 66.7 mg/L added BAC series.

Author Contributions

Conceptualization, R.F., N.B., J.G., J.K. and J.G.L.; Methodology, R.F. and J.G.L.; Validation, R.F. and J.G.L.; Formal Analysis, R.F.; Resources, N.B. and J.G.; Writing—Original Draft Preparation, R.F.; Writing—Review and Editing, J.G.L.; Supervision, J.G.L.; Funding Acquisition, J.G.L. and J.K. All authors have read and agreed to the published version of the manuscript.

Funding

This research was funded by the Natural Science and Engineering Research Council of Canada (NSERC) through a Collaborative Research and Development Grant (CRDPJ-501109-16) and a Discovery Grant (RGPIN-2016-04493), and by Geosyntec Consultants.

Data Availability Statement

Not applicable.

Acknowledgments

SiREM (Guelph, Ontario) is thanked for their assistance in providing the materials used to construct the microcosms used in this study.

Conflicts of Interest

The authors declare no conflict of interest.

References

  1. Oliveira, F.; Doelle, K. Anaerobic digestion of food waste to produce biogas: A comparison of bioreactors to increase methane content—A review. J. Food Process Technol. 2015, 6, 2. [Google Scholar]
  2. Mir, M.A.; Hussain, A.; Verma, C. Design considerations and operational performance of anaerobic digestor: A review. Cogent Eng. 2016, 3, 1181696. [Google Scholar] [CrossRef]
  3. Paritosh, K.; Kushwaha, S.K.; Yadav, M.; Pareek, N.; Chawade, A.; Vivekanand, V. Food Waste to Energy: An Overview of Sustainable Approaches for Food Waste Management and Nutrient Recycling. BioMed Res. Int. 2017, 2017, 2370927. [Google Scholar] [CrossRef] [PubMed]
  4. Franke-Whittle, I.H.; Walter, A.; Ebner, C.; Insam, H. Investigation into the effect of high concentrations of volatile fatty acids in anaerobic digestion on methanogenic communities. Waste Manag. 2014, 34, 2080–2089. [Google Scholar] [CrossRef] [PubMed] [Green Version]
  5. Ward, A.J.; Hobbs, P.J.; Holliman, P.J.; Jones, D.L. Optimisation of the anaerobic digestion of agricultural resources. Bioresour. Technol. 2008, 99, 7928–7940. [Google Scholar] [CrossRef]
  6. Lourenço, N.D.; Lopes, J.; Almeida, C.F.; Sarraguça, M.; Pinheiro, H. Bioreactor monitoring with spectroscopy and chemometrics: A review. Anal. Bioanal. Chem. 2012, 404, 1211–1237. [Google Scholar] [CrossRef]
  7. Parawira, W.; Murto, M.; Read, J.S.; Mattiasson, B. Volatile fatty acid production during anaerobic mesophilic digestion of solid potato waste. J. Chem. Technol. Biotechnol. 2004, 79, 673–677. [Google Scholar] [CrossRef]
  8. Mesquita, D.; Quintelas, C.; Amaral, A.L.P.D.; Ferreira, E.C. Monitoring biological wastewater treatment processes: Recent advances in spectroscopy applications. Rev. Environ. Sci. Bio/Technol. 2017, 16, 395–424. [Google Scholar] [CrossRef] [Green Version]
  9. Choubert, J.M.; Rieger, L.; Shaw, A.; Copp, J.; Spérandio, M.; Sorensen, K.; Rönner-Holm, S.; Morgenroth, E.; Melcer, H.; Gillot, S. Rethinkning wastewater characterization methods for activated sludge systems. Water Sci. Technol. 2013, 67, 2363–2373. [Google Scholar] [CrossRef] [Green Version]
  10. Janhom, T.; Wattanachira, S.; Pavasant, P. Characterization of brewery wastewater with spectrofluorometry analysis. J. Environ. Manag. 2009, 90, 1184–1190. [Google Scholar] [CrossRef]
  11. Maya-Altamira, L.; Baun, A.; Angelidaki, I.; Schmidt, J. Influence of wastewater characteristics on methane potential in food-processing industry wastewaters. Water Res. 2008, 42, 2195–2203. [Google Scholar] [CrossRef] [PubMed]
  12. Flores, G.A.E.; Fotidis, I.A.; Karakashev, D.B.; Kjellberg, K.; Angelidaki, I. Effects of Benzalkonium Chloride, Proxel LV, P3 Hypochloran, Triton X-100 and DOWFAX 63N10 on anaerobic digestion processes. Bioresour. Technol. 2015, 193, 393–400. [Google Scholar] [CrossRef] [PubMed]
  13. Zhang, C.; Cui, F.; Zeng, G.-M.; Jiang, M.; Yang, Z.-Z.; Yu, Z.-G.; Zhu, M.-Y.; Shen, L.-Q. Quaternary ammonium compounds (QACs): A review on occurrence, fate and toxicity in the environment. Sci. Total Environ. 2015, 518–519, 352–362. [Google Scholar] [CrossRef] [PubMed]
  14. Zhang, C.; Tezel, U.; Li, K.; Liu, D.; Ren, R.; Du, J.; Pavlostathis, S.G. Evaluation and modeling of benzalkonium chloride inhibition and biodegradation in activated sludge. Water Res. 2011, 45, 1238–1246. [Google Scholar] [CrossRef] [PubMed]
  15. Tezel, U.; Pavlostathis, S.G. Transformation of Benzalkonium Chloride under Nitrate Reducing Conditions. Environ. Sci. Technol. 2009, 43, 1342–1348. [Google Scholar] [CrossRef]
  16. Hajaya, M.G.; Pavlostathis, S.G. Fate and effect of benzalkonium chloride in continuous-flow biological nitrogen removal system treating poultry processing water. Bioresour. Technol. 2012, 118, 73–81. [Google Scholar] [CrossRef]
  17. Tezel, U.; Pierson, J.A.; Pavlostathis, S.G. Fate and effect of quaternary ammonium compounds on a mixed methanogenic culture. Water Res. 2006, 40, 3660–3668. [Google Scholar] [CrossRef]
  18. Tezel, U.; Pierson, J.A.; Pavlostathis, S.G. Effect of dodecyl dimethyl ammonium chloride on nitrate reduction in a mixed methanogenic culture. Water Sci. Technol. 2008, 57, 541–546. [Google Scholar] [CrossRef] [Green Version]
  19. Sütterlin, H.; Alexy, R.; Kümmerer, K. The toxicity of the quaternary ammonium compound benzalkonium chloride alone and in mixtures with other anionic compounds to bacteria in test systems with Vibrio fischeri and Pseudomonas putida. Ecotoxicol. Environ. Saf. 2008, 71, 498–505. [Google Scholar] [CrossRef]
  20. Garcı́a, M.; Campos, E.; Sánchez-Leal, J.; Ribosa, I. Anaerobic degradation and toxicity of commercial cationic surfactants in anaerobic screening tests. Chemosphere 2000, 41, 705–710. [Google Scholar] [CrossRef]
  21. Li, S.; Zhao, S. Spectrophotometric determination of cationic surfactants with benzothiaxolyldiazoaminoazobenzene. Anal. Chim. Acta 2004, 501, 99–102. [Google Scholar] [CrossRef]
  22. Yamamoto, K.; Oka, M.; Murakami, H. Spectrophotometric determination of trace ionic and non-ionic surfactants based on a collection on a membrane filter as the ion associate of the surfactant with Erythrosine B. Anal. Chim. Acta 2002, 455, 83–92. [Google Scholar] [CrossRef]
  23. Ding, W.-H.; Liao, Y.-H. Determination of Alkylbenzyldimethylammonium Chlorides in River Water and Sewage Effluent by Solid-Phase Extraction and Gas Chromatography/Mass Spectrometry. Anal. Chem. 2000, 73, 36–40. [Google Scholar] [CrossRef] [PubMed]
  24. Norberg, J.; Thordarson, E.; Mathiasson, L.; Jonsson, J.A. Microporous membrane liquid–liquid extraction coupled on-line with normal-phase liquid chromatography for the determination of cationic surfactants in river and wastewater. J. Chromatogr. A 2000, 869, 523–529. [Google Scholar] [CrossRef]
  25. Ding, W.-H.; Tsai, P.-C. Determination of Alkyltrimethylammonium Chlorides in River Water by Gas Chromatography/Ion Trap Mass Spectrometry with Electron Impact and Chemical Ionization. Anal. Chem. 2003, 75, 1792–1797. [Google Scholar] [CrossRef]
  26. Longstaffe, J.; Konzuk, J. NMR in the environmental industry. Magn. Reson. Chem. 2015, 53, 691–693. [Google Scholar] [CrossRef]
  27. Kostidis, S.; Addie, R.D.; Morreau, H.; Mayboroda, O.; Giera, M. Quantitative NMR analysis of intra- and extracellular metabolism of mammalian cells: A tutorial. Anal. Chim. Acta 2017, 980, 1–24. [Google Scholar] [CrossRef]
  28. Xue, J.; Isern, N.G.; Ewing, R.J.; Liyu, A.V.; Sears, J.A.; Knapp, H.; Iversen, J.; Sisk, D.R.; Ahring, B.K.; Majors, P.D. New generation NMR bioreactor coupled with high-resolution NMR spectroscopy leads to novel discoveries in Moorella thermo-acetica metabolic profile. Appl. Microbiol. Biotechnol. 2014, 98, 8367–8375. [Google Scholar] [CrossRef]
  29. Bai, L.; Carlton, D.D.; Schug, K.A. Complex mixture quantification without calibration using gas chromatography and a comprehensive carbon reactor in conjunction with flame ionization detection. J. Sep. Sci. 2018, 41, 4031–4037. [Google Scholar] [CrossRef]
  30. Pavia, D.L.; Lampman, G.M.; Kriz, G.S. Introduction to Spectroscopy, 3rd ed.; Thomson Learning Inc.: Bellingham, WA, USA, 2001. [Google Scholar]
  31. Botheju, D.; Bakke, R. Oxygen effects in anaerobic digestion—A review. Open Waste Manag. J. 2011, 4, 1–19. [Google Scholar] [CrossRef] [Green Version]
  32. Theuerl, S.; Klang, J.; Prochnow, A. Process disturbances in agricultural biogas production-cause, mechanisms and effects in the biogas microbiome: A review. Energies 2019, 12, 365. [Google Scholar] [CrossRef] [Green Version]
  33. McCarty, P.L. One hundred years of anaerobic treatment. In Anaerobic Digestion; Hughes, D.E., Ed.; Elsevier Biomedical Press: Amsterdam, The Netherlands, 1982; pp. 3–22. [Google Scholar]
  34. Mittal, K.M. Biogas Systems: Policies, Progress and Prospects; New Age International: New Delhi, India, 1997. [Google Scholar]
  35. Bryant, M.P. Microbial Methane Production—Theoretical Aspects2. J. Anim. Sci. 1979, 48, 193–201. [Google Scholar] [CrossRef]
  36. Schink, B. Energetics of syntrophic cooperation in methanogenic degradation. Microbiol. Mol. Biol. Rev. 1997, 61, 262–280. [Google Scholar] [PubMed]
  37. Tretter, L.; Patocs, A.; Chinopoulos, C. Succinate, an intermediate in metabolism, signal transduction, ROS, hypoxia, and tumorigenesis. Biochim. Biophys. Acta. 2016, 1857, 1086–1101. [Google Scholar] [CrossRef] [PubMed]
  38. Song, H.; Lee, S.Y. Production of succinic acid by bacterial fermentation. Enzyme Microb. Technol. 2006, 39, 352–361. [Google Scholar] [CrossRef]
  39. Garcia, M.T.; Campos, E.; Sanchez-Leal, J.; Ribosa, I. Effect of the alkyl chain length on the anaerobic biodegradability and toxicity of quaternary ammonium based surfactants. Chemosphere 1999, 38, 3473–3483. [Google Scholar] [CrossRef]
  40. Durham, J.; Young, J.C. Toxic Impact of Commercial Biocides on Industrial Wastewater Treatment Systems. Proc. Water Environ. Fed. 2009, 2009, 5670–5689. [Google Scholar] [CrossRef]
  41. Tezel, U.; Pierson, J.A.; Pavlostathis, S.G. Effect of polyelec-trolytes and quaternary ammonium compounds on the anaerobic biological treatment of poultry processing wastewater. Water Res. 2007, 41, 1334–1342. [Google Scholar] [CrossRef]
  42. Chen, J.L.; Ortiz, R.; Steele, T.W.; Stuckey, D.C. Toxicants inhibiting anaerobic digestion: A review. Biotechnol. Adv. 2014, 32, 1523–1534. [Google Scholar] [CrossRef]
Figure 1. The chemical structure of benzalkonium chloride (BAC) shown alongside the 1H-1H TOCSY NMR spectrum of a microcosm after 18 days of exposure to 16.7 mg/L BAC. The resonances from BAC are highlighted in red and were confirmed using a prepared standard.
Applsci 12 04620 g001
Figure 2. The alkyl region of the 1H NMR spectra microcosm samples after 18 days of BAC exposure for (a) 0 mg/L BAC, (b) 16.7 mg/L BAC, (c) 33.3 mg/L BAC, and (d) 66.7 mg/L BAC. Peaks for confirmed structures are numbered and are identified in Table 1.
Applsci 12 04620 g002
Figure 3. The functionalized alkyl region of the 1H NMR spectra microcosm samples after 18 days of exposure to BAC for (a) 0 mg/L BAC, (b) 16.7 mg/L BAC, (c) 33.3 mg/L BAC, and (d) 66.7 mg/L BAC. Peaks for confirmed structures are numbered and are identified in Table 1.
Applsci 12 04620 g003
Figure 4. The aromatic region of the 1H NMR spectra microcosm samples after 18 days of exposure to BAC for (a) 0 mg/L BAC, (b) 16.7 mg/L BAC, (c) 33.3 mg/L BAC, and (d) 66.7 mg/L BAC. Peaks for confirmed structures are numbered and are identified in Table 1.
Applsci 12 04620 g004
Figure 5. 1H-1H TOCSY NMR spectra of the functionalized alkyl and alkyl regions of microcosm samples after 18 days of BAC exposure. (a) 0 mg/L BAC, (b) 16.7 mg/L BAC, (c) 33.3 mg/L, (d) 66.7 mg/L BAC. Colors denote different classes of compounds; BAC (red), linear fatty acids (green); branched chain fatty acids (blue); amino acids (purple); alcohols (orange).
Applsci 12 04620 g005
Figure 6. Changes in fatty acid concentrations over time after exposure to BAC as measured using 1H NMR spectroscopy for (a) 0 mg/L BAC, (b) 16.7 mg/L BAC, (c) 33.3 mg/L BAC, and (d) 66.7 mg/L BAC.
Applsci 12 04620 g006
Figure 7. Changes in selected amino acid concentrations in the microcosms exposed to BAC as measured using 1H NMR spectroscopy for (a) 33.3 mg/L BAC and (b) 66.7 mg/L BAC.
Applsci 12 04620 g007
Figure 8. Percent of CH4 in the microcosm headspace relative to the combined CH4 and CO2 after exposure to BAC.
Applsci 12 04620 g008
Figure 9. The change in combined CH4 and CO2 in the microcosm headspace after exposure to BAC relative to the 0 mg/L microcosm on day 2.
Applsci 12 04620 g009
Table 1. Metabolites identified in microcosm studies using 1H NMR spectroscopy.
IDCompoundIDCompoundIDCompoundIDCompound
Fatty Acids Amino Acids Alcohols Auxins
1Formic Acid10Glycine20Ethanol28Indole-3-Acetate
2Acetic Acid11Alanine21Ethylene Glycol Disinfecting Agents
3Propionic Acid12Threonine22Propylene Glycol29Benzalkonium Chloride
4Butyric Acid13Glutamine Amines
5Isobutryic Acid14Methionine23Methyl Amine
6Valeric Acid15Valine Amides
7Isovaleric Acid16Isoleucine24Acetamide
8Succinic Acid17Tyrosine Pyrimidines
Fatty Acid Metabolites18Phenylalanine25Uracil
9Phenylacetate19Tryptophan
Publisher’s Note: MDPI stays neutral with regard to jurisdictional claims in published maps and institutional affiliations.

