
In-Process Measurement of Barkhausen Noise for Detection of Surface Integrity during Grinding


1
Leibniz Institute for Materials Engineering—IWT, 28359 Bremen, Germany
2
Chair of Machining Technologies, University of Bremen, 28359 Bremen, Germany
3
MAPEX Center for Materials and Processes, University of Bremen, 28359 Bremen, Germany
*
Author to whom correspondence should be addressed.
Appl. Sci. 2022, 12(9), 4671; https://0-doi-org.brum.beds.ac.uk/10.3390/app12094671
Submission received: 13 April 2022
/
Revised: 29 April 2022
/
Accepted: 4 May 2022
/
Published: 6 May 2022
(This article belongs to the Section Mechanical Engineering)
Abstract
:The Barkhausen noise (BN) analysis is a method increasingly used for the post-process assessment of thermo-mechanical surface damages from grinding and has several advantages compared with the established nital etching method. In-process measurement of the BN has not been used industrially yet, but the basics have already been developed and promise time savings by avoiding time spent on inspections after grinding. Furthermore, it bears potential for the optimization of grinding processes and, in perspective, a process control. In the present work, the suitability of in-process BN analysis for the detection of thermo-mechanically influenced near-surface regions was assessed. Case-hardened workpieces were ground, and BN signals were related to the properties of the surface and subsurface area, in particular residual stresses, microstructure and surface hardness after grinding. The results show a clear dependency of BN on surface layer properties that allows for an in-process detection of detrimental changes in the surface state. Special attention was paid to the differences between in-process and post-process measured signals, and the suitability of the different measurement parameters for in-process detection was investigated.
1. Introduction
Highly efficient grinding processes operating at the limits of their capacity bear the risk of negative thermo-mechanical influences on the surface region [1]. These damages, also known as grinding burn, can reach from light and stronger tempering zones with decreasing hardness and shifts in residual stresses toward the tensile range to rehardening and should be avoided, especially for highly loaded components such as power train components. A method established for the detection of grinding burn is nital etching according to ISO 14104 [2], which however, due to its subjectivity, requires qualified testing personnel. Furthermore, due to the chemicals used, the method has to be seen critically for environmental and safety reasons. Another method increasingly used for ferromagnetic materials is the magnetic Barkhausen noise (BN) analysis [3].
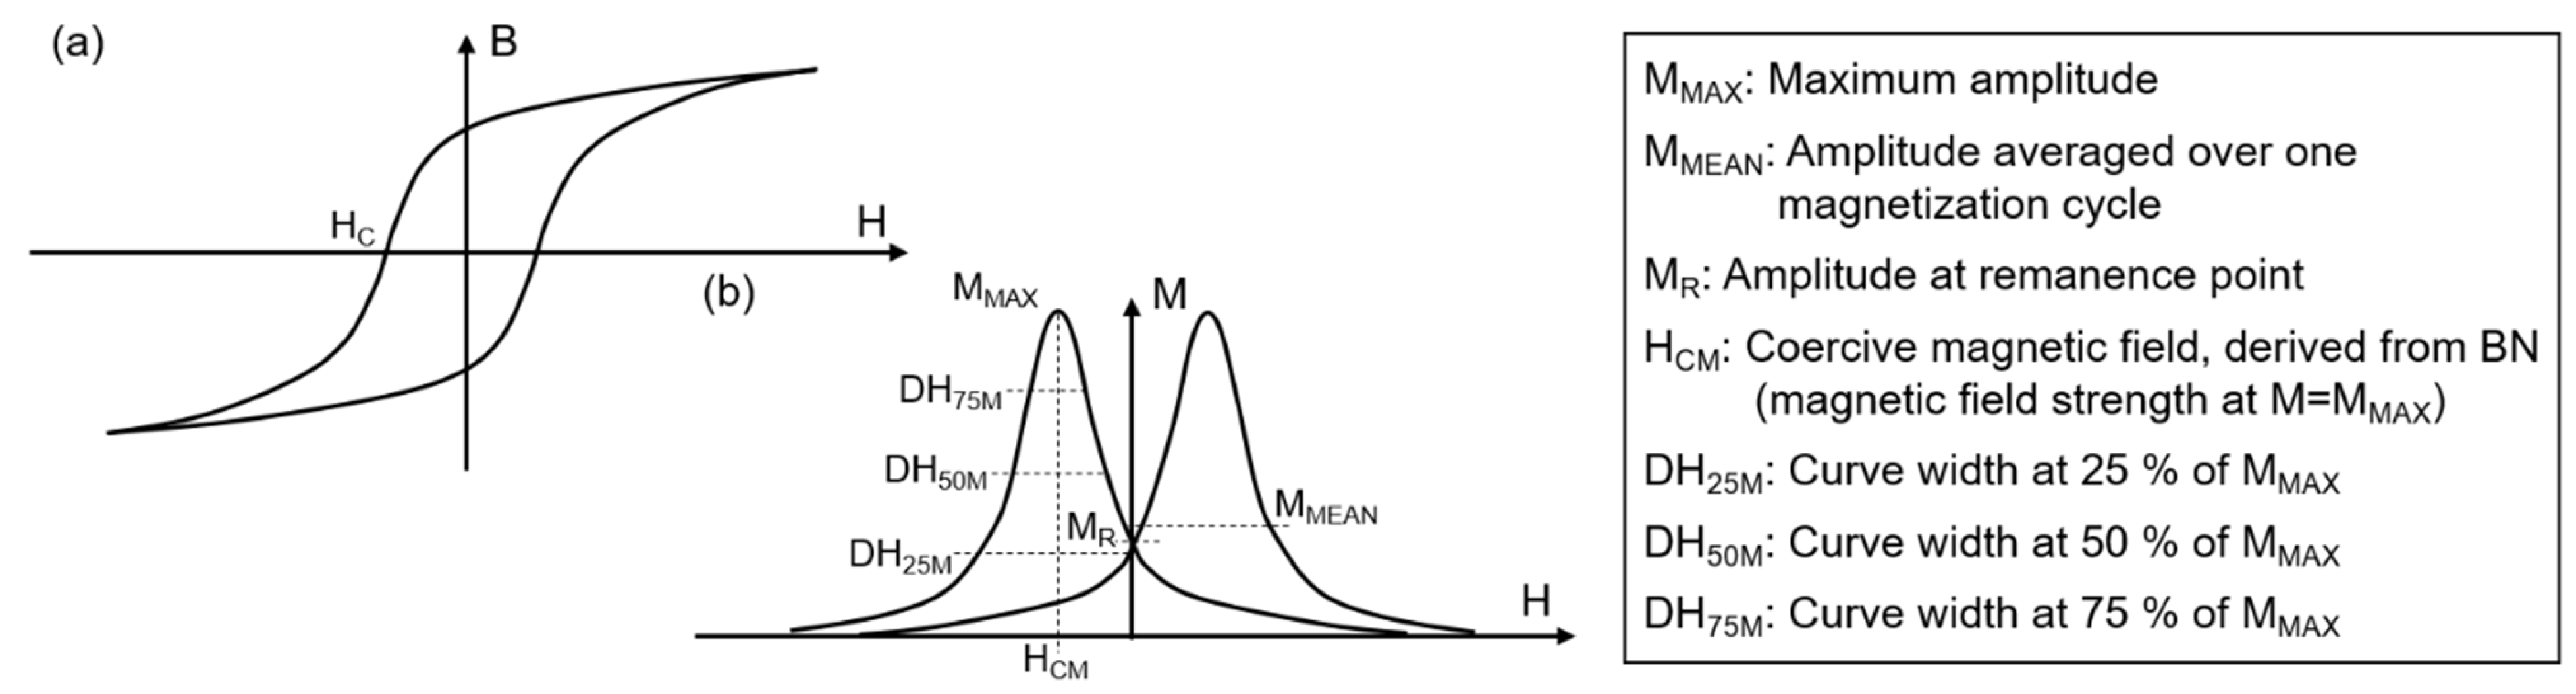
The magnetic Barkhausen noise analysis is based on the periodic magnetization by an applied alternating field. These materials consist of unidirectionally magnetized Weiss domains separated by Bloch walls. When a magnetic field is applied to a ferromagnetic material, the Weiss domains that are oriented approximately parallel to the applied field grow first by shifting the Bloch walls at the expense of less favorably oriented ones. Further alignment is achieved by rotating the magnetic domains [4]. The resulting relationship (hysteresis curve) between magnetic flux density B and magnetic field strength H is shown in Figure 1a [5,6]. The stepwise displacement of the Bloch walls leads to voltage jumps that can be made audible as a noise signal (BN) [7]. Plotting of the strength M of the noise signal against the field strength H leads to the profile curve shown in Figure 1b [8]. Depending on the manufacturer of the measurement technology, various characteristic values are derived from the curve. Figure 1 shows the measurement quantities of the 3MA-II technique from Fraunhofer IZFP. Other systems use, e.g., the root mean square of Barkhausen noise pulses [9]. Furthermore, wavelets [10,11] or Fourier Transformation [12,13] can be used to decompose the BN signal into frequency spectra. This allows for the extraction of useful components from the raw signal while eliminating disturbances [14].
The magnetic BN analysis is increasingly used industrially as a post-process method for the inspection of ground components. It is able to detect slight influences of the surface properties even before the typical tempering zones become visible through nital etching as well as sub-surface damages [1]. For some commonly used case-hardened and tempered steels, studies about the influence of the heat treatment conditions, especially case hardening depth CHD and surface hardness, exist. This affects both the grindability and the detectability of possible changes induced by the grinding process [15,16]. Typically, the BN signal increases with beginning thermo-mechanical changes (tensile stresses without tempering effects and light tempering zones). For heavy tempering zones and rehardening, the signal amplitude often decreases again [17,18]. Since a single parameter such as the maximum amplitude MMAX or the averaged BN does not guarantee unambiguous detection of all damage levels, multiparameter approaches for unambiguous distinction were developed [18,19].
For in-process use of BN analysis, only single approaches exist, which have not been used industrially so far [20,21,22]. In addition to time savings by eliminating time spent on inspections after grinding, these approaches offer the potential for process control, possibly in combination with other in-process measured quantities [23]. A special characteristic of BN measurements during grinding is the occurrence of an effect known as passive BN. This describes a signal that occurs without external magnetic field and its occurrence is currently explained by mechanical excitation of the Bloch walls due to vibrations during the process [24,25]. A similar effect was observed during rotational bending, called mechanical BN [26,27]. It is explained by the invers-magnetostrictive (magneto-mechanical) effect, which describes the relationship among stresses, local changes in the magnetization, and hence, Bloch wall movements [26]. This relationship between magnetic and elastic states is measurable on almost all ferromagnetic materials [28].
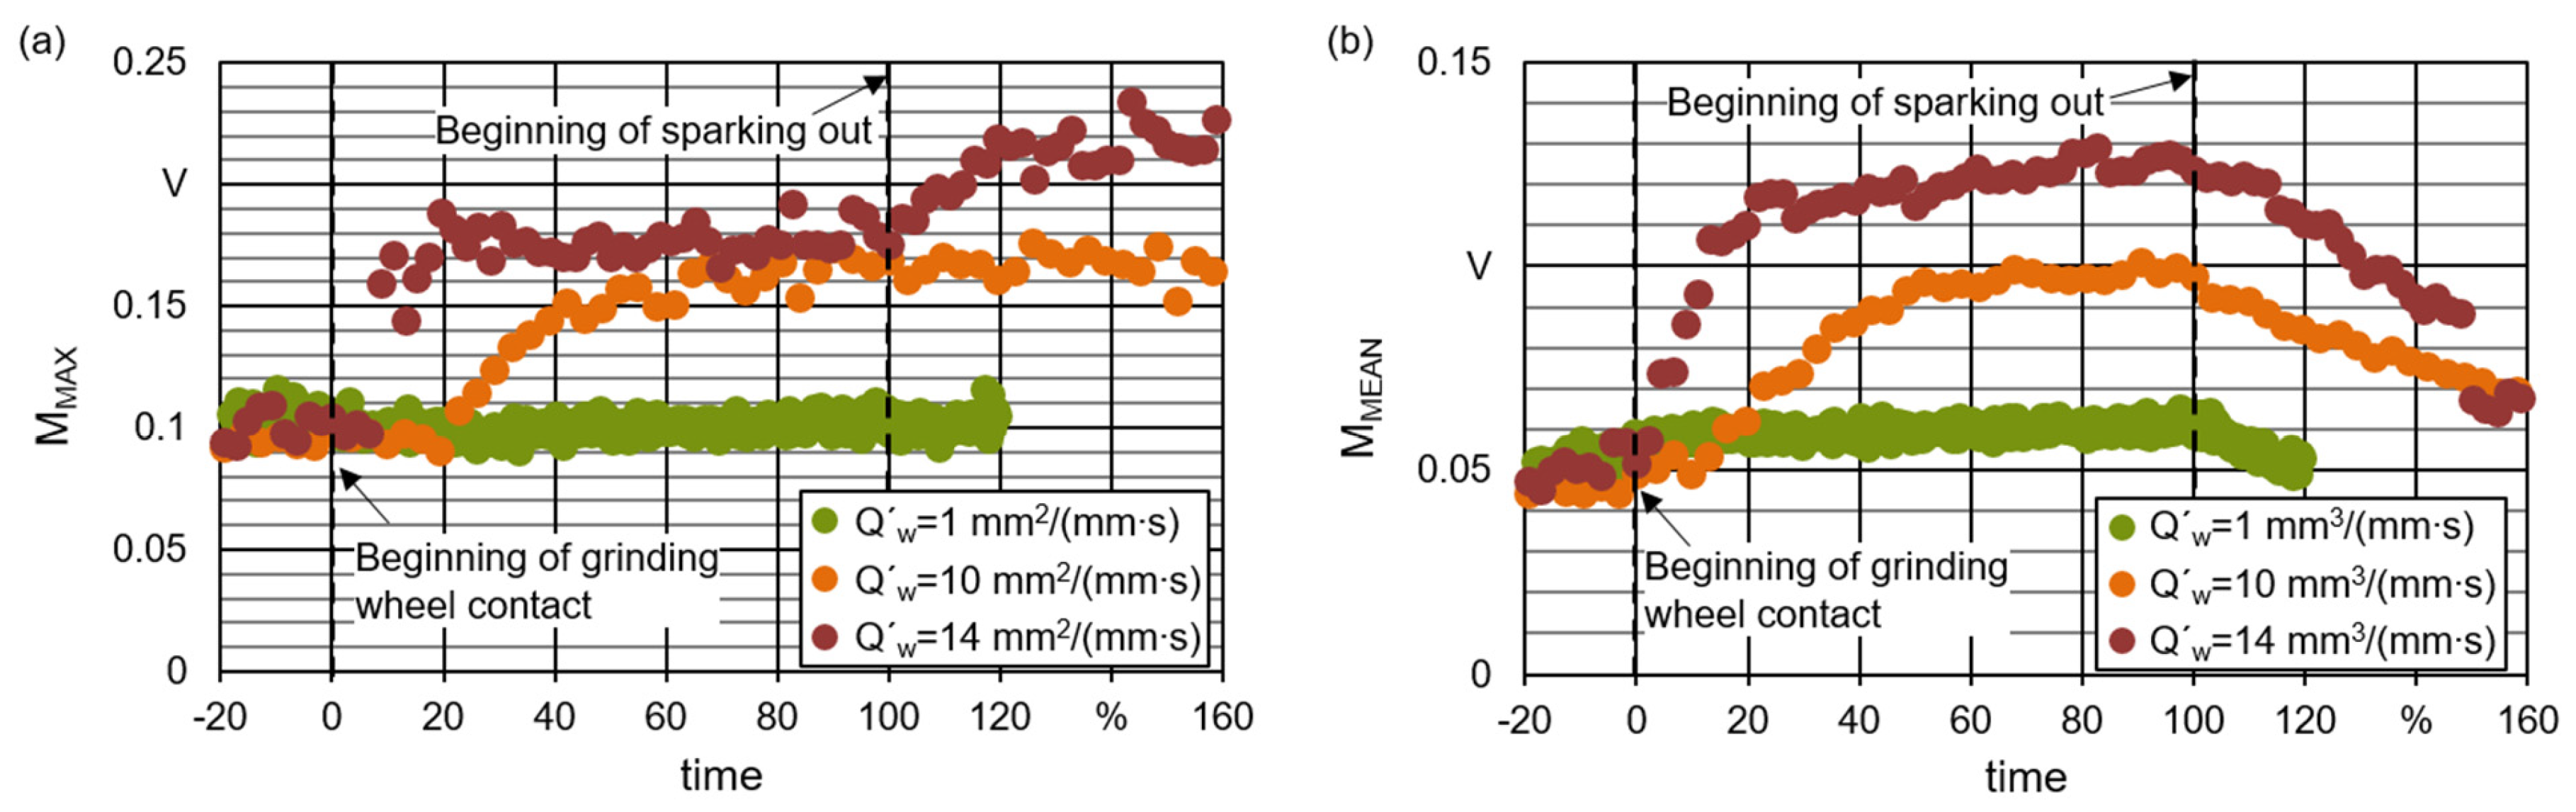
In addition, during in-process measurements with external magnetization, the behavior of single characteristic values is different from post-process measurements, supporting the theory of superimposed mechanical excitation. While the averaged amplitude MMEAN and the maximum amplitude MMAX normally behave analogously, MMEAN rises steeply with the beginning of contact between grinding wheel and workpiece and drops again from the beginning of spark-out [22].
This study investigates the suitability of BN for the in-process detection of negative thermo-mechanical influences on the surface area during external cylindrical grinding of case-hardened workpieces. By varying the related material removal rate Q′w, different surface states were generated. The in-process recorded BN signals are compared with a post-process analysis of residual stresses, microstructure and hardness. In addition, in-process and post-process recorded signals are compared. The suitability of the different parameters for the in-process detection of surface damages is evaluated.
2. Material and Methods
The investigations were carried out on a cylindrical grinding machine Studer S41 (Fritz Studer AG, Steffisburg, Switzerland) with a corundum grinding wheel 54A120 H15VPMF904W (500 mm × 36 mm × 203.2 mm). Case-hardened workpieces (Ø67.7 mm × 152 mm) from AISI 4820 (DIN 18CrNiMo7-6) were machined by a cylindrical outer diameter grinding process. Table 1 gives the target values for the heat treatment (surface carbon content in wt.%/case hardening depth in mm/tempering temperature in °C) and the resulting surface carbon content, case hardening depth, surface hardness and surface oxidation depth of the different conditions, characterized at coupon samples. Hardness according to Vickers was measured with a LV-700AT (LECO Instrumente, Mönchengladbach, Germany). Surface oxidation depth was determined from oxygen depth profiles measured with a glow discharge spectrometer LECO GDS-750A (LECO Instrumente, Mönchengladbach, Germany) as the depth with less than 0.001 wt.% oxygen.
On each of the four heat treatment variations, different thermo-mechanical levels were achieved by the grinding process parameters given in Table 2. The total depth of cut ae was 100 µm for specific material removal rates Q′w = 1 mm3/(mm∙s) to Q′w = 10 mm3/(mm∙s), and 300 µm for Q′w = 12 mm3/(mm∙s) and Q′w = 14 mm3/(mm∙s). Cutting speed vc and speed ratio q were constant over all grinding processes, while the specific material removal rate Q′w was varied by the radial feed speed vfr. Oil (Rhenus EG 10) was supplied with a metal working fluid flow rate QMWF of 40 L/min. The grinding wheel was dressed with a dressing overlap ratio Ud of 3 and a speed ratio qd of −1.
BN was measured with a 3MA-II device (Fraunhofer IZFP, Saarbrücken, Germany) and a special sensor for in-process use implemented in the grinding machine. The investigations were performed contactless with an air gap of 200 µm between the sensor and the workpiece surface. As measurement parameters, a magnetization amplitude of 100 A/cm, a magnetization frequency of 120 Hz and an analyzing frequency range from 100 kHz to 1000 kHz were chosen. Detailed information about the setup and repeatability of measurements is given in [22]. The setup with an isolating transformer and potential equalization ensures the elimination of interfering signals by electromagnetic disturbances.
The ground samples were characterized by hardness testing, residual stress measurements and micrographs. Surface hardness was measured with the same device used for the characterization of the heat treatment state: LV-700AT. The residual stresses were measured with a diffractometer type MZ IV from GE Inspection Technology, Ahrensburg, Germany (Cr-Kα-radiation, beam diameter 2 mm) at the α{211} peak with 15 ψ angles between −45° and 45°. Measurements and analyses were performed using the sin2Ψ method with Young’s Modulus 220,000 MPa and Poisson’s ratio 0.28. For determination of the depth profiles, the material was submitted to successive electrochemical etching using a H2SO4/H3PO4 solution. The micrographs were etched with a 3% alcoholic HNO3 solution and investigated with an optical microscope Zeiss Axiophot (Carl Zeiss AG, Oberkochen, Germany).
3. Results and Discussion
By grinding with varying specific material removal rates Q′w, different surface area states were achieved, which influence the BN signals during and after grinding. Figure 2 gives an example for the signal course of maximum BN amplitude MMAX (a) and averaged BN MMEAN (b) during grinding with different Q′w. Since the duration of the grinding processes differs significantly, the time axis for a better overview is shown as a percent of the machining time (beginning of contact between grinding wheel and workpiece to the beginning of spark-out). Both parameters increased with the beginning of contact with the grinding wheel, and the maximum signal level increased with higher Q′w. MMEAN decreased from the beginning of spark-out, and after grinding, the signal level of the grooves with different Q′w differed only slightly. MMAX scatters more than MMEAN and stays either at nearly the same level after the end of grinding wheel contact or even increases after the end of grinding, with Q′w = 14 mm3/(mm∙s). Possible reasons for this behavior and consequences for the detection of thermo-mechanical damages are discussed later.
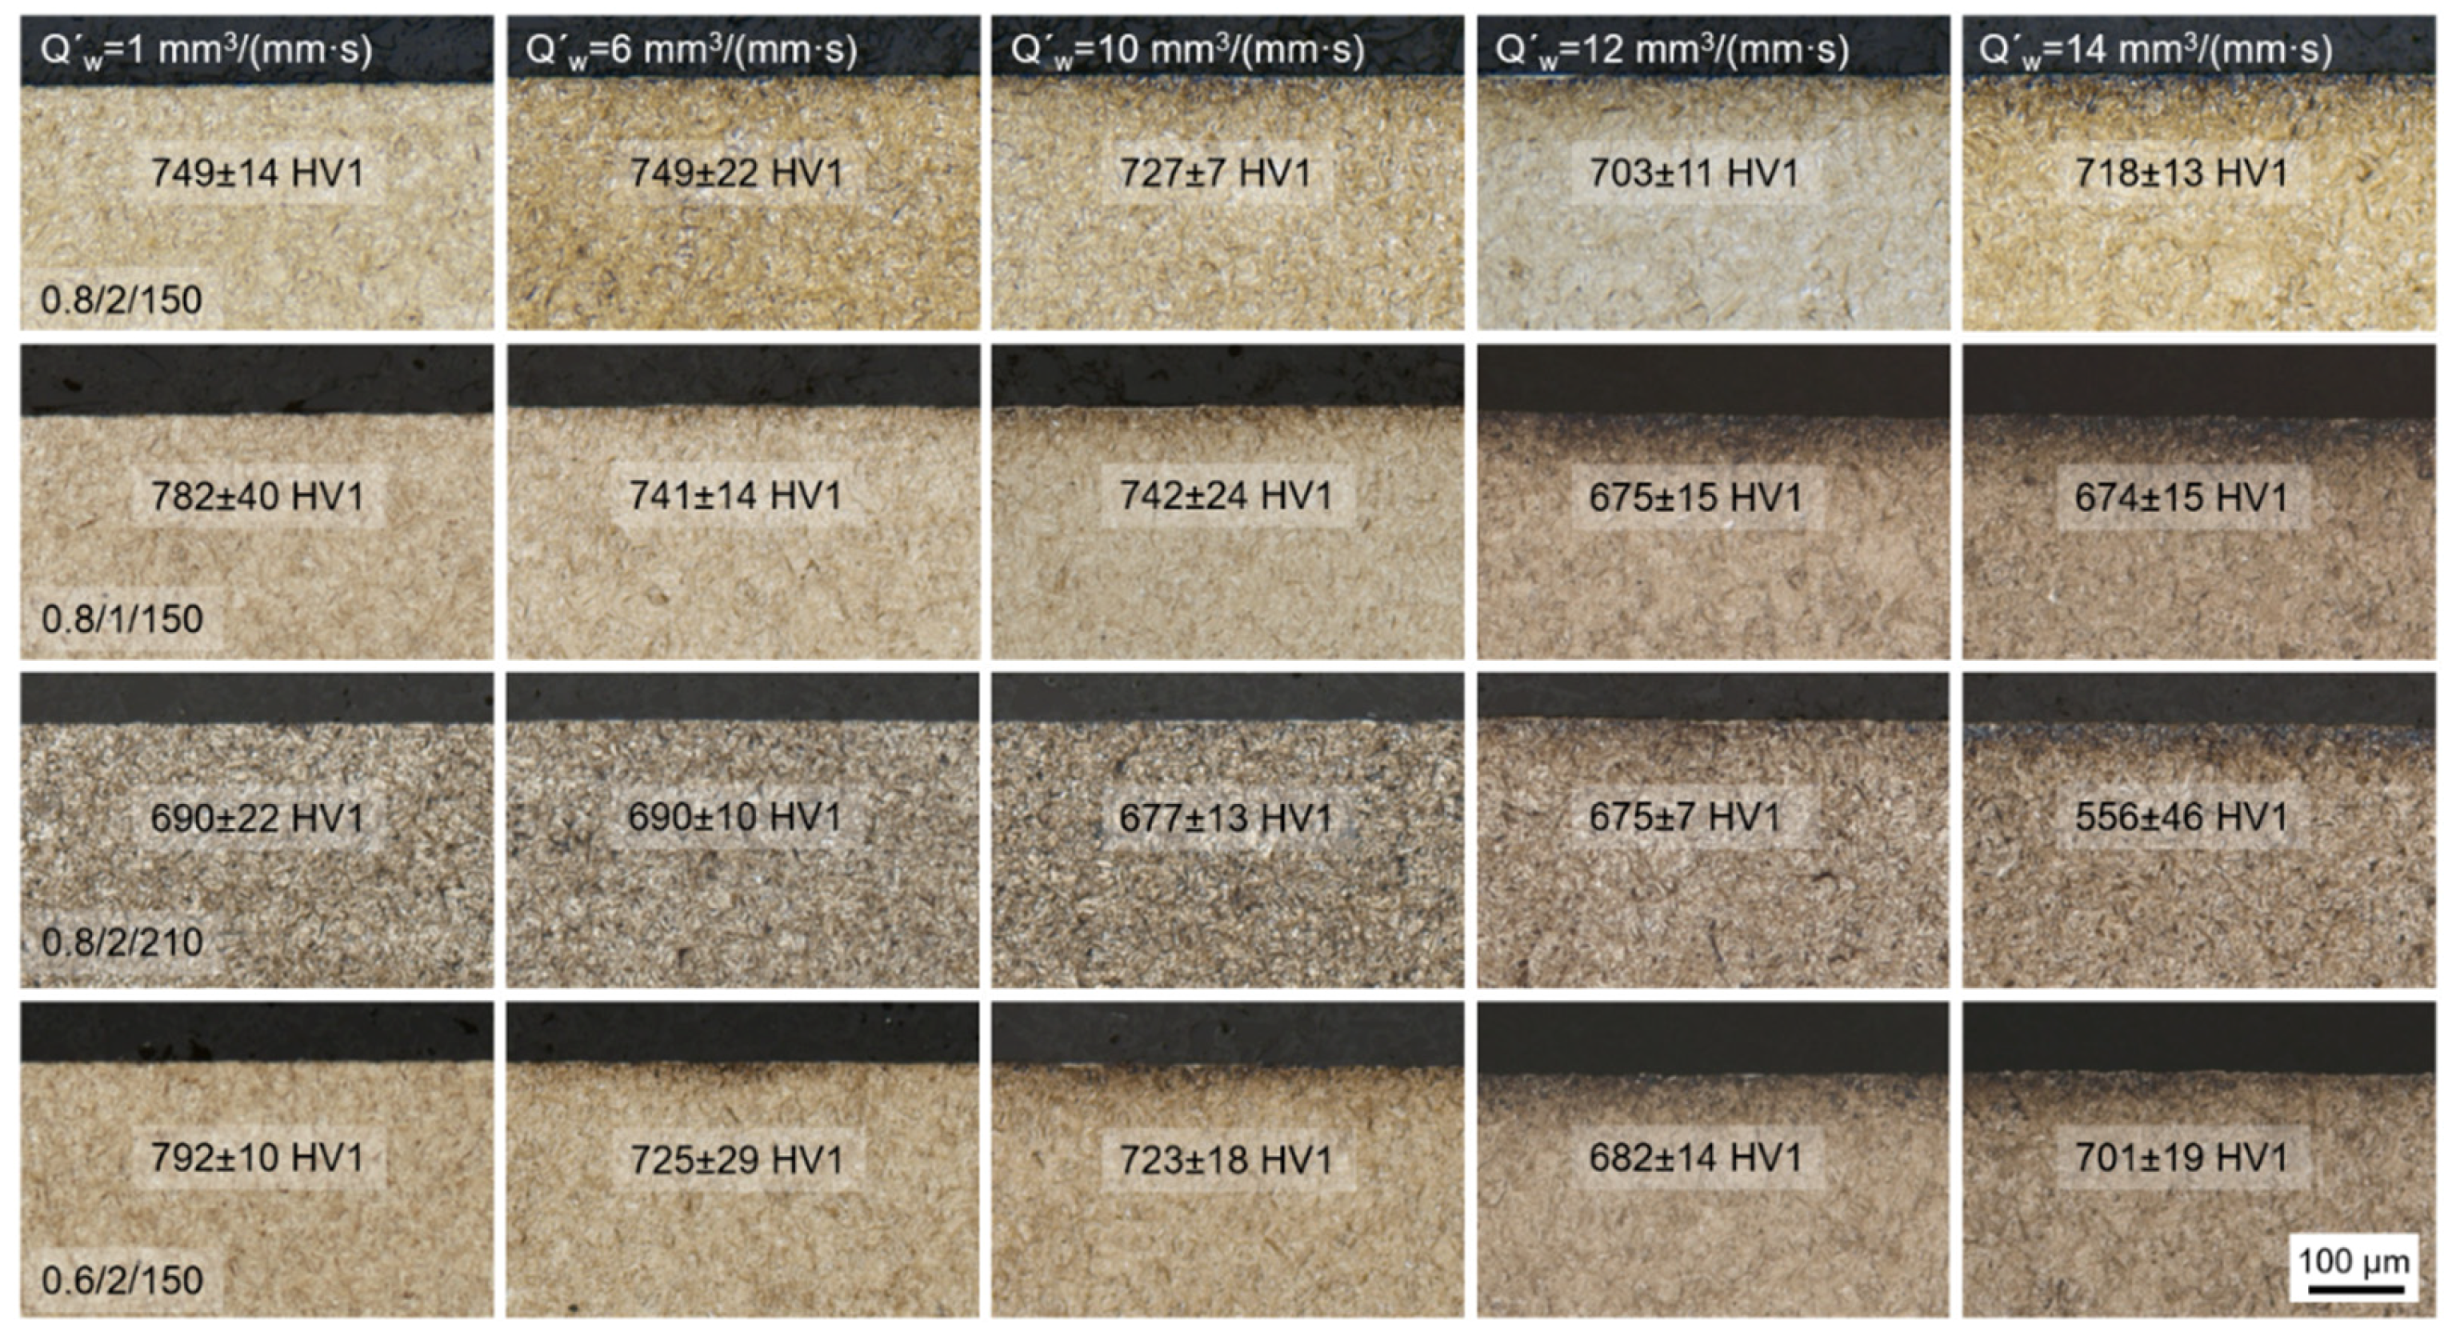
Figure 3 shows the micrographs of all ground states, the example discussed above (0.8/1/150) is revealed in the second row. The first micrograph (Q′w = 1 mm3/(mm∙s)) shows a surface state without any tempering effects while light tempering starts to occur for the second grinding process (Q′w = 6 mm3/(mm∙s)). With increasing Q′w, tempering zones (dark etching zones) become more pronounced and reach larger depths. The surface hardness given in the figure shows a trend of decreasing hardness with increasing tempering zones, with some scattering in the values. For all heat treatment states, damage-free surface states and increasingly pronounced tempering zones were generated, while no clearly identifiable rehardening was observed at the surface. However, the thickness of the tempering zones and the limit at which Q′w leads to visible damages differ between conditions. Especially for the higher tempered material state (0.8/2/210), tempering zones appear later. The influence of the heat treatment state on the grindability is not further discussed at this point, as it is already well documented in [15,16].
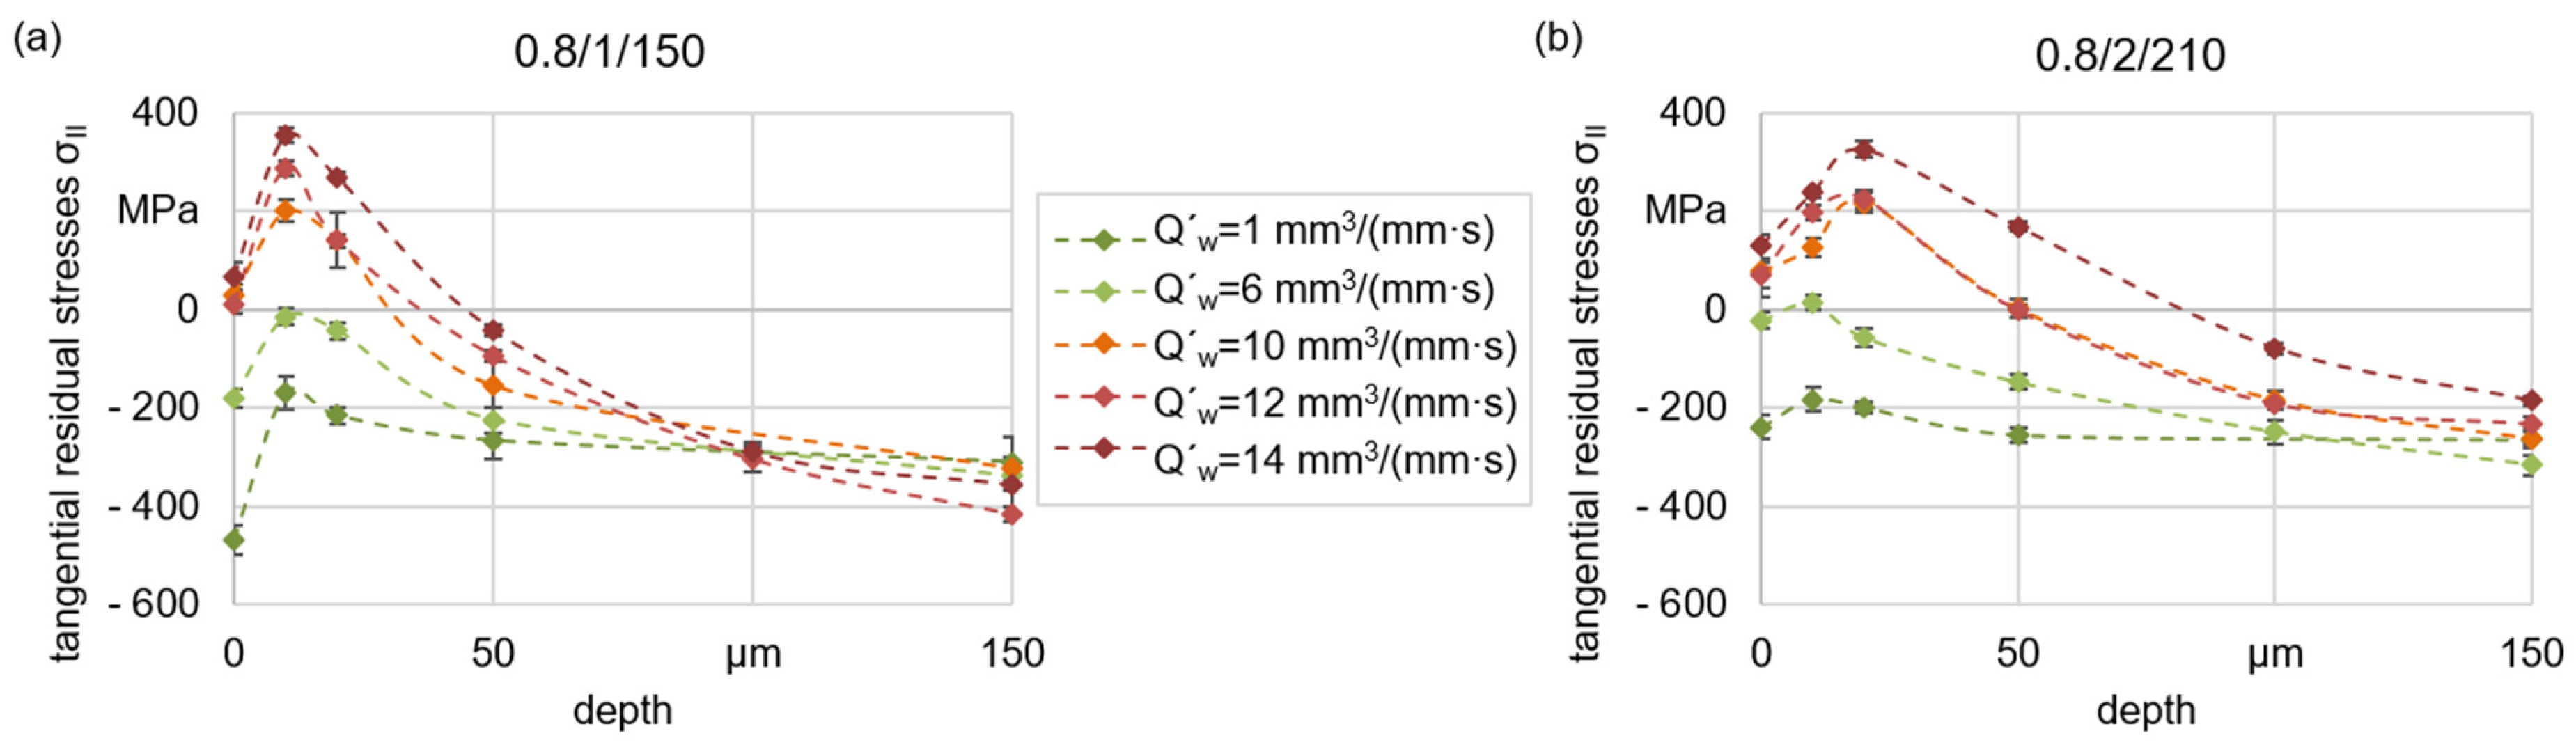
The residual stress depth profiles shown in Figure 4 were determined by the method described in Section 2 and confirm the increasing influence on the surface state with higher Q′w. After grinding with Q′w = 1 mm3/(mm∙s), the residual stresses are clearly in the compressive range. Due to grinding with Q′w = 6 mm3/(mm∙s), the residual stresses are shifted in the direction of tension but are still in the compressive range. With further increases in the specific material removal rate, the maximum tensile stresses as well as the depth of influence increase.
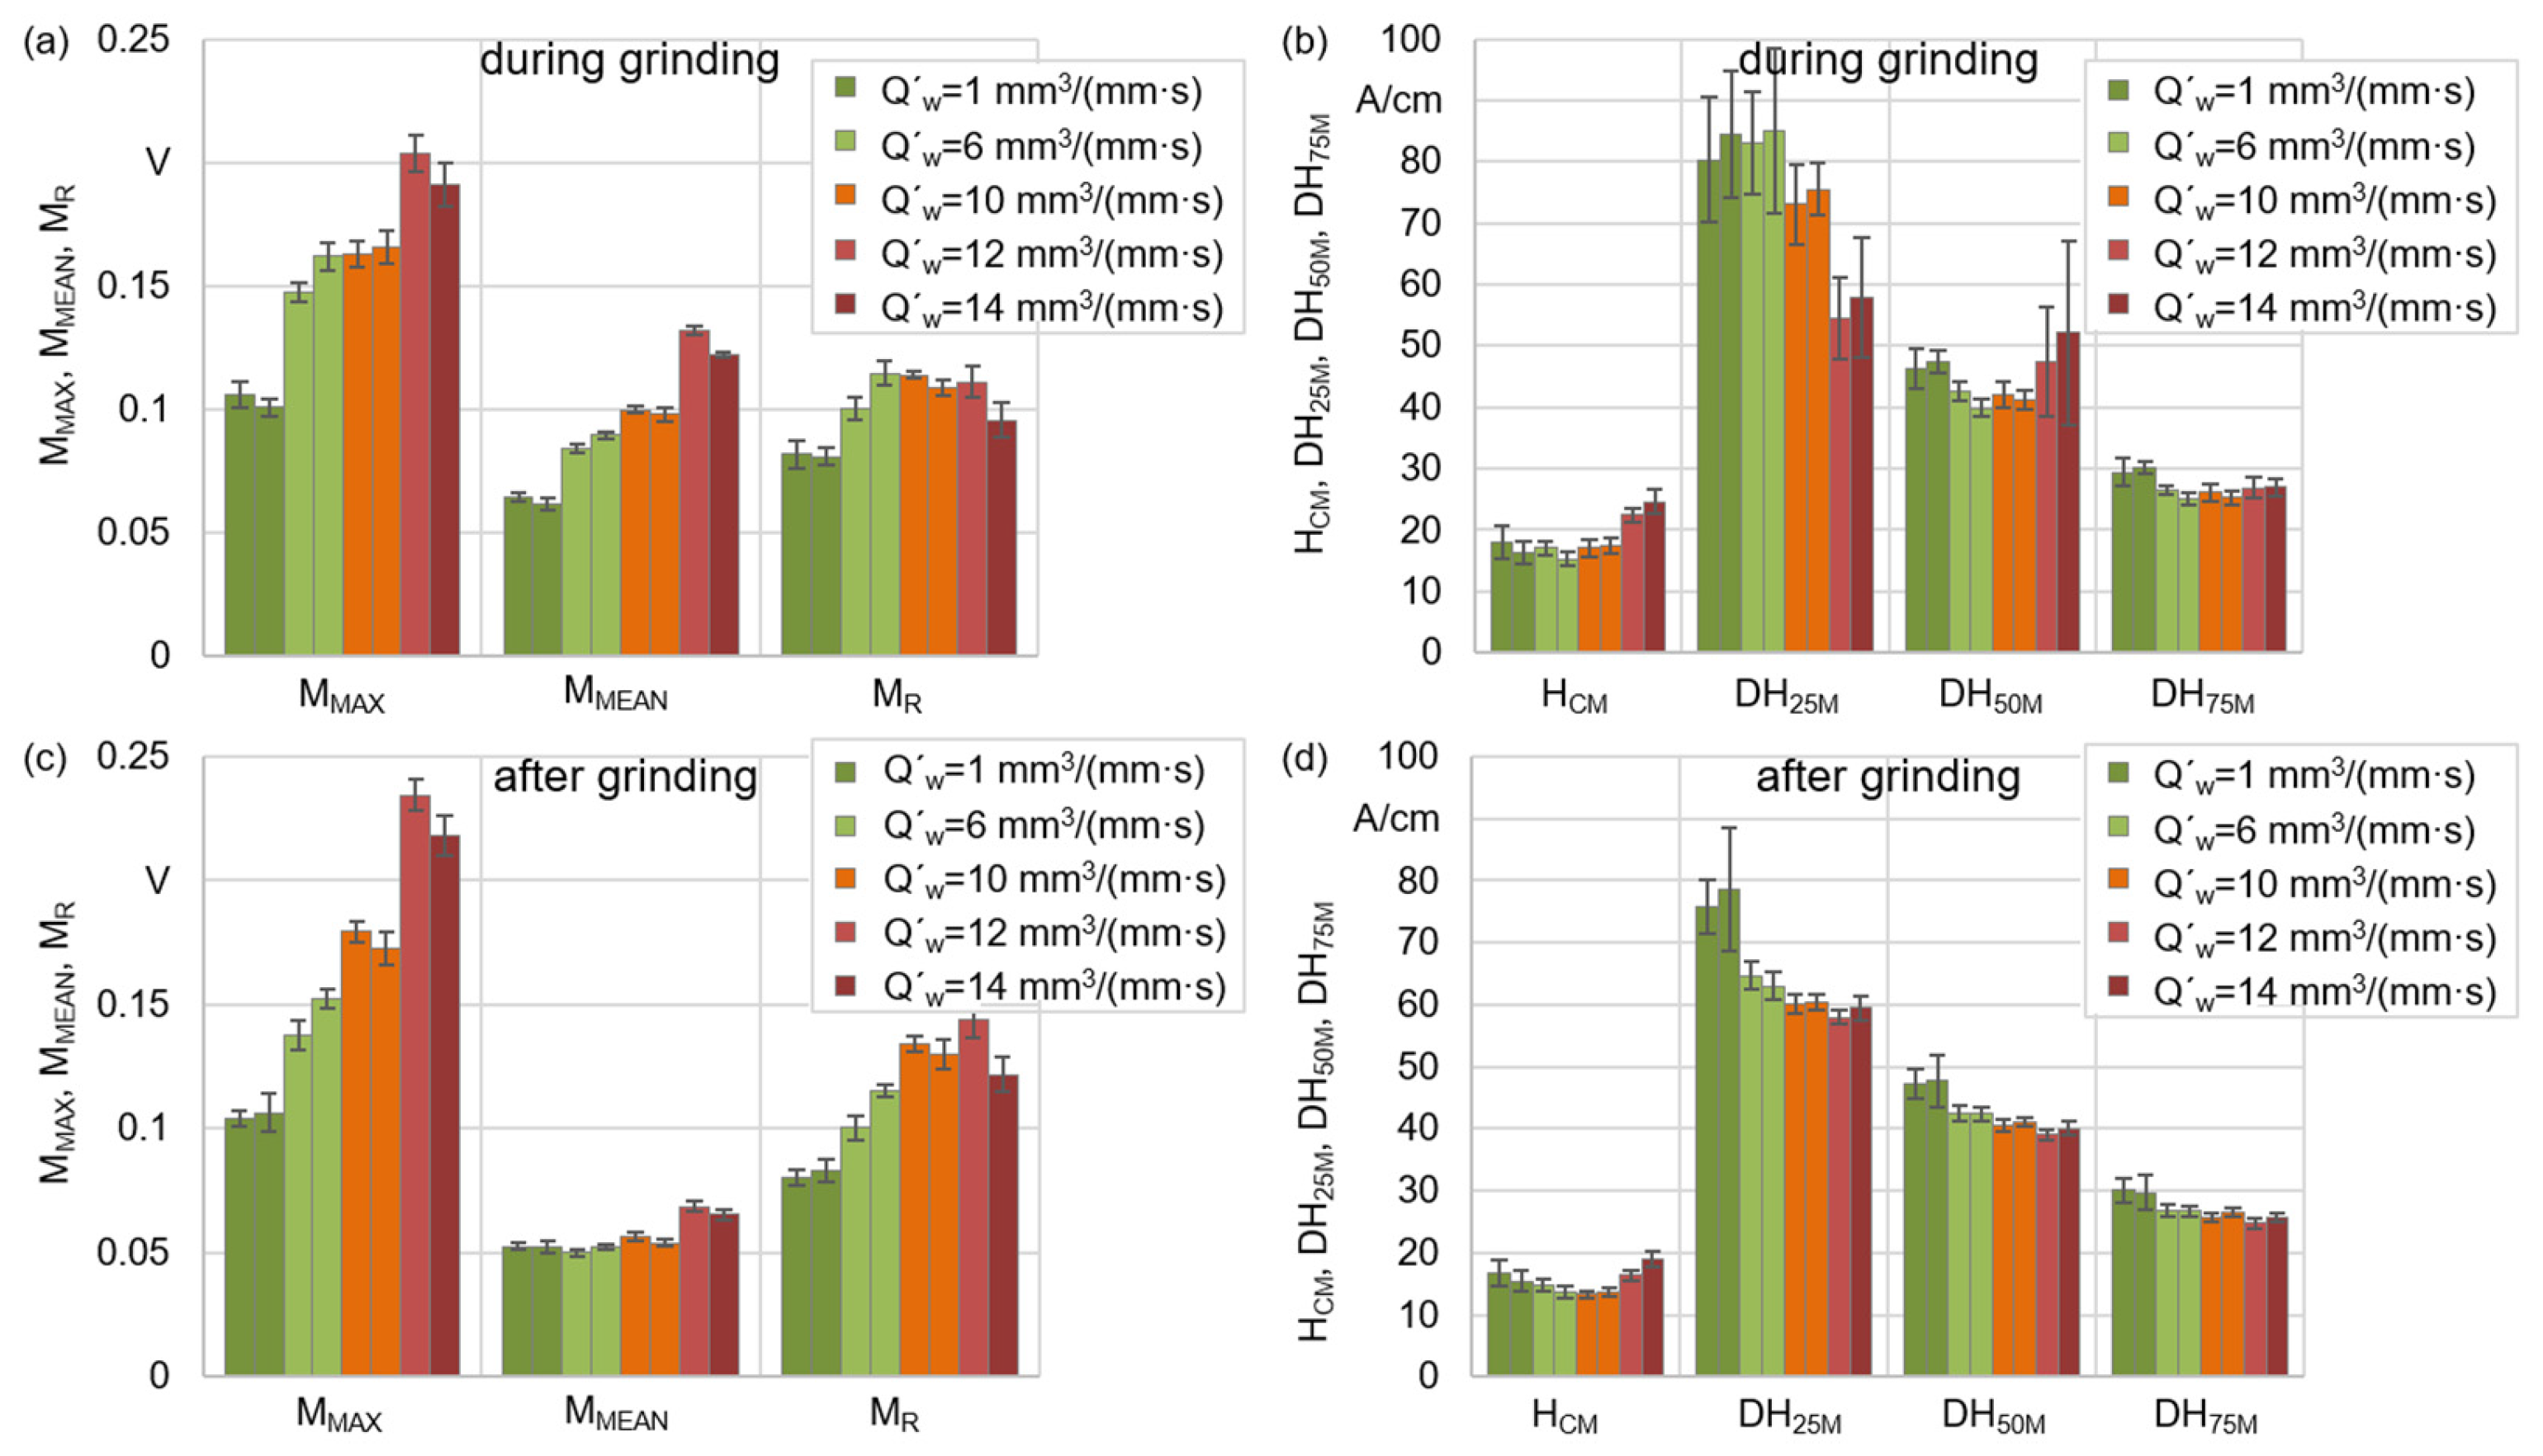
Figure 5 shows the characteristic BN values introduced in Figure 1 during (a and b) and after (c and d) grinding. Average values and standard deviations are calculated from seven or ten measurements, respectively, before the beginning (in-process) and after the end (post-process) of sparking out on the rotating workpiece. In general, MMAX, MMEAN and MR (a and c) initially increase with thermo-mechanical surface changes and decrease again for the strongest damage. This corresponds well with the behavior known for post-process measurements from the literature [11,12,13]. For the values derived from peak position and width (b and d), this is less unambiguous. HCM slightly decreases with initial tempering and increases again with heavier tempering. This widely agrees with the observations in [18,19]. DH25M, DH50M and DH75M determined after grinding decreased with increasing influence on the surface area, while the equivalent FWHM in [18] decreased only in the area of light tempering zones slightly and increased afterwards. During grinding, the behavior of DH25M and DH50M was remarkable especially because of strong scattering.
Based on the ratio of signal differences between the damage-free state and the different tempering zones and scattering, MMAX and MMEAN seem to be most suitable for the detection of damages during grinding. In the following, a more detailed consideration of the characteristics of these values is made.
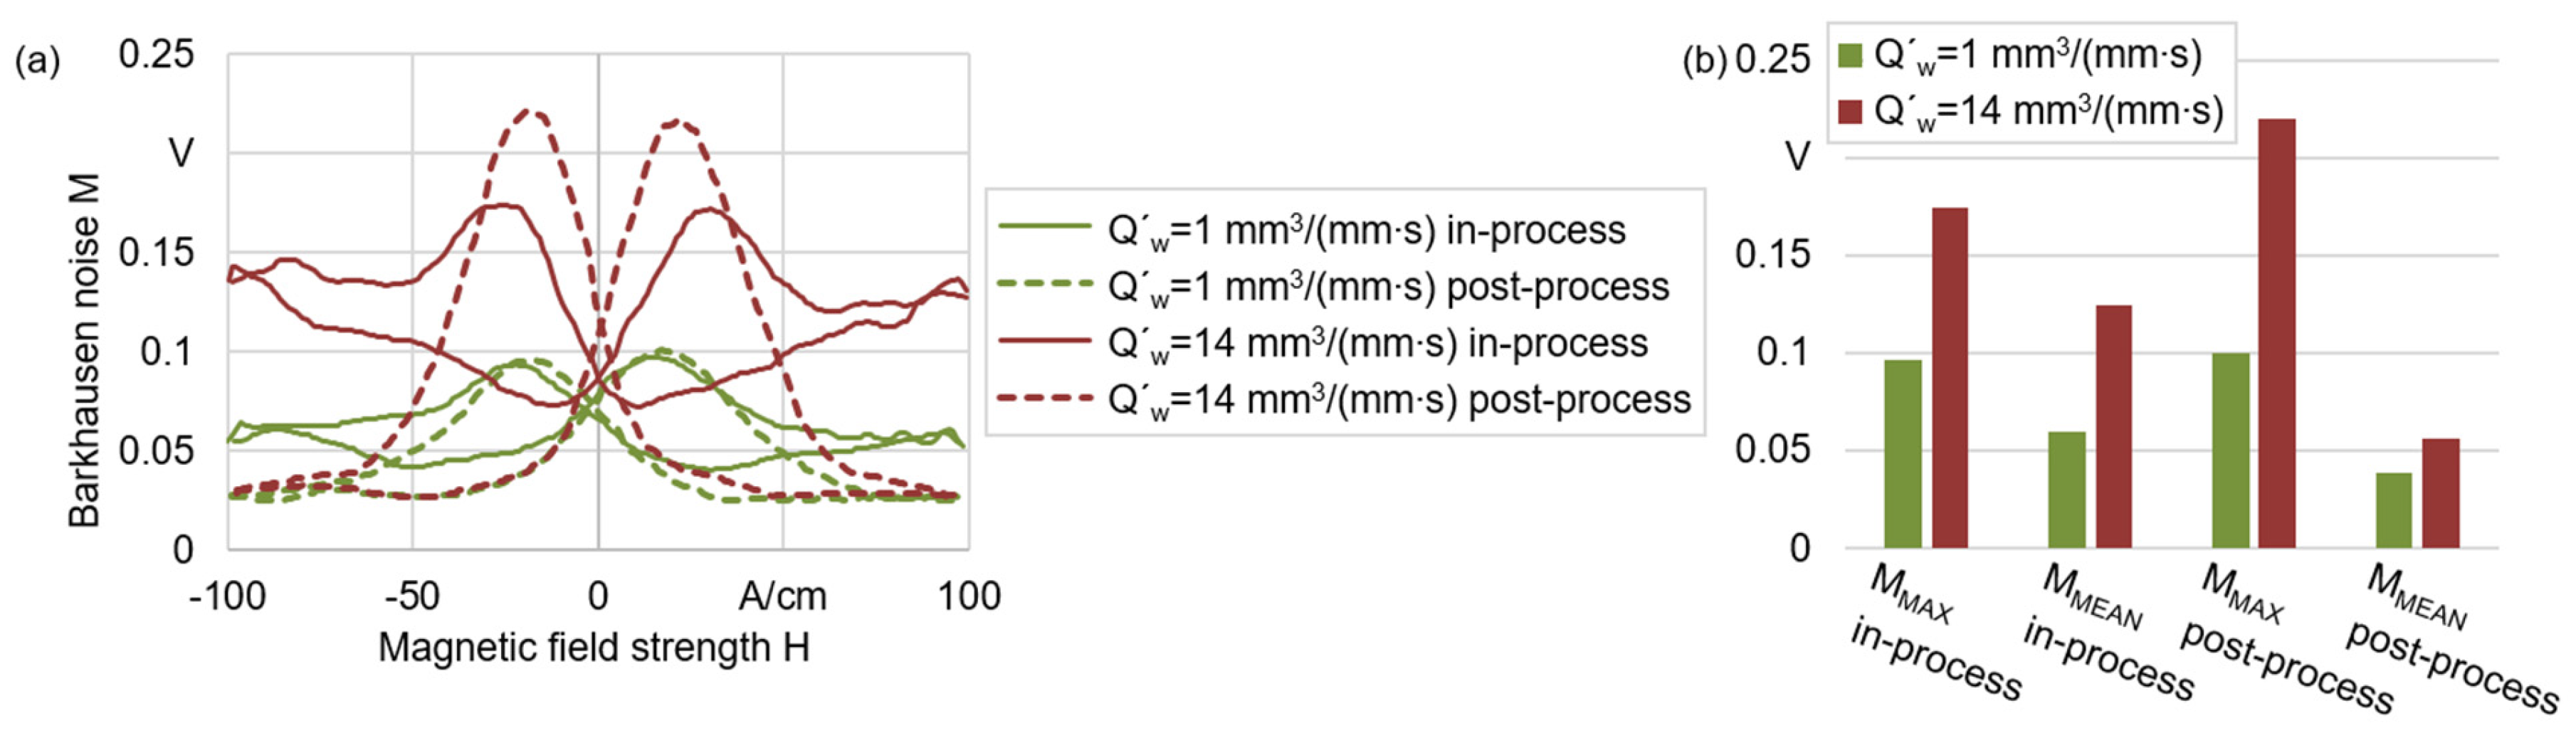
To understand the characteristics observed and described before, Figure 6a shows exemplarily some BN envelopes measured during and after grinding with different Q′w (directly before and after sparking out). The values MMAX and MMEAN derived from the envelopes are shown in the bar chart (b). For the condition ground with Q′w = 1 mm3/(mm∙s), peaks during and after grinding have the same height. This corresponds to Figure 2 and Figure 5. During grinding with Q′w = 14 mm3/(mm∙s), MMAX is around 0.17 V and increases to 0.22 V after sparking out. The reason for this change is not yet clear but might be an effect of worse contact, and a larger air gap between the sensor and the workpiece due to vibrations during grinding with high Q′w. As shown in [23], BN decreases with increasing distance between the sensor and the workpiece surface. Furthermore, it is noticeable that, during grinding, the BN in the saturation area (near ±100 A/cm) of the hysteresis curve increases. This effect is already visible at Q′w = 1 mm3/(mm∙s) but increases with higher Q′w. Reasonably, a superposition of the magnetization by a mechanical excitation, as described in [24], can be assumed. In [29], Theiner and Koblé described that the superposition of a magnetic excitation with a mechanical excitation of higher frequency especially increases the BN signal at higher and lower field strengths but not in the area of coercivity. This is explained by the different processes during magnetization. Near coercivity, a change in magnetization takes place due to shifts of the 180° Bloch walls [6] that are not magnetostrictive and therefore not affected by mechanical excitation [29].
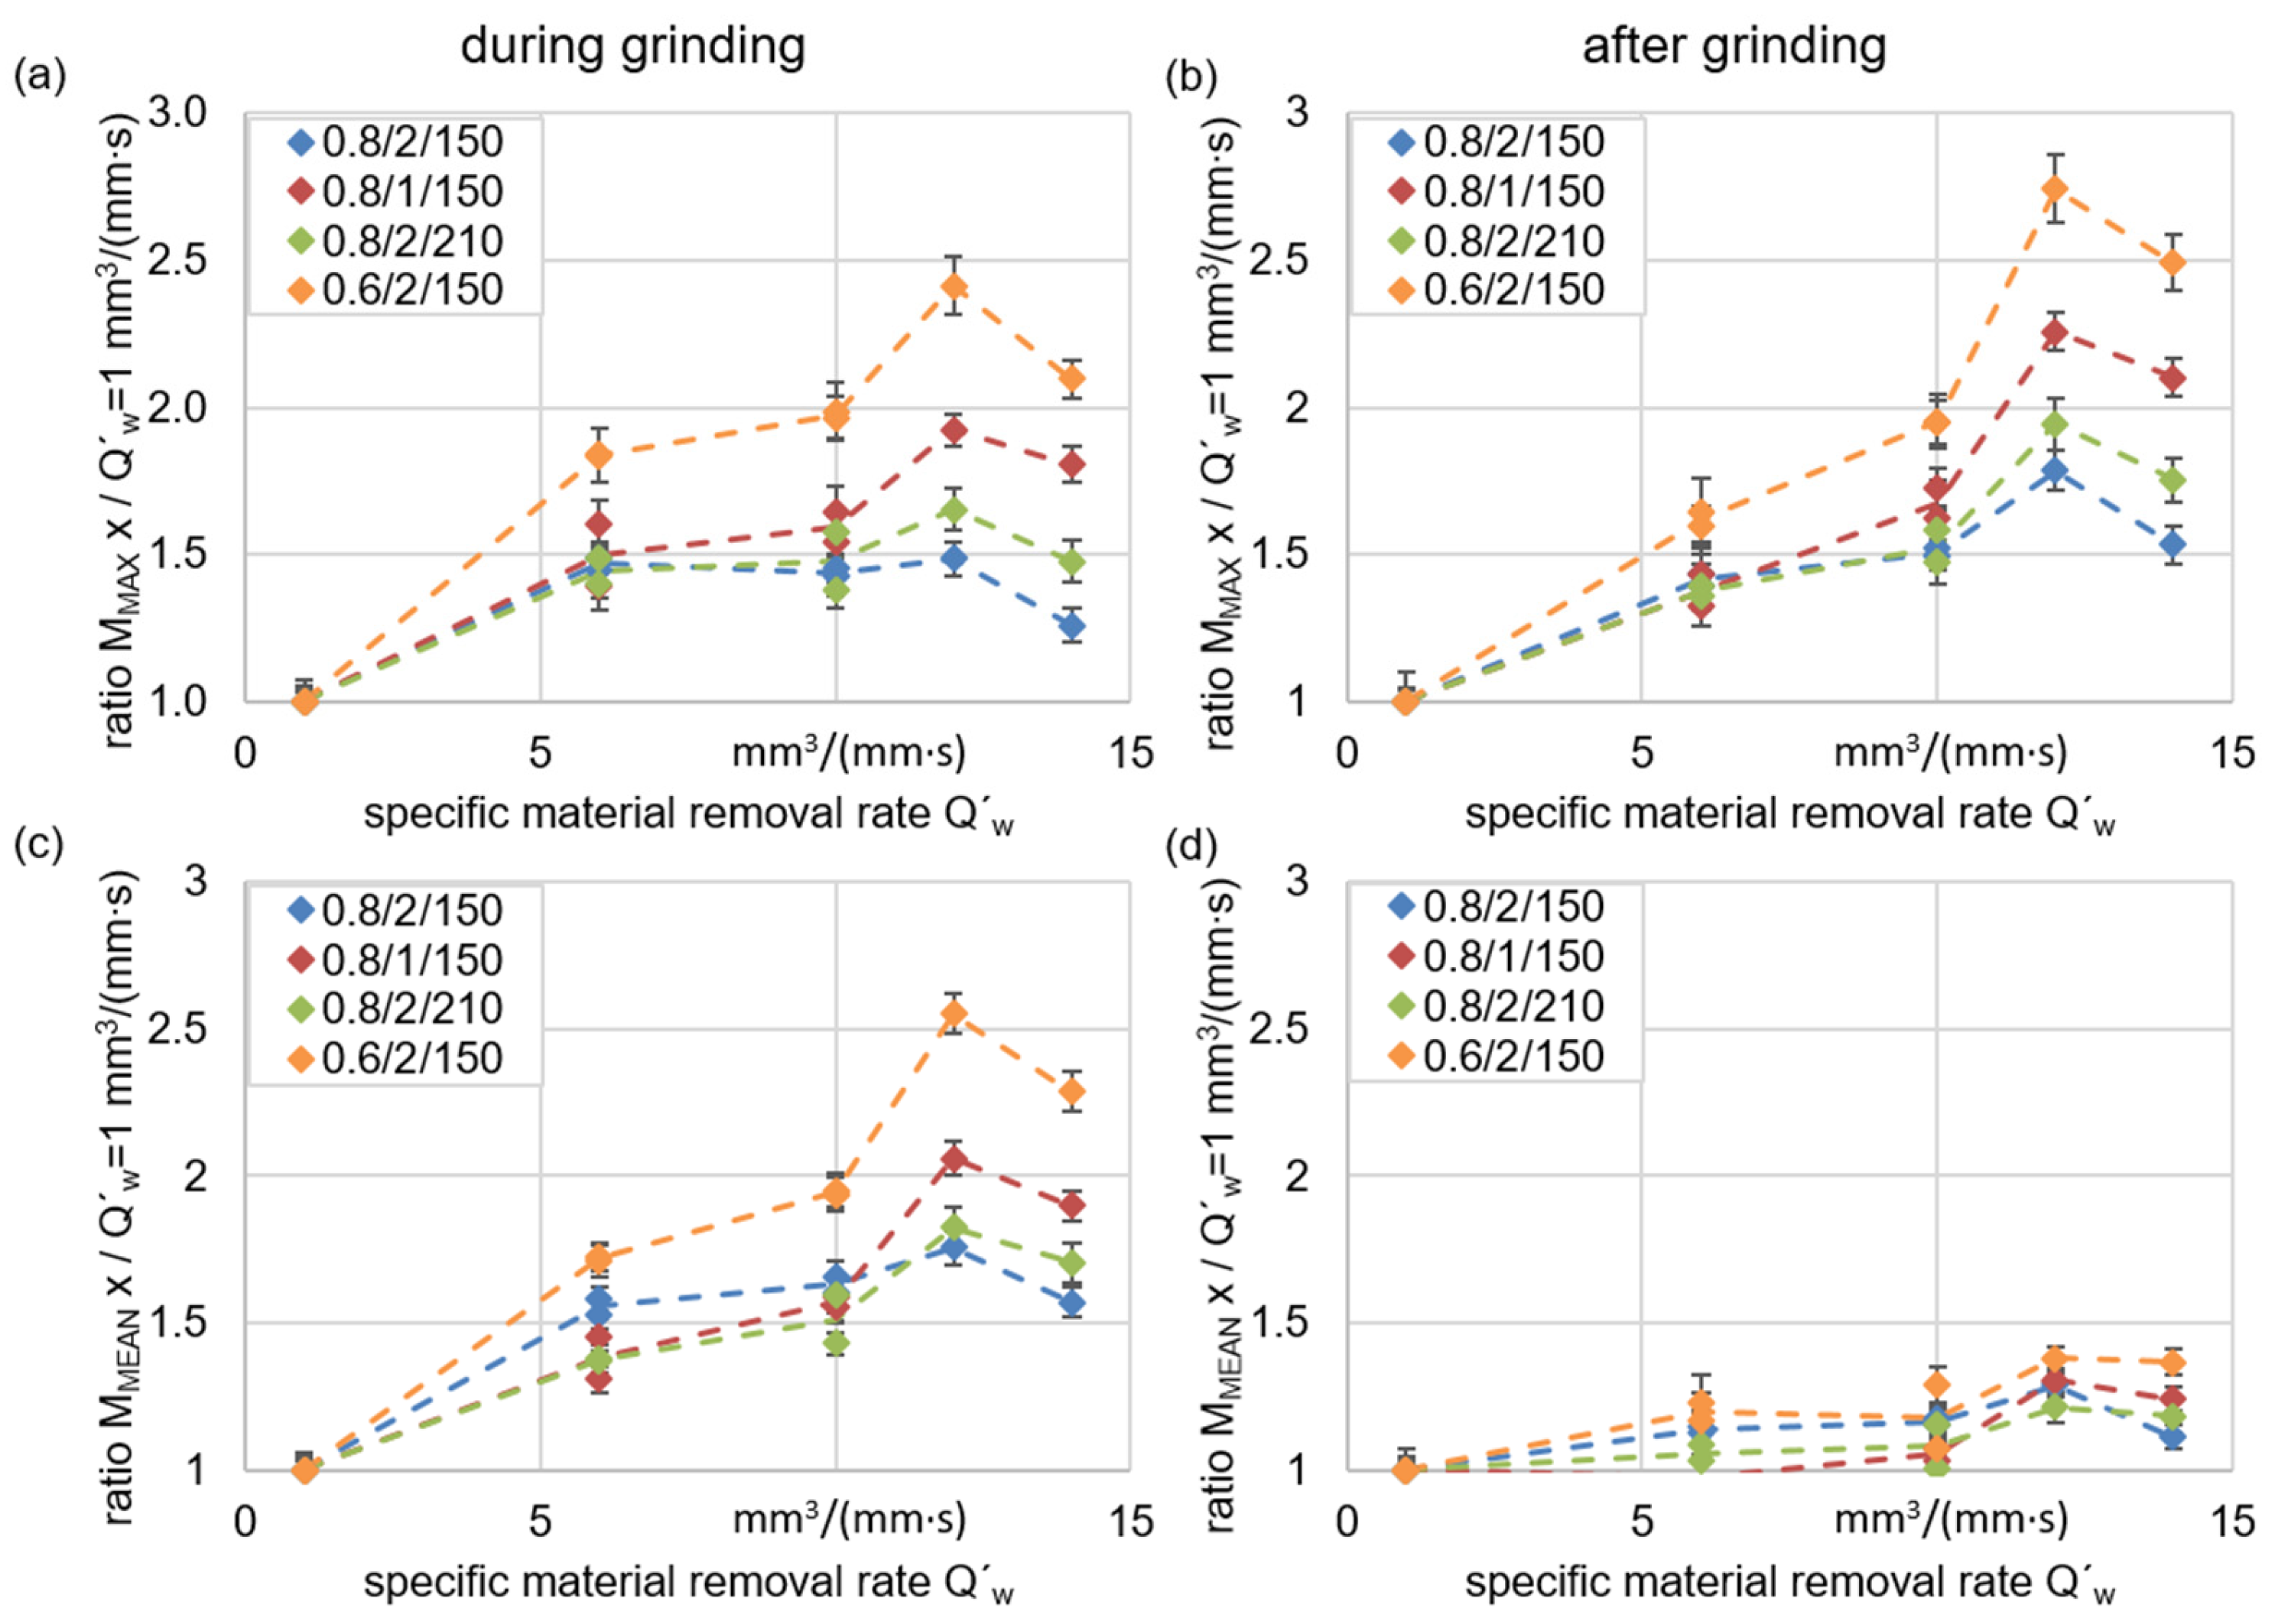
For a better comparison of the suitability for the detection of thermo-mechanical surface influences, Figure 7 shows the BN values MMAX and MMEAN as a ratio with the values measured with Q′w = 1 mm3/(mm∙s), which is defined as a damage-free reference. Ratios during (a and c) and after (b and d) grinding are plotted over Q′w for the four heat treatment states. MMEAN during grinding and MMAX allow for a clear distinction of the reference state from the other ground states. MMEAN after grinding shows a similar course, but the ratios are smaller. Even the heat treatment state 0.8/2/210 ground with Q′w = 6 mm3/(mm∙s) can be distinguished from the reference by BN signals. Since neither the micrograph nor the hardness indicate a tempering zone, this demonstrates again that the BN can already detect the initial changes in the residual stress state, which are visible in Figure 4. Slightly and very strong influenced surface states cannot be clearly distinguished. This problem is known from the literature and concerns in-process measurements as well as post-process measurements after grinding. Possibilities to still differentiate the states are mainly seen in multiparameter approaches or in the combination with process models, as described in [30]. Another point that affects both post-process and in-process measurements is the influence of the heat treatment states. For the evaluation of the measurement results, individual threshold values for the particular initial state are necessary.
Because of the large ratio of up to 2.5 between Q′w = 12 mm3/(mm∙s) and Q′w = 1 mm3/(mm∙s) and at least 1.3 between Q′w = 6 mm3/(mm∙s) and Q′w = 1 mm3/(mm∙s), MMEAN seems to be well suitable for the in-process detection of different thermo-mechanical surface states. Additionally the standard deviation is low, with a maximum of 0.08 compared with a maximum of 0.13 for MMAX. However, due to the mechanical excitation described before, it may be difficult to distinguish between the effects of grinding and the effects of the surface state influenced by grinding. This distinction will be part of future investigations. Some influences from grinding on the BN signal are described in [25]. Among others, this study indicates an influence of the workpiece rotation speed, which should be investigated without grinding as well. Despite the higher standard deviations, MMAX is suitable for the detection of thermo-mechanically influenced surface areas both during and after grinding. For very high Q′w, it should be mentioned that the in-process measured values might be lower than after grinding (see Figure 7a,b), which is probably an effect of the larger air gap between the sensor and the workpiece surface.
4. Conclusions
The investigations have shown the suitability of in-process BN measurements for the detection of thermo-mechanical impact on surface integrity during grinding of case hardened steel. Detectability was demonstrated based on surface states from initial residual stress changes to strong tempering zones on workpieces with different initial states. Similar to commonly used post-process BN measurements, maximum (MMAX) as well as averaged (MMEAN) BN amplitude increase with initial thermo-mechanical influences and decrease with stronger tempering. Differences in the behavior of MMAX and MMEAN during in-process measurements were explained by mechanical excitation that does not affect the area around coercivity field strength. Both values show a high sensitivity for tempering and changes in the residual stress state, and comparatively low standard deviations. Further investigations are required on the influences from grinding itself on BN signals (especially MMEAN), which can overlap the influences from the generated surface area state. Despite this need for further research, the results show the possibility of grinding process monitoring or control using Barkhausen noise, for example in combination with process models. Thus far, limit values for the detection of surface changes cannot be defined universally but have to be determined for individual applications.
Author Contributions
Conceptualization, formal analysis, writing—original draft preparation and visualization, R.J.; investigation, R.J. and J.H.; writing—review and editing, J.H. and J.E.; supervision and project administration, B.K. and J.E. All authors have read and agreed to the published version of the manuscript.
Funding
This research was funded by the German Research Foundation (DFG), grant number 401804277.
Acknowledgments
This scientific work was supported by the German Research Foundation (DFG) within the research priority program SPP 2086 for projects EP128/3-2 and KA1006/28-2. The authors thank the DFG for this funding and intensive technical support.
Conflicts of Interest
The authors declare no conflict of interests.
References
- Karpuschewski, B.; Bleicher, O.; Beutner, M. Surface Integrity Inspection on Gears Using Barkhausen Noise Analysis. Procedia Eng. 2011, 19, 162–171. [Google Scholar] [CrossRef] [Green Version]
- ISO 14104; Gears—Surface Temper Etch Inspection after Grinding, Chemical Method. International Organization for Standardization: Geneva, Switzerland, 2014.
- Altpeter, I.; Boller, C.; Kopp, M.; Wolter, B.; Fernath, R.; Hirninger, B.; Werner, S. Zerstörungsfreie Detektion von Schleifbrand mittels elektromagnetischer Prüftechniken. In Proceedings of the DGZfP-Jahrestagung 2011, Bremen, Germany, 30 May–1 June 2011. [Google Scholar]
- Theiner, W.A. Micromagnetic techniques. In Structural and Residual Stress Analysis by Nondestructive Methods; Hauk, V., Ed.; Elsevier Science B.V.: Amsterdam, The Netherlands, 1997. [Google Scholar]
- Cullity, B.D.; Graham, C.D. Introduction to Magnetic Materials, 3rd ed.; Wiley: Hoboken, NJ, USA, 2008. [Google Scholar]
- Träuble, H. Magnetisierungskurve der Ferromagnetika II. Magnetisierungskurve und magnetische Hysterese ferromagnetischer Einkristalle. In Moderne Probleme der Metallphysik; Seeger, A., Ed.; Springer: Berlin/Heidelberg, Germany; New York, NY, USA, 1966; Volume 2. [Google Scholar]
- Barkhausen, H.G. Zwei mit Hilfe der neuen Verstärker entdeckte Erscheinungen. Phys. Z. 1919, 20, 401–403. [Google Scholar]
- Altpeter, I.; Tschuncky, R.; Szielasko, K. Electromagnetic techniques for materials characterization. In Materials Characterization Using Nondestructive Evaluation (NDE) Methods; Hübschen, G., Altpeter, I., Tschuncky, R., Hermann, H.-G., Eds.; Woodhead Publishing: Sawston, UK, 2016; pp. 225–262. [Google Scholar]
- Send, S.; Dapprich, D.; Thomas, J.; Suominen, L. Non-destructive Case Depth Determination by Means of Low-Frequency Barkhausen Noise Measurements. J. Nondestruct. Eval. 2018, 37, 82. [Google Scholar] [CrossRef]
- Wang, P.; Ji, X.; Zhu, L.; Tian, G.; Yao, E. Stratified analysis of the magnetic Barkhausen noise signal based on wavelet decomposition and back propagation neural network. Sens. Actuators A 2013, 201, 421–427. [Google Scholar] [CrossRef]
- Miesowicz, K.; Staszewski, W.J.; Korbiel, T. Analysis of Barkhausen noise using wavelet-based fractal signal processing for fatigue crack detection. Int. J. Fatigue 2016, 83, 109–116. [Google Scholar] [CrossRef]
- Nikula, R.-P.; Sorsa, A.; Santa-aho, S.; Vippola, M.; Leiviskä, K. Modelling of Material Properties Using Frequency Domain Information from Barkhausen Noise Signal. IFAC-PapersOnLine 2015, 48, 201–206. [Google Scholar] [CrossRef]
- Vashista, M.; Moorthy, V. Influence of applied magnetic field strength and frequency response of pick-up coil on the magnetic barkhausen noise profile. J. Magn. Magn. Mater. 2013, 345, 208–214. [Google Scholar] [CrossRef] [Green Version]
- Blažek, D.; Neslušan, M.; Mičica, M.; Pištora, J. Extraction of Barkhausen noise from the measured raw signal in high-frequency regimes. Measurement 2016, 94, 456–463. [Google Scholar] [CrossRef]
- Jedamski, R.; Sackmann, D. Sichere Schädigungsdetektion von Randzonenschädigungen Mithilfe von Zerstörungsfreien Mikromagnetischen Prüfverfahren II; Abschlussbericht 1377; Forschungsvereinigung Antriebstechnik e.V.: Frankfurt, Germany, 2020. [Google Scholar]
- Gorgels, C.; Schröder, T. Untersuchung zur Schleifbarkeit Unterschiedliche Wärmebehandelter Einsatzstähle für die Zahnradfertigung; Abschlussbericht 841; Forschungsvereinigung Antriebstechnik e.V.: Frankfurt, Germany, 2008. [Google Scholar]
- Sridharan, U.; Bedekar, V.; Kolarits, F.M. A functional approach to integrating grinding temperature modeling and Barkhausen noise analysis for prediction of surface integrity in bearing steels. CIRP Ann. 2017, 66, 333–336. [Google Scholar] [CrossRef]
- Sackmann, D.; Karpuschewski, B.; Epp, J.; Jedamski, R. Detection of surface damages in ground spur gears by non-destructive micromagnetic methods. Forsch. Ing. 2019, 83, 563–570. [Google Scholar] [CrossRef]
- Thiemann, P.; Ströbel, G. Mikromagnetische und photothermische Charakterisierung thermo-mechanischer Schädigungen. Tech. Mess. 2013, 80, 206–212. [Google Scholar] [CrossRef]
- Karpuschewski, B. Mikromagnetische Randzonenanalyse Geschliffener Einsatzgehärteter Bauteile. Ph.D. Thesis, Universität Hannover, Hannover, Germany, 1995. [Google Scholar]
- Tönshoff, H.K.; Karpuschewski, B.; Regent, C. Process monitoring in grinding using micromagnetic techniques. Int. J. Adv. Manuf. Technol. 1999, 15, 694–698. [Google Scholar] [CrossRef]
- Jedamski, R.; Heinzel, J.; Rößler, M.; Epp, J.; Eckebrecht, J.; Gentzen, J.; Putz, M.; Karpuschewski, B. Potential of magnetic Barkhausen noise analysis for in-process monitoring of surface layer properties of steel components in grinding. Tech. Mess. 2020, 87, 787–798. [Google Scholar] [CrossRef]
- Heinzel, J.; Jedamski, R.; Epp, J.; Karpuschewski, B. In-process measurement of Barkhausen noise and resulting productivity increase potential in grinding of case hardened steel. CIRP J. Manuf. Sci. 2020, 32, 37–45. [Google Scholar] [CrossRef]
- Gentzen, J.; Fritzsch, E.; Hochmuth, C.; Dobrenko, R.; Dapprich, D. Verfahren und Vorrichtung zur und Bewertung der Thermischen Randzoneneigenschaften Während der Bearbeitung an einer Oberfläche eines Mittels Schleifen Bearbeiteten Werkstücks. Patent DE 10 2016 224 683 A1, 14 June 2018. [Google Scholar]
- Rößler, M.; Putz, M.; Hochmuth, C.; Gentzen, J. In-process evaluation of the grinding process using a new Barkhausen noise method. Proc. CIRP 2020, 99, 202–207. [Google Scholar] [CrossRef]
- Soultan, M.; Kleber, X.; Chicois, J.; Vincent, A. Mechanical Barkhausen noise during fatigue of iron. NDT E Int. 2006, 39, 493–498. [Google Scholar] [CrossRef]
- Hamfeldt, J.; Gustafsson, J.; van Deventer, J.; Löfquist, T.; Häggström, F.; Delsing, J. A passive Barkhausen noise sensor for low-power applications. In Proceedings of the 2016 IEEE International Instrumentation and Measurement Technology Conference Proceedings, Taipei, Taiwan, 23–26 May 2016. [Google Scholar]
- Ekreem, N.B.; Olabi, A.G.; Prescott, T.; Rafferty, A.; Hashmi, M.S.J. An overview of magnetostriction, its use and methods to measure these properties. J. Mater. Process. Technol. 2007, 191, 96–101. [Google Scholar] [CrossRef]
- Theiner, W.A.; Koblé, T.-D. Verfahren zur Zerstörungsfreien Werkstoffprüfung. Patent DE 000004343225A1, 7 July 1994. [Google Scholar]
- Guba, N.; Heinzel, J.; Heinzel, C.; Karpuschewski, B. Grinding burn limits: Generation of surface layer modification charts for discontinuous profile grinding with analogy trials. CIRP Manuf. 2020, 31, 99–107. [Google Scholar] [CrossRef]
Figure 1.
Schematic view of the hysteresis loop (a) and the envelope of the BN with characteristic values (b).
Figure 1.
Schematic view of the hysteresis loop (a) and the envelope of the BN with characteristic values (b).

Figure 2.
Maximum BN amplitude MMAX (a) and averaged BN MMEAN (b) during grinding processes with different specific material removal rates Q′w on a workpiece of the heat treatment state 0.8/1/150.
Figure 2.
Maximum BN amplitude MMAX (a) and averaged BN MMEAN (b) during grinding processes with different specific material removal rates Q′w on a workpiece of the heat treatment state 0.8/1/150.

Figure 3.
Micrographs and surface hardness of the ground workpieces with different heat treatment states and specific material removal rates.
Figure 3.
Micrographs and surface hardness of the ground workpieces with different heat treatment states and specific material removal rates.

Figure 4.
Depth profiles of the tangential residual stresses after grinding of heat treatment states 0.8/1/150 (a) and 0.8/2/210 (b).
Figure 4.
Depth profiles of the tangential residual stresses after grinding of heat treatment states 0.8/1/150 (a) and 0.8/2/210 (b).

Figure 5.
Characteristic values of the BN during (a,b) and after (c,d) grinding with different specific material removal rates (heat treatment state 0.8/1/150).
Figure 5.
Characteristic values of the BN during (a,b) and after (c,d) grinding with different specific material removal rates (heat treatment state 0.8/1/150).

Figure 6.
Envelope of the BN during grinding (full lines) and after spark-out (dashed lines) for different specific material removal rates (a) and values of MMEAN and MMAX (b).
Figure 6.
Envelope of the BN during grinding (full lines) and after spark-out (dashed lines) for different specific material removal rates (a) and values of MMEAN and MMAX (b).

Figure 7.
Ratio of BN values MMAX (a,b) and MMEAN (c,d) during and after grinding with different specific material removal rates and Q′w = 1 mm3/(mm∙s).
Figure 7.
Ratio of BN values MMAX (a,b) and MMEAN (c,d) during and after grinding with different specific material removal rates and Q′w = 1 mm3/(mm∙s).


Table 1.
Heat treatment states before grinding.
| Target Values | Surface Carbon Content | CHD550 | Surface Hardness | Surface Oxidation Depth |
|---|---|---|---|---|
| 0.8/2/150 | 0.83 wt.% | 1.91 mm | 702 ± 8 HV1 | 14.1 µm |
| 0.8/1/150 | 0.83 wt.% | 1.00 mm | 723 ± 10 HV1 | 9.8 µm |
| 0.8/2/210 | 0.84 wt.% | 1.76 mm | 665 ± 7 HV1 | 15.8 µm |
| 0.6/2/150 | 0.65 wt.% | 1.89 mm | 696 ± 20 HV1 | 12.5 µm |
Table 2.
Grinding parameters.
| vc | 35 m/s |
| q | 90 |
| vfr | 0.28/1.69/2.82/3.38/3.95 mm/min |
| Q′w | 1/6/10/12/14 mm3/(mm∙s) |
| QMWF | 40 L/min |
| Ud | 3 |
| qd | −1 |
Publisher’s Note: MDPI stays neutral with regard to jurisdictional claims in published maps and institutional affiliations. |
© 2022 by the authors. Licensee MDPI, Basel, Switzerland. This article is an open access article distributed under the terms and conditions of the Creative Commons Attribution (CC BY) license (https://creativecommons.org/licenses/by/4.0/).
Share and Cite
MDPI and ACS Style
Jedamski, R.; Heinzel, J.; Karpuschewski, B.; Epp, J. In-Process Measurement of Barkhausen Noise for Detection of Surface Integrity during Grinding. Appl. Sci. 2022, 12, 4671. https://0-doi-org.brum.beds.ac.uk/10.3390/app12094671
AMA Style
Jedamski R, Heinzel J, Karpuschewski B, Epp J. In-Process Measurement of Barkhausen Noise for Detection of Surface Integrity during Grinding. Applied Sciences. 2022; 12(9):4671. https://0-doi-org.brum.beds.ac.uk/10.3390/app12094671
Chicago/Turabian StyleJedamski, Rahel, Jonas Heinzel, Bernhard Karpuschewski, and Jérémy Epp. 2022. "In-Process Measurement of Barkhausen Noise for Detection of Surface Integrity during Grinding" Applied Sciences 12, no. 9: 4671. https://0-doi-org.brum.beds.ac.uk/10.3390/app12094671
Note that from the first issue of 2016, this journal uses article numbers instead of page numbers. See further details here.