

A Comparison of Machine Learning Approaches for Predicting Employee Attrition

1
Department of Informatics, Technical University of Munich, 85748 Munich, Germany
2
Dipartimento di Ingegneria dell’Informazione e Scienze Matematiche (DIISM), Universitá di Siena, 53100 Siena, Italy
*
Author to whom correspondence should be addressed.
Appl. Sci. 2023, 13(1), 267; https://0-doi-org.brum.beds.ac.uk/10.3390/app13010267
Submission received: 30 November 2022
/
Revised: 16 December 2022
/
Accepted: 19 December 2022
/
Published: 26 December 2022
(This article belongs to the Special Issue Emerging Trends in Data Science and AI)
Abstract
:Employee attrition is a major problem that causes many companies to incur in significant costs to find and hire new personnel. The use of machine learning and artificial intelligence methods to predict the likelihood of resignation of an employee, and the quitting causes, can provide HR departments with a valuable decision support system and, as a result, prevent a large waste of time and resources. In this paper, we propose a preliminary exploratory analysis of the application of machine learning methodologies for employee attrition prediction. We compared several classification models with the goal of finding the one that not only performs best, but is also well interpretable, in order to provide companies with the possibility of improving those aspects that have been shown to produce the quitting of their employees. Among the proposed methods, Logistic Regression performs the best, with an accuracy of 88% and an AUC-ROC of 85%.
1. Introduction
Employees play a crucial role within each company, whether small businesses or large IT companies. The process of recruiting a candidate is often composed of a series of steps designed to optimize the candidate’s choice. However, the steps used during the interview process do not guarantee the success of the choice made. Interviews can be affected by candidates stress levels, misunderstandings during the review process, and other unknown human-related variables. For these reasons, it is not unusual for employees to find themselves in conflict with the company that hired them. A 2016 Society for Human Resource Management report [1] estimated to be over $4000 the average hiring expenses per employee, resulting in an average annual turnover rate of 19%. These statistics provide insights for what concerns the importance of the recruitment process and retention of the right employees within the company. Indeed, reducing the chance of attrition has the dual benefit of improving a company’s performance and an employee’s lifestyle. This motivates the necessary employment of data-driven decision support systems as a crucial factor in the company’s structured growth. However, in a critical context such as that of human resources, it is also important to analyze the reasons why employees quit. This analysis, which is only possible when using methods whose decisions are interpretable, allows companies to improve the recruiting process and to take timely action if the need arises. A few papers in the literature address this research problem [2]. In [3] the authors analyze variables that could be related to industry employee dropout and turnover, but without the use of machine learning (ML) approaches. In [4] the authors use a classification model approach to analyze a set of 309 records from colleges in Nigeria between 1978 and 2006. In [5] the authors employ data collected from two databases in the United States and used a variety of ML approaches to explore possible causes of employee dropouts. In [6] the authors used publicly available data from the Office of personnel Management, the Bureau of Labor Statistics and IBM. In this way the authors identify a number of statistically significant factors that relate to the decision of an employee to quit. A variety of machine learning approaches are used for this purpose, starting with Principal Component Analysis (PCA), k-NN, Random Forests (RF), and Logistic Regression (LR). Eventually in [7,8] the authors propose an analysis of the same dataset we examine in our paper, i.e., of the IBM HR Analysis Employee Attrition dataset [9]. Our work differs from the latter as it also includes an analysis of the interpretability of the selected models, and introduces the use of an ensemble model. We argue that it is of utmost importance to consider not only the performance of a machine learning model, but also its interpretability properties. Indeed, especially in a critical context such as human resources, it is critical to be able to understand the reasons why employees quit and to make appropriate decisions based on those reasons. Our contributions are the following: (i) we perform an exploratory analysis of the dataset and highlighted the possible causes of employee attrition within a company; (ii) we employ a set of different machine learning models for predicting employee attrition and report the results of our evaluation in terms of performance and interpretability. The paper is structured as follows: in Section 2 we describe the ML approaches used in our analysis; in Section 3 we present data exploration analysis and the results of our experiments; in Section 5 we summarize findings and propose future perspectives of our work.
2. Methods and Dataset
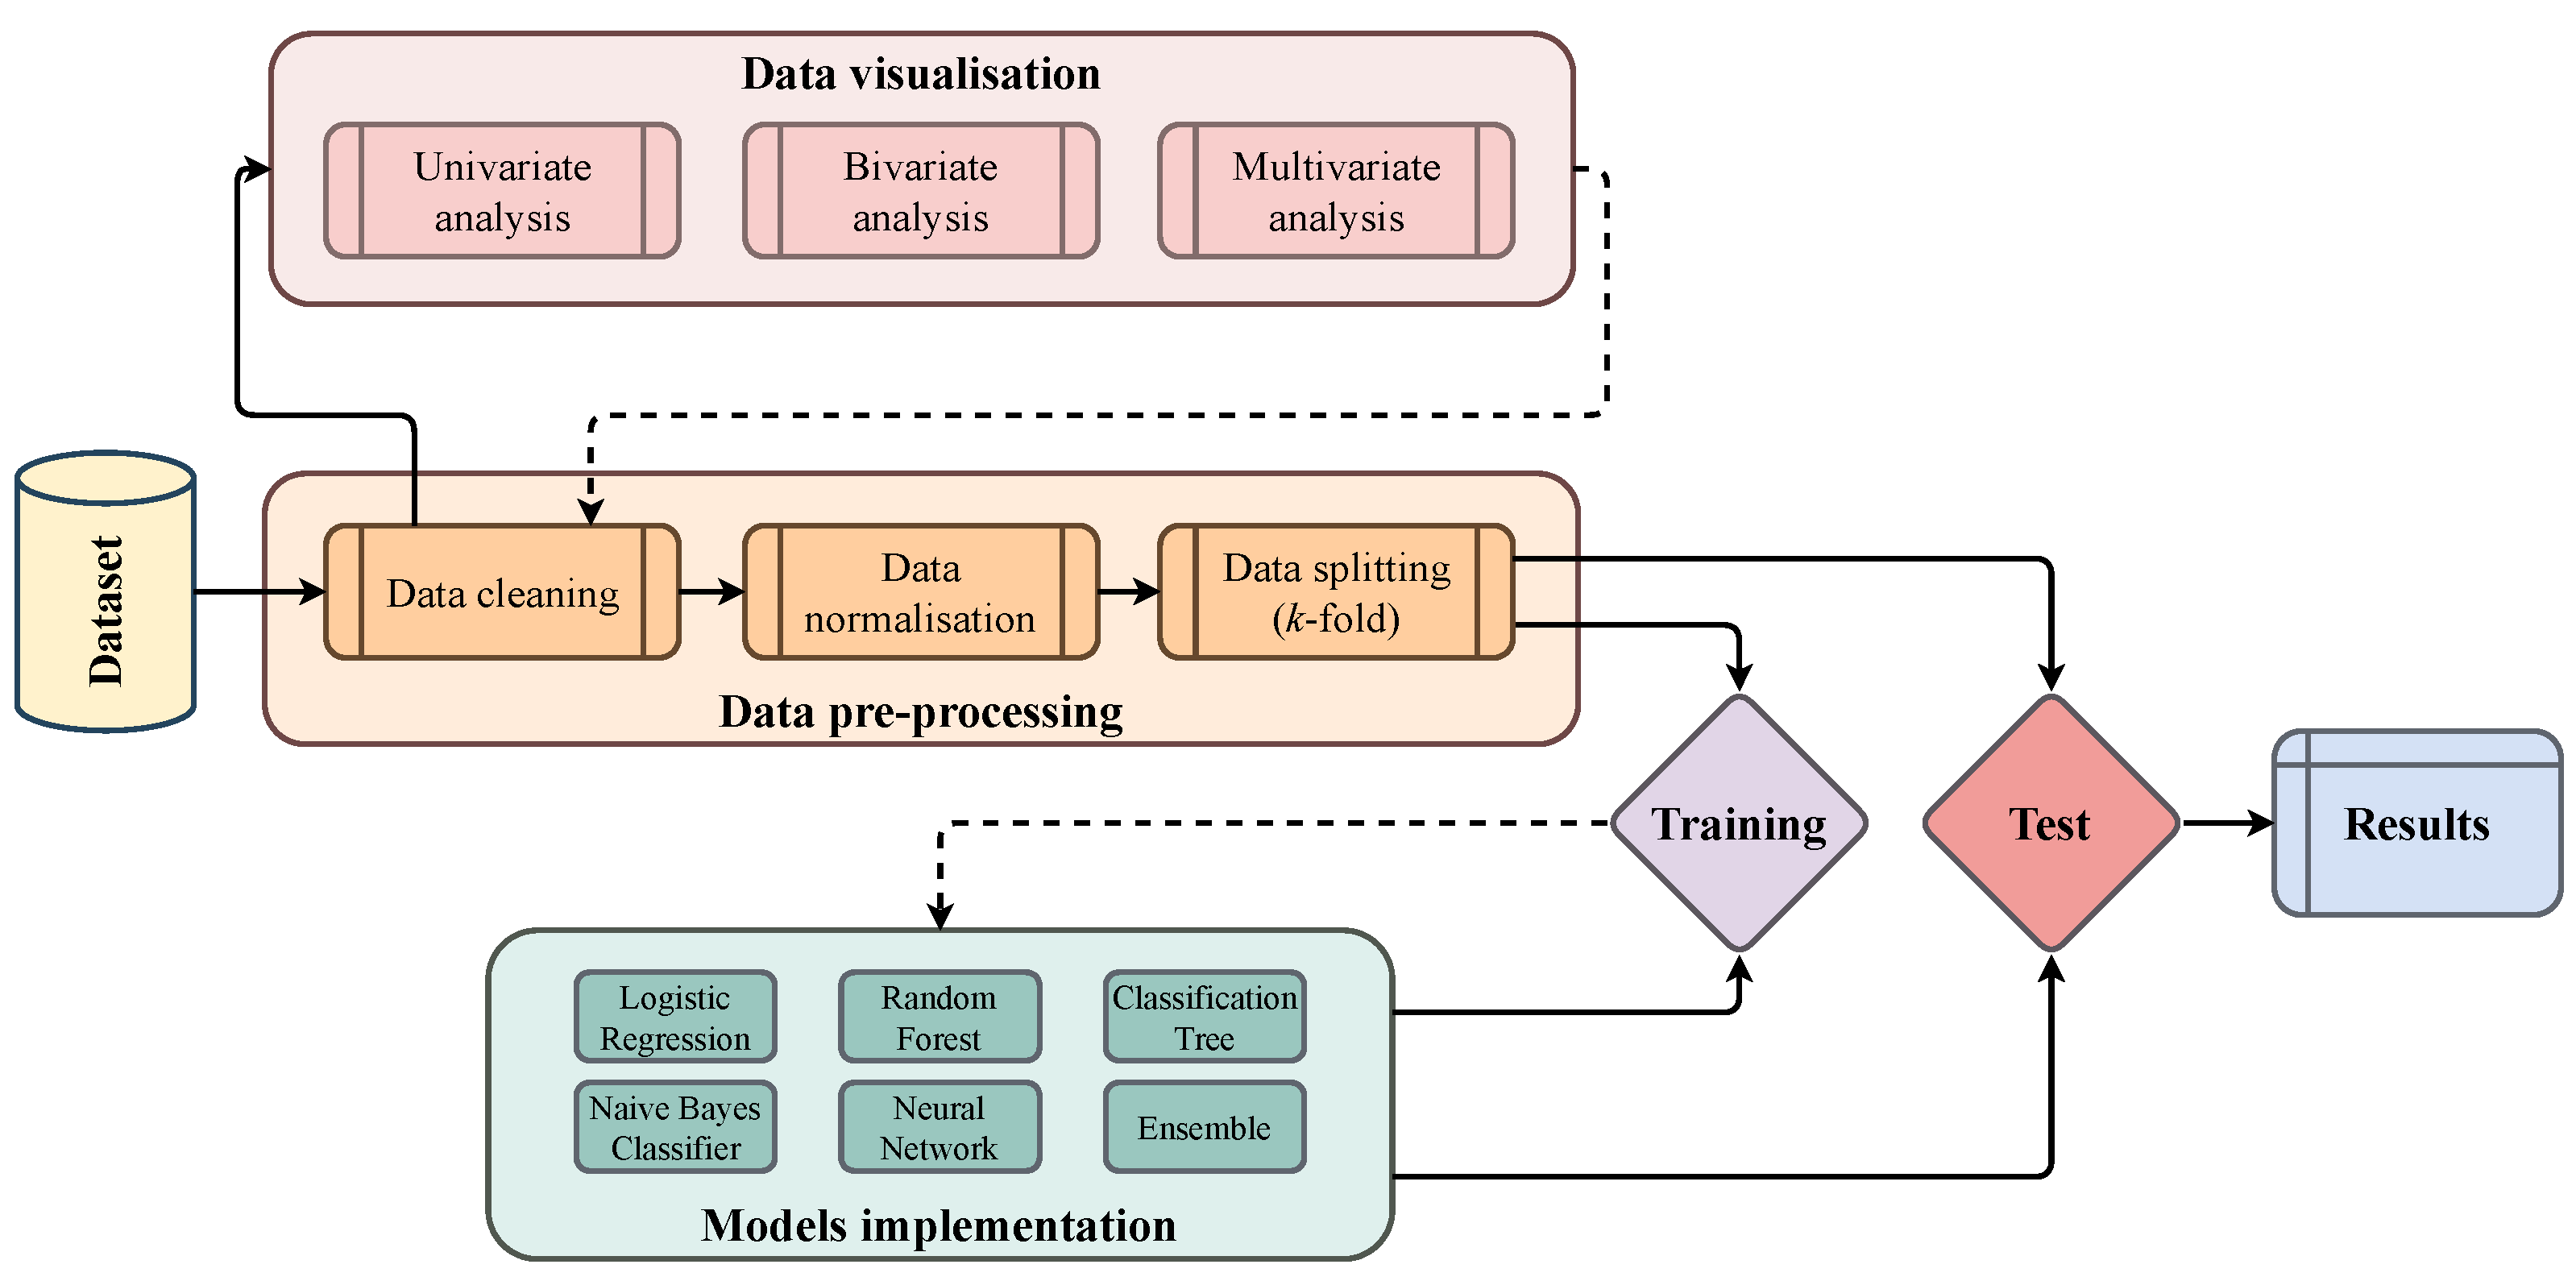
Machine Learning (ML) has reached state of the art performances in many research fields nowadays, from computer vision to bioinformatics, from natural language processing to object detection [10,11,12,13,14]. In our work we use a set of five well known and robust supervised machine learning methods to analyze employee attrition [15]: logistic regression (LR) [16], classification trees (CT) [17], random forest (RF) [18], naive Bayes classifier (NB) [19] and a simple Neural Network (NN) architecture [10]. We also analyze the performance of a voting ensemble model [20] that averages the results of the proposed ones. The choice of such algorithms was guided by the fact that the objective of this paper was not to propose a new approach, but to show successful applications of machine learning for employee attrition prediction. Therefore we relied on algorithms widely tested and implemented in several different contexts, which could provide a solid experimental backbone for our work. LR is an extension of linear regression for dealing with binary classification problems. More specifically, the LR model states that the posterior probability follows a logistic function, where x is the vector describing the generic observation and y represents the predicted output label. CT is one of the most widely used machine learning method because of its ease of use, computational speed, robustness to outliers and, most importantly, explainability of results. The construction of the tree is the training phase of the method, and is based on recursively splitting the set of observations into subsets until a stopping criterion is reached. RF is an improvement of the bagging technique for classification trees and have been proved to be extremely successful in several tasks. Similarly to CT, RF allows for the interpretability of the results, but it also yields better performance. The NB classifier is a probabilistic classification model based on the Bayes’ Theorem, that explicitly computes the posterior probability that an observation belongs to a specific target class exploiting the prior probability and the class conditional probability . NN have been proved to be among the most powerful and versatile machine learning approaches [10]. In our paper we provide the implementation of a simple 2-layer multilayer perceptron (MLP) and compare the performances to the other ML methods proposed. Finally we also test voting ensemble methods, that combine the predictions of several base estimators in order to improve generalization capabilities and robustness over a single estimator. The predictions of our voting ensemble model are the majority vote of contributing models. For what concerns the dataset our work is based on the analysis of the IBM HR Analysis Employee Attrition dataset, publicly available from [9]. A summary of the overall experimental workflow is reported in Figure 1. Such types of analysis pipelines are included in approaches within the idea of the CRISP-DM Cross Industry Standard Process for Data Mining [21,22,23]. Code is available at: https://github.com/filippoguerranti/employee_attrition (accessed on 24 December 2022).
3. Experiments and Results
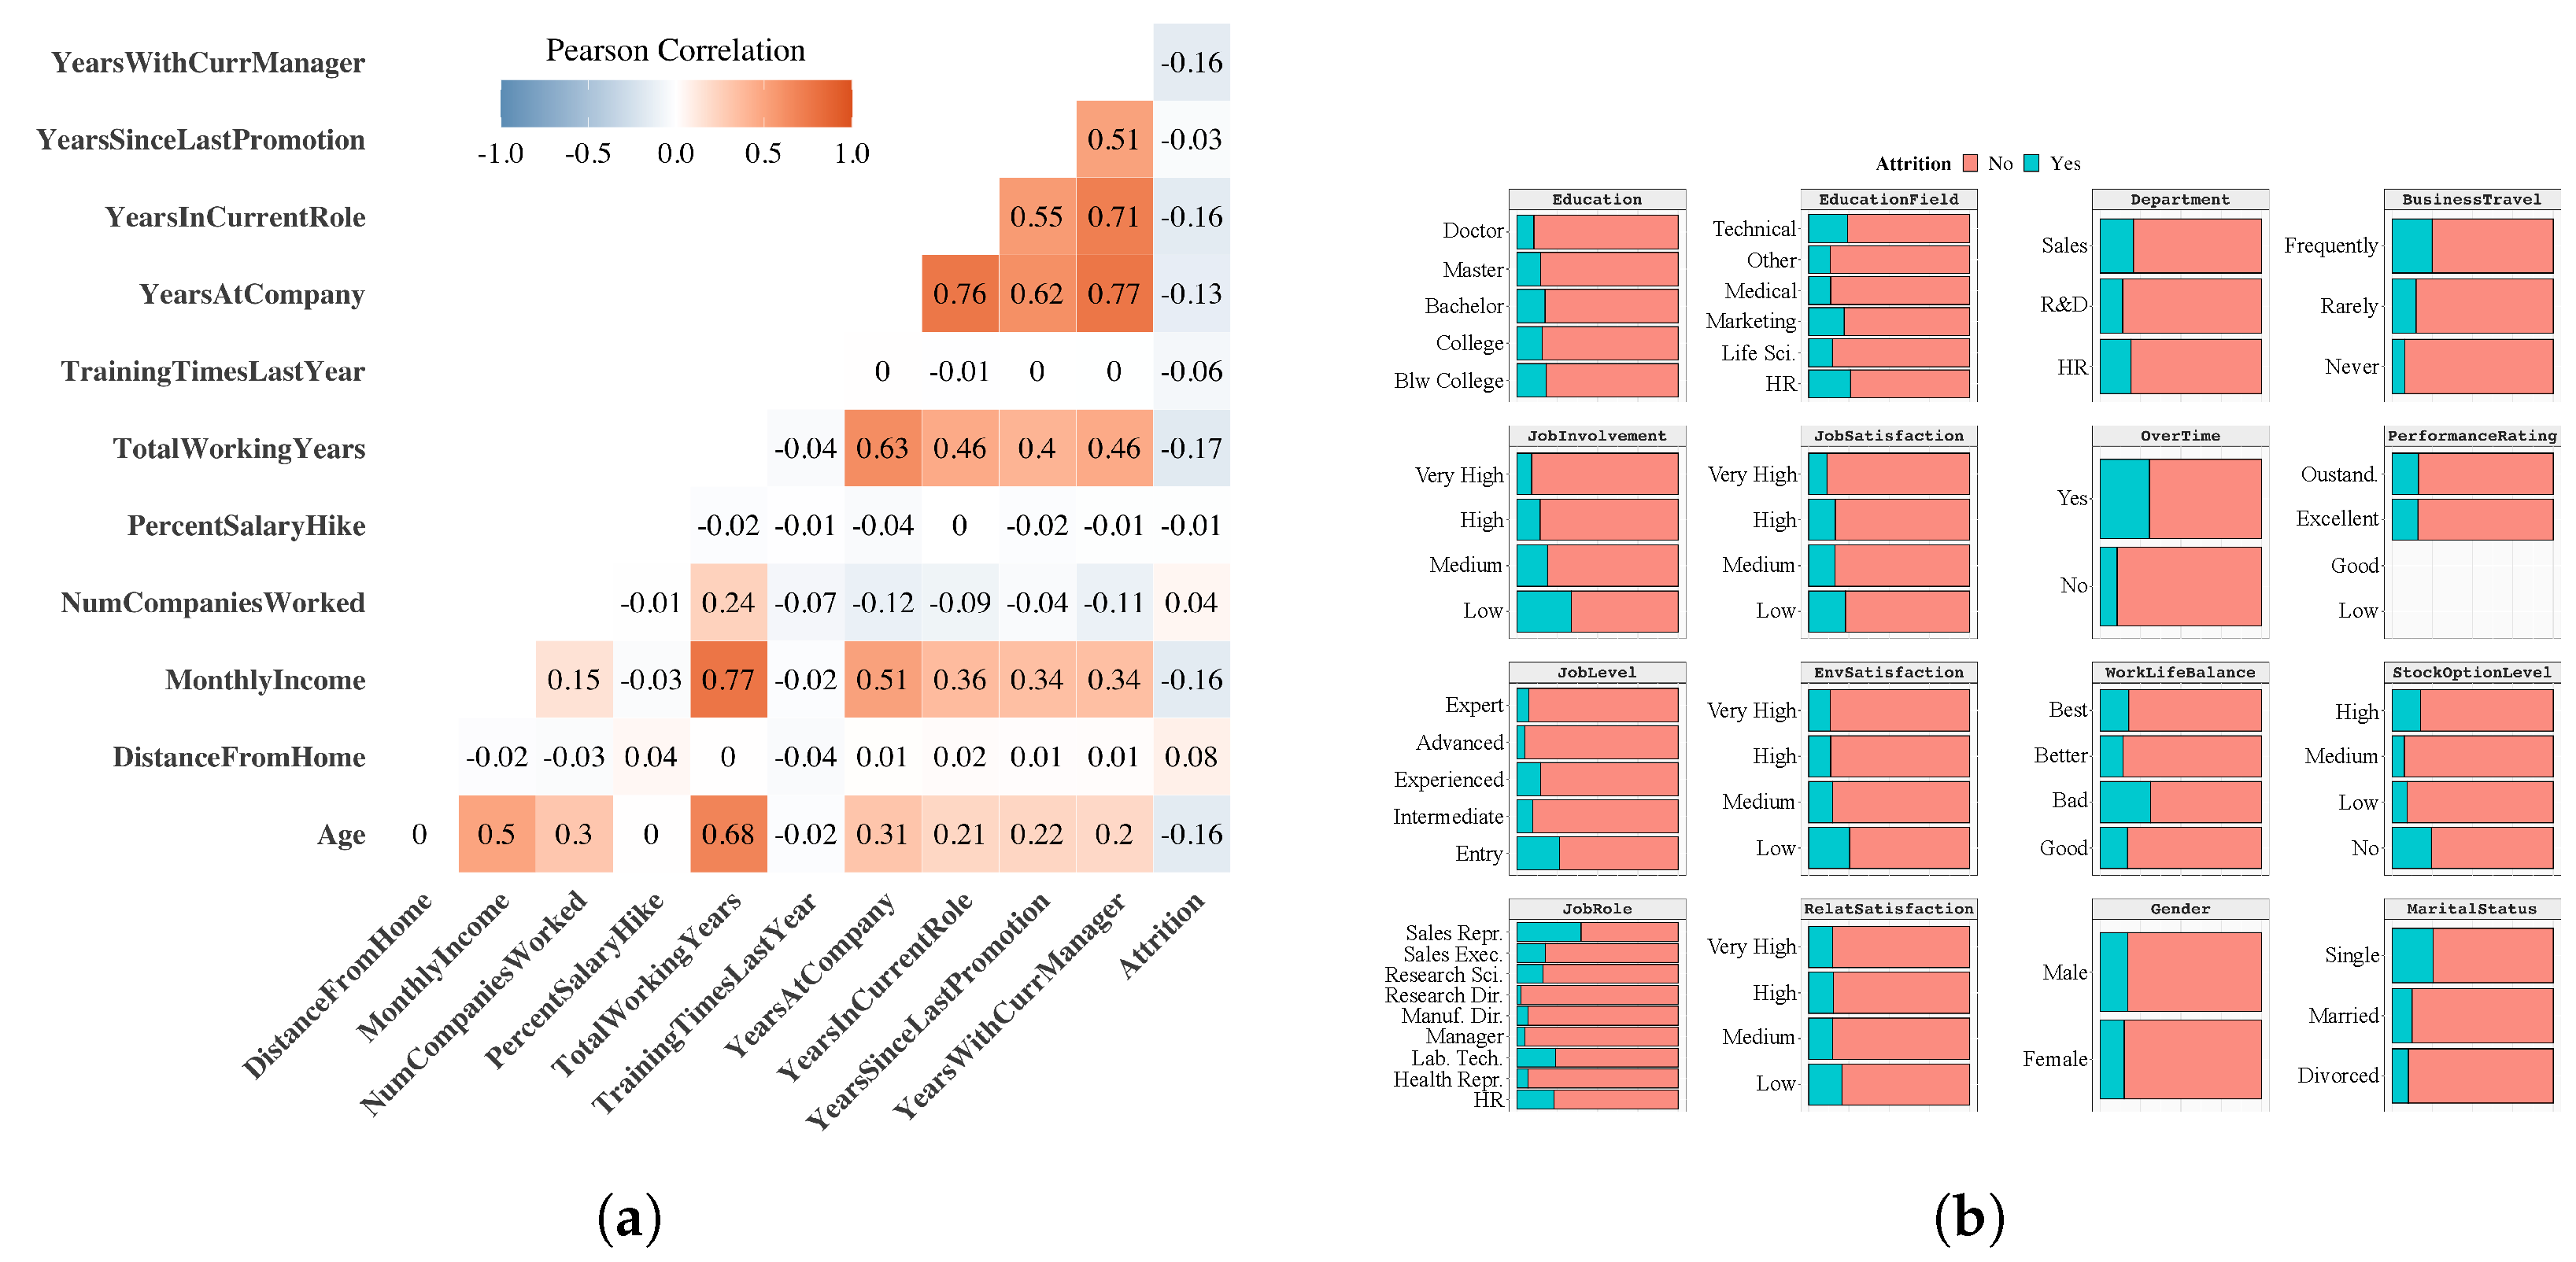
The IBM HR dataset [9] consists of 1470 observations, and 34 features related to working life and personal information of the employees, together with the binary target variable Attrition (“Yes” employees who left the company, “No” otherwise). No missing values are present (being the dataset synthetic). The dataset is heavily imbalanced, with of the observations with label 0. Table 1 lists the features that have been kept after our data exploration analysis and feature selection process. In Figure 2a we report the Pearson’s Correlation Coefficient [24]. It is particularly interesting to note that the target variable “Attrition” is negatively correlated with many features that are related to some concept of “stability” of the employee within the company (e.g., years in the current role, total working years) and the employee’s age. On the other hand, the target variable is positively correlated with home-to-work distance and the number of companies where the employee has previously worked (“instability”).For categorical features we report the barplots with respect to the target variable (Figure 2b). This analysis highlights that a poor job involvement and low job duties, as well as a high number of overtime days and a bad work-life balance, are correlated with a higher risk of job quitting. The same can be said for specific roles (such as “sales representative”) and for those employees who are more likely to travel for work. In addition, single people have a higher probability of quitting with respect to married or divorced people.
Application of Machine Learning Methods
For each ML model (Section 2), we perform 5-folds cross-validation, and we evaluate the performance in terms of AUC-ROC [25], accuracy, and F-score on both the training and the test set. In particular, we focus on AUC-ROC as the primary measure of performance as it highlights the diagnostic ability of a binary classifier as the discrimination cutoff changes. In contrast, accuracy and F-score are indicators of classification ability with a fixed cutoff (=0.5). When dealing with unbalanced dataset, as it is the case of this work, accuracy is not always a correct indicator. Therefore, the use of other metrics such as the F-score is recommended, since it makes it possible to take into account not only the number of prediction errors made by the model, but also the type of error (false positives, false negatives). Moreover, the use of different metrics (including AUC-ROC), allows for a more complete and structured analysis even in the case of an unbalanced dataset. It is worth noting that for all the models, except CT and the RF, the numerical features of the dataset have been normalized with min-max normalization [26] between .
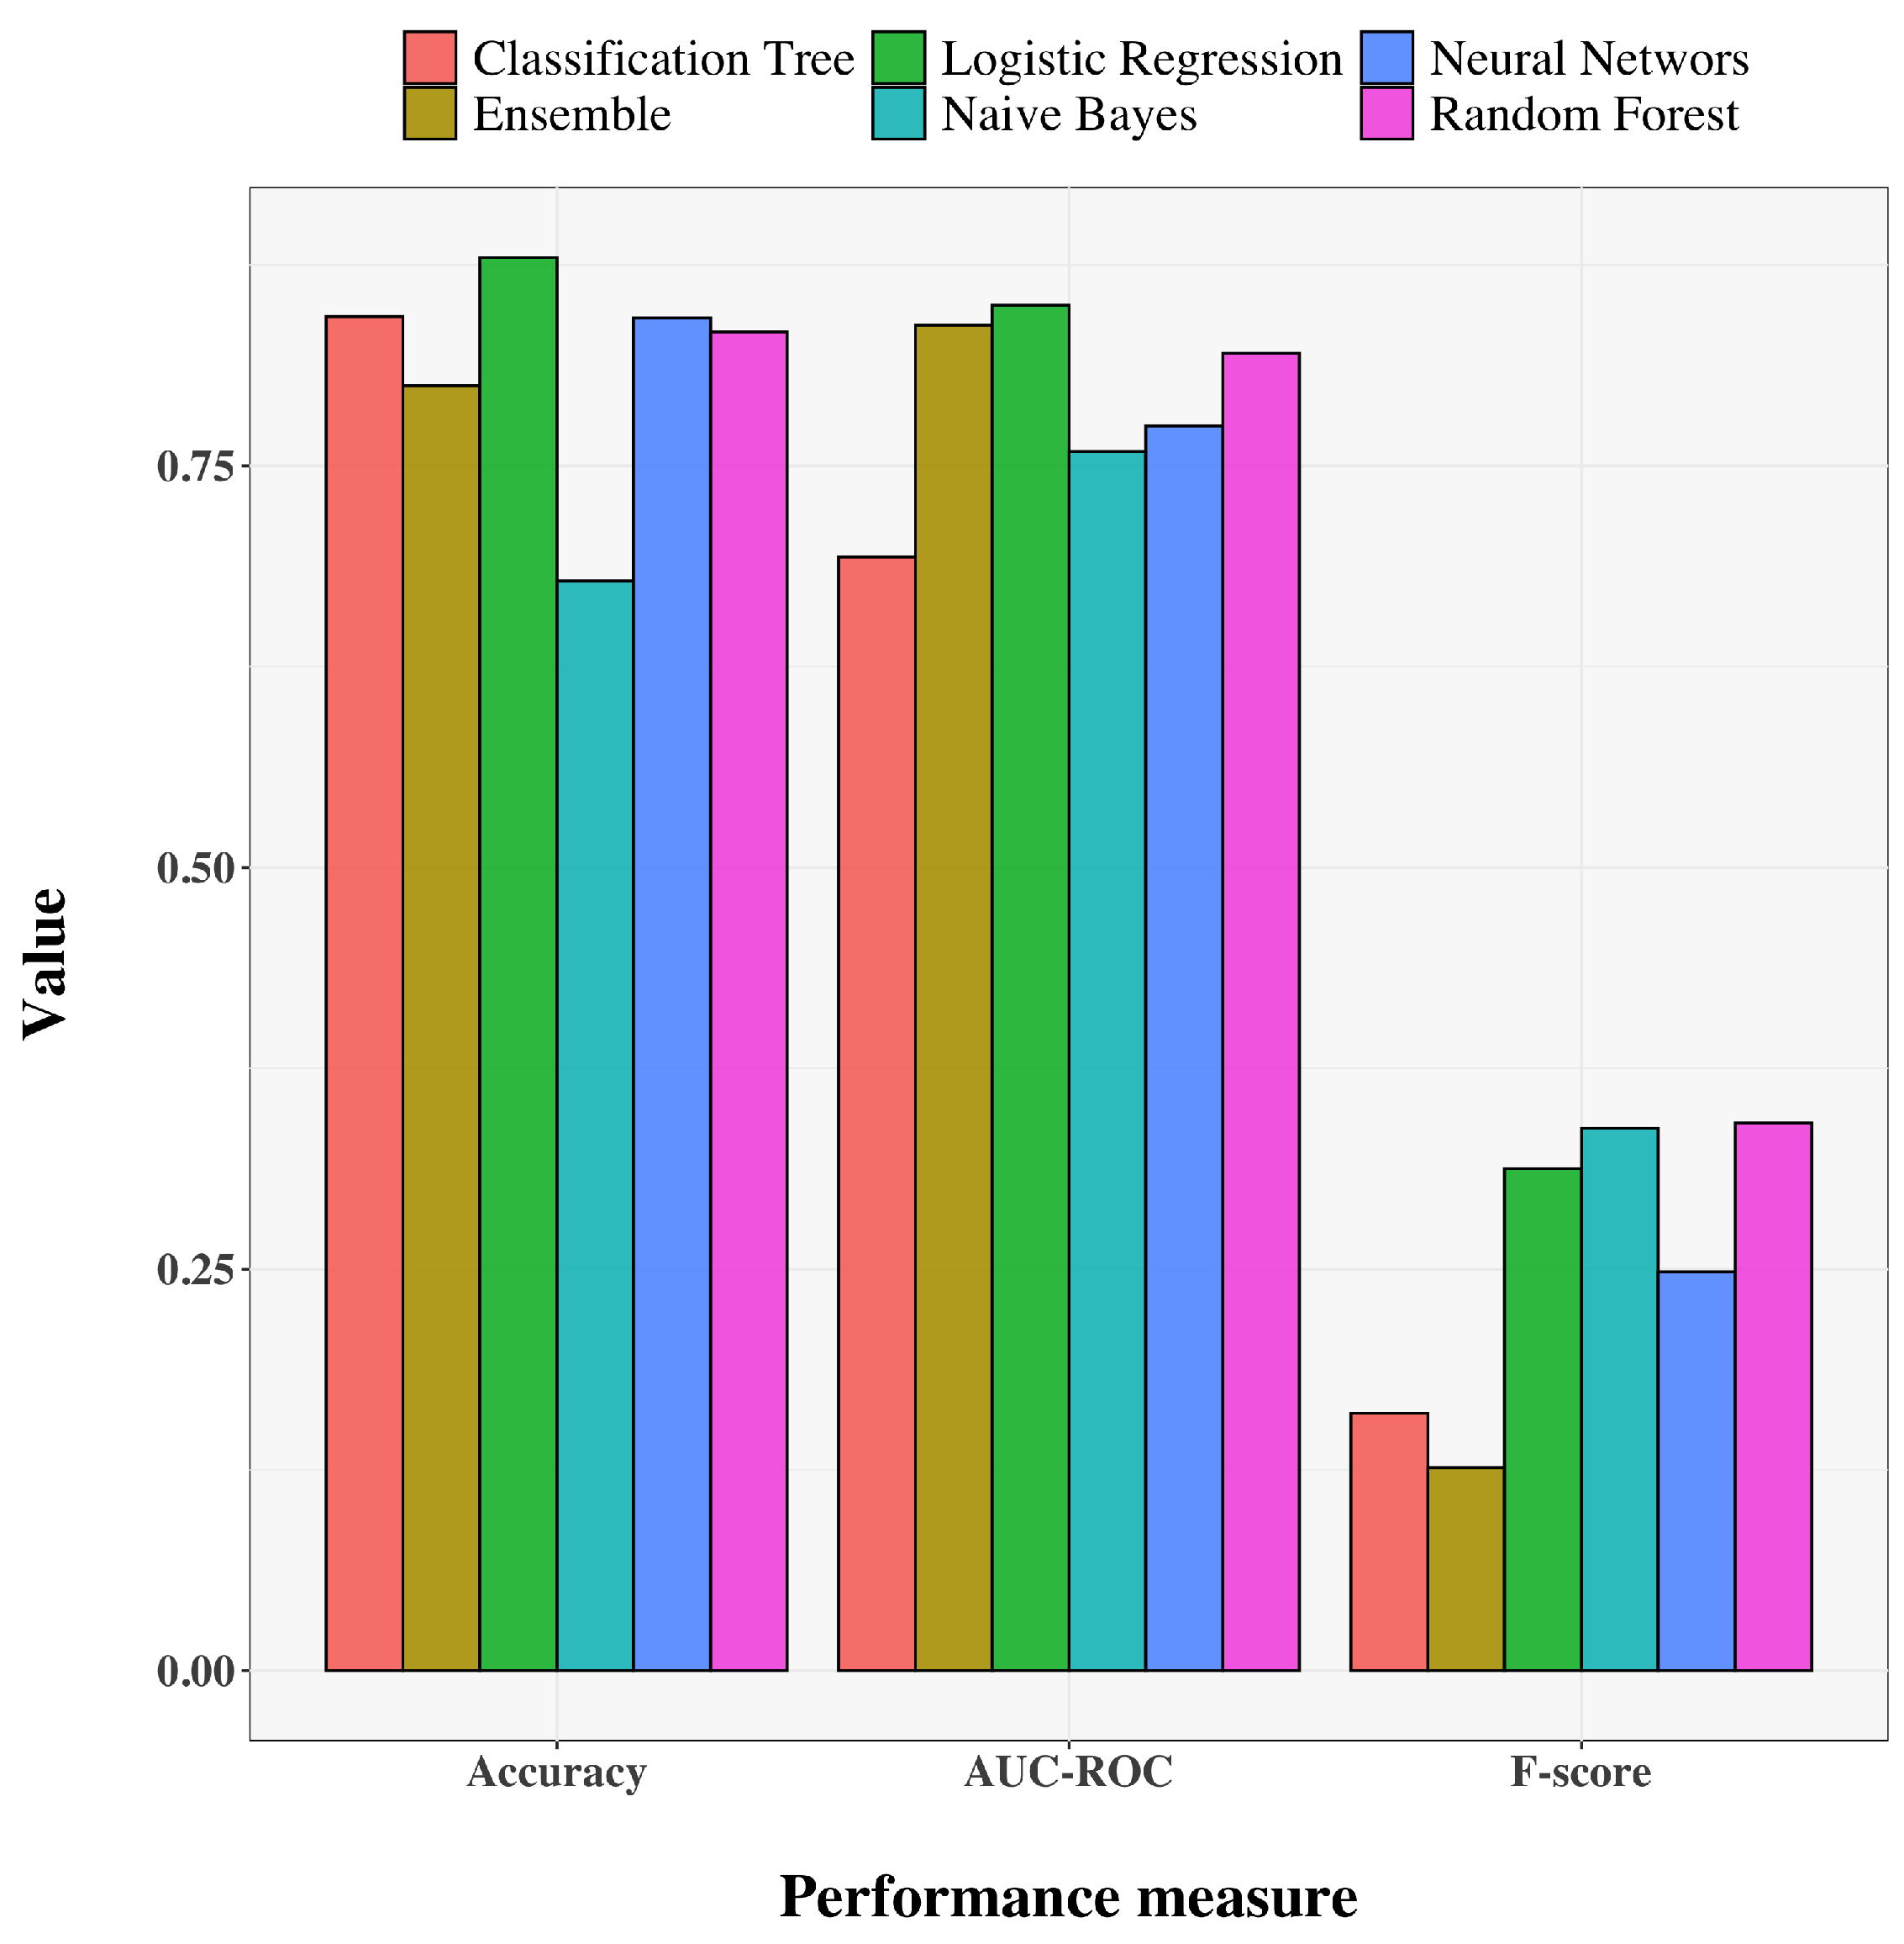
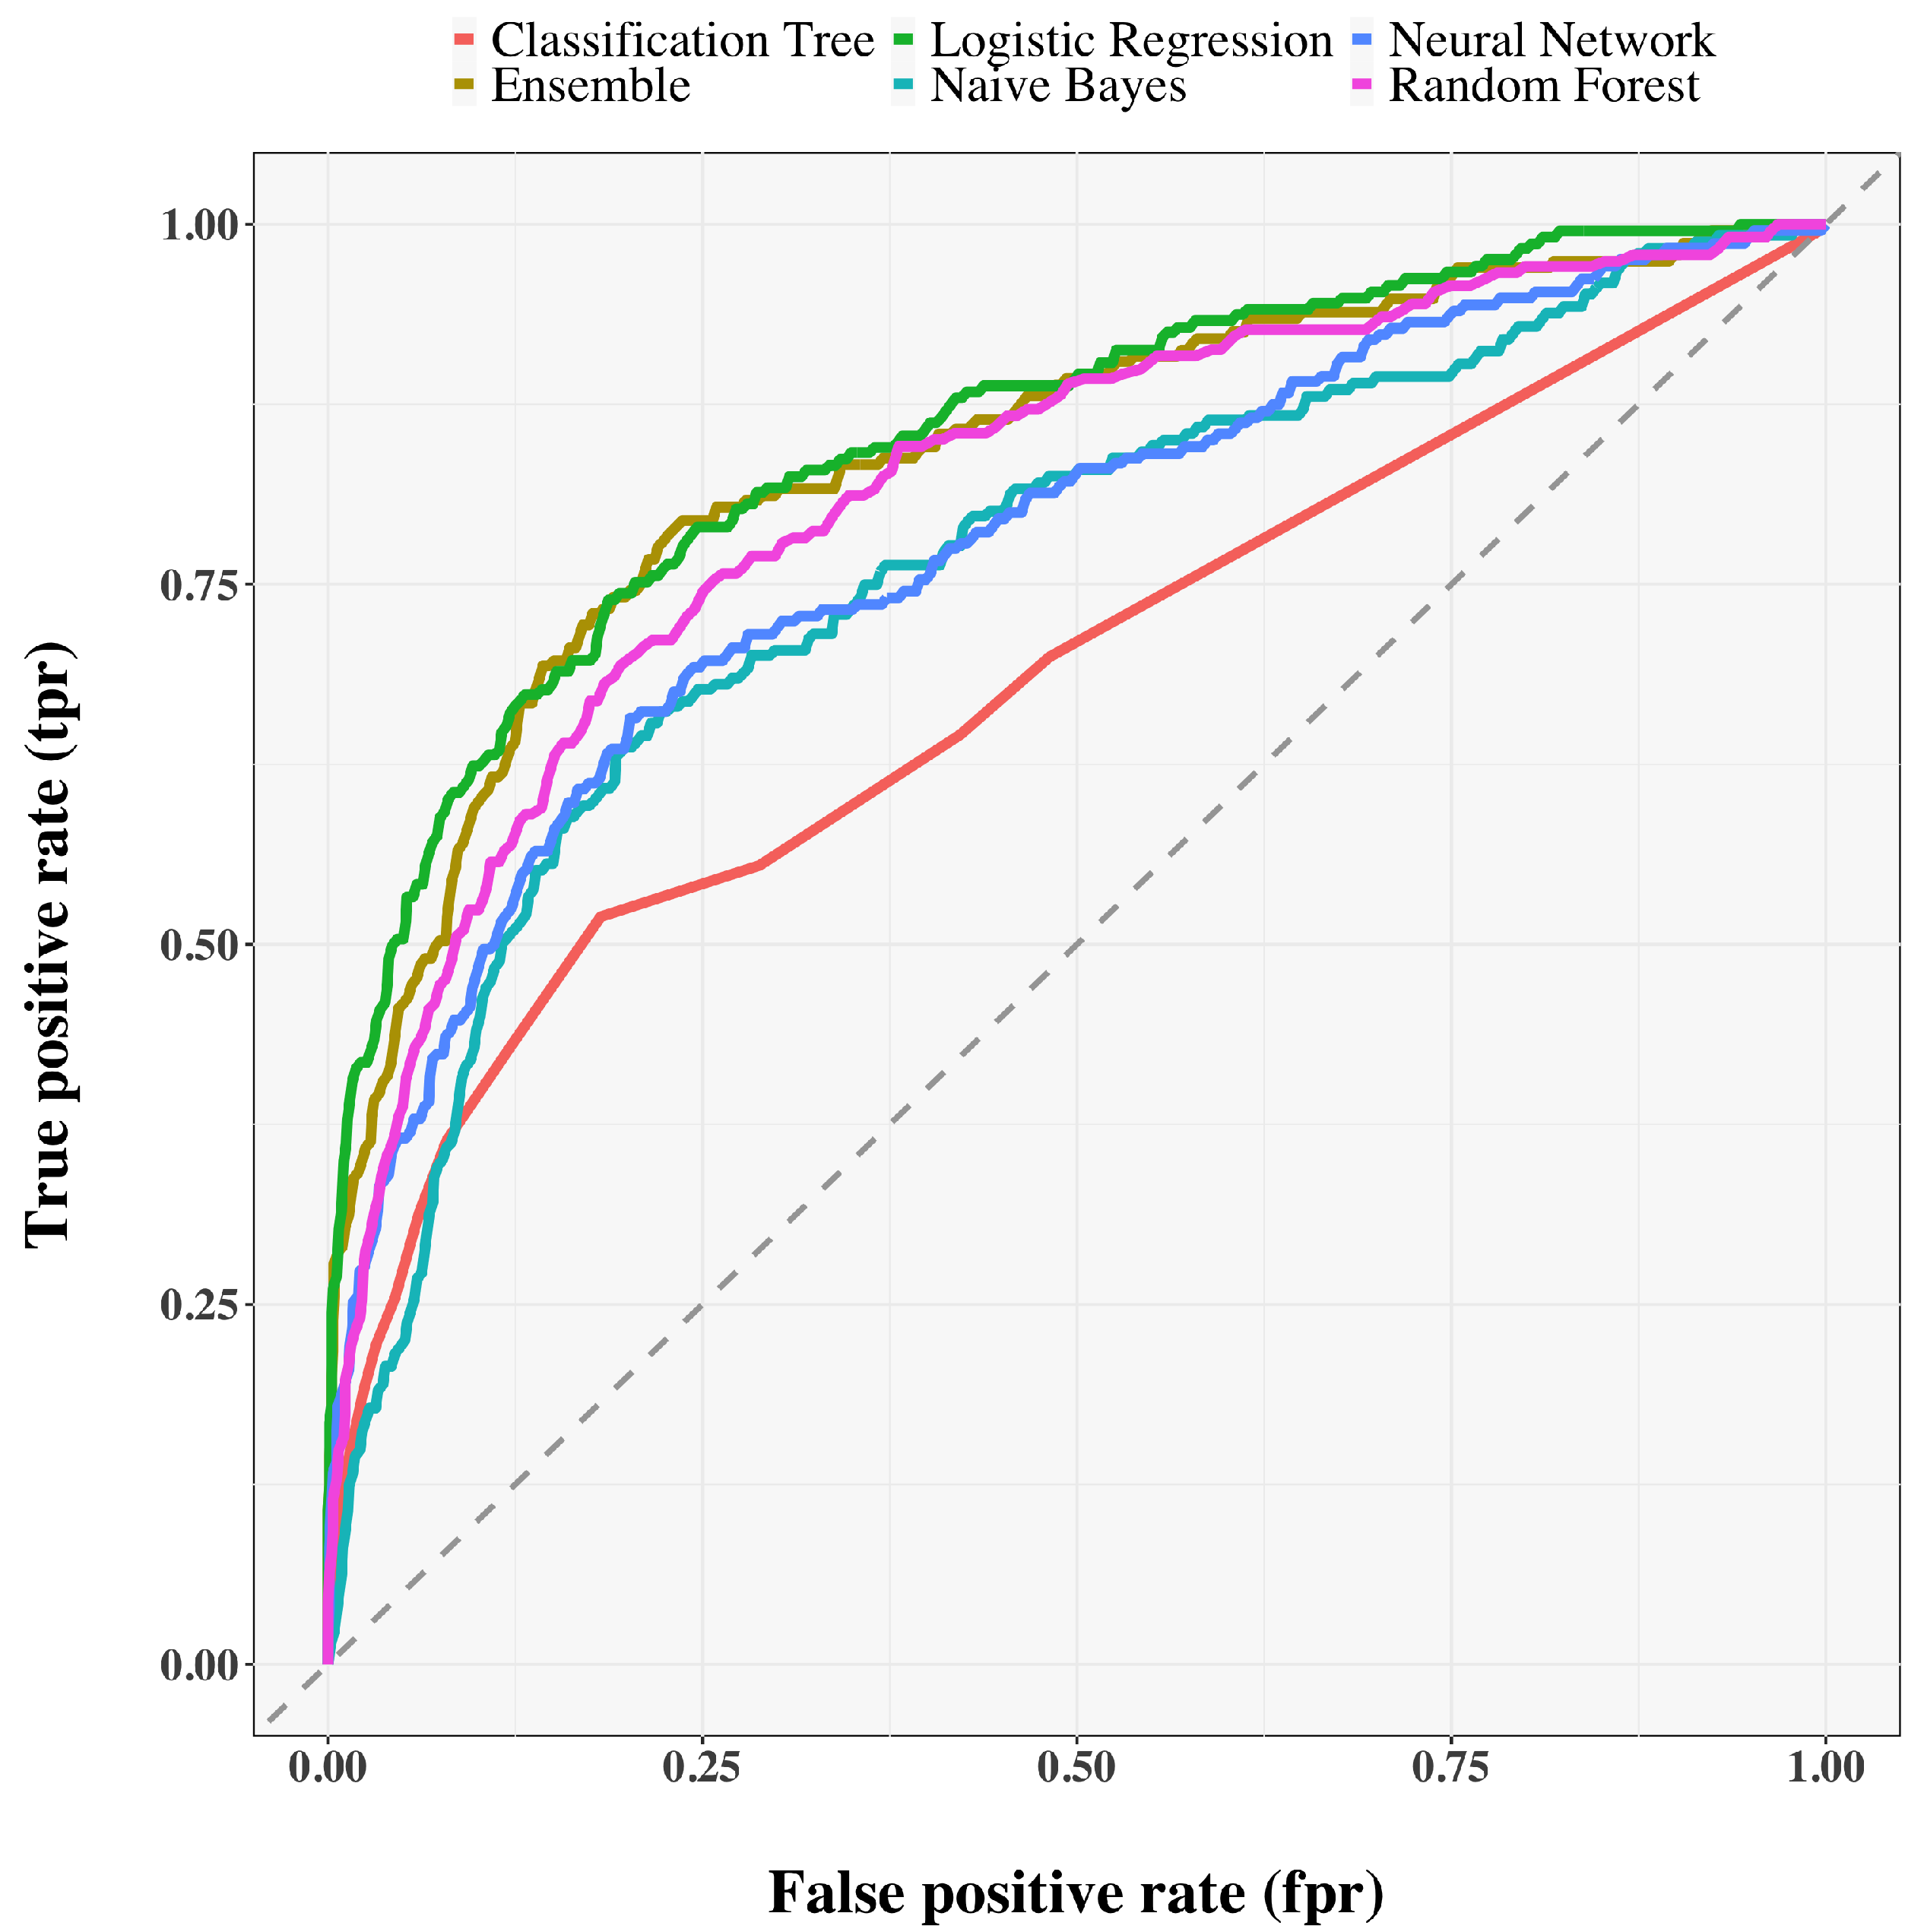
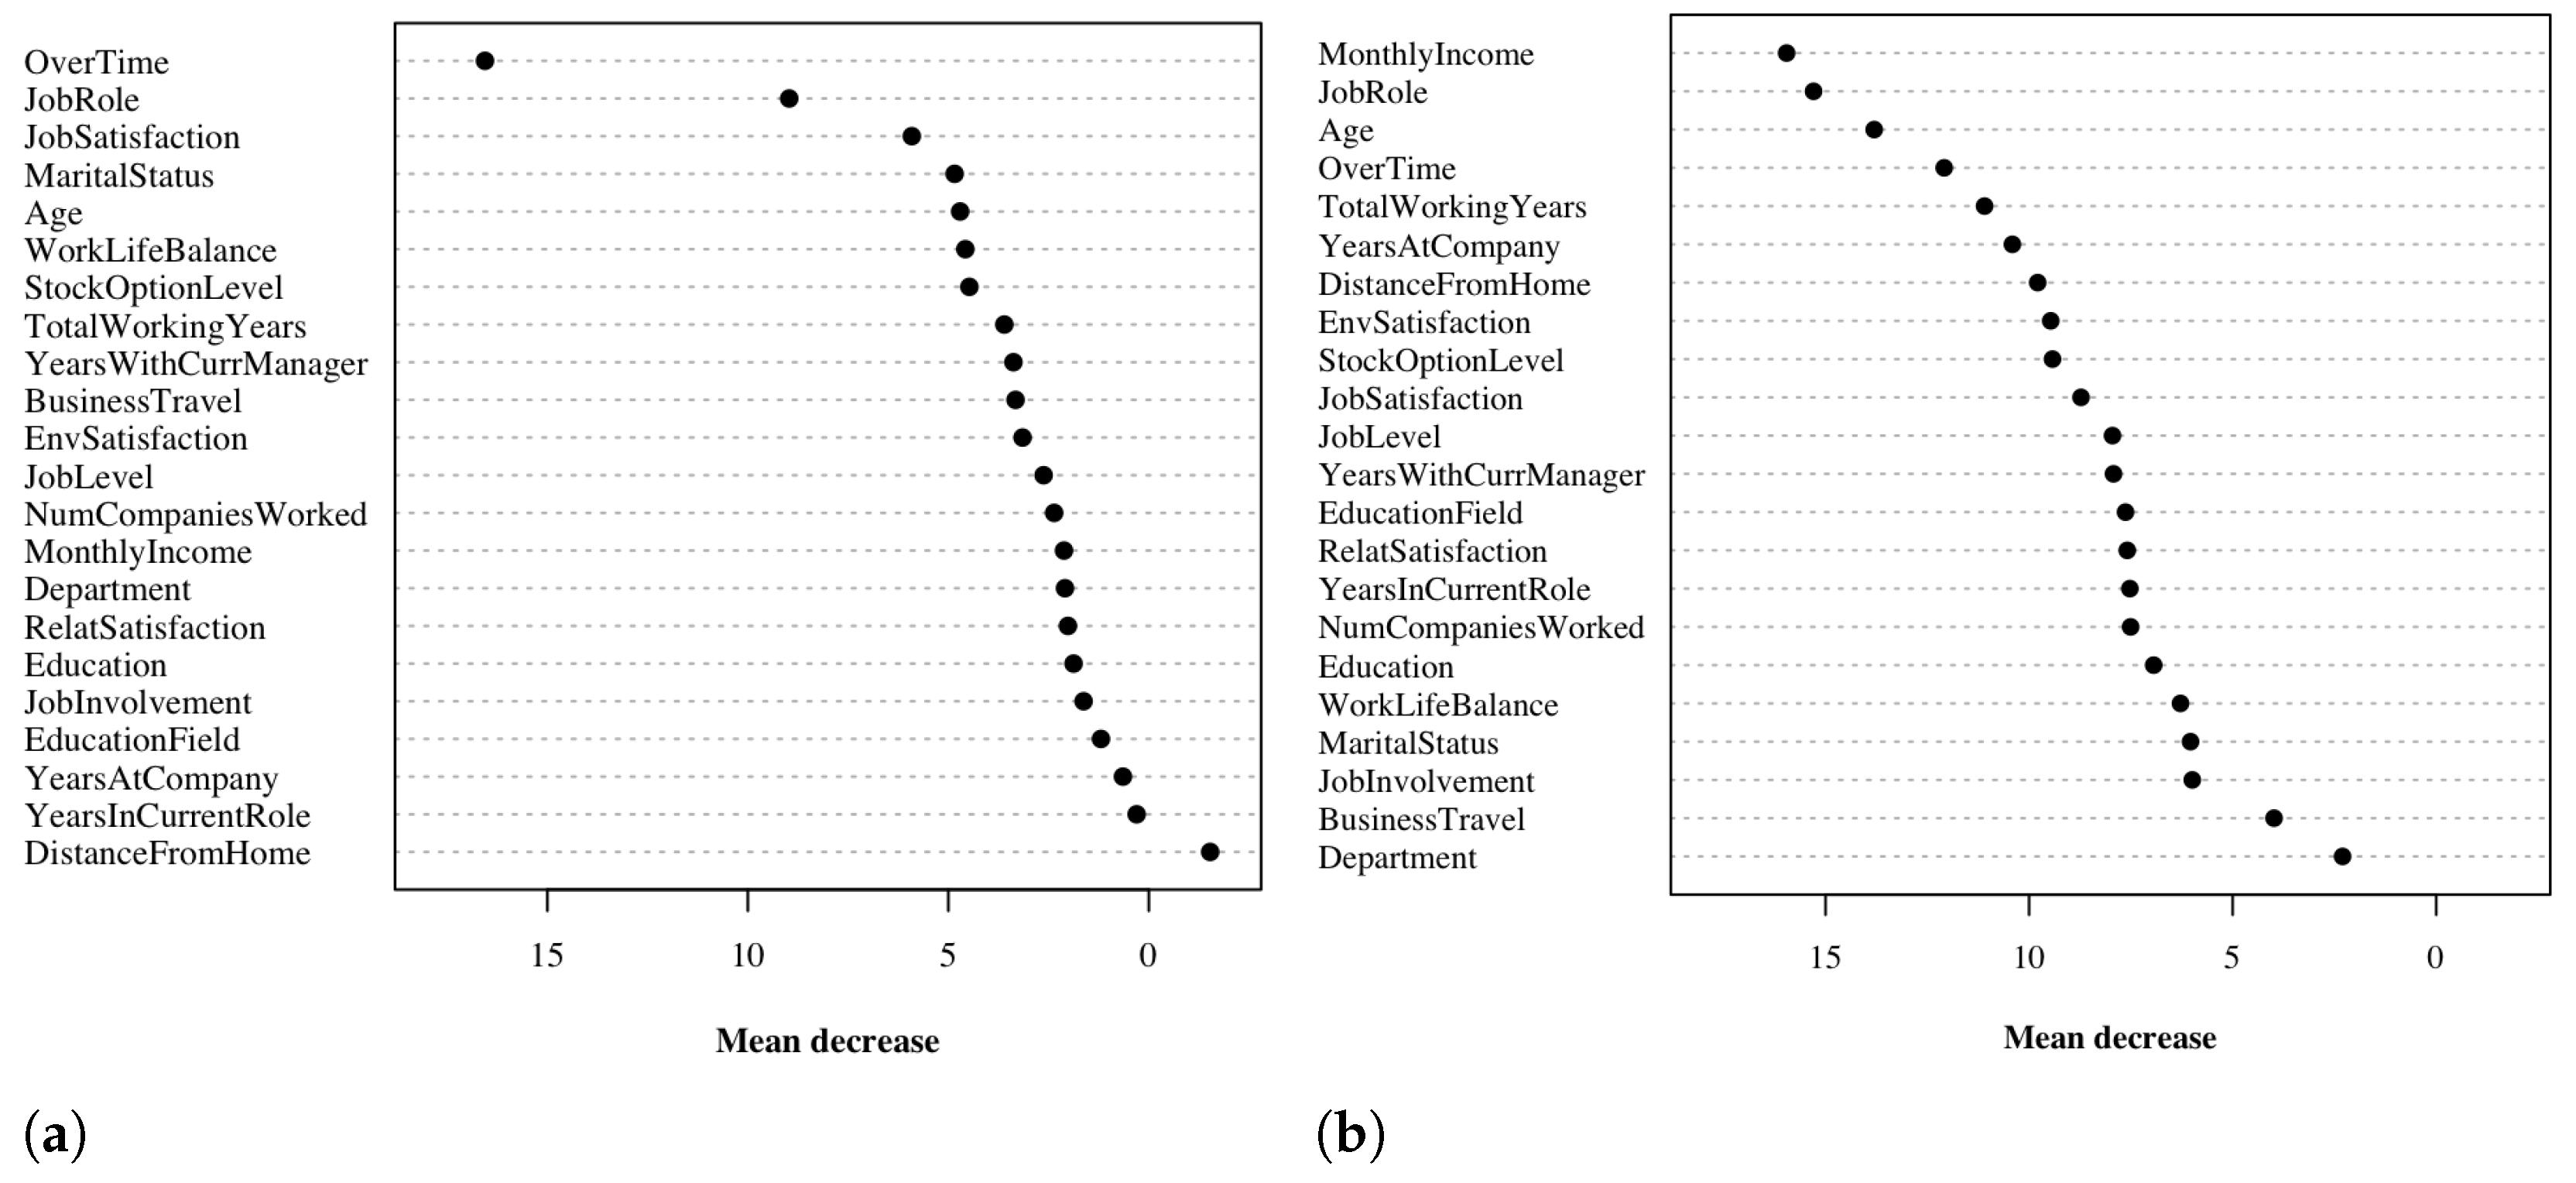
Table 2 and Figure 3 and Figure 4 show a summary of the results of the selected models. For training results, we only report accuracy. LR and RF perform best in terms of AUC-ROC and also have reasonably high accuracy and F-score. NB, while having the best F-score, has a very low accuracy. Similarly, CT is good in terms of accuracy but has serious shortcomings when evaluated by F-score. The NN shows moderately good performance, but still not as good as that shown by LR and RF. It is worth noting that the ensemble method suffers greatly in terms of F-score, so we exclude it from our analysis. The poor F-score performance of each method reflects the imbalance of the dataset. In terms of explainability of results, LR and RF also allow us to assess the importance of features for model predictions. Figure 5 shows how each variable affects the performance of the RF model in terms of the average decrease in accuracy (Figure 5a), and Gini index (Figure 5b) for a fixed cutoff of 0.5. The figure is reported with the main purpose of showing how some features have a greater influence on decreasing performance than others. A similar result is obtained by the analysis of the coefficients assigned to each variable in the LR model For what concerns LR, the model seems to suggest that the employees which are likely to quit are those who: have low satisfaction with the work environment, relationships with colleagues, and their work in general, are experienced in their job, travel frequently, work overtime, have worked at a fair number of companies previously and work far from home. Features importance is not straightforward for what concerns neural networks, which are regarded as a black-box approach [27], that is, the process leading to the final prediction is hidden from the user. Enabling the interpretability of the output of a neural network is still an open research problem [28,29,30]. Therefore, the use of LR and RF not only allows for improved, data-driven decision making, but also for plausible explanations of the decisions. The latter reason is particularly important in critical real-world scenarios, where the fairness and reliability of the results are crucial.
4. Discussion
We aim at answering the following research questions:
(i) Which employees are at risk of quitting?
(ii) What are the main causes of employee attrition?
The first question can be formulated in terms of AUC-ROC, accuracy and F-score performance metrics.
Our results show that LR and RF models are the most promising in terms of the performance metrics considered. The second question can be answered by performing a bivariate or multivariate analysis on the dataset, and also by using methods such as LR and RF that offer useful insight about the variables that play an important role on the prediction of employee attrition. Our results show that high home-to-work distance, low salary, low involvement in work, poor work-life balance, and, in general, low satisfaction with the work environment are among the main causes of quitting. On the other hand, employees who demonstrate stability (high number of years in the same company, higher age) are more likely to remain. For what concerns the knowledge contribution brought to the community through our study is therefore manifold. We in fact provided a comparative set of ML models which can be used for the purpose of employee attrition prediction, releasing our code, and providing also a computation environment on which experimental (and not synthetic) datasets could be tested.
5. Conclusions
Employee attrition is a critical problem for several companies. In this paper we approach this issue through the use of data exploration techniques, and five machine learning models trained on the IBM HR Analysis Employee Attrition dataset [9]. In our paper we show how machine learning models can indeed play a crucial role as decision support systems, identifying the best decisions to be made and providing data-motivated explanations. As further work we will employ data augmentation techniques for dealing with the dataset imbalance. Furthermore, we plan to use more advanced deep learning methods, such as graph neural networks (GNNs) [31,32], to handle interactions between employees based on the hypothesis of homophily, that is, employees who are “closer” to each other are more likely to behave similarly. GNNs have been used in several real-world applications when there exists a relational structure between the entities under consideration [33,34]. In addition, the collection of a dataset with a larger number of observations, further features, and—possibly—a relational structure could certainly lead to obtaining better results. Nonetheless applications of machine learning for predicting employee attrition could play a fundamental role in the context of managerial decisions. Companies could in fact decide to take actions for presenting new working opportunities as well as modifying negative working conditions, towards the idea of reducing employees’ turnovers.
Author Contributions
Conceptualization, F.G. and G.M.D.; methodology, F.G. and G.M.D.; software, F.G.; validation, F.G. and G.M.D.; writing and review, F.G. and G.M.D.; supervision, G.M.D. All authors have read and agreed to the published version of the manuscript.
Funding
This research received no external funding.
Institutional Review Board Statement
Not applicable.
Informed Consent Statement
Not applicable.
Data Availability Statement
Not applicable.
Conflicts of Interest
The authors declare no conflict of interest.
Abbreviations
The following abbreviations are used in this manuscript:
| ML | Machine Learning |
| LR | Logistic Regression |
| CT | Classification Trees |
| RF | Random Forest |
| MLP | Multilayer Perceptron |
| NN | Neural Networks |
References
- Society for Human Resource Management. Human Capital Benchmarking Report; Technical Report; Society for Human Resource Management: Alexandria, VA, USA, 2016. [Google Scholar]
- Ongori, H. A review of the literature on employee turnover. Afr. J. Bus. Manag. 2007, 1, 49–54. [Google Scholar]
- Bennett, N.; Blum, T.C.; Long, R.G.; Roman, P.M. A firm-level analysis of employee attrition. Group Organ. Manag. 1993, 18, 482–499. [Google Scholar] [CrossRef]
- Alao, D.; Adeyemo, A. Analyzing Employee Attrition using Decision Tree Algorithms. Comput. Inf. Syst. Dev. Informatics Allied Res. J. 2013, 4, 17–28. [Google Scholar]
- Punnoose, R.; Ajit, P. Prediction of Employee Turnover in Organizations using Machine Learning Algorithms. Int. J. Adv. Res. Artif. Intell. 2016, 5. [Google Scholar] [CrossRef] [Green Version]
- Frye, A.; Boomhower, C.; Smith, M.; Vitovsky, L.; Fabricant, S. Employee Attrition: What Makes an Employee Quit? SMU Data Sci. Rev. 2018, 1, 9. [Google Scholar]
- Fallucchi, F.; Coladangelo, M.; Giuliano, R.; William De Luca, E. Predicting Employee Attrition Using Machine Learning Techniques. Computers 2020, 9, 86. [Google Scholar] [CrossRef]
- Alduayj, S.S.; Rajpoot, K. Predicting Employee Attrition using Machine Learning. In Proceedings of the 2018 International Conference on Innovations in Information Technology (IIT), Al Ain, United Arab Emirates, 18–19 November 2018; pp. 93–98. [Google Scholar]
- IBM. IBM HR Analytics Employee Attrition & Performance; Kaggle: San Francisco, CA, USA, 2017. [Google Scholar]
- LeCun, Y.; Bengio, Y.; Hinton, G. Deep learning. Nature 2015, 521, 436–444. [Google Scholar] [CrossRef]
- Bianchini, M.; Dimitri, G.M.; Maggini, M.; Scarselli , F. Deep neural networks for structured data. In Computational Intelligence for Pattern Recognition; Springer: Berlin/Heidelberg, Germany, 2018; pp. 29–51. [Google Scholar]
- Spiga, O.; Cicaloni, V.; Dimitri, G.M.; Pettini, F.; Braconi, D.; Bernini, A.; Santucci, A. Machine learning application for patient stratification and phenotype/genotype investigation in a rare disease. Briefings Bioinform. 2021, 22, 434. [Google Scholar] [CrossRef]
- Dimitri, G.M.; Spasov, S.; Duggento, A.; Passamonti, L.; Lió, P.; Toschi, N. Multimodal and multicontrast image fusion via deep generative models. Inf. Fusion 2022, 88, 146–160. [Google Scholar] [CrossRef]
- Pirazzini, C.; Azevedo, T.; Baldelli, L.; Bartoletti-Stella, A.; Calandra-Buonaura, G.; Molin, A.D.; Dimitri, G.M.; Doykov, I.; Gómez-Garre, P.; Hägg, S.; et al. A geroscience approach for Parkinson’s disease: Conceptual framework and design of PROPAG-AGEING project. Mech. Ageing Dev. 2021, 194, 111426. [Google Scholar] [CrossRef]
- Vercellis, C. Business Intelligence: Data Mining and Optimization for Decision Making; Wiley: Chichester, UK, 2009. [Google Scholar]
- Hosmer, D.W., Jr.; Lemeshow, S.; Sturdivant, R.X. Applied Logistic Regression; John Wiley & Sons: New York, NY, USA, 2013; Volume 398. [Google Scholar]
- Breiman, L.; Friedman, J.H.; Olshen, R.A.; Stone, C.J. Classification and Regression Trees; Routledge: London, UK, 1984. [Google Scholar]
- Breiman, L. Random Forests. Mach. Learn. 2001, 45, 5–32. [Google Scholar] [CrossRef] [Green Version]
- Rish, I. An empirical study of the naive Bayes classifier. In Proceedings of the IJCAI 2001 Workshop on Empirical Methods in Artificial Intelligence, Seattle, WA, USA, 4–10 August 2001; pp. 41–46. [Google Scholar]
- Dietterich, T.G. Ensemble methods in machine learning. In Proceedings of the International Workshop on Multiple Classifier Systems, Cambridge, UK, 21–23 June 2000; pp. 1–15. [Google Scholar]
- Costa, C.J.; Aparicio, J.T. POST-DS: A methodology to boost data science. In Proceedings of the 2020 15th Iberian Conference on Information Systems and Technologies (CISTI), Sevilla, Spain, 24–27 June 2020; pp. 1–6. [Google Scholar]
- Wiemer, H.; Drowatzky, L.; Ihlenfeldt, S. Data mining methodology for engineering applications (DMME)—A holistic extension to the CRISP-DM model. Appl. Sci. 2019, 9, 2407. [Google Scholar] [CrossRef] [Green Version]
- Shearer, C. The CRISP-DM model: The new blueprint for data mining. J. Data Warehous. 2000, 5, 13–22. [Google Scholar]
- Benesty, J.; Chen, J.; Huang, Y.; Cohen, I. Pearson Correlation Coefficient. In Noise Reduction in Speech Processing; Springer: Berlin/Heidelberg, Germany, 2009; pp. 1–4. [Google Scholar]
- Fawcett, T. An introduction to ROC analysis. Pattern Recognit. Lett. 2006, 27, 861–874. [Google Scholar] [CrossRef]
- Patro, S.G.K.; Sahu, K.K. Normalization: A Preprocessing Stage. CoRR 2015. [Google Scholar] [CrossRef]
- Buhrmester, V.; Münch, D.; Arens, M. Analysis of explainers of black box deep neural networks for computer vision: A survey. Mach. Learn. Knowl. Extr. 2021, 3, 966–989. [Google Scholar] [CrossRef]
- Doshi-Velez, F.; Kim, B. Towards a rigorous science of interpretable machine learning. arXiv 2017, arXiv:1702.08608. [Google Scholar]
- Rudin, C. Stop explaining black box machine learning models for high stakes decisions and use interpretable models instead. Nat. Mach. Intell. 2019, 1, 206–215. [Google Scholar] [CrossRef] [Green Version]
- Angelov, P.; Soares, E. Towards explainable deep neural networks (xDNN). Neural Netw. 2020, 130, 185–194. [Google Scholar] [CrossRef]
- Scarselli, F.; Gori, M.; Tsoi, A.C.; Hagenbuchner, M.; Monfardini, G. The graph neural network model. IEEE Trans. Neural Netw. 2008, 20, 61–80. [Google Scholar] [CrossRef] [Green Version]
- Gilmer, J.; Schoenholz, S.S.; Riley, P.F.; Vinyals, O.; Dahl, G.E. Neural message passing for quantum chemistry. In Proceedings of the International Conference on Machine Learning, PMLR, Sydney, Australia, 6–11 August 2017; pp. 1263–1272. [Google Scholar]
- Guerranti, F.; Mannino, M.; Baccini, F.; Bongini, P.; Pancino, N.; Visibelli, A.; Marziali, S. CaregiverMatcher: Graph Neural Networks for Connecting Caregivers of Rare Disease Patients. Procedia Comput. Sci. 2021, 192, 1696–1704. [Google Scholar] [CrossRef]
- Kosasih, E.E.; Brintrup, A. A machine learning approach for predicting hidden links in supply chain with graph neural networks. Int. J. Prod. Res. 2022, 60, 5380–5393. [Google Scholar] [CrossRef]
Figure 1.
Image representing the experimental workflow implemented in our paper.

Figure 2.
Exploratory analysisfor numerical and categorical features. (a) Correlation matrix of numerical features. (b) Barplots of categorical features by target.
Figure 2.
Exploratory analysisfor numerical and categorical features. (a) Correlation matrix of numerical features. (b) Barplots of categorical features by target.

Figure 3.
Barplots of the results of the models.

Figure 4.
Barplots and ROC curves for the selected models on test set.

Figure 5.
Variable importance by mean decrease in accuracy and Gini index for the Random Forest Model. The variables with higher values of mean decrease are the ones that impact the most the performance of the Random Forest model. Both the mean decrease in accuracy and the mean decrease in the Gini index are shown with a cutoff of 0.5. (a) Mean decrease in accuracy. (b) Mean decrease in Gini index.


Table 1.
Dataset features after features selection. Features marked with † are categorical, while the others are numerical.
Table 1.
Dataset features after features selection. Features marked with † are categorical, while the others are numerical.
| Age | Job involvement † | Relationship satisfaction † |
| Attrition | Job level | Stock option level |
| Business travel | Job role | Total working years |
| Daily rate | Job satisfaction | Work life balance |
| Department | Marital status | Years at company |
| Distance from home | Monthly income | Years in current role |
| Environment satisfaction | Monthly rate | Years with current manager |
| Education | Number of previous companies | |
| Education field | Over time |
Table 2.
Performance of the models on the dataset [9]. Results reported as mean and standard deviation on 5-fold cross validation. Best in bold.
Table 2.
Performance of the models on the dataset [9]. Results reported as mean and standard deviation on 5-fold cross validation. Best in bold.
| Accuracy (Train) | Accuracy (Test) | F-Score (Test) | AUC-ROC (Test) | |
|---|---|---|---|---|
| LR | 89.86 ± 0.57 | 87.96 ± 1.84 | 31.26 ± 3.97 | 85.01 ± 1.92 |
| CT | 88.81 ± 0.04 | 84.29 ± 2.06 | 16.03 ± 3.33 | 69.33 ± 4.18 |
| RF | 96.11 ± 0.61 | 82.93 ± 2.47 | 33.13 ± 3.32 | 81.49 ± 3.06 |
| NB | 68.57 ± 0.76 | 67.82 ± 2.50 | 33.78 ± 2.70 | 75.90 ± 3.83 |
| NN | 98.91 ± 0.13 | 84.76 ± 2.27 | 26.12 ± 2.55 | 77.56 ± 1.66 |
| Ensemble | 86.09 ± 8.68 | 79.25 ± 2.43 | 12.22 ± 8.75 | 83.83 ± 1.91 |
Disclaimer/Publisher’s Note: The statements, opinions and data contained in all publications are solely those of the individual author(s) and contributor(s) and not of MDPI and/or the editor(s). MDPI and/or the editor(s) disclaim responsibility for any injury to people or property resulting from any ideas, methods, instructions or products referred to in the content. |
© 2022 by the authors. Licensee MDPI, Basel, Switzerland. This article is an open access article distributed under the terms and conditions of the Creative Commons Attribution (CC BY) license (https://creativecommons.org/licenses/by/4.0/).
Share and Cite
MDPI and ACS Style
Guerranti, F.; Dimitri, G.M. A Comparison of Machine Learning Approaches for Predicting Employee Attrition. Appl. Sci. 2023, 13, 267. https://0-doi-org.brum.beds.ac.uk/10.3390/app13010267
AMA Style
Guerranti F, Dimitri GM. A Comparison of Machine Learning Approaches for Predicting Employee Attrition. Applied Sciences. 2023; 13(1):267. https://0-doi-org.brum.beds.ac.uk/10.3390/app13010267
Chicago/Turabian StyleGuerranti, Filippo, and Giovanna Maria Dimitri. 2023. "A Comparison of Machine Learning Approaches for Predicting Employee Attrition" Applied Sciences 13, no. 1: 267. https://0-doi-org.brum.beds.ac.uk/10.3390/app13010267
Note that from the first issue of 2016, this journal uses article numbers instead of page numbers. See further details here.